Implementing the ACA: Medicaid Spending & Enrollment Growth for FY 2014 and FY 2015
Executive Summary
Medicaid spending and enrollment growth are affected by both the economy and policy decisions determining who is covered under the program, the services provided and payments for care. For more than a decade, economic conditions, including two major recessions, were the primary driver of changes in Medicaid spending and enrollment. In FY 2014 and in budgets adopted for FY 2015, enrollment and spending have grown with implementation of the major coverage provisions in the Affordable Care Act (ACA), including the federally financed Medicaid expansion. This report provides an overview of Medicaid spending and enrollment growth with a focus on state fiscal years 2014 and 2015 (FY 2014 and FY 2015) and an overview of Medicaid financing. Findings are based on interviews and data provided by state Medicaid directors as part of the 14th annual survey of Medicaid directors in all 50 states and the District of Columbia conducted by the Kaiser Commission on Medicaid and the Uninsured (KCMU) with Health Management Associates (HMA). Findings examine changes in overall enrollment and spending growth and compare expansion and non-expansion states.
All States
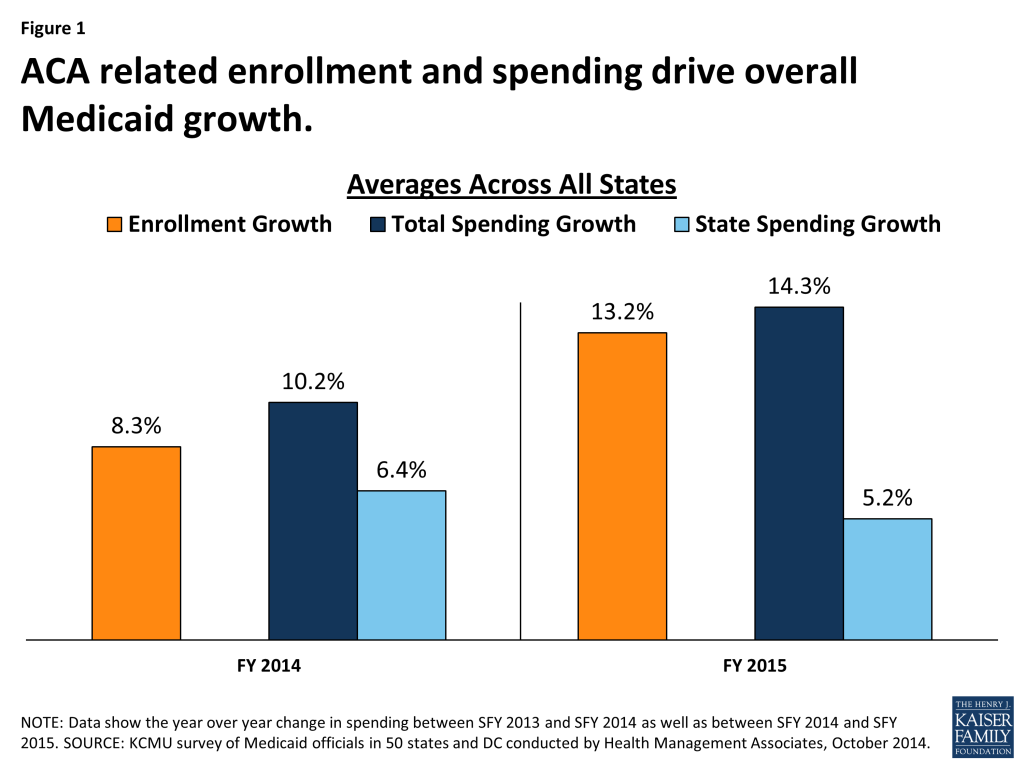
Implementation of the coverage expansions in the ACA are resulting in higher enrollment and total overall spending growth in Medicaid in FY 2014 and FY 2015. However, with full federal government financing of the Medicaid expansion population, state Medicaid spending is growing more slowly than total spending. In FY 2014, enrollment increased on average by 8.3 percent, faster than FY 2012 and FY 2013. Enrollment growth is due to the ACA expansions of coverage in states implementing the Medicaid expansion and increases in participation among individuals eligible under rules in place before the ACA across all states. Medicaid is jointly financed by states and the federal government. Based on a formula set in statute, the federal share ranges from a floor of 50 percent to a high of 73.6 percent in FFY 2015, with the federal government paying a higher share in poorer states. For states that implement the ACA Medicaid expansion up to 138 percent of poverty (a requirement that was effectively made optional by the Supreme Court decision) the federal government will pay 100 percent of the costs of those newly eligible from 2014-2016; that rate phases down to 90 percent in 2020 and beyond. In FY 2014, new coverage and spending at the enhanced match rate contributed to overall Medicaid spending growth of 10.2 percent, but resulted in slower state Medicaid spending across all states (6.4 percent). Total and state spending for Medicaid generally grow at similar rates when there are no changes in the federal match. The coverage provisions of the ACA went into effect in January 2014, mid-way through the state fiscal year which begins on July 1 in most states. The effect of the ACA is more pronounced in FY 2015 when the law is in effect for the entire state fiscal year. (Figure 1)
Expansion States
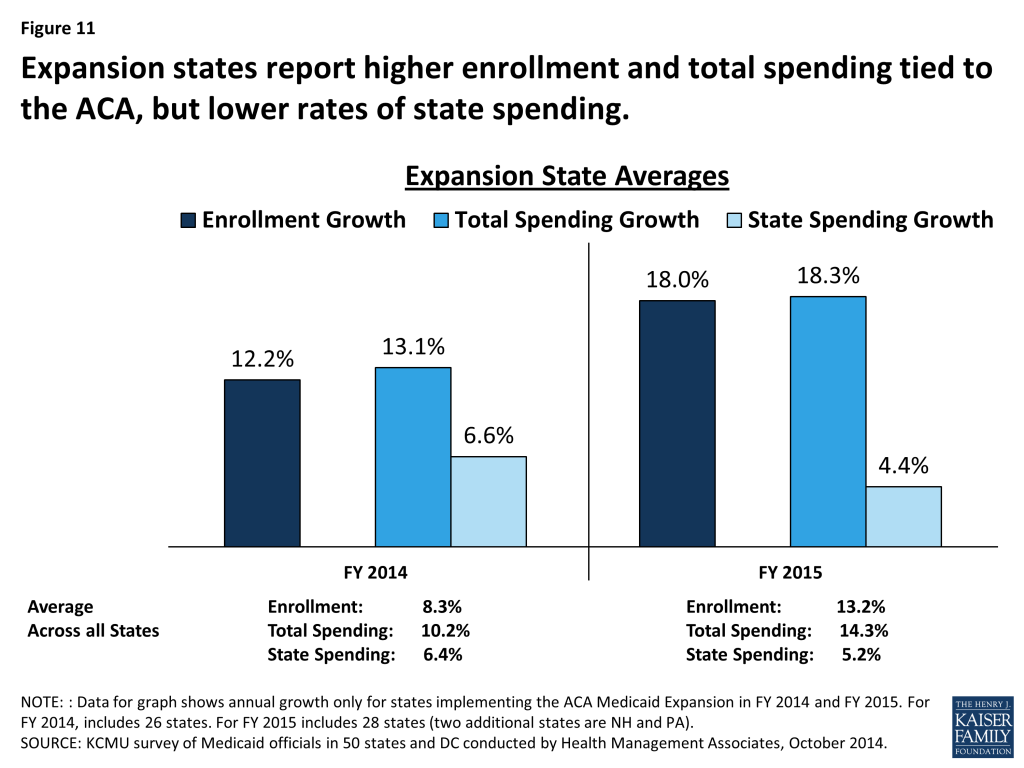
As anticipated, states implementing the Medicaid expansion are experiencing higher rates of enrollment growth and total spending growth in FY 2014 and FY 2015 due to higher coverage levels and access to enhanced federal matching funds. Across all states implementing the ACA Medicaid expansion in FY 2014 and FY 2015, enrollment growth averaged 12.2 percent and 18.0 percent, respectively, well above national averages. Expansion states also reported higher total spending growth relative to the national average in both years. The enhanced federal funds available to states implementing the Medicaid expansion results in large differences between total spending and state spending growth. The effects on enrollment and spending are more pronounced in FY 2015 when the ACA is in effect for the entire state fiscal year. In addition, the number of states implementing the Medicaid expansion increases from 26 to 28 as New Hampshire and Pennsylvania implement in FY 2015. (Figure 2)

Non-Expansion States
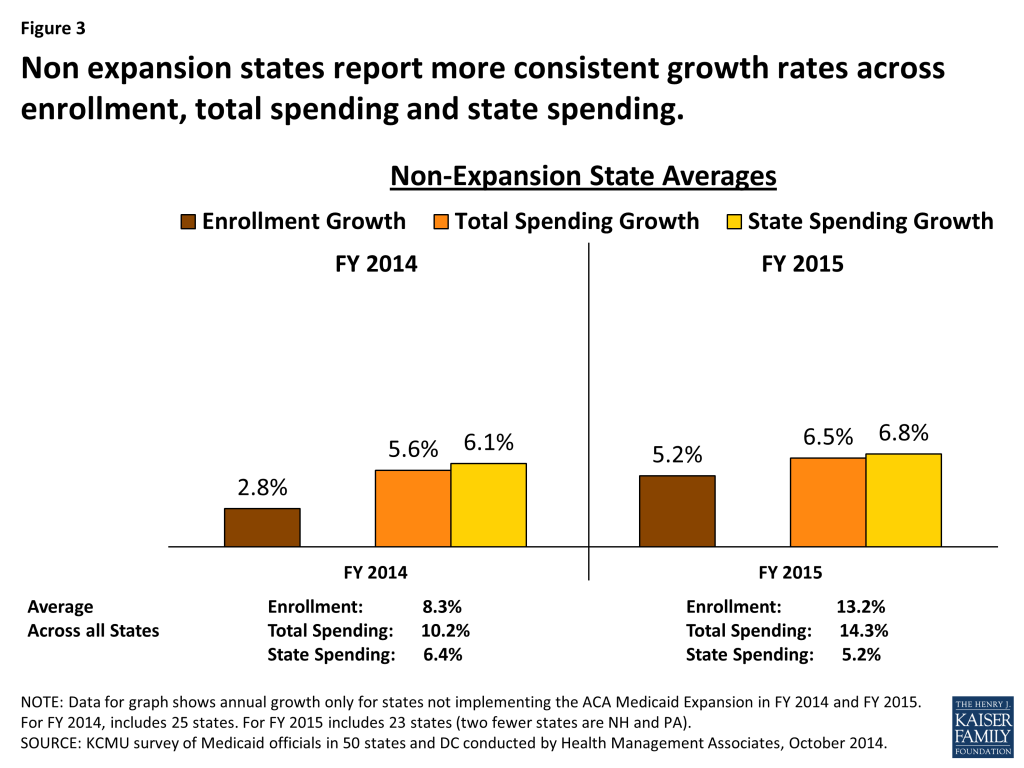
States not implementing the Medicaid expansion report lower enrollment growth compared to expansion states with total and state spending growing at similar rates. In FY 2014, across all states not implementing the ACA Medicaid expansion, enrollment growth averaged 2.8 percent. States reported that this relatively low rate of enrollment growth reflected an improving economy as well as processing backlogs due to problems with enrollment systems and account transfers. For FY 2015, enrollment growth is projected to average 5.2 percent across non-expansion states, as system issues are resolved and these states (like expansion states) experience increased participation among individuals eligible under pre-ACA rules. Without the effect of the enhanced ACA match rate, total and state spending on Medicaid are growing at similar rates in FY 2014 and FY 2015. (Figure 3)
Looking ahead beyond 2015. The economy, ACA implementation and other Medicaid policy changes (such as major payment and delivery system reform efforts) are expected to have a significant effect on Medicaid spending and enrollment trends across all states.
Issue Brief
Medicaid Enrollment and Spending Growth
Trends Affecting Medicaid Enrollment and Spending Growth
Economic Conditions
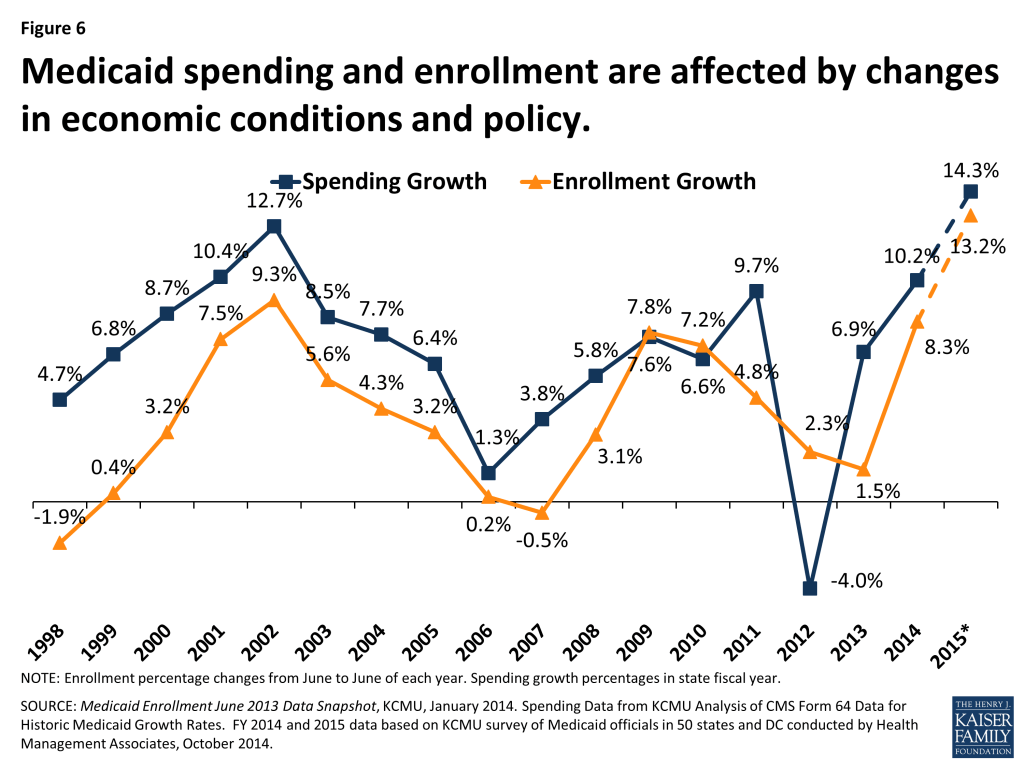
Over the past 15 years, Medicaid enrollment increased substantially during two major recessions, with annual growth peaking in FY 2001 at over 9 percent, and again at nearly 8 percent in FY 2009. During economic downturns, individuals lose jobs, incomes decline and more people qualify and enroll in Medicaid which increases program spending. At the same time, economic downturns negatively affect state tax revenues. This places additional pressure on state budgets as demand for other forms of assistance (i.e. food stamps and unemployment benefits) also increases. During economic downturns, states face difficulty balancing these pressures and affording their share of Medicaid spending increases.
In response, Congress has twice passed temporary increases to the FMAP rates to help support states during economic downturns, most recently in 2009 as part of the American Recovery and Reinvestment Act (ARRA.) The most significant source of fiscal relief to states in ARRA was a temporary increase in the federal share of Medicaid costs. To be eligible for ARRA funds, states could not restrict eligibility or tighten enrollment procedures in Medicaid or CHIP. The ARRA-enhanced match rates provided states with over $100 billion in additional federal funds over 11 quarters, ending in June 2011, as states were on the threshold of FY 2012.
State economies have demonstrated slow but sustained improvement following the worst recession since the Great Depression. Gross State Product (GSP,) a measure of state economic activity, grew by 1.8 percent from 2012 to 2013 at the national level, slightly slower than the previous year, but the fourth year of consecutive growth at the national level. All but two states (Alaska and DC) experienced positive GSP growth from 2012 to 2013, ranging up to 9.7 percent.
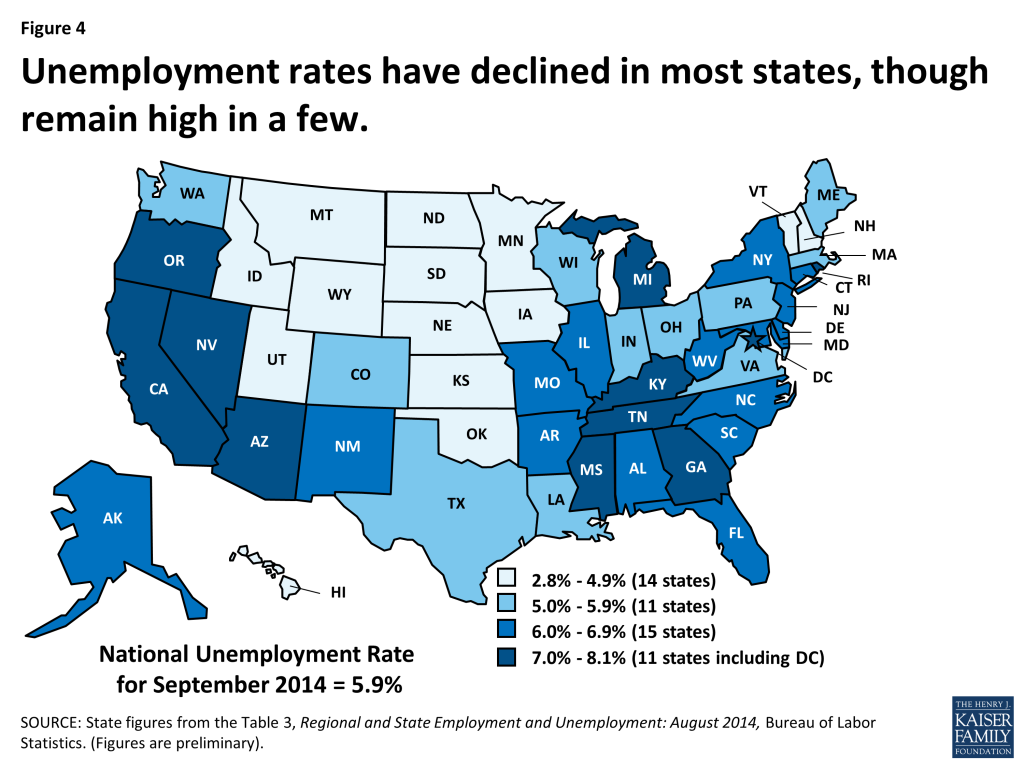
At the same time, the national unemployment rate has continued to decline, falling to 5.9 percent in September 2014, the lowest rate since July 2008.1 The declining rate of unemployment was related both to a reduction in the labor force participation rate and to continued job growth.2 After 55 months of private-sector job growth, there were 1.6 million more private sector jobs in August 2014 than before the recession.3 From February 2010 to August 2014, private sector job growth increased by an average pace of 188,000 jobs a month, with the pace picking up during the last seven months (227,000 jobs a month). Despite the improving economy, an estimated 9.3 million people remain unemployed, over 30 percent of whom are long-term unemployed (those actively looking for work for 27+ weeks.4 ) While unemployment has declined, 11 states (including DC) had rates at or above seven percent in August 2014. (Figure 4)
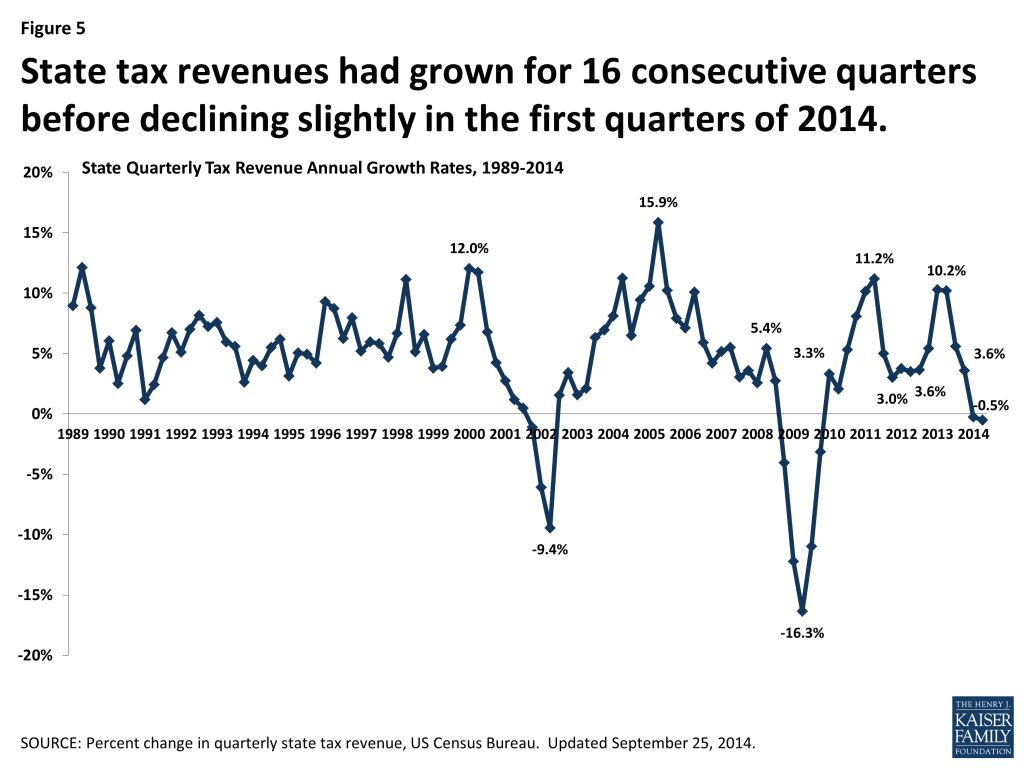
On the whole, state revenue collections have also improved. After experiencing the sharpest decline in state tax revenues on record during the Great Recession, states had seen sixteen consecutive quarters of tax revenue growth before declining slightly in the first and second quarters of 2014 (-0.3 percent and -0.5 percent.) (Figure 5) These declines in 2014 were primarily driven by federal tax policy changes that went into effect in 2013 as well as changes in tax policy in some states largely affecting personal income tax collections. Other sources of tax revenues, such as sales taxes, showed continued growth.5
With the economy continuing to improve, Medicaid enrollment growth across the country slowed considerably in FY 2012 and FY 2013. Over those two years, average spending also slowed, but the end of the ARRA enhanced match rates at the end of SFY 2011 shifted state spending patterns as states tried to mitigate the loss of federal dollars in SFY 2012 resulting in a dip in spending in SFY 2012. With economic conditions improving, the largest driver of Medicaid enrollment and spending growth during fiscal years 2014 and 2015 has been related to the implementation of the ACA. (Figure 6)
The Affordable Care Act (ACA)
As enacted, the ACA broadened Medicaid’s role, making it the foundation of coverage for nearly all low-income Americans with incomes up to 138 percent of the federal poverty level (FPL) ($16,105 per year for an individual in 2014). However, the Supreme Court ruling on the ACA effectively made the decision to implement the Medicaid expansion an option for states. For states that expand Medicaid, the federal government will pay 100 percent of Medicaid costs of those newly eligible for Medicaid for up to three calendar years from 2014 to 2016. The federal share phases down to 95 percent in 2017, 94 percent in 2018, 93 percent in 2019 and 90 percent in 2020 and remains at 90 percent thereafter, well above traditional FMAP rates in every state. (See Appendix for more information on Medicaid financing).
While nearly all states saw enrollment increases due to changes in enrollment systems and increased outreach, much of the enrollment growth (and related spending growth) nationally was driven by states adopting the Medicaid expansion, which states could implement starting January 1, 2014, halfway through FY 2014 for most states.
During FY 2014, 26 states (including DC) implemented the ACA Medicaid expansion. In FY 2015, two additional states are implementing the Medicaid expansion – New Hampshire in July 2014 and Pennsylvania in January 2015 – bringing the total to 28 states. Other states continue to discuss the opportunity to extend Medicaid under the financial terms spelled out in the ACA, including state-specific approaches. Indiana has submitted a waiver proposal to expand Medicaid through the “Healthy Indiana 2.0” plan in 2015 and Utah is in active negotiations with CMS to use an alternative approach for the Medicaid expansion. Other states expect to consider the issue in legislative sessions in 2015. (Figure 7)

Medicaid Enrollment Growth FY 2014-FY 2015
Medicaid enrollment increased on average by 8.3 percent in FY 2014 across all states, slightly less than the 8.8 percent growth states had projected on average at the beginning of the fiscal year.6 These slightly slower rates could be partially due to enrollment system problems, particularly with Healthcare.gov in the earlier months of open enrollment for coverage in the Marketplace. Enrollment growth in FY 2014 was faster than FY 2012 and FY 2013 due to the implementation of the ACA mid-way through state fiscal year 2014. All states, regardless of their decisions to implement the Medicaid expansion, attributed enrollment growth to higher take up among those already eligible, due to referrals from the health insurance Marketplaces and greater awareness of Medicaid due to outreach and publicity surrounding the ACA coverage expansions. The ACA Medicaid expansion was a driver of significant enrollment growth in states that implemented it, driving up the national average as well. Already, higher enrollment in Medicaid in 2014 has contributed to recent declines in the number of non-elderly adults who are uninsured.7 ,8
States with the largest increases in Medicaid coverage in FY 2014 were those that implemented the ACA Medicaid expansion. States expanding Medicaid averaged enrollment growth of 12.2 percent in FY 2014, compared to growth among states not expanding that averaged 2.8 percent. (Figure 11) A total of seven expansion states experienced annual Medicaid enrollment growth in FY 2014 exceeding 20 percent (Arkansas, Colorado, Kentucky, Maryland, Nevada, Oregon and West Virginia.) Only four states (all non-expansion states) reported declines in Medicaid enrollment in FY 2014 (Louisiana, Missouri, Nebraska and Oklahoma).
In FY 2015, Medicaid enrollment is projected to increase across all states at a higher rate (12.2%) than in FY 2014 (8.3%), reflecting the first full year’s impact of the eligibility and enrollment changes in the ACA. This rate of growth is driven by continued increases in enrollment primarily in states adopting the ACA Medicaid expansion. Across the 28 states implementing the Medicaid expansion in FY 2015, the number of persons enrolled in Medicaid is expected to increase on average by 18.0 percent while enrollment growth across the 23 non-expansion states is projected to average 5.2 percent. (Figure 8)

States that implemented the Medicaid expansion estimated the portion of their total enrollment growth that was attributable to newly eligible individuals. The median estimate was that approximately 80 percent of the observed growth in enrollment was attributable to newly eligible enrollees, and 20 percent was attributable to those already eligible but not previously enrolled. A few states that had expanded coverage to adults before the ACA (e.g. Massachusetts, Minnesota, and New York) noted a much smaller share of enrollment growth attributable to the Medicaid expansion. Both expansion and non-expansion states noted higher take-up rates among persons who were eligible under pre-ACA eligibility rules, as individuals were referred to Medicaid from the new health insurance marketplaces, or responded to widespread publicity about the implementation of the ACA coverage options. A small number of states noted that without the ACA Medicaid expansion, enrollment might have declined due to the improving economy.
TOTAL SPENDING GROWTH FY 2014-FY 2015
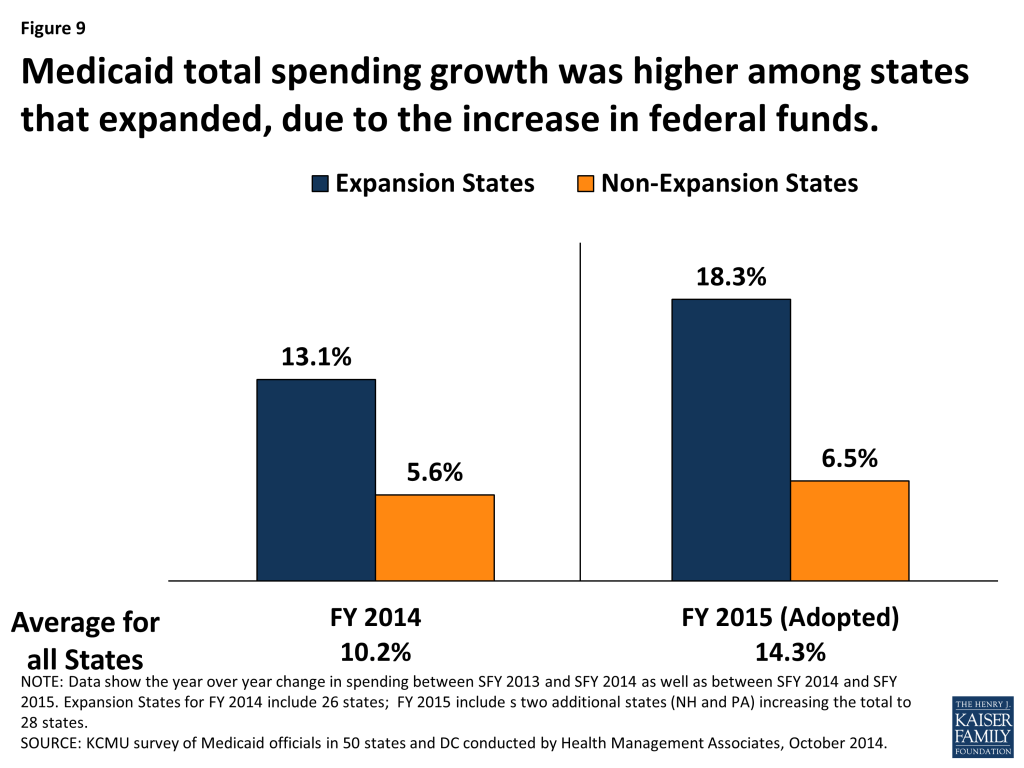
Total Medicaid spending growth in FY 2014 increased across all states on average by 10.2 percent, virtually identical to the 10.3 percent originally appropriated by state legislatures. The primary factor listed by state officials as contributing to this growth in spending was enrollment growth driven by the ACA-related eligibility changes. While total spending growth increased at higher rates than previous years across all states due to increased enrollment, states that implemented the ACA Medicaid expansion reported significantly higher rates of growth in total spending (13.1%) than states that did not implement the Medicaid expansion (5.6%). (Figure 9) Total spending growth was right on target with state projections in the states that expanded in FY 2014; total spending growth for states that did not expand was substantially lower than original projections (5.6% growth reported compared to 6.8% projected).9 The coverage provisions of the ACA went into effect in January 2014, mid-way through the state fiscal year which begins on July 1 in most states.
In FY 2015 across all states, total Medicaid spending is projected to grow on average by 14.3 percent based on adopted budgets for FY 2015. Looking specifically at the 28 states that are implementing the ACA Medicaid expansion, total Medicaid spending was appropriated to increase on average by 18.3 percent. In comparison, across the 23 states not implementing the ACA Medicaid expansion at this time, spending growth was appropriated to increase on average by 6.5 percent. (Figure 9) The larger differential between growth rates for expanding and non-expanding states in FY 2015 was expected as it reflects the first full year of the Medicaid expansion.
Medicaid officials in the majority of states believed that the amount of funding legislatively appropriated for their Medicaid program for FY 2015 would be adequate. In only about one-quarter of states did officials believe that a Medicaid shortfall was likely. This is the second consecutive year in which the majority of Medicaid officials expressed confidence in the adequacy of the original legislative authorization for the upcoming year, which is a turnaround from the Medicaid experience during the recent recession when a majority of Medicaid officials expected a Medicaid budget shortfall at the start of each fiscal year.
State Spending for Medicaid
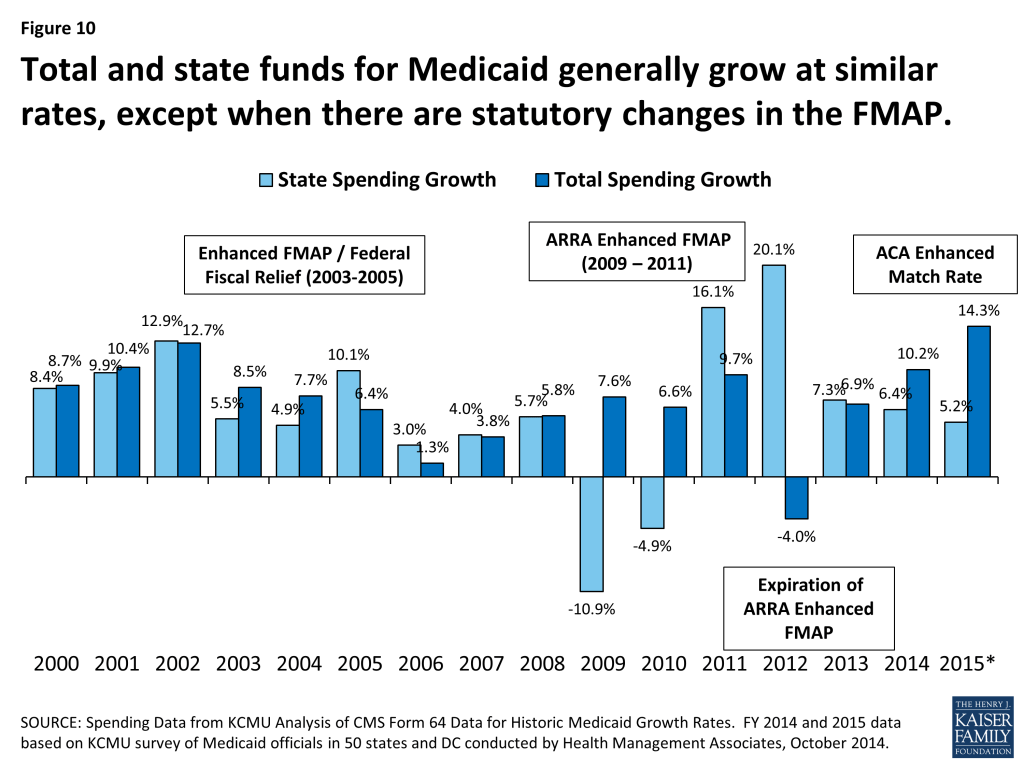
Historically, state and federal Medicaid spending have increased at similar rates. Differences between total and state spending growth are usually related to factors such as annual changes in the state-specific FMAPs, changes in contributions from local governments, special financing arrangements, or provider taxes. During the last two recessions, Congress enacted temporary enhancements to the FMAP to provide fiscal relief to states by reducing the state share of Medicaid spending. Due to this relief, there was a historic decline in state spending for Medicaid in FY 2009 and FY 2010 followed by substantial increases in FYs 2011 and 2012 due to the expiration of the enhanced-match rate. For FY 2014, state fund spending for Medicaid increased on average by 6.4 percent across all states compared to total spending growth of 10.2 percent. For FY 2015, state fund spending is projected to grow on average across all states by 5.2 percent, compared to total spending growth of 14.3 percent. The large gap between total and state spending growth is attributable to the higher FMAP available in states implementing the ACA Medicaid expansion. (Figure 10)
For expanding states, total Medicaid spending generally will grow at a rate similar to enrollment growth; state spending for Medicaid will grow more slowly due to the higher federal match for newly eligible individuals. In FY 2014, across states implementing the Medicaid expansion, total Medicaid spending increased on average by 13.1 percent, nearly double the rate of state spending growth of 6.6 percent. This pattern continues into FY 2015, but is more dramatic with the enhanced 100 percent federal match rate in effect for the entire fiscal year in most of the expansion states. States expanding Medicaid are expecting total Medicaid spending growth of 18.3 percent on average in FY 2015 –more than four times the rate of growth of state Medicaid spending in these states (4.4%). (Figure 11) Some states implementing the Medicaid expansion also noted they will see savings of state dollars in their Medicaid budget when individuals previously enrolled in limited-benefit, regular FMAP state Medicaid programs now gain full Medicaid coverage and thereby qualify for the “newly-eligible 100 percent match rate.”
States not implementing the expansion saw total Medicaid spending in FY 2014 increase by 5.6 percent and state spending increase on average by 6.1 percent – somewhat similar rates of growth, particularly in comparison to the rates of spending growth seen in expansion states. Both total and state spending growth rates for non-expanding states exceeded enrollment growth of 2.8 percent. Total and state spending for non-expanding states are expected to continue growth in FY 2015, again at similar rates (6.5 percent for total spending and 6.8 percent for state spending) as enrollment growth is expected to increase on average by 5.2 percent. (Figure 12) Beyond the ACA changes such as the MAGI eligibility rules, increased publicity and the interface with the new Marketplaces, another important factor affecting state spending in FY 2014 and FY 2015 were changes in state FMAP rates due to annual updates to the formula.10 These factors contribute to differences between total and state spending growth across all states, but are primarily evident across states not adopting the ACA Medicaid expansion in FY 2014 and FY 2015.

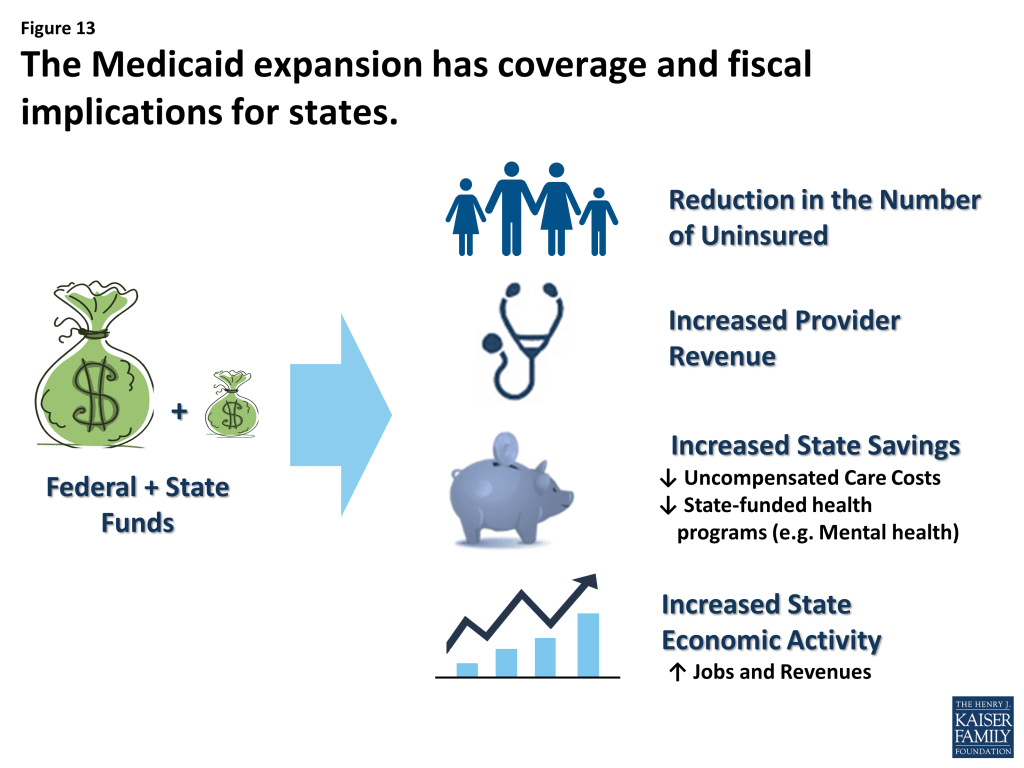
In addition to increases in health coverage and reductions in the number of uninsured, state decisions about the Medicaid expansions have important fiscal implications due in part to the increase in federal funds to the state that support health care providers including hospitals, health centers, and nursing facilities, and other businesses, and have positive effects on jobs, household spending, and state and local tax collections.11
In this year’s survey, states expanding Medicaid also typically cited net state budget savings beyond Medicaid. States reported that expanded coverage through Medicaid could allow for reductions in state spending for services such as mental health, correctional health, state-funded programs for the uninsured and uncompensated care. These savings are outside the Medicaid program and Medicaid spending and enrollment data included in this report. States also referenced studies that projected drops in the number of uninsured and increases in state economic activity.12 (Figure 13)
Looking Ahead
Medicaid enrollment and spending trends have been largely driven by economic conditions, including two major recessions since 2000. In FYs 2012 and 2013, as economic conditions increasingly showed signs of improvement, states saw Medicaid enrollment growth slow. As anticipated, in FY 2014 and in budgets adopted for FY 2015, spending and enrollment have increased at a faster pace largely due to the implementation of the ACA’s major coverage provisions. Widespread outreach efforts and simplified enrollment procedures contributed to enrollment growth across all states. However, states that implemented the Medicaid expansion experienced substantially higher growth in enrollment compared to states that did not implement the ACA expansion in 2014. Total Medicaid spending also increased substantially, driven by increases in states implementing the Medicaid expansion, although the growth in these states was primarily driven by enrollment of the fully-federally-funded, newly eligible population. Medicaid spending from state funds increased at far lower rates than total Medicaid spending in states that implemented the Medicaid expansion. Looking ahead, the economy, ACA implementation and other Medicaid policy changes (such as major payment and delivery system reform efforts) are expected to continue to have a significant effect on future Medicaid spending and enrollment trends.
This Kaiser Commission on Medicaid and the Uninsured brief was prepared by Robin Rudowitz and Laura Snyder from the Kaiser Family Foundation, and Vernon K. Smith, Ph.D., Kathleen Gifford and Eileen Ellis with Health Management Associates.The authors express their appreciation to Dennis Roberts, who managed the database. We also thank the Medicaid directors and staff in all 50 states and the District of Columbia who completed the survey on which this brief is based.
Methodology
Definition of Medicaid Spending. Total Medicaid spending includes all payments to Medicaid providers for Medicaid covered services provided to enrolled Medicaid beneficiaries. In addition, total Medicaid spending includes special payments to “disproportionate share hospitals” (“DSH payments”) that subsidize uncompensated care for persons who are uninsured and unreimbursed costs related to care for persons on Medicaid. Not included in total Medicaid spending are Medicaid administrative costs, costs for the Children’s Health Insurance Program (CHIP), and federally mandated state “Clawback” payments to Medicare (to help finance the Medicare Part D prescription drug benefit for beneficiaries who are dually enrolled in both Medicare and Medicaid.) Total Medicaid spending includes payments financed from all sources, including state funds, local contributions and federal match funds.
Methdology. The Kaiser Commission on Medicaid and the Uninsured (KCMU) commissioned Health Management Associates (HMA) to survey Medicaid directors in all 50 states and the District of Columbia to identify and track trends in Medicaid spending, enrollment and policy making. This was the fourteenth annual survey, conducted at the beginning of each state fiscal year from FY 2002 through FY 2015.
The KCMU/HMA Medicaid survey on which this report is based was conducted from June through August 2014. Medicaid directors and staff provided data for this report in response to a written survey and a follow-up telephone interview. The survey was sent to each Medicaid director in June 2014. All 50 states and DC completed surveys and participated in telephone interview discussions in June, July and August 2014. The telephone discussions are an integral part of the survey to ensure complete and accurate responses and to record the complexities of state actions.
Annual rates of growth for Medicaid spending and enrollment were calculated as weighted averages across all states, and for states based on state decisions to implement the ACA Medicaid expansion in 2014 or 2015. For FYs 2014 and 2015, average annual Medicaid spending growth was calculated using weights derived from the most recent state Medicaid expenditure data for fiscal year 2013, based on estimates prepared for KCMU by the Urban Institute using CMS Form 64 reports, adjusted for state fiscal years. These data were also used for historic Medicaid spending. Medicaid enrollment average annual growth rates were calculated using weights based on state enrollment data for June 2013.13
Because the data reported here for FYs 2014 and 2015 are weighted averages derived from Medicaid spending and enrollment, data reported for states with larger spending and enrollment have a larger effect on the national average. These effects are further amplified when looking at smaller groups of states, such as states implementing the Medicaid expansion and those that have not.
Additional information collected in the survey on policy actions taken during FY 2014 and FY 2015 can be found in the following report: https://www.kff.org/medicaid/report/medicaid-in-an-era-of-health-delivery-system-reform-results-from-a-50-state-medicaid-budget-survey-for-state-fiscal-years-2014-and-2015
Appendix
Appendix: Background on Medicaid Financing
Medicaid Financing Structure
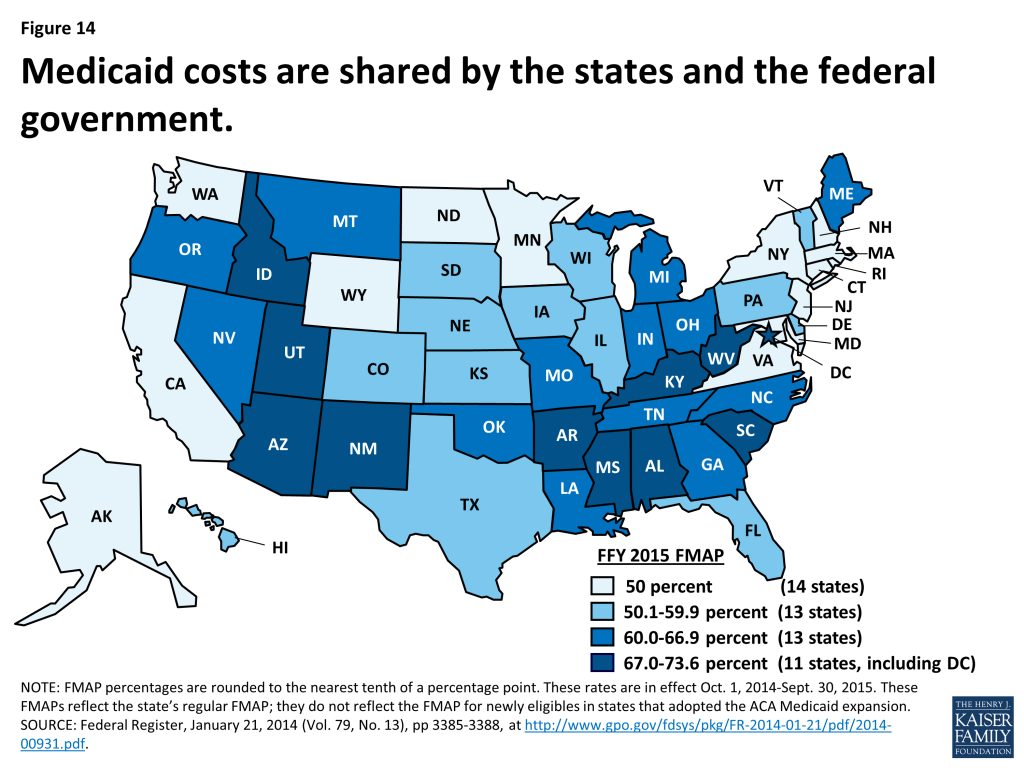
The Medicaid program is jointly funded by states and the federal government. The federal government guarantees match funds to states for qualifying Medicaid expenditures (payments states make for covered Medicaid services provided by qualified providers to eligible Medicaid enrollees.) The federal match rate (Federal Medical Assistance Percentage or FMAP) is calculated annually for each state using a formula set in the Social Security Act which is based on a state’s average personal income relative to the national average; poorer states have higher FMAPs. Personal income data are lagged, so data used for FFY 2015 FMAPs are from the three years of 2010 to 2012. According to the formula, the FMAP in FFY 2015 varies across states from a floor of 50 percent to a high of 73.6 percent. (Figure 14) This means every $1 of state spending on Medicaid is matched with at least $1 of federal funds.14
Medicaid’s Role in State Budgets
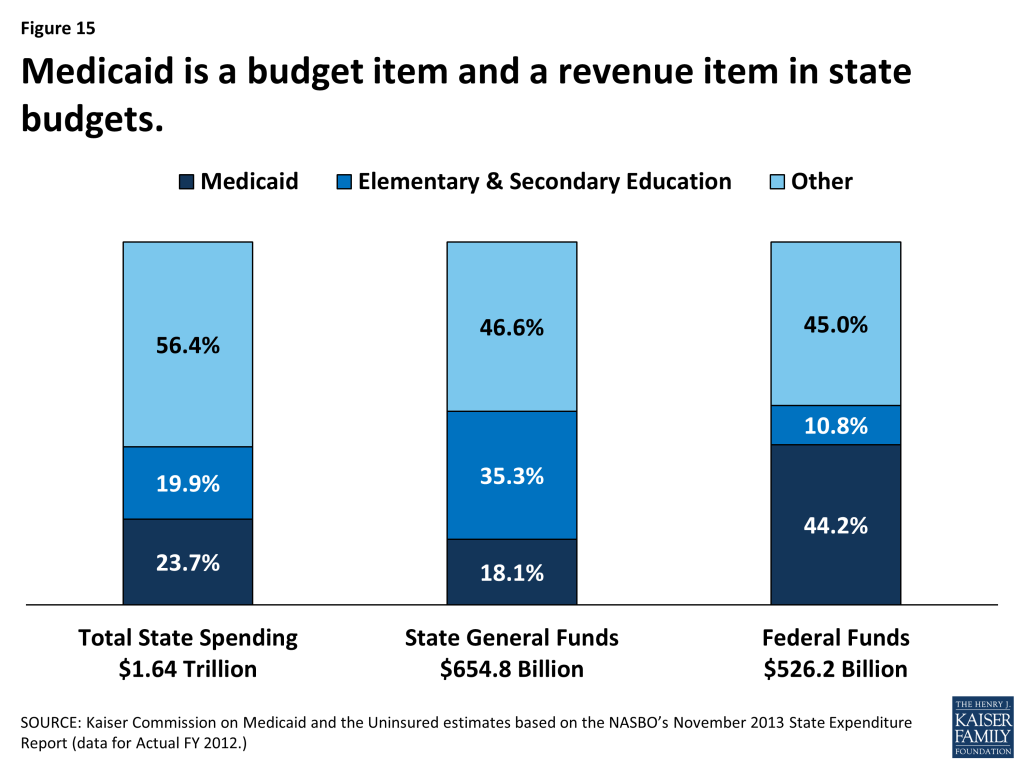
Medicaid has a unique role in state budgets because it is both an expenditure item and a source of federal revenue for states. In FY 2012, Medicaid accounted for 23.7 percent of total spending, but only 18.1 percent of all state general fund spending, a far second to spending on K-12 education (35.3 percent of state general fund spending.)15 Due to the federal match structure for Medicaid, the program is the largest source of federal funds for states, accounting 44.2 percent of all federal funds for states in FY 2012. Over the last decade, shares of general fund spending for Medicaid and K-12 education have remained fairly constant with an uptick in the share of general fund spending on Medicaid since 2010 in part due to the June 2011 expiration of the enhanced FMAP provided by under the American Recovery and Reinvestment Act (ARRA). (Figures 15 and 16)

Endnotes
- Bureau of Labor Statistics, The Employment Situation – September 2014. (Washington, DC: Bureau of Labor Statistics,) October 3, 2014. http://www.bls.gov/cps/. ↩︎
- While the share of the population over 16 participating in the labor force (labor force participation rate) did not decline over the past year, it is at a level (62.7 percent in September 2014) last seen in 1978. A portion of this decline in the labor force participation rate is due to increasing numbers of baby-boomers retiring. Chad Stone, Statement by Chad Stone, Chief Economist, on the August Employment Report, (Washington, DC: Center on Budget and Policy Priorities,) September 5, 2014. http://www.cbpp.org/cms/index.cfm?fa=view&id=4195. ↩︎
- Bureau of Labor Statistics, The Employment Situation – September 2014. (Washington, DC: Bureau of Labor Statistics,) October 3, 2014. http://www.bls.gov/cps/. ↩︎
- Ibid. ↩︎
- The first two quarters of tax revenue growth were driven by significant increases in personal income tax revenue growth; experts noted that this significant growth appeared to be artificially driven by changes in federal tax policy. While personal income tax growth slowed in the third and fourth quarters of 2013, sales tax revenue growth has remained fairly constant (over 5% each quarter) during the 2013 calendar year. Lucy Dadayan and Donald J. Boyd, State Tax Revenues Slip Back to Slower Growth, (Albany, NY: The Nelson A. Rockefeller Institute of Government,) March 11, 2014. http://www.rockinst.org/pdf/government_finance/state_revenue_report/2014-03-11_Data_Alertv3.pdf. Lucy Dadayan and Donald J. Boyd, “April Surprises” Left Many States with Bad News, (Albany, NY: The Nelson A. Rockefeller Institute of Government,) September 17, 2014.http://www.rockinst.org/pdf/government_finance/state_revenue_report/2014-09-17_Data_Alert.pdf. ↩︎
- Kaiser Commission on Medicaid and the Uninsured, Medicaid in a Historic Time of Transformation: Results from a 50-State Medicaid Budget Survey for State Fiscal Years 2013 and 2014, (Washington, DC: Kaiser Commission on Medicaid and the Uninsured), October 2013. https://modern.kff.org/medicaid/report/medicaid-in-a-historic-time-of-transformation-results-from-a-50-state-medicaid-budget-survey-for-state-fiscal-years-2013-and-2014/. ↩︎
- National Health Interview Survey Early Release Program. “Health Insurance Coverage: Early Relase of Estimates from the National Health Interview Survey, January – March 2014. Released September 16, 2014. http://www.cdc.gov/nchs/data/nhis/earlyrelease/insur201409.pdf ↩︎
- Kaiser Family Foundation, Measuring Changes in Insurance Coverage Under the Affordable Care Act, (Washington, DC: Kaiser Commission on Medicaid and the Uninsured), October 2013. https://modern.kff.org/health-reform/issue-brief/measuring-changes-in-insurance-coverage-under-the-affordable-care-act/. ↩︎
- Figures for expansion state spending and enrollment growth from last year’s survey included 25 states; after the survey data was collected for last year’s report, Ohio decided to move forward and implement the Medicaid expansion as of January 1, 2014. When collecting data for this year’s report, Ohio included spending and enrollment figures that reflected expanding as of January 1, 2014 and therefore were included in the expansion group. ↩︎
- Because the data reported here are a weighted average across all non-expansion states, the FMAP declines in larger states, such as Texas, have a larger effect on the state and total spending averages for this group. ↩︎
- Kaiser Family Foundation, The Role of Medicaid in State Economies and the ACA, (Washington, DC: Kaiser Commission on Medicaid and the Uninsured), November 2013. https://modern.kff.org/medicaid/issue-brief/the-role-of-medicaid-in-state-economies-and-the-aca/. Sherry Glied and Stephanie Ma, How States Stand to Gain or Lose Federal Funds by Opting In or Out of the Medicaid Expansion. (New York City, NY: The Commonwealth Fund,) December 2013. http://www.commonwealthfund.org/Publications/Issue-Briefs/2013/Dec/Federal-Funds-Medicaid-Expansion.aspx. ↩︎
- National Health Interview Survey Early Release Program. “Health Insurance Coverage: Early Release of Estimates from the National Health Interview Survey, January – March 2014. Released September 16, 2014. http://www.cdc.gov/nchs/data/nhis/earlyrelease/insur201409.pdf Kaiser Family Foundation, Measuring Changes in Insurance Coverage Under the Affordable Care Act, (Washington, DC: Kaiser Commission on Medicaid and the Uninsured), October 2013. https://modern.kff.org/health-reform/issue-brief/measuring-changes-in-insurance-coverage-under-the-affordable-care-act/. ↩︎
- Kaiser Commission on Medicaid and the Uninsured, Medicaid Enrollment: June 2013 Data Snapshot, (Washington, DC: Kaiser Commission on Medicaid and the Uninsured), January 29, 2014. https://modern.kff.org/medicaid/issue-brief/medicaid-enrollment-june-2013-data-snapshot/. ↩︎
- State Health Facts, Federal Medical Assistance percentage (FMAP) for Medicaid and Multiplier, (Washington, DC: Kaiser Family Foundation,) downloaded March 2014. https://modern.kff.org/medicaid/state-indicator/federal-matching-rate-and-multiplier/. ↩︎
- Kaiser Commission on Medicaid and the Uninsured estimates based on the NASBO’s November 2013 State Expenditure Report (data for Actual FY 2012.) ↩︎