Data Note: Modestly Strong but Malleable Support for Single-Payer Health Care
Findings
As Congress continues to negotiate a repeal and replacement of the Affordable Care Act (ACA), some observers have suggested that if Republicans are unable to pass a replacement plan, it will create momentum for Democrats to push the country towards a single-payer health care system. This section of the latest Kaiser Health Tracking poll finds that while there has been a modest increase in the public’s level of support for single-payer in recent years, a substantial share of the public remains opposed to such a plan, and opinions are quite malleable when presented with the types of arguments that would be likely to arise during a national debate.
Trending Support for Single-Payer
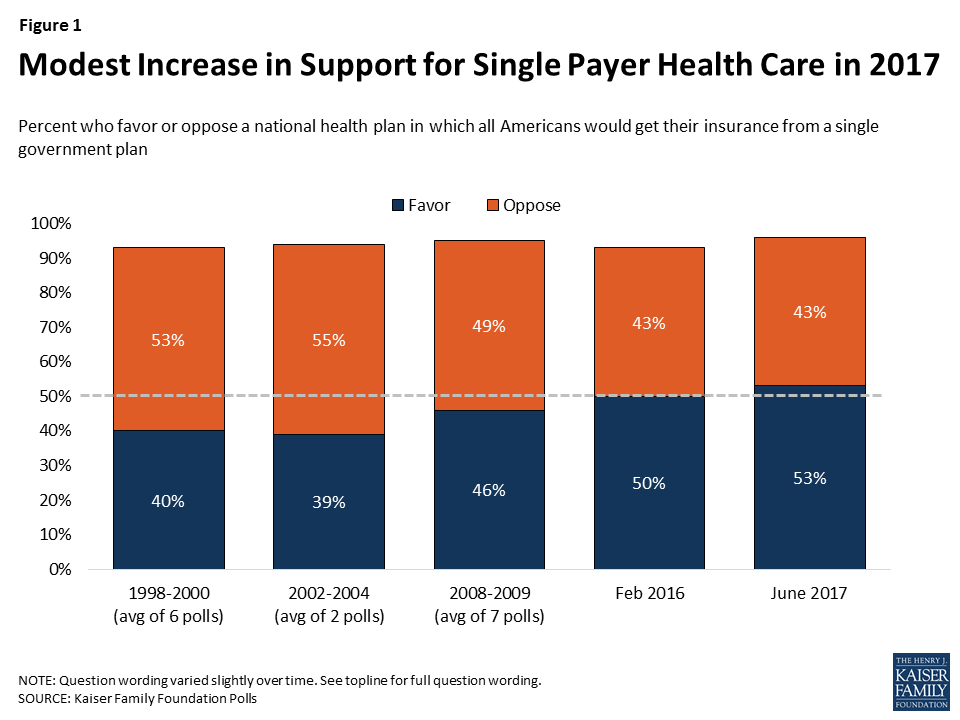
The June Kaiser Health Tracking poll finds that a slim majority of the public (53 percent) now favors a single-payer health plan in which all Americans would get their insurance from a single government plan, while just over four in ten (43 percent) are opposed. This is somewhat higher than the level of support found in a variety of Kaiser polls with slight variations in question wording dating back to 1998. From 1998 through 2004, roughly four in ten supported a national health plan, while about half were opposed. In polling from 2008-2009, the period leading up to passage of the ACA, the public was more evenly divided, with about half in favor of a single-payer plan and half opposed.
Independents May Be Driving Slight Shift in Overall Attitudes
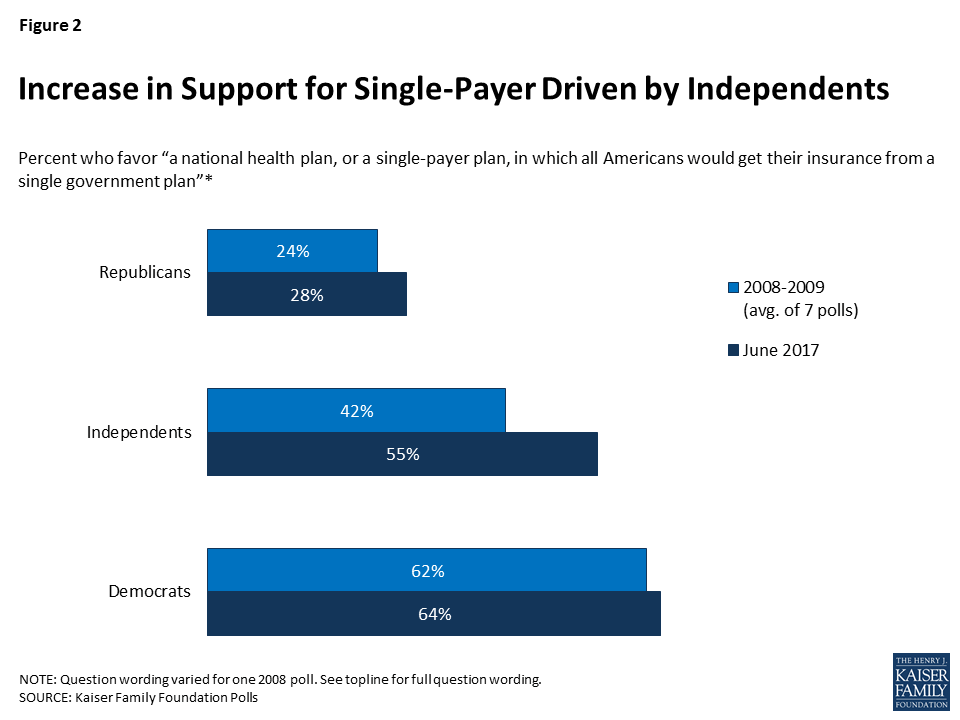
Not surprisingly, there are partisan divisions in how the public feels about single-payer health care, with a majority of Democrats (64 percent) and just over half independents (55 percent) in favor and a majority of Republicans (67 percent) opposed. However, the recent increase in support for single-payer has largely been driven by an increase among independents. Among this group, on average in 2008-2009, 42 percent said they would favor a single-payer plan, a share that has increased to a majority (55 percent) in the most recent tracking poll.
“Medicare-for-all” vs. “Single-Payer”
Language often matters in framing questions about health policy. For example, the February 2016 Kaiser Health Tracking Poll found that when terms were tested on their own, outside the definition of a national health plan that would cover all Americans, the public was more likely to react favorably to the term “Medicare-for-all” (64 percent favorable) than “single-payer health insurance system” (44 percent favorable). However, the current poll finds that when the plan is defined as one in which all Americans would get their insurance from a single government plan, support is similar when the plan was referred to as “Medicare-for-all” (57 percent in favor) as when it was referred to as “single payer” (53 percent).

Support for Single-Payer is Malleable When Given Opposing Arguments
The poll finds the public’s attitudes on single-payer are quite malleable
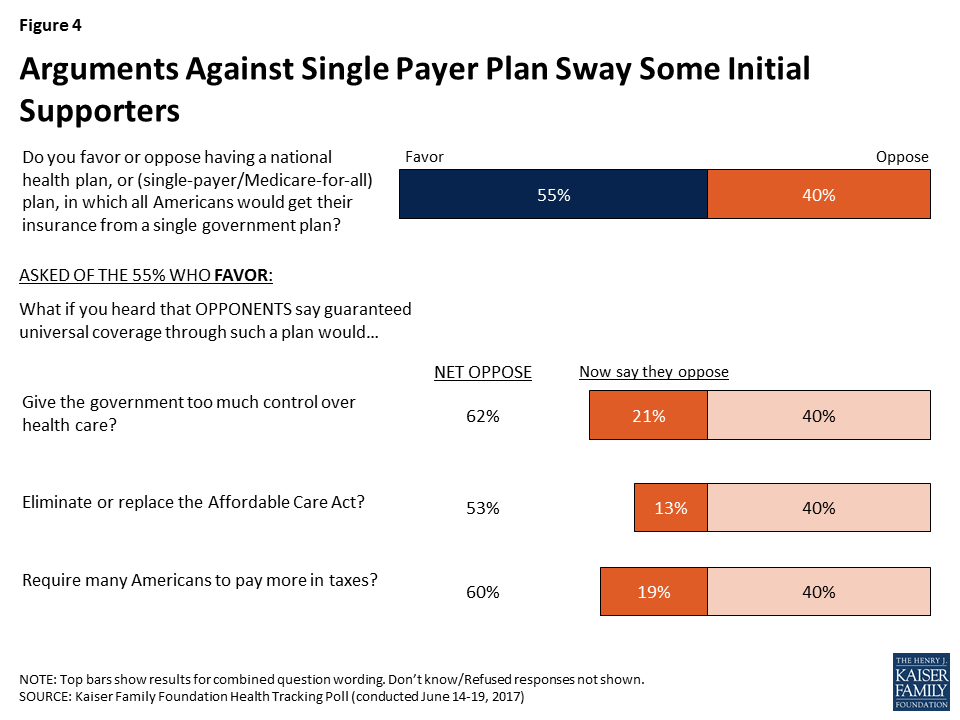
While a slim majority favors the idea of a national health plan at the outset, a prolonged national debate over making such a dramatic change to the U.S. health care system would likely result in the public being exposed to multiple messages for and against such a plan. The poll finds the public’s attitudes on single-payer are quite malleable, and some people could be convinced to change their position after hearing typical pro and con arguments that might come up in a national debate. For example, when those who initially say they favor a single-payer or Medicare-for-all plan are asked how they would feel if they heard that such a plan would give the government too much control over health care, about four in ten (21 percent of the public overall) say they would change their mind and would now oppose the plan, pushing total opposition up to 62 percent. Similarly, when this group is told such a plan would require many Americans to pay more in taxes or that it would eliminate or replace the Affordable Care Act, total opposition increases to 60 percent and 53 percent, respectively.
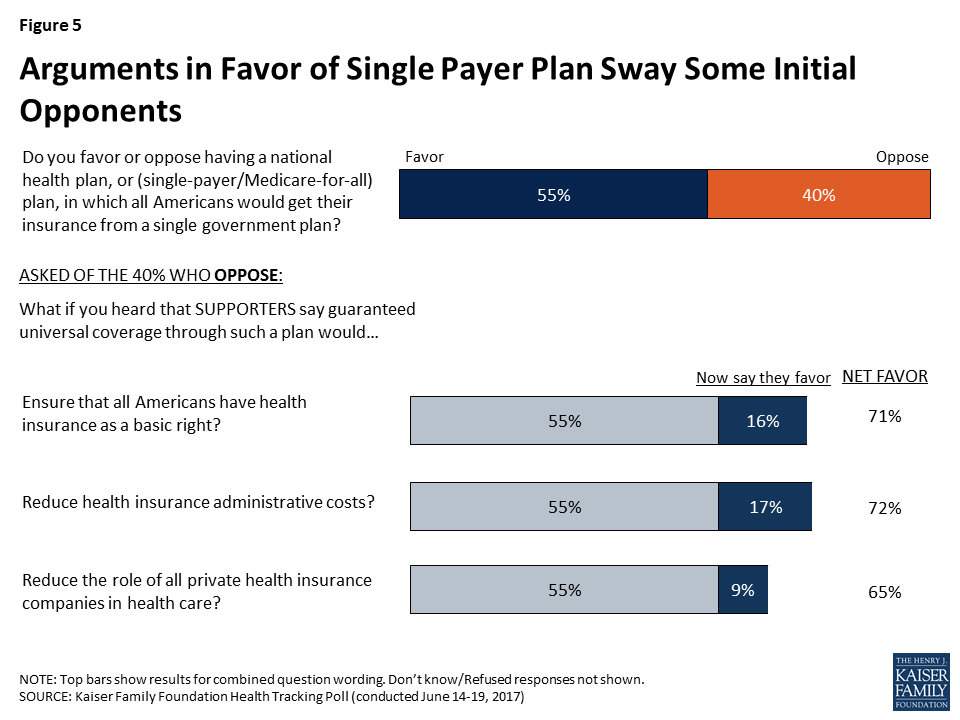
On the other side, when those who initially oppose a single-payer or Medicare-for-all plan are asked how they would feel if they heard such a plan would reduce health insurance administrative costs, four in ten (17 percent of the public overall) change their position and say they would now favor the plan, bringing total support to 72 percent. Similarly, when this group is told such a plan would ensure that all Americans have health insurance as a basic right or that it would reduce the role of private health insurance companies in health care, total support increases to 71 percent and 65 percent, respectively.
Methodology
This Kaiser Health Tracking Poll was designed and analyzed by public opinion researchers at the Kaiser Family Foundation (KFF). The survey was conducted June 14-19, 2017, among a nationally representative random digit dial telephone sample of 1,208 adults ages 18 and older, living in the United States, including Alaska and Hawaii (note: persons without a telephone could not be included in the random selection process). Computer-assisted telephone interviews conducted by landline (427) and cell phone (781, including 483 who had no landline telephone) were carried out in English and Spanish by SSRS of Glen Mills, PA. Both the random digit dial landline and cell phone samples were provided by Marketing Systems Group (MSG) of Horsham, PA. For the landline sample, respondents were selected by asking for the youngest adult male or female currently at home based on a random rotation. If no one of that gender was available, interviewers asked to speak with the youngest adult of the opposite gender. For the cell phone sample, interviews were conducted with the adult who answered the phone. KFF paid for all costs associated with the survey.
The combined landline and cell phone sample was weighted to balance the sample demographics to match estimates for the national population using data from the Census Bureau’s 2015 American Community Survey (ACS) on sex, age, education, race, Hispanic origin, and region along with data from the 2010 Census on population density. The sample was also weighted to match current patterns of telephone use using data from the July-December 2016 National Health Interview Survey. The weight takes into account the fact that respondents with both a landline and cell phone have a higher probability of selection in the combined sample and also adjusts for the household size for the landline sample. All statistical tests of significance account for the effect of weighting.
The margin of sampling error including the design effect for the full sample is plus or minus 3 percentage points. Numbers of respondents and margins of sampling error for key subgroups are shown in the table below. For results based on other subgroups, the margin of sampling error may be higher. Sample sizes and margins of sampling error for other subgroups are available by request. Note that sampling error is only one of many potential sources of error in this or any other public opinion poll. Kaiser Family Foundation public opinion and survey research is a charter member of the Transparency Initiative of the American Association for Public Opinion Research.
| Group | N (unweighted) | M.O.S.E. |
| Total | 1208 | ±3 percentage points |
| Party Identification | ||
| Democrats | 385 | ±6 percentage points |
| Republicans | 311 | ±7 percentage points |
| Independents | 407 | ±6 percentage points |
| Trump Approval | ||
| Approve of President Trump | 487 | ±5 percentage points |
| Disapprove of President Trump | 672 | ±4 percentage points |
| Half Sample | ||
| Sample A | 597 | ±5 percentage points |
| Sample B | 611 | ±5 percentage points |