Insulin Costs and Coverage in Medicare Part D
Issue Brief
In May 2020, the Trump Administration announced the number of Medicare Part D plans that will be participating in 2021 in a Medicare Innovation Center model to address out-of-pocket costs for insulin products for Part D enrollees. Under the voluntary model, participating Part D plans can offer coverage of insulin for a flat monthly copayment of no more than $35, in contrast to varying cost-sharing amounts during different phases of the Part D benefit under the current design. The model comes in response to rising prices for insulin, which have attracted increasing scrutiny from policymakers, leading to congressional investigations and overall concerns about affordability and access for people with diabetes who need insulin to control blood glucose levels.
Among people with Medicare (including people 65 and older and younger adults with long-term disabilities), one third (33%) had diabetes in 2017, up from 18% in 2000. The rate of diabetes in the overall population has been trending up, and is highest among people 65 and over. Being overweight, having high blood pressure or high cholesterol, older age, and physical inactivity are among the risk factors for type 2 diabetes (by far the most common type). Though not all people with diabetes need insulin, for those who do, it is a life-saving medication and essential to maintaining good health.
In light of heightened attention to insulin and the Trump Administration’s new Part D model to address out-of-pocket costs for insulin for Medicare beneficiaries, we analyzed out-of-pocket spending on insulin by beneficiaries enrolled in Part D drug plans, variation in Part D plan formulary coverage and tier placement of insulin products, and trends in prices for insulin (not accounting for rebates), based on data from the Centers for Medicare & Medicaid Services (CMS) (see Data and Methods for details). We also discuss the Administration’s Part D demonstration, which will take effect in 2021, and policy proposals introduced in the 116th Congress that address cost concerns related to insulin.
Key Takeaways
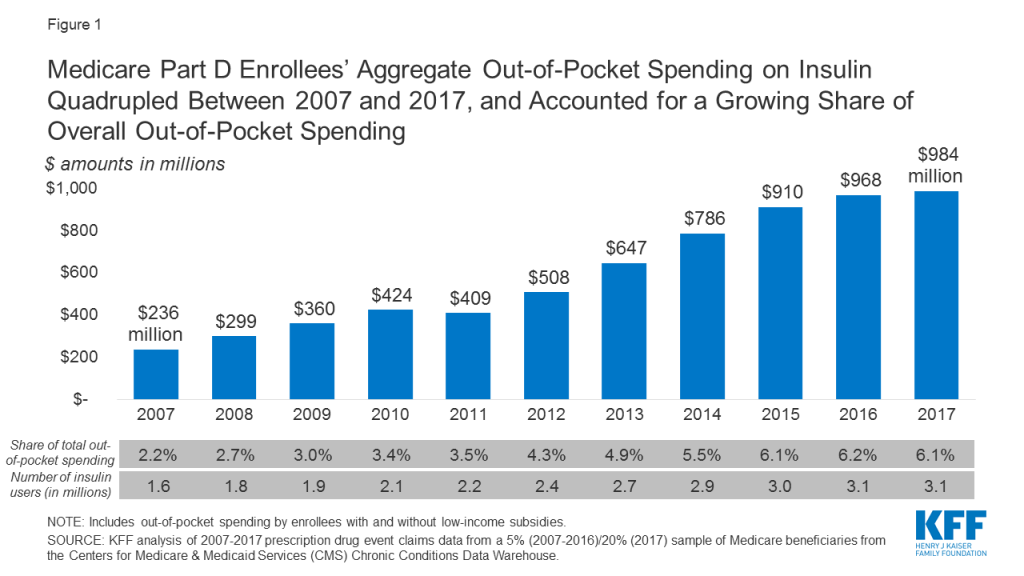
- Aggregate out-of-pocket spending by people with Medicare Part D for insulin products quadrupled between 2007 to 2017 from $236 million to $984 million, reflecting both an increase in the number of users and price increases for insulin.
- Among insulin users without Part D low-income subsidies (LIS), average annual per capita out-of-pocket spending on insulin increased by 79% over these years, from $324 in 2007 to $580 in 2017. Average annual growth in costs was 6%, which exceeded the 1.6% average annual rate of growth in inflation over this time period.
- If Part D enrollees had paid 12 months of $35 copays for insulin in 2017, as under the Administration’s new Part D model, annual costs for one insulin product would have been $420, or $160 (28%) lower than average annual costs paid by non-LIS Part D insulin users in 2017.
- Formulary coverage and tier placement of insulin products vary across Part D plans, but in 2019, a large number of Part D plans placed insulin products on Tier 3, the preferred drug tier, which typically had a $47 copayment per prescription during the initial coverage phase. However, once enrollees reach the coverage gap phase, they face a 25% coinsurance rate, which equates to $100 or more per prescription in out-of-pocket costs for many insulin therapies, unless they qualify for LIS. Paying a flat $35 copayment rather than 25% coinsurance during the coverage gap phase could translate to meaningful savings on many insulin products.
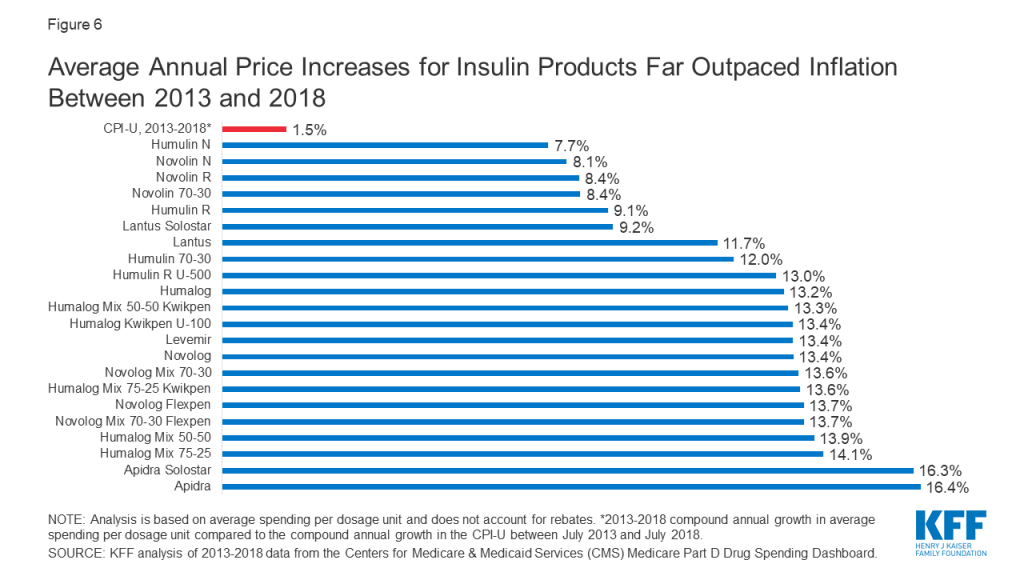
- Among the 22 insulin therapies that have been on the market since at least 2013, 16 products had average annual price increases of more than 10% between 2013 and 2018, as measured by the change in total Part D spending per dosage unit between these years, which far exceeded the 1.5% rate of inflation over the same time period. Although CMS’s Part D pricing data does not account for rebates, it is relevant in considering out-of-pocket costs for people who use insulin, because in some cases what people pay out of pocket is based on the list price.
- The Administration’s new model that allows participating Part D plans to cap monthly out-of-pocket insulin costs could help some beneficiaries with their insulin costs, if they are enrolled in a participating Part D plan and use an insulin product covered by their plan with a $35 copayment. But the new model applies to a subset of plans and enrollees (those without low-income subsidies in enhanced plans, which cover 80% of non-LIS Part D enrollees in non-employer Part D plans in 2020), and not all insulin products have to be covered by all participating plans. The new model also does not address underlying list price increases for insulin or affordability concerns for people who are uninsured or covered by other sources of coverage.
In addition to the Administration’s new Part D model, several bills have been introduced in the 116th Congress that aim to lower insulin out-of-pocket costs, and prices, including proposals to cap or eliminate Medicare beneficiaries’ monthly out-of-pocket costs for insulin and insulin supplies, allow Medicare to negotiate the price of insulin (and other) products, let the government manufacture insulin products directly, allow importation of insulin, use international reference pricing for insulin, and limit drug price increases to the rate of inflation.
Out-of-Pocket Spending on Insulin by Medicare Part D Enrollees
Aggregate Out-of-Pocket Spending for Insulin in Part D
Aggregate out-of-pocket spending by people with Medicare Part D for insulin products quadrupled between 2007 to 2017, from $236 million to $984 million (Figure 1). The number of Medicare Part D enrollees using insulin nearly doubled over this time period (from 1.6 million to 3.1 million beneficiaries), which indicates that higher aggregate out-of-pocket spending was not solely a function of more Medicare beneficiaries using insulin.
Average Annual Per Capita Out-of-Pocket Costs for Insulin
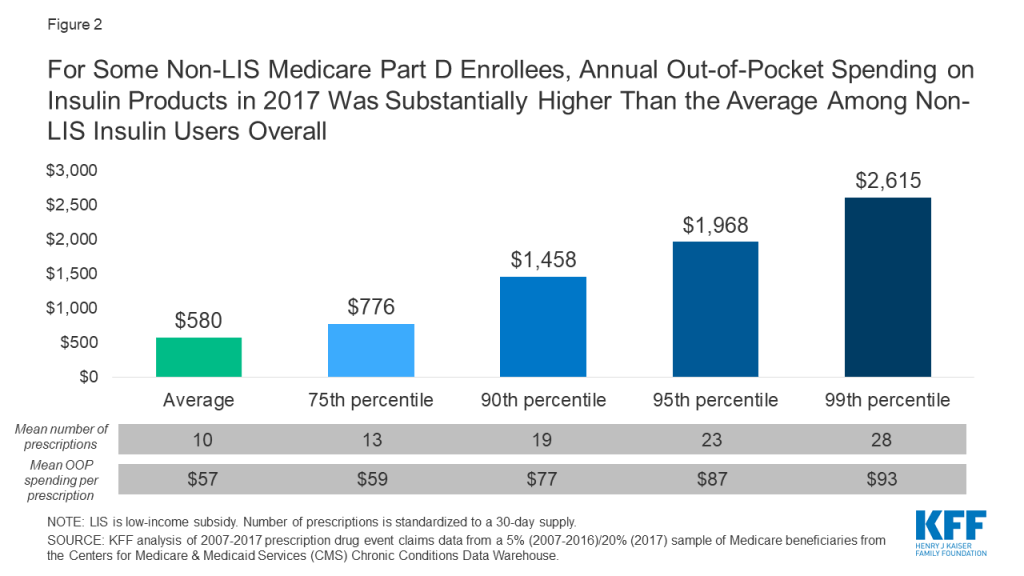
Annual out-of-pocket spending on insulin products among Medicare Part D insulin users who do not receive low income subsidies was $580 in 2017, a 79% increase since 2007 ($324). Average annual growth in insulin out-of-pocket costs was 6% over these years, which far exceeded the 1.6% average annual rate of growth in inflation over this time period.
Some enrollees spent considerably more than the average (Figure 2). For example, 10% of non-LIS insulin users spent nearly $1,500 on insulin in 2017 and 1% spent over $2,600. Higher-than-average out-of-pocket spending is due to a greater number of prescription fills for insulin products and higher out-of-pocket costs per insulin prescription. In other words, taking more than one insulin product and taking newer, more expensive formulations leads to higher out-of-pocket costs.
Out-of-Pocket Spending Per Insulin Prescription
Among Medicare Part D insulin users who do not receive low-income subsidies, out-of-pocket costs per prescription increased by 50% across insulin products available in both 2007 and 2017, from $39 to $57 per prescription, on average (Figure 3). For all insulin products available in 2017, out-of-pocket spending per prescription by non-LIS Part D enrollees ranged from $20 for Humulin N, an intermediate-acting insulin, to $128 for Humulin R U-500, a short-acting concentrated insulin (Table 1).
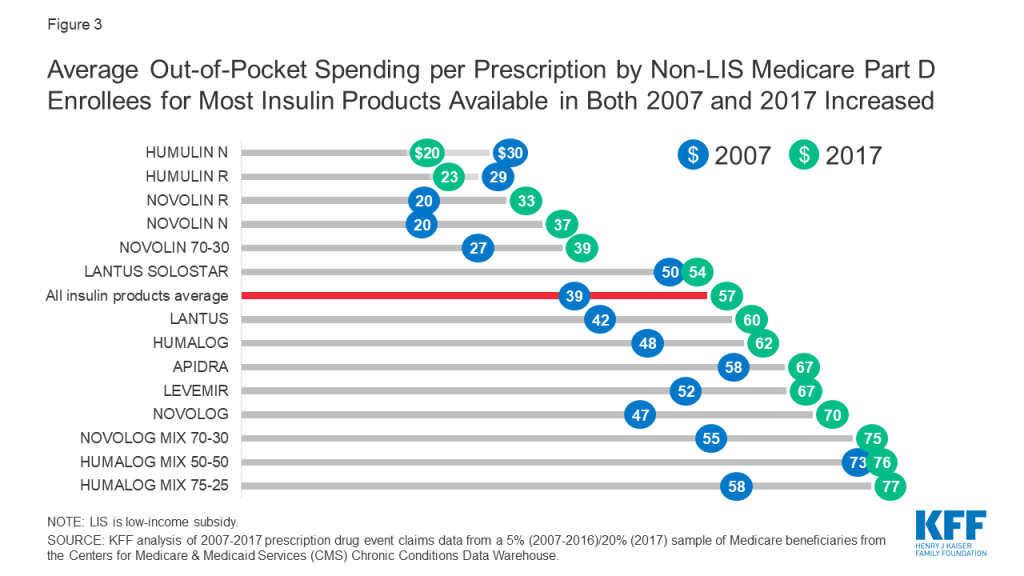
For some products, the percentage increase in out-of-pocket costs per prescription between 2007 and 2017 was higher than average, including an 87% increase for Novolin N and a 63% increase for Novolin R, both short-acting insulin products. In terms of actual out-of-pocket costs per prescription, these were among the lower-cost insulin products in both 2007 and 2017, and less commonly used than several other insulin products (Table 1).
Part D Formulary Coverage and Tier Placement of Insulin
Formulary Coverage and Tier Placement of Insulin Therapies
Formulary coverage and tier placement are key factors determining how much Medicare Part D enrollees without low-income subsidies pay out of pocket for their prescriptions, including insulin. In 2019, most insulin products were covered by at least 50% of all Part D plans, including both stand-alone prescription drug plans and Medicare Advantage drug plans (Table 2). Although coverage of insulin products was not universal, as for drugs in the so-called protected classes, it exceeds the minimum requirement that plans cover at least two chemically distinct drugs in each class.
Even when insulin products are covered by Part D plans, there is variation in tier placement and cost-sharing requirements when enrollees are in the initial coverage phase. A large number of plans placed insulin products on Tier 3, the preferred drug tier, with a $47 copayment per prescription during the initial coverage phase; more plans used this combination of tier placement and cost-sharing requirement for coverage of insulin than any other combination in 2019 (Table 3, Table 4).
This means that for Part D enrollees, the typical out-of-pocket cost for insulin when they are in the initial coverage phase is not pegged to the list price, as it would be with coinsurance. But some plans charged coinsurance for Tier 3, with a median coinsurance rate 25%, and a handful of plans placed some insulin products on Tier 4 (the non-preferred drug tier), with a median coinsurance rate of 48%. These coinsurance rates translate into varying out-of-pocket costs for insulin users depending on the underlying list price, as described below.
Variation in Out-of-Pocket Spending for Insulin Products by Tier Placement and Cost-Sharing Requirements
Because some insulin products are considerably more expensive than others, differences in tier placement and cost-sharing requirements can translate to wide variation in out-of-pocket spending for any given insulin therapy and from one insulin therapy to another (Figure 4).
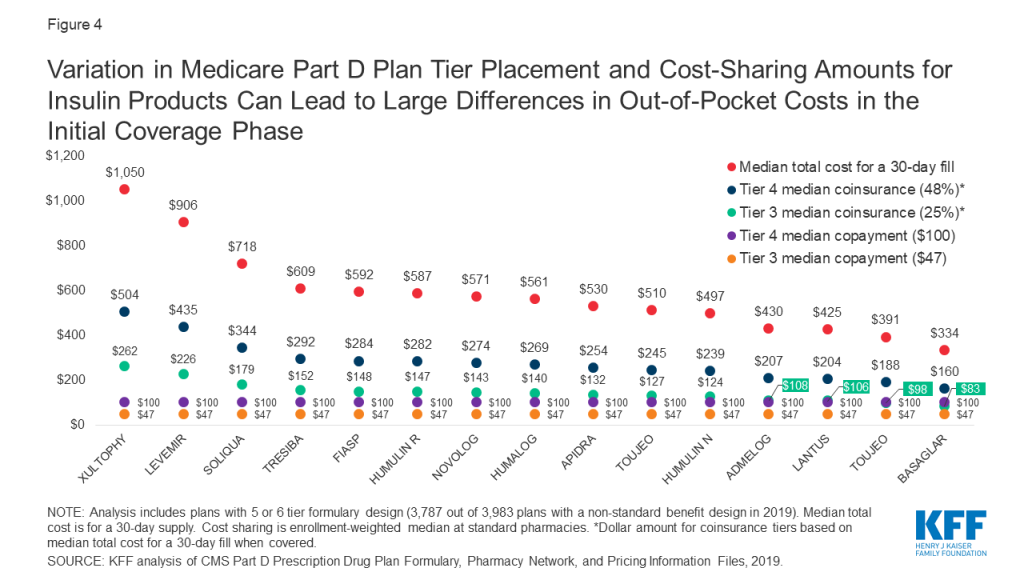
For example, Xultophy has the highest median total cost for a 30-day fill among all pen injector insulin products, at more than $1,000, while Basaglar has the lowest, at $334. A beneficiary enrolled in a Part D plan that placed these drugs on Tier 4 with the most common coinsurance requirement (48%) would pay more than $500 per prescription for Xultophy in the initial coverage phase of the Part D benefit, which is three times what they would pay for Basaglar ($160). Both amounts are more than they would pay for these products if their plan charged a $100 copayment for Tier 4 drugs, and substantially higher than if the drugs were covered on Tier 3 with a $47 copayment.
Case Study in Part D Formulary Coverage of Insulin: Lantus Solostar
Lantus Solostar was the top insulin product in terms of total out-of-pocket spending by Part D enrollees in 2017. In 2019, this drug was covered on Tier 3 for about 6 in 10 Part D enrollees in 2019 (63%), while for one third of enrollees (33%), this drug was not covered on their formulary. For users of Lantus whose plans covered this drug, most (59%) were subject to a Tier 3 copayment between $40 and $47, while 16% faced lower copays, and one-fourth (25%) faced higher out-of-pocket costs, either a copayment between $90 and $100 or coinsurance between 15% and 25%, which translates to $64 to $106 based on the median cost. Users of Lantus who were enrolled in a plan that did not cover this insulin therapy faced the full cost of $425 per prescription.
Variation in Out-of-Pocket Spending for Insulin Products by Part D Benefit Phase
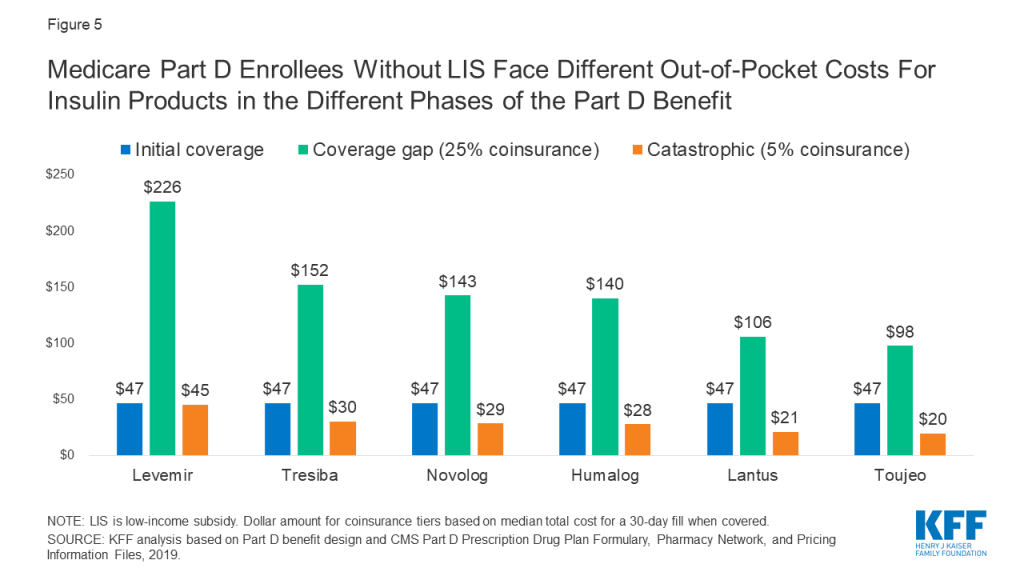
A distinctive feature of the Part D benefit is that out-of-pocket costs paid by non-LIS enrollees may not be uniform for each prescription fill from one month to another, depending on which phase of the benefit they are in. The Part D defined standard benefit has several phases where cost sharing for enrollees varies, including a deductible, an initial coverage phase, a coverage gap phase, and catastrophic coverage. Between the initial coverage phase and the coverage gap phase, cost sharing paid by non-LIS enrollees for any given drug switches from however much a plan charges for that drug based on its specific formulary design to a uniform 25% coinsurance rate, followed by a uniform 5% coinsurance rate that non-LIS enrollees pay in the catastrophic coverage phase. Based on the underlying list price of a medication, enrollees’ costs can increase substantially when they move from the initial coverage phase to the coverage gap phase.
For insulin products, this variation in cost sharing translates to varying out-of-pocket costs from one benefit phase to another. Figure 5 shows out-of-pocket costs for a selection of insulin products where in the initial coverage phase, the most common tier placement in 2019 was Tier 3 with a $47 copayment. For all of these products, out-of-pocket costs per prescription increase to $100 or more during the coverage gap phase, when cost sharing is based on a 25% coinsurance rate. For example, for Levemir, an enrollee would pay $47 in the initial coverage phase, but during the coverage gap phase (after total drug costs exceeded $3,820 in 2019), their out-of-pocket costs would rise to $226 per prescription, which is 25% of the $906 list price of Levemir. Out-of-pocket costs would decrease to $45, or 5% of the list price, during the catastrophic phase (after annual out-of-pocket spending exceeded $5,100 in 2019).
Trends in Insulin Prices
Among the 22 insulin therapies that have been on the market since at least 2013, 16 products had average annual price increases of more than 10% between 2013 and 2018, as measured by the change total Part D spending per dosage unit between these years, which far exceeded the 1.5% average annual growth in inflation over the same time period (Figure 6).
It is important to note that this spending measure, and total spending as reported in Part D claims, do not account for rebates, which are not publicly available at the individual product level. The Government Accountability Office has estimated rebates of 41% in 2016 for drugs in the therapeutic class that includes insulin. This is higher than the estimated 20% rebate for Part D covered drugs overall in 2016. While gross total Part D spending on insulin increased from $1.4 billion in 2007 to $13.1 billion in 2017, net total spending would be significantly lower after accounting for rebates.
The level of rebates offered by manufacturers for specific drugs influences coverage and tier placement decisions by Part D plans, which in turn affects out-of-pocket costs paid by enrollees. It has been suggested that the magnitude of list price increases for insulin products over time can be attributed to manufacturers offering increasingly larger rebates for these drugs in exchange for preferred formulary coverage.
Although CMS’s Part D pricing data does not account for rebates, it is relevant in considering out-of-pocket costs for people who use insulin, because in some cases what people pay out of pocket is based on the list price. As a result, percentage increases in prices for insulin products can translate to higher out-of-pocket spending over time.
Proposals to Address Insulin Costs for Medicare Beneficiaries
Innovation Center Model
In March 2020, the Administration announced a voluntary Innovation Center model, the “Part D Senior Savings Model,” that allows participating Part D plans to offer coverage of insulin for a flat monthly copayment of no more than $35 for enrollees not receiving low-income subsidies (LIS), starting in 2021. (Most LIS enrollees already pay a much lower copayment of no more than $8.95 for brands in 2020, so the model does not apply to them.) Participating Part D plans – enhanced plans only, not basic plans – can offer insulin products from participating manufacturers at a flat $35 copayment during all phases of the benefit (deductible, initial coverage, coverage gap, and catastrophic). Compared to basic Part D plans, enhanced plans can offer a lower deductible (the standard is $435 in 2020), reduced cost sharing (under the basic standard benefit, cost sharing is a uniform 25% coinsurance or actuarially equivalent amounts), and/or a higher initial coverage limit (the standard limit is $4,020 in 2020).
CMS recently announced that more than 1,750 enhanced Part D plans will participate in the model in 2021; for reference, this equals roughly 50% of all enhanced plans in 2020, including both Medicare Advantage and stand-alone drug plans and roughly 40% of all Part D plans this year. It is not yet known how many Part D plans of each type will be offered in 2021, or how many plans in total.
Each of the three major insulin manufacturers – Eli Lilly, Sanofi, and Novo Nordisk – has agreed to participate in the model for 2021. Participating manufacturers will continue to provide a 70% price discount in the coverage gap, but the discount will be calculated before the application of the supplemental benefit (i.e., the $35 monthly copay for insulin). Under current law, the manufacturer discount is calculated after the application of the supplemental benefit if a plan lowers cost sharing in the coverage gap. This creates a disincentive for plans to offer supplemental benefits in the coverage gap because plan liability increases and manufacturer liability decreases.
For example, for a drug that costs $500, under current law in a plan with no supplemental benefit, the manufacturer discount is $350 (70% of $500), beneficiaries pay $125 (25% of $500), and plans pay $25 (5% of $500) (see table below). If, instead, the plan charged a flat $35 copayment in the coverage gap, the plan’s total liability increases to $465 ($500-$35), and the manufacturer 70% discount is calculated off of the $35 remainder (i.e., after the application of the supplemental benefit). The Part D model modifies this calculation, thereby reducing the amount plans pay and increasing liability for manufacturers.
| Example of Part D Plan, Manufacturer, and Enrollee Costs For a Monthly Prescription Drug Fill in the Coverage Gap Under Current Law With and Without Supplemental Benefits and Under the Administration’s Part D Model | |||
| Under current law with no supplemental benefit | Under current law with a $35 monthly copay in coverage gap | Under Administration’s Part D model with a $35 monthly copay | |
| List price | $500 | $500 | $500 |
| Manufacturer gap discount | $350$500 * 70% | $24.50$35 * 70% | $350$500 * 70% |
| Enrollee cost | $125$500 * 25% | $10.50$35 – $24.50 | $35 |
| Plan cost | $25$500 * 5% | $465$500 – $35 | $115$500 – $350 – $35 |
Under the model, CMS expects that there will be more insulin claims filled in the coverage gap phase and fewer enrollees passing into the catastrophic coverage phase. This change, plus the changes to plan and manufacturer liability for insulin claims in the coverage gap, translates into an estimated $250 million in additional coverage gap discounts over five years, and similar savings for Medicare.
As an additional financial incentive for plans to participate in the model, participating plans can also receive financial protection through a narrower risk corridor, which would reduce potential losses if a plan’s actual costs are higher than expected. Currently, plans bear full liability for actual costs up to 5% higher than expected costs, beyond which higher costs are paid by both plans and the government. The model reduces the initial risk corridor threshold to 2.5% for participating plans that have a significantly greater number of insulin-dependent diabetics enrolled relative to other similar plan types. Higher costs can also be passed on to enrollees in the form of higher premiums, and CMS has estimated that the model will in fact increase enhanced plan premiums by approximately $1 per month due to higher plan liability.
Implications for Part D Enrollees
Based on our analysis of actual spending in 2017, we found that average annual out-of-pocket costs by Part D insulin users not receiving low-income subsidies was $580. If instead they had paid 12 months of $35 copays, as under the Administration’s model, annual costs would have been $420 for one insulin product, or $160 (28%) lower than average annual costs paid by non-LIS Part D insulin users in 2017. Paying a flat $35 copayment during the coverage gap phase could translate to meaningful savings on many insulin products, with typical list prices in the hundreds of dollars, which equates to out-of-pocket costs of $100 or more under the current benefit design where beneficiaries pay 25% coinsurance in the coverage gap phase.
Two key features of the model will limit its scope, however. The model relies on voluntary plan participation (though participation seems relatively robust for 2021), and only enhanced Part D plans can participate (though most enrollees – 80% of non-LIS Part D enrollees in non-employer plans – are in these enhanced plans in 2020). If Part D enrollment in 2021 is similar to 2020, one-fifth of non-LIS Part D enrollees (those who are in basic plans) would not stand to benefit from the model unless they switch from a basic to an enhanced plan, and some additional share of current enhanced plan enrollees who are in plans that have chosen not to participate would need to switch into a participating plan. Prior work shows that most enrollees do not switch during the open enrollment period, though it is possible that insulin users would be more willing switch plans if joining a participating plan would lower their out-of-pocket costs.
Another potential concern is that enhanced Part D plans have higher monthly premiums than basic Part D plans, and as mentioned earlier, CMS expects that participating enhanced plans will have even higher premiums based on higher plan costs. On average, the monthly premium for enhanced stand-alone drug plans in 2020 is $47, compared to $30 for basic stand-alone drug plans – or more than 50% higher. This translates to more than $200 in higher annual premiums, on average. Based on these average premiums amounts and our estimate of possible savings based on 2017 out-of-pocket costs, the higher premium for an enhanced plan could fully offset savings from lower out-of-pocket costs for one insulin product (though beneficiaries could see other savings in these enhanced plans, such as a lower deductible).
A final concern is that participating Part D plans do not have to cover all insulin products at the $35 monthly copayment amount, just one of each dosage form (vial, pen) and insulin type (rapid-acting, short-acting, intermediate-acting, and long-acting). For insulin products not covered by a participating plan, users of these products would not benefit from the model unless they switch to a product from a competing manufacturer. Making this switch could be difficult for insulin users who have been stabilized on a particular insulin medication (or medications) and for whom consistency in treatment is important in managing diabetes.
Legislative Proposals
Several bills have been introduced in the 116th Congress aiming to curb insulin costs for consumers. Some of these proposals target insulin directly, while others address drug prices as a whole and would therefore impact insulin prices. Proposals that target out-of-pocket costs specifically for insulin under Medicare Part D include the Lower Costs, More Cures Act (Rep. Walden, R-OR), which includes a provision to impose a $50 cap on monthly out-of-pocket costs incurred by Medicare beneficiaries for insulin and insulin supplies, and the Insulin Access for All Act (Rep. Rush, D-IL), which would eliminate all cost sharing for insulin and related supplies for Medicaid and Medicare beneficiaries.
Some current proposals rely on strategies that could help control prescription drug costs more generally to target insulin prices specifically. These strategies include importation, international reference pricing, and manufacturer rebates.
- The Affordable Insulin Act (Rep. Welch, D-VT) allows individuals, pharmacies, and wholesalers to import insulin from Canada and other qualifying countries.
- The End Price Gouging for Insulin Act (Sen. Merkley, D-OR) authorizes the government to establish reference prices for insulin products sold under any federal health program, including Medicare and Medicaid, based on existing prices in certain economically comparable countries, and to impose civil penalties on manufacturers that are non-compliant to these prices.
- The Insulin Price Reduction Act (Sen. Shaheen, D-NH) prohibits manufacturer rebates for insulin products unless they are passed on at the point of sale.
Several proposals target drug costs more broadly and would have effects on insulin prices and spending.
- The Prescription Drug Pricing Reduction Act (Sen. Grassley, R-IA, and Sen. Wyden, D-OR), limits Part D drug price increases to the rate of inflation, requiring manufacturers to pay rebates equal to any increase exceeding inflation rates.
- The Affordable Drug Manufacturing Act (Sen. Warren, D-MA) establishes a federal office to authorize and oversee the manufacture of generic drugs in case of shortages and lack of competition and to set fair market prices for such drugs. While the bill is not exclusively aimed at insulin prices, it targets insulin for manufacture due to lack of competition and high prices.
- The Elijah E. Cummings Lower Drug Costs Now Act, passed by the House of Representatives in December 2019, authorizes the government to negotiate prices for a limited number of high-cost, single source Part D drugs, and explicitly lists insulin among those drugs to be negotiated. This bill also includes an inflation rebate provision.
Conclusion
Rising prices for insulin have attracted increasing scrutiny from policymakers. The Administration’s new model that allows participating Part D plans to cap monthly out-of-pocket insulin costs for their enrollees will help some beneficiaries with their insulin costs, if they are enrolled in a participating Part D plan and use an insulin product covered by their plan with a $35 copayment. But the new model applies to only a subset of plans and enrollees, and not all insulin products have to be covered by all participating plans. The new model also does not address underlying insulin list price increases or affordability concerns for people who are uninsured or covered by other sources of coverage besides Medicare Part D.
Our analysis of Part D claims shows that higher insulin prices have led to an increase in out-of-pocket spending by Medicare beneficiaries for insulin, and higher out-of-pocket costs for some insulin products relative to others. At the same time, the typical formulary placement for insulin products in Part D plans insulates many people on Medicare from the high cost of this drug since many plans typically charge a flat dollar copayment for covered insulin products during the initial coverage phase. However, when insulin users reach the coverage gap and face 25% coinsurance, or when an insulin product is covered on a higher tier or not covered at all, out-of-pocket costs are higher.
It is important to note that this analysis does not include the cost of insulin supplies, nor does it include the cost of other drugs that people with diabetes might take for other conditions, so it is not the full picture of the out-of-pocket prescription drug cost burden facing insulin users in Medicare. These findings demonstrate why the cost of insulin and other prescription drugs is an ongoing concern for patients and public and private payers, and a pressing issue for policymakers.
This work was supported in part by Arnold Ventures. We value our funders. KFF maintains full editorial control over all of its policy analysis, polling, and journalism activities.
Juliette Cubanski, Tricia Neuman, and Sarah True are with KFF. Anthony Damico is an independent consultant.
Methods
Data and Methods
Our analysis of changes in list prices for insulin therapies covered by Medicare Part D is based on data from the CMS’s two most recent releases of the Medicare Part D drug spending dashboard (March 2019 and January 2020). Changes in list prices for insulin products available between 2013 and 2018 are measured by five-year (2013-2018) changes in average spending per dosage unit amounts reported in the dashboard. We compare these changes to the rate of increase in the Consumer Price Index for all urban consumers (CPI-U) over the same time period, based on the July 2013-July 2018 percentage change in the CPI-U.
Our analysis of out-of-pocket spending on insulin therapies covered by Medicare Part D, in the aggregate and average per insulin user and product, is based on 2007-2017 prescription drug event claims data from a sample of Medicare beneficiaries (5% sample for 2007-2016, 20% sample for 2017) from the Centers for Medicare & Medicaid Services (CMS) Chronic Conditions Data Warehouse.
Our analysis of formulary coverage of insulin products in Part D plans is based on data from the Q4 2018 Part D Prescription Drug Plan Formulary, Pharmacy Network, and Pricing Information Files, which includes formulary data for 2019 for 46 insulin products (see Table 2 for a complete product listing). Our analysis includes all Part D plans with a 5 or 6 tier formulary design, including stand-alone prescription drug plans and Medicare Advantage drug plans. We calculate out-of-pocket costs for covered insulin products based on the enrollment-weighted median cost sharing at pharmacies offering standard (non-preferred) cost sharing. To illustrate the impact of differences in tier placement and cost-sharing requirements for insulin products, we calculate the median total cost for a 30-day fill at standard cost-sharing pharmacies for several insulin therapies as reported in the pricing information file, and calculate the out-of-pocket cost based on different tier placement and cost-sharing requirements.
Estimates of the share of Medicare beneficiaries with diabetes is based on our analysis of 2000 and 2017 data from the CMS Medicare Current Beneficiary Survey (MCBS). The MCBS asks respondents whether they have ever had any of a series of illnesses or conditions, including diabetes. Their responses are coded affirmatively if the respondent had at some time been diagnosed with the condition, even if it had been corrected by time or treatment. The condition must have been reported by the respondent as diagnosed by a physician, and not by the respondent.
Tables
| Table 1: Number of Users and Out-of-Pocket Spending on Insulin Products in Medicare Part D, 2007 and 2017 | ||||
| Number of users | Average out-of-pocket spending perprescription by non-LIS enrollees | |||
| Insulin products | 2007 | 2017 | 2007 | 2017 |
| All insulin products, average | 1,642,880 | 3,136,240 | $39 | $57 |
| Afrezza | N/A | 775 | N/A | 86 |
| Apidra | 12,260 | 3,355 | 58 | 67 |
| Apidra Solostar | N/A | 7,765 | N/A | 60 |
| Basaglar Kwikpen U-100 | N/A | 24,485 | N/A | 64 |
| Humalog | 205,700 | 270,780 | 48 | 62 |
| Humalog Kwikpen U-100 | N/A | 411,895 | N/A | 62 |
| Humalog Kwikpen U-200 | N/A | 23,640 | N/A | 70 |
| Humalog Mix 50-50 | 3,900 | 1,895 | 73 | 76 |
| Humalog Mix 50-50 Kwikpen | N/A | 5,700 | N/A | 78 |
| Humalog Mix 75-25 | 67,180 | 28,720 | 58 | 77 |
| Humalog Mix 75-25 Kwikpen | N/A | 67,655 | N/A | 78 |
| Humulin 70-30 | 165,640 | 75,070 | 32 | 43 |
| Humulin 70/30 Kwikpen | N/A | 24,860 | N/A | 63 |
| Humulin N | 150,060 | 119,445 | 30 | 20 |
| Humulin N Kwikpen | N/A | 27,335 | N/A | 35 |
| Humulin R | 133,800 | 97,365 | 29 | 23 |
| Humulin R U-500 | N/A | 14,240 | N/A | 128 |
| Humulin R U-500 Kwikpen | N/A | 13,320 | N/A | 95 |
| Lantus | 775,740 | 586,770 | 42 | 60 |
| Lantus Solostar | 28,220 | 1,108,460 | 50 | 54 |
| Levemir | 64,120 | 187,005 | 52 | 67 |
| Levemir Flextouch | N/A | 508,655 | N/A | 59 |
| Novolin 70-30 | 207,440 | 111,895 | 27 | 39 |
| Novolin N | 159,580 | 76,890 | 20 | 37 |
| Novolin R | 254,240 | 90,410 | 20 | 33 |
| Novolog | 247,680 | 286,065 | 47 | 70 |
| Novolog Flexpen | N/A | 543,835 | N/A | 70 |
| Novolog Mix 70-30 | 117,220 | 41,605 | 55 | 75 |
| Novolog Mix 70-30 Flexpen | N/A | 96,425 | N/A | 84 |
| Soliqua 100-33 | N/A | 3,425 | N/A | 68 |
| Toujeo Solostar | N/A | 190,805 | N/A | 63 |
| Tresiba Flextouch U-100 | N/A | 63,500 | N/A | 55 |
| Tresiba Flextouch U-200 | N/A | 89,275 | N/A | 70 |
| Xultophy 100-3.6 | N/A | 1,330 | N/A | 83 |
| NOTE: LIS is low-income subsidy. N/A indicates drug not available in year.SOURCE: KFF analysis of 2007-2017 prescription drug event claims data from a 5% (2007-2016)/20% (2017) sample of Medicare beneficiaries from the Centers for Medicare & Medicaid Services (CMS) Chronic Conditions Data Warehouse. | ||||
| Table 2: Formulary Coverage of Insulin Products in Medicare Part D Plans, 2019 | ||||||||||||||
| Part D plans placing drug on formulary | Part D enrollees with formulary coverage | |||||||||||||
| Drug name | Product type | Number | Share(out of 3,787) | Number(in millions) | Share (out of 37.0 million) | Median total cost for 30-day prescription | ||||||||
| Admelog Solostar | Pen injector | 124 | 3% | 1.4 | 4% | $430 | ||||||||
| Admelog | Injectable solution | 124 | 3% | 1.4 | 4% | $225 | ||||||||
| Afrezza (12 units) | Inhalant powder | 98 | 3% | 1.4 | 4% | $937 | ||||||||
| Afrezza (8 units) | Inhalant powder | 98 | 3% | 1.4 | 4% | $626 | ||||||||
| Afrezza (4 units) | Inhalant powder | 98 | 3% | 1.4 | 4% | $314 | ||||||||
| Afrezza Titration Pack | Inhalant powder | 98 | 3% | 1.4 | 4% | $937 | ||||||||
| Afrezza 180 Titration Pack | Inhalant powder | 98 | 3% | 1.4 | 4% | $1,249 | ||||||||
| Apidra Solostar | Pen injector | 223 | 6% | 1.8 | 5% | $530 | ||||||||
| Apidra | Injectable solution | 223 | 6% | 1.8 | 5% | $277 | ||||||||
| Basaglar | Pen injector | 1,241 | 33% | 13.9 | 38% | $334 | ||||||||
| Fiasp Flextouch | Pen injector | 2,004 | 53% | 22.0 | 59% | $592 | ||||||||
| Fiasp | Injectable solution | 2,004 | 53% | 22.0 | 59% | $307 | ||||||||
| Humalog | Injectable solution | 1,932 | 51% | 16.6 | 45% | $87 | ||||||||
| Humalog | Pen injector | 1,923 | 51% | 16.4 | 44% | $561 | ||||||||
| Humalog | Cartridge | 1,918 | 51% | 16.3 | 44% | $540 | ||||||||
| Humalog U-100 Kwikpen | Pen injector | 1,890 | 50% | 16.3 | 44% | $567 | ||||||||
| Humalog U-200 Kwikpen | Pen injector | 1,853 | 49% | 16.2 | 44% | $450 | ||||||||
| Humalog Mix 75/25 | Injectable suspension | 1,932 | 51% | 16.6 | 45% | $301 | ||||||||
| Humalog Mix 50/50 | Injectable suspension | 1,932 | 51% | 16.6 | 45% | $301 | ||||||||
| Humalog Mix 75/25 Kwikpen | Pen injector | 1,923 | 51% | 16.4 | 44% | $562 | ||||||||
| Humalog Mix 50/50 Kwikpen | Pen injector | 1,923 | 51% | 16.4 | 44% | $561 | ||||||||
| Humulin | Pen injector | 1,865 | 49% | 16.3 | 44% | $498 | ||||||||
| Humulin | Injectable suspension | 1,852 | 49% | 16.4 | 44% | $158 | ||||||||
| Humulin N Kwikpen | Pen injector | 1,865 | 49% | 16.3 | 44% | $497 | ||||||||
| Humulin N | Injectable suspension | 1,852 | 49% | 16.4 | 44% | $158 | ||||||||
| Humulin R U-500 | Injectable solution | 3,648 | 96% | 35.6 | 96% | $1,518 | ||||||||
| Humulin R U-500 Kwiken | Pen injector | 3,607 | 95% | 35.3 | 95% | $587 | ||||||||
| Humulin R | Injectable solution | 1,852 | 49% | 16.4 | 44% | $156 | ||||||||
| Lantus | Injectable solution | 2,798 | 74% | 24.9 | 67% | $283 | ||||||||
| Lantus Solostar | Pen injector | 2,793 | 74% | 24.9 | 67% | $425 | ||||||||
| Levemir Flextouch | Pen injector | 3,368 | 89% | 33.3 | 90% | $906 | ||||||||
| Levemir | Injectable solution | 3,368 | 89% | 33.3 | 90% | $604 | ||||||||
| Novolin 70/30 | Injectable suspension | 2,189 | 58% | 22.8 | 62% | $141 | ||||||||
| Novolin N | Injectable suspension | 2,189 | 58% | 22.8 | 62% | $141 | ||||||||
| Novolin R | Injectable solution | 2,189 | 58% | 22.8 | 62% | $141 | ||||||||
| Novolog Flexpen | Pen injector | 2,319 | 61% | 23.1 | 62% | $571 | ||||||||
| Novolog | Cartridge | 2,319 | 61% | 23.1 | 62% | $549 | ||||||||
| Novolog | Injectable solution | 2,319 | 61% | 23.1 | 62% | $296 | ||||||||
| Novolog Mix 70/30 Flexpen | Pen injector | 2,319 | 61% | 23.1 | 62% | $571 | ||||||||
| Novolog Mix 70/30 | Injectable suspension | 2,319 | 61% | 23.1 | 62% | $307 | ||||||||
| Soliqua 100-33 | Pen injector | 2,657 | 70% | 30.7 | 83% | $718 | ||||||||
| Toujeo Solostar | Pen injector | 2,779 | 73% | 24.7 | 67% | $391 | ||||||||
| Toujeo Max Solostar | Pen injector | 2,643 | 70% | 24.5 | 66% | $510 | ||||||||
| Tresiba Flextouch U-200 | Pen injector | 2,953 | 78% | 31.0 | 84% | $609 | ||||||||
| Tresiba Flextouch U-100 | Pen injector | 2,953 | 78% | 31.0 | 84% | $508 | ||||||||
| Xultophy 100-3.6 | Pen injector | 2,168 | 57% | 22.9 | 62% | $1,050 | ||||||||
| NOTE: Analysis includes plans with 5 or 6 tier formulary design (3,787 out of 3,983 plans with a non-standard benefit design in 2019).SOURCE: KFF analysis of CMS Part D Prescription Drug Plan Formulary, Pharmacy Network, and Pricing Information Files, 2019. | ||||||||||||||
| Table 3: Typical Formulary Placement of Insulin Products in Medicare Part D Plans, 2019 | ||||||
| Median formulary placement when covered | Cost-sharing amounts | |||||
Drug name | Product type | Tier | Cost-sharing type | Initial coverage phase | Coverage gap phase(based on 25% coinsurance) | Catastrophic coverage phase(based on 5% coinsurance) |
| Admelog Solostar | Pen injector | 4 | copayment | $100 | $108 | $22 |
| Admelog | Injectable solution | 4 | copayment | $100 | $56 | $11 |
| Afrezza (12 units) | Inhalant powder | 4 | copayment | $100 | $234 | $47 |
| Afrezza (8 units) | Inhalant powder | 4 | copayment | $100 | $157 | $31 |
| Afrezza (4 units) | Inhalant powder | 4 | copayment | $100 | $79 | $16 |
| Afrezza Titration Pack | Inhalant powder | 4 | copayment | $100 | $234 | $47 |
| Afrezza 180 Titration Pack | Inhalant powder | 4 | copayment | $100 | $312 | $62 |
| Apidra Solostar | Pen injector | 4 | copayment | $100 | $132 | $26 |
| Apidra | Injectable solution | 4 | copayment | $100 | $69 | $14 |
| Basaglar | Pen injector | 3 | copayment | $47 | $83 | $17 |
| Fiasp Flextouch | Pen injector | 3 | copayment | $47 | $148 | $30 |
| Fiasp | Injectable solution | 3 | copayment | $47 | $77 | $15 |
| Humalog | Injectable solution | 3 | copayment | $47 | $22 | $4 |
| Humalog | Pen injector | 3 | copayment | $47 | $140 | $28 |
| Humalog | Cartridge | 3 | copayment | $47 | $135 | $27 |
| Humalog U-100 Kwikpen | Pen injector | 3 | copayment | $47 | $142 | $28 |
| Humalog U-200 Kwikpen | Pen injector | 3 | copayment | $47 | $112 | $22 |
| Humalog Mix 75/25 | Injectable suspension | 3 | copayment | $47 | $75 | $15 |
| Humalog Mix 50/50 | Injectable suspension | 3 | copayment | $47 | $75 | $15 |
| Humalog Mix 75/25 Kwikpen | Pen injector | 3 | copayment | $47 | $140 | $28 |
| Humalog Mix 50/50 Kwikpen | Pen injector | 3 | copayment | $47 | $140 | $28 |
| Humulin | Pen injector | 3 | copayment | $47 | $124 | $25 |
| Humulin | Injectable suspension | 3 | copayment | $47 | $39 | $8 |
| Humulin N Kwikpen | Pen injector | 3 | copayment | $47 | $124 | $25 |
| Humulin N | Injectable suspension | 3 | copayment | $47 | $39 | $8 |
| Humulin R U-500 | Injectable solution | 5 | coinsurance | 29% ($440) | $379 | $76 |
| Humulin R U-500 Kwiken | Pen injector | 5 | coinsurance | 29% ($170) | $147 | $29 |
| Humulin R | Injectable solution | 3 | copayment | $47 | $39 | $8 |
| Lantus | Injectable solution | 3 | copayment | $47 | $71 | $14 |
| Lantus Solostar | Pen injector | 3 | copayment | $47 | $106 | $21 |
| Levemir Flextouch | Pen injector | 3 | copayment | $47 | $226 | $45 |
| Levemir | Injectable solution | 3 | copayment | $47 | $151 | $30 |
| Novolin 70/30 | Injectable suspension | 3 | copayment | $47 | $35 | $7 |
| Novolin N | Injectable suspension | 3 | copayment | $47 | $35 | $7 |
| Novolin R | Injectable solution | 3 | copayment | $47 | $35 | $7 |
| Novolog Flexpen | Pen injector | 3 | copayment | $47 | $143 | $29 |
| Novolog | Cartridge | 3 | copayment | $47 | $137 | $27 |
| Novolog | Injectable solution | 3 | copayment | $47 | $74 | $15 |
| Novolog Mix 70/30 Flexpen | Pen injector | 3 | copayment | $47 | $143 | $29 |
| Novolog Mix 70/30 | Injectable suspension | 3 | copayment | $47 | $77 | $15 |
| Soliqua 100-33 | Pen injector | 3 | copayment | $47 | $179 | $36 |
| Toujeo Solostar | Pen injector | 3 | copayment | $47 | $98 | $20 |
| Toujeo Max Solostar | Pen injector | 3 | copayment | $47 | $127 | $25 |
| Tresiba Flextouch U-200 | Pen injector | 3 | copayment | $47 | $152 | $30 |
| Tresiba Flextouch U-100 | Pen injector | 3 | copayment | $47 | $127 | $25 |
| Xultophy 100-3.6 | Pen injector | 3 | copayment | $47 | $262 | $52 |
| NOTE: Analysis includes plans with 5 or 6 tier formulary design (3,787 out of 3,983 plans with a non-standard benefit design in 2019). Typical formulary placement refers to formulary tier, copayment type, and cost-sharing amount most often used by Part D plans that cover given insulin product. Cost-sharing amounts based on coinsurance are calculated based on median total cost for 30-day prescription (see Table 1).SOURCE: KFF analysis of CMS Part D Prescription Drug Plan Formulary, Pharmacy Network, and Pricing Information Files, 2019. | ||||||
| Table 4: Formulary Coverage, Tier Placement, and Cost Sharing of Insulin Products in Medicare Part D Plans, 2019 | |||||||
| Plans charging copayments | Plans charging coinsurance | ||||||
| Formulary tier | Number of insulin products | Percent of plans / enrollees with at least one insulin product covered | Enrollment-weighted median copayment | Number of insulin products | Percent of plans / enrollees with at least one insulin product covered | Enrollment-weighted median copayment | |
| 1 | 32 | 0.4% / 0.2% | $5 | n/a | |||
| 2 | 36 | 7.4% / 17.8% | $20 | 23 | 0.3% / <0.1% | 25% | |
| 3 | 46 | 86.8% / 84.2% | $47 | 39 | 12.3% / 15.0% | 25% | |
| 4 | 46 | 8.9% / 5.9% | $100 | 46 | 7.7% / 4.5% | 48% | |
| 5 | 3 | 0.2% / 0.2% | $0 | 5 | 52.2% / 57.6% | 30% | |
| 6 | 34 | 2.5% / 0.85 | $11 | 21 | 0.1% / <0.1% | 0% | |
| NOTE: Analysis includes plans with 5 or 6 tier formulary design (3,787 out of 3,983 plans with a non-standard benefit design in 2019).SOURCE: KFF analysis of CMS Part D Prescription Drug Plan Formulary, Pharmacy Network, and Pricing Information Files, 2019. | |||||||