Raising Medicare Premiums for Higher-Income Beneficiaries: Assessing the Implications
Issue Brief
As policymakers consider ways to slow the growth in Medicare spending as part of broader efforts to reduce the federal debt or offset the cost of other spending priorities, some have proposed to increase beneficiary contributions through higher Medicare premiums.1 Some proposals would increase Medicare premiums paid by all beneficiaries, while others would raise premiums only for beneficiaries with higher incomes. This issue brief explains provisions of current law that impose income-related premiums under Medicare Part B and Part D, describes recent proposals to modify these requirements, and analyzes the potential implications for the Medicare population. Under current law, monthly premiums for most people on Medicare equal 25 percent of average per capita Part B expenditures (for Part B enrollees) and 25.5 percent of average per capita Part D expenditures (for Part D drug plan enrollees). The relatively small share of beneficiaries with higher incomes (more than $85,000 for individuals and $170,000 for couples) are required to pay higher premiums for Medicare Part B and Part D, ranging from 35 percent to 80 percent of per capita costs, depending on their income. In 2013, 5 percent of Part B enrollees paid the higher income-related Part B premium, and 4 percent of Part D enrollees paid the income-related Part D premium. Modifications to Medicare’s current income-related premiums have been proposed recently by several policymakers and groups, including the Obama Administration as part of the President’s Fiscal Year (FY) 2013 and FY 2014 budgets, the Bipartisan Policy Center (BPC),2 the Center for American Progress (CAP),3 and the Moment of Truth Project4 (headed by Erskine Bowles and Alan Simpson, co-chairs of the National Commission on Fiscal Responsibility and Reform) (Table 1).5 In general, these proposals would reduce Medicare spending by increasing the share of beneficiaries paying income-related premiums relative to current law, increasing the amount of premiums they are required to pay, or both. This brief includes an analysis of a proposal to modify current-law income thresholds and freeze these thresholds until 25 percent of all Medicare beneficiaries are required to pay the income-related premium, based on the parameters in the President’s FY 2014 budget. As described more fully below, this proposal is estimated to result in higher Medicare premiums for beneficiaries with incomes at or above $45,600 for individuals and $91,300 for couples (in 2013 dollars), once fully implemented in 2036—the year when 25 percent of beneficiaries are estimated to be paying income-related premiums, according to this analysis. The Congressional Budget Office has estimated that the income-related premium proposal in the President’s FY 2014 budget would reduce Medicare spending by $56.3 billion between 2014 and 2023.6 Estimates of 10-year Medicare savings for the other proposals are: $25 billion (CAP), $30.2 billion (President’s FY 2013 budget7 ); $65 billion (Moment of Truth), and $66.2 billion (BPC).
Income-Related Medicare Premiums Under Current Law
Part B Premiums
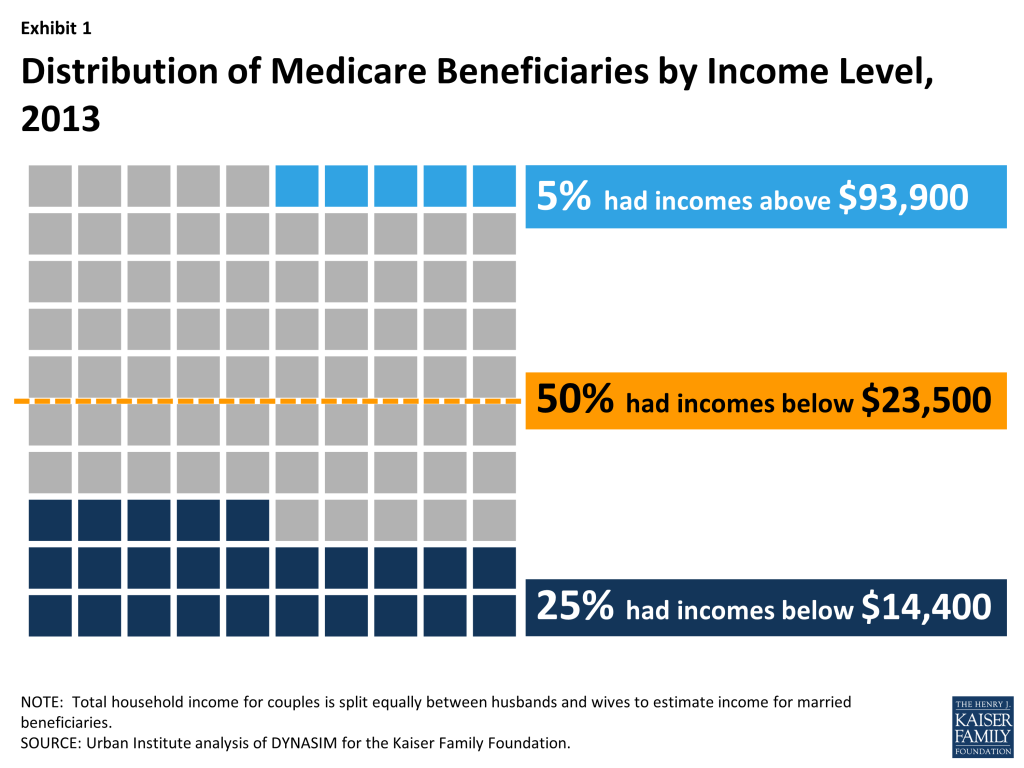
Beneficiaries enrolled in Part B are generally required to pay a monthly premium ($104.90 in 2014). Medicare Part B premiums are calculated as a share of Part B program costs. For most beneficiaries, Part B premiums are set to equal 25 percent of the projected annual Part B expenditures per enrollee ages 65 and over and the remaining 75 percent of Part B program costs is funded by general revenues.8 Until 2007, all Medicare beneficiaries enrolled in Part B were subject to the same monthly Part B premium. The Medicare Modernization Act (MMA) of 2003 included a provision that required higher-income Medicare beneficiaries to pay a greater share of Part B costs, beginning in 2007. The distribution of income among Medicare beneficiaries is highly skewed, with half estimated to have income of about $23,500 or less in 2013 and the top 5 percent having income of $93,900 or more (Exhibit 1).9 The MMA indexed the income thresholds to increase annually with the rate of inflation (CPI-U), so that about 5 percent of all Medicare beneficiaries would pay the higher, income-related premium each year.
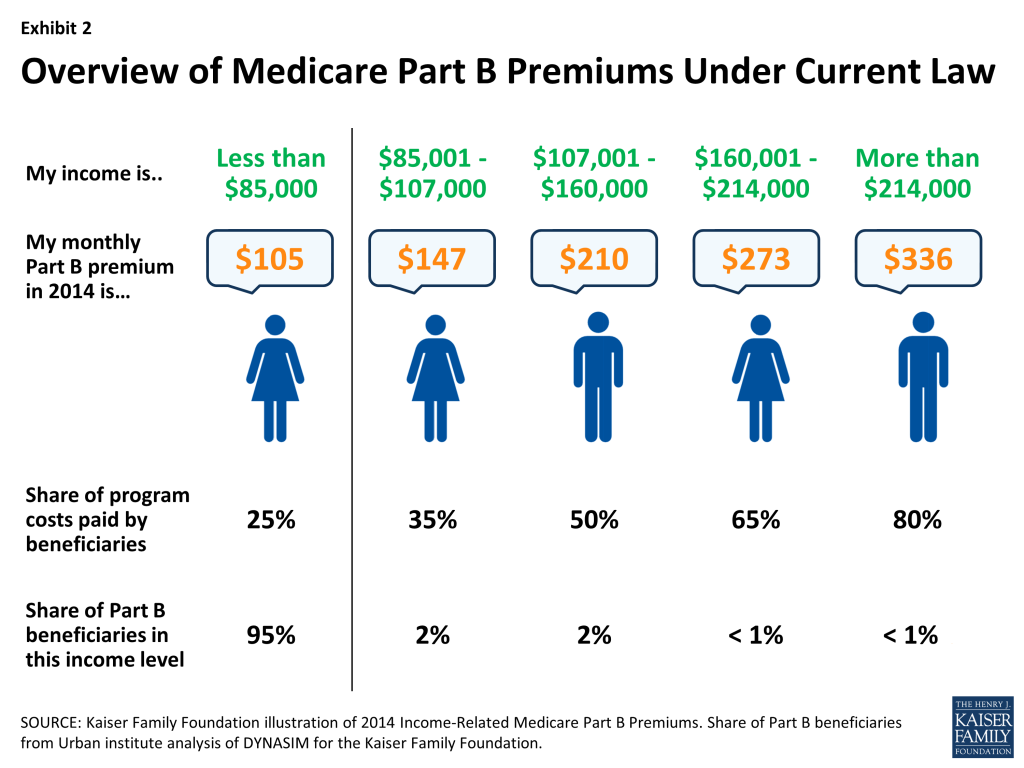
Beneficiaries are required to pay the higher Part B premium in 2014 if their income is equal to or greater than $85,000 for an individual and $170,000 for a couple. Part B premiums for beneficiaries with incomes above the threshold range from 35 percent to 80 percent of Part B program costs, depending on their income (Exhibit 2).
The 2010 Affordable Care Act (ACA) modified current law related to the Part B income-related premium.10 The law imposed a freeze on the income thresholds that were in place in 2010 from 2011 through 2019, rather than allowing the thresholds to rise with inflation.11 This provision will increase the number and share of beneficiaries who will pay the higher income-related Part B premium over these years. In 2020 and subsequent years, the income thresholds will once again be indexed to inflation as if they had not been frozen between 2011 and 2019. Under current law12 :
- In 2013, 5.0 percent of Part B enrollees (2.4 million beneficiaries) are estimated to pay the income-related Part B premium.13
- The share of Medicare beneficiaries required to pay the income-related Part B premium is projected to rise from 5.0 percent in 2013 (2.4 million) to 9.6 percent in 2019 (5.4 million), before falling back to 6.4 percent (3.7 million) after the income thresholds are once again adjusted for inflation in 2020 and as if they had not been frozen at 2010 levels in 2011 (Table 2).
- In 2014, the income-related Part B premium ranges from $146.90 per month (for individuals with incomes between $85,001 and $107,000, and couples with incomes between $170,001 and $214,000) to $335.70 per month (for individuals with incomes above $214,000, and couples with incomes above $428,000), depending on beneficiaries’ income.14 By 2022, OACT projects income-related Part B premium amounts will range from $222.70 to $513.60 per month, assuming no change in current law (Table 3).15
Part D Premiums
Higher-income Medicare beneficiaries enrolled in Part D prescription drug plans are also required to pay higher Part D premiums as a result of changes made in the ACA. In the years after the Medicare Part D benefit was implemented in 2006, but prior to 2011, premiums varied by drug plan but all enrollees in the same plan within the same region paid the same premium.16 The monthly premium paid by enrollees was set to cover 25.5 percent of the national average cost of the standard drug benefit, based on bids submitted by Part D plans for their expected benefit payments. Medicare subsidized the remaining 74.5 percent of the Part D premium. The ACA modified these features by establishing an income-related premium for Part D coverage, which took effect in 2011. The Part D income-related monthly adjustment amount (IRMAA) is calculated as a percent of the national average cost of the standard drug benefit, using the same surcharge percentages (35 percent to 80 percent) and income thresholds ($85,000 for an individual and $170,000 for a couple) as for Part B. Similar to the income thresholds for Part B premiums, the income thresholds for the Part D income-related premium are fixed until 2019; that is, they are not indexed to increase annually.17 Unlike Part B, actual premium amounts paid by higher-income Part D enrollees depend on the particular plan they select and the premium charged for that plan. The national average monthly Part D premium in 2014, according to the Centers for Medicare & Medicaid Services (CMS), is $32.42,18 although actual monthly premiums for stand-alone prescription drug plans (PDPs) vary across plans and regions (from a low of $12.50 to a high of $174.70 in 2014).19 The Part D income-related monthly adjustment amount is collected separately from the premium that higher-income enrollees pay to their Part D plan. The income-related adjustment amount is withheld from the enrollee’s Social Security or Railroad Retirement benefit payments in the same manner that the Part B premium is withheld.20 Under current law21 :
- Four percent of all Part D enrollees22 (1.5 million beneficiaries) are subject to the income-related Part D premium in 2013.
- By 2019, approximately 9 percent of all Part D enrollees (4.0 million beneficiaries) are projected to be subject to the income-related Part D premium. If the income thresholds are adjusted for inflation in 2020 and beyond, as scheduled to occur under current law, the share of Part D enrollees paying the income-related Part D premium is estimated to be 6 percent in 2020 (2.8 million enrollees).
- Based on the 2014 national average Part D premium of $32.42 and 2014 income-related monthly adjustment amounts ranging from $12.10 to $69.30,23 the income-related Part D premiums range from $45 to $102 per month in 2014. Based on projections, the income-related Part D premium is estimated to range from $78 to $177 per month in 2022, assuming a national average premium of $57 per month that year and no change in current law (Table 4).24
Fewer beneficiaries pay the income-related Part D premium than the income-related Part B premium because fewer beneficiaries are enrolled in Part D plans than in Part B. Also, a smaller number of Part D enrollees have relatively high incomes because higher-income Medicare beneficiaries are more likely to receive prescription drug coverage from an employer-sponsored retiree health plan.25 ,26
Implications of Proposed Changes to Medicare’s Income-Related Premiums
Several policymakers and groups have proposed modifications to Medicare’s current income-related premiums, including the Obama Administration as part of the President’s Fiscal Year (FY) 2013 and FY 2014 budgets, the Bipartisan Policy Center (BPC), the Center for American Progress (CAP), and the Moment of Truth Project (headed by Erskine Bowles and Alan Simpson, co-chairs of the National Commission on Fiscal Responsibility and Reform) (see Table 1 for a detailed comparison of these proposals). Each of the proposals increases the share of beneficiaries that would be required to pay the income-related Part B and D premiums relative to current law, up to 10 percent of all beneficiaries (CAP), 15 percent (initially) (Moment of Truth), 17 percent (BPC), and 25 percent (President’s FY 2013 and 2014 budgets). The CAP, Moment of Truth, and President’s budget proposals also increase the share of premiums that would be paid by higher-income beneficiaries. The President’s FY 2014 proposal also expands the number of levels of income-related premium payments. This analysis focuses on the parameters outlined in the President’s FY 2014 budget proposal. Under this proposal, the current freeze on income thresholds enacted in the ACA would be extended beyond 2019 until 25 percent of beneficiaries pay an income-related premium. In addition, beginning in 2017, this proposal would increase the lowest income-related premium percentage by five percentage points, from 35 percent to 40 percent; increase the highest amount from 80 percent to 90 percent; and expand the number of tiers of income-related premiums from four under current law (35, 50, 65, and 80 percent) to nine (40, 46.5, 53.0, 59.5, 66.0, 72.5, 79.0, 85.5, and 90.0 percent). The proposal also lowers the income threshold for those paying the highest income-related premium amount from $214,000 to $196,000 (see Table 1 for the income amounts corresponding to the income-related premium percentages under current law and the President’s proposal). This analysis determines the year in which 25 percent of beneficiaries would pay income-related premiums under the President’s proposal, converts the income thresholds in that year into 2013 dollars, and estimates the increase in premiums that higher-income beneficiaries would pay based on the proposed income thresholds and higher premium percentages. The analysis incorporates estimates and projections from the DYNASIM microsimulation model developed by researchers at the Urban Institute (see Methodology below for details).
How many beneficiaries would be subject to higher premiums, and by when?
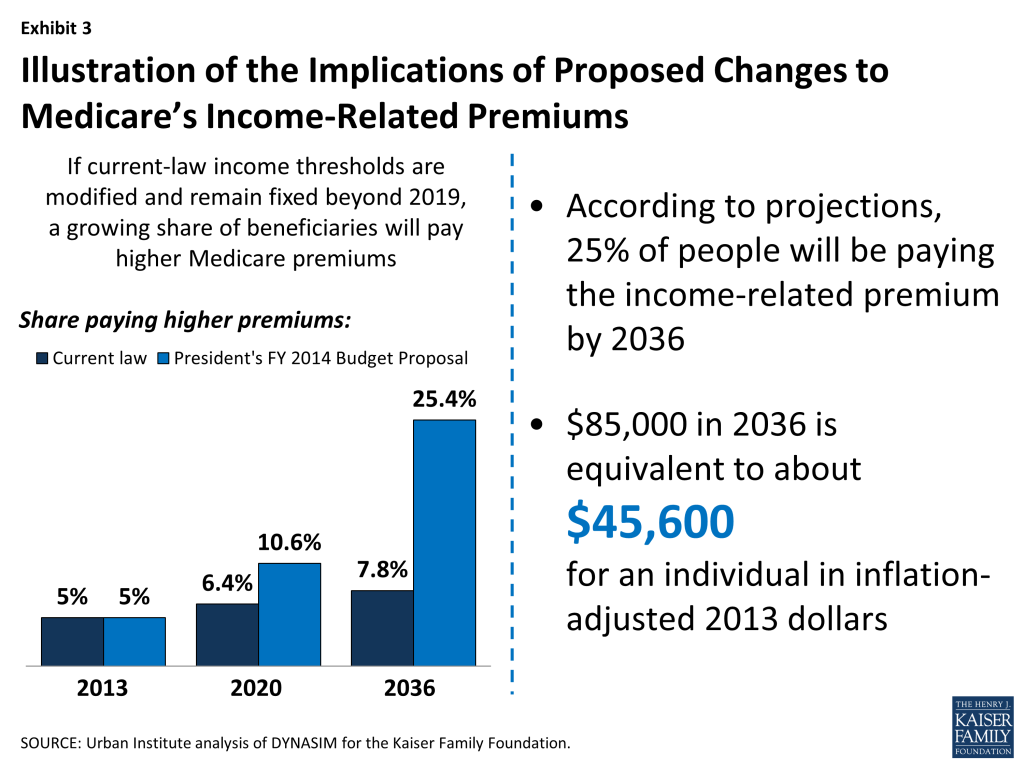
Under the proposed income-related premium thresholds, it is estimated that by 2036, just over one-quarter of all Medicare beneficiaries enrolled in Part B (20.4 million beneficiaries) will be required to pay the income-related Part B premium, because their incomes are projected to exceed $85,000 per individual or $170,000 per couple that year. The income thresholds for the income-related Part B and D premiums in 2036 are equivalent to about $45,600 for individuals and $91,300 for couples in today’s inflation-adjusted dollars (Exhibit 3). In other words, if the proposal to have 25 percent of beneficiaries pay the income-related premium was implemented in 2013, rather than reached gradually by holding the income thresholds constant over time, beneficiaries with incomes at or above $45,600 for individuals and $91,300 for couples would pay higher income-related Medicare premiums in 2013.
By design, these proposals would gradually increase the number and share of people on Medicare paying an income-related premium (Exhibit 4). For example, under the President’s FY 2014 budget proposal, it is estimated that:
- In 2020, 10.6 percent of all Medicare beneficiaries (6.2 million) would pay an income-related premium, compared to 6.4 percent (3.7 million) under current law—an increase of 2.5 million beneficiaries who would be paying higher premiums that year.
- In 2025, 14.6 percent of all Medicare beneficiaries (9.8 million) would pay an income-related premium, compared to 6.8 percent (4.6 million) under current law—an increase of 5.2 million beneficiaries who would be paying higher premiums that year.
- In 2030, 18.9 percent of all Medicare beneficiaries (14.0 million) would pay an income-related premium, compared to 7.2 percent (5.3 million) under current law—an increase of 8.7 million beneficiaries who would be paying higher premiums that year.
- In 2036, 25.4 percent of all Medicare beneficiaries (20.4 million) would pay an income-related premium, compared to 7.8 percent (6.3 million) under current law—an increase of 14.1 million beneficiaries who would be paying higher premiums that year.

As might be expected, these findings are sensitive to assumptions about the future growth of the economy (see the methodology below for assumptions incorporated in the intermediate-, low-, and high-cost scenarios):
- If the economy grows at a more rapid rate than is currently projected under intermediate-cost assumptions, then one-quarter of beneficiaries would pay an income-related premium in 2034, two years sooner than projected under intermediate assumptions of economic growth.
- Conversely, if economic growth is slower than is currently projected under intermediate-cost assumptions, it would take an additional three years—until 2039—for 25 percent of beneficiaries to be paying the income-related premium.
How much more would higher-income beneficiaries pay in premiums compared to what they will pay under current law?
Under most of these proposals, beneficiaries subject to the income-related premium would be required to pay a larger share of the Part B and Part D premiums than they do under current law. For example, under the President’s FY 2014 budget proposal, effective in 2017, beneficiaries who currently pay 35 percent of the premium would pay 40 percent under the proposal, beneficiaries who pay 80 percent of the premium would pay 90 percent, and several new levels of premium percentages would be paid by higher-income beneficiaries, depending on their income (Tables 5 and 6). The following examples illustrate premium changes that higher-income beneficiaries would face under the President’s proposal:
- Under current law, a single Part B enrollee with modified adjusted gross income (MAGI) of $86,000 in 2017 is estimated to pay $169 per month, or 35 percent of program costs that year, based on current projections. Under the proposal, they would pay $193 or 40 percent of program costs—an increase of $24 per month, or $291 for the year. Their Part D premium would increase from $57 to $65 per month—an increase of $8 per month. Their combined Part B and Part D premium would increase from $226 to $258 per month—an increase of $32 per month or $388 for the year. This increase amounts to less than 1 percent of the enrollee’s annual modified adjusted gross income in 2017.
- A single individual with modified adjusted gross income of $125,000 in 2017 who is enrolled in both Part B and Part D would pay around $323 per month in combined premiums under current law projections (50 percent of both programs’ costs that year). Under the proposal, they would pay 66 percent of costs, or $426 in monthly premiums for both programs—an increase of $103 per month, or $1,240 for the year. This increase amounts to 1 percent of the enrollee’s modified adjusted gross income in 2017.
- For a married couple with modified adjusted gross income of $200,000 in 2017, where both spouses are enrolled in both Part B and Part D, they would pay 35 percent of program costs that year, or a total of more than $452 in monthly Medicare Part B and Part D premiums for enrollment in both programs ($226 each). Under the proposal, they would pay 53 percent of program costs, or nearly $684 per month combined. The combined premium increase for the couple would be more than $232 per month, or $2,790 for the year. This increase amounts to 1.4 percent of the couple’s modified adjusted gross income in 2017.
Conclusion
Some recent proposals to address concerns about federal spending have included recommendations to reduce the growth in Medicare spending by increasing beneficiaries’ contributions towards their health care costs. These include proposals to increase the share of beneficiaries who would pay Medicare’s Part B and Part D income-related premiums and increase the portion of program costs they would pay. Part of the appeal of requiring higher-income beneficiaries to pay a greater share of Medicare costs is that these higher costs would only be imposed on those beneficiaries who arguably have greater financial means to bear the additional expenses. In the context of current federal budget discussions, some consider an approach that includes this type of progressive financing to be preferable to one that imposes higher premiums or cost sharing across the board, without regard to beneficiaries’ incomes. There is some concern, however, that the income thresholds used to trigger the imposition of higher premiums for higher-income Medicare beneficiaries ($85,000/individual, $170,000/couple) are substantially lower than the thresholds often used to define higher-income individuals in other policy discussions. For example, the ACA imposed higher Medicare Part A payroll taxes on individuals with income of $200,000 and couples with income of $250,000. For many higher-income beneficiaries, the proposed increase in Medicare premiums might not be a financial hardship. However, if the income thresholds are frozen over a longer period of time relative to current law, then a growing share of elderly and disabled people who would not be considered high income by today’s standards would face higher premiums, and as the income-related premium amounts increase over time, they would consume a larger share of income. In addition, there is some possibility that such changes could lead some higher-income beneficiaries to drop out of Medicare Part B and instead self-insure, which could result in higher premiums for all others who remain on Medicare if the dropout group is large and relatively healthy. Amid ongoing concerns about the nation’s debt and the future financial stability of Medicare, policymakers are likely to continue their discussion of alternative Medicare savings proposals. In light of the financial vulnerability of many people on Medicare and the difficulty they may have paying for rising health care costs on limited budgets, the proposal to require higher-income beneficiaries to pay more in Medicare premiums, rather than raise premiums for all beneficiaries, would protect those with relatively modest incomes. Yet, given the relatively low incomes of most people on Medicare, a significant amount of savings from this proposal is only possible by going relatively far down the income scale to reach a sizeable share of beneficiaries—at which point the affordability of these additional costs could be called into question.
Tables
TABLE 1: Comparison of Income Thresholds and Premium Percentages for Medicare’s Income-Related Premiums Under Current Law and Proposals | |||
| Income thresholds | Premium percentage | ||
| Single beneficiaries | Married couple | ||
| Current Law Income thresholds frozen through 2019; indexing thereafter | Not more than $85,000 | Not more than $170,000 | 25.0% |
| $85,000-$107,000 | $170,000-$214,000 | 35.0% | |
| $107,000-$160,000 | $214,000-$320,000 | 50.0% | |
| $160,000-$214,000 | $320,000-$428,000 | 65.0% | |
| More than $214,000 | More than $428,000 | 80.0% | |
| Proposals | |||
| Bipartisan Policy Center27 Lowers income thresholds beginning in 2016 so that approximately 17% of beneficiaries would pay income-related premiums; thresholds frozen through 2018; indexing thereafter | Not more than $60,000 | Not more than $90,000 | 25.0% |
| $60,001-$82,000 | $90,001-$123,000 | 35.0% | |
| $82,001-$135,000 | $123,001-$202,500 | 50.0% | |
| $135,001-$189,000 | $202,501-$283,500 | 65.0% | |
| More than $189,000 | More than $283,500 | 80.0% | |
| Center for American Progress28 Maintains current-law thresholds through 2019; beyond 2019 thresholds would be set so that 10% of beneficiaries would pay; increases the income-related premium percentages by 15% starting in 2014 | Thresholds not specified | Thresholds not specified | Same as President’s FY 2013 Budget Proposal |
| Moment of Truth Project29 Lowers income thresholds so that approximately 15% of beneficiaries would pay income-related premiums initially; thresholds frozen through 2030; increases current-law income-related premium percentages by 15% | Thresholds not specified | Thresholds not specified | Same as President’s FY 2013 Budget Proposal |
| President’s FY 2013 Budget Proposal30 Current-law Income thresholds frozen until 25% of beneficiaries pay income-related premiums; increases the current-law income-related premium percentages by 15% | Not more than $85,000 | Not more than $170,000 | 25.0% |
| $85,000-$107,000 | $170,000-$214,000 | 40.25% | |
| $107,000-$160,000 | $214,000-$320,000 | 57.5% | |
| $160,000-$214,000 | $320,000-$428,000 | 74.5% | |
| More than $214,000 | More than $428,000 | 90.0% | |
| President’s FY 2014 Budget Proposal31 Modifies and increases the number of current-law Income thresholds beginning in 2017; thresholds frozen until 25% of beneficiaries pay income-related premiums | Not more than $85,000 | Not more than $170,000 | 25.0% |
| $85,000-$92,333 | $170,000-$184,666 | 40.0% | |
| $93,333-$99,667 | $184,666-$199,334 | 46.5% | |
| $99,667-$107,000 | $199,334-$214,000 | 53.0% | |
| $107,000-$124,667 | $214,000-$249,334 | 59.5% | |
| $124,667-$142,333 | $249,334-$284,666 | 66.0% | |
| $142,333-$160,000 | $284,666-$320,000 | 72.5% | |
| $160,000-$178,000 | $320,000-$356,000 | 79.0% | |
| $178,000-$196,000 | $356,000-$392,000 | 85.5% | |
| More than $196,000 | More than $392,000 | 90.0% | |
| TABLE 2: Estimates of Medicare Beneficiaries Paying Income-Related Part B Premiums Through 2040Under Current Law and Changes Proposed in the President’s FY 2014 Budget | ||||||
| CURRENT LAW:Income thresholds frozenthrough 2019; indexingthereafter | PROPOSED CHANGES:Modified income thresholds beginning in 2017; income thresholds frozen beyond 2017 until 25% of beneficiaries payincome-related premiums | |||||
| Year | Part B enrollment(in millions) | Number of Part B enrollees paying income-related premiums(in millions) | Percent of totalPart B enrollment | Number of Part B enrollees paying income-related premiums(in millions) | Percent of totalPart B enrollment | Difference between current law and proposed changes(in millions) |
| 2012 | 46.6 | 2.2 | 4.8% | 2.2 | 4.8% | 0.0 |
| 2013 | 48.1 | 2.4 | 5.0% | 2.4 | 5.0% | 0.0 |
| 2014 | 49.6 | 3.0 | 6.1% | 3.0 | 6.1% | 0.0 |
| 2015 | 50.8 | 3.3 | 6.5% | 3.3 | 6.5% | 0.0 |
| 2016 | 52.0 | 3.7 | 7.2% | 3.7 | 7.2% | 0.0 |
| 2017 | 53.4 | 4.3 | 8.1% | 4.3 | 8.1% | 0.0 |
| 2018 | 54.7 | 4.8 | 8.7% | 4.8 | 8.7% | 0.0 |
| 2019 | 56.2 | 5.4 | 9.6% | 5.4 | 9.6% | 0.0 |
| 2020 | 58.1 | 3.7 | 6.4% | 6.2 | 10.6% | 2.5 |
| 2021 | 59.8 | 3.8 | 6.4% | 6.7 | 11.2% | 2.9 |
| 2022 | 61.8 | 3.9 | 6.3% | 7.5 | 12.1% | 3.6 |
| 2023 | 63.6 | 4.2 | 6.6% | 8.3 | 13.1% | 4.2 |
| 2024 | 65.2 | 4.3 | 6.6% | 9.0 | 13.8% | 4.7 |
| 2025 | 67.0 | 4.6 | 6.8% | 9.8 | 14.6% | 5.2 |
| 2026 | 68.9 | 4.7 | 6.9% | 10.7 | 15.5% | 5.9 |
| 2027 | 70.2 | 4.7 | 6.7% | 11.2 | 15.9% | 6.4 |
| 2028 | 71.7 | 5.1 | 7.1% | 12.0 | 16.8% | 7.0 |
| 2029 | 73.1 | 5.2 | 7.2% | 13.1 | 17.9% | 7.9 |
| 2030 | 74.3 | 5.3 | 7.2% | 14.0 | 18.9% | 8.7 |
| 2031 | 75.5 | 5.5 | 7.2% | 15.5 | 20.5% | 10.1 |
| 2032 | 76.3 | 5.9 | 7.7% | 16.4 | 21.5% | 10.5 |
| 2033 | 77.6 | 5.9 | 7.6% | 17.2 | 22.1% | 11.3 |
| 2034 | 78.4 | 6.2 | 7.9% | 18.6 | 23.8% | 12.5 |
| 2035 | 79.6 | 6.3 | 8.0% | 19.8 | 24.8% | 13.4 |
| 2036 | 80.3 | 6.3 | 7.8% | 20.4 | 25.4% | 14.1 |
| 2037 | 80.8 | 6.7 | 8.2% | 21.5 | 26.6% | 14.8 |
| 2038 | 81.3 | 6.5 | 8.0% | 22.5 | 27.6% | 15.9 |
| 2039 | 81.6 | 6.8 | 8.4% | 23.7 | 29.0% | 16.8 |
| 2040 | 82.0 | 6.9 | 8.4% | 24.7 | 30.1% | 17.8 |
| SOURCE: Urban Institute tabulations from DYNASIM for the Kaiser Family Foundation; proposed changes based on the President’s FY2014 Budget. | ||||||
| TABLE 3: Estimates of Medicare Part B Premiums Through 2022 Under Current Law | |||||||
| Income thresholds | |||||||
| Ultimate percentage of program costs represented by premium | |||||||
| Standard | Income-related | ||||||
| 25.0% | 35.0% | 50.0% | 65.0% | 80.0% | |||
| Singles | $85,000 or less | $85,001-107,000 | $107,001-160,000 | $160,001-214,000 | $214,001 or more | ||
| Couples | $170,000 or less | $170,001-214,000 | $214,001-320,000 | $320,001-428,000 | $428,001 or more | ||
| Historical and projected Part B premium amounts under current law | |||||||
| Ultimate percentage of program costs represented by premium | |||||||
| Standard | Income-related | ||||||
| Calendar year | 25.0% | 35.0% | 50.0% | 65.0% | 80.0% | Total per capita Part B costs* | Annual growth rate |
| 2007 | $93.50 | $105.80 | $124.40 | $142.90 | $161.40 | $374.00 | |
| 2008 | $96.40 | $122.20 | $160.90 | $199.70 | $238.40 | $385.60 | 3.1% |
| 2009 | $96.40 | $134.90 | $192.70 | $250.50 | $308.30 | $385.60 | 0.0% |
| 2010 | $110.50 | $154.70 | $221.00 | $287.30 | $353.60 | $442.00 | 14.6% |
| 2011 | $115.40 | $161.50 | $230.70 | $299.90 | $369.10 | $461.60 | 4.40% |
| 2012 | $99.90 | $139.90 | $199.80 | $259.70 | $319.70 | $399.60 | -13.4% |
| 2013 | $104.90 | $146.90 | $209.80 | $272.70 | $335.70 | $419.60 | 5.0% |
| 2014 | $104.90 | $146.90 | $209.80 | $272.70 | $335.70 | $419.60 | 0.0% |
| Projected Part B premium amounts under current-law intermediate estimates | |||||||
| 2015 | $110.70 | $154.90 | $221.30 | $287.70 | $354.10 | $442.80 | 5.5% |
| 2016 | $115.40 | $161.60 | $230.80 | $300.00 | $369.30 | $461.60 | 4.2% |
| 2017 | $120.90 | $169.20 | $241.70 | $314.20 | $386.70 | $483.60 | 4.8% |
| 2018 | $127.40 | $178.30 | $254.70 | $331.10 | $407.50 | $509.60 | 5.4% |
| 2019 | $134.40 | $188.20 | $268.80 | $349.40 | $430.10 | $537.60 | 5.5% |
| 2020 | $141.80 | $198.50 | $283.60 | $368.70 | $453.80 | $567.20 | 5.5% |
| 2021 | $150.00 | $209.90 | $299.90 | $389.90 | $479.80 | $600.00 | 5.8% |
| 2022 | $160.50 | $224.70 | $321.00 | $417.30 | $513.60 | $642.00 | 7.0% |
NOTE: *Total per capita Part B costs consist of the 25 percent standard beneficiary premium payment and the 75 percent federal contribution.SOURCE: Kaiser Family Foundation analysis of current-law intermediate estimates from the 2013 Annual Report of the Boards of Trustees of the Federal Hospital Insurance and Federal Supplementary Medical Insurance Trust Funds. | |||||||
| TABLE 4: Estimates of Medicare Part D Premiums Through 2022 Under Current Law | |||||||
| Income thresholds | |||||||
| Ultimate percentage of program costs represented by premium | |||||||
| Standard | Income-related | ||||||
| 25.5% | 35.0% | 50.0% | 65.0% | 80.0% | |||
| Singles | $85,000or less | $85,001-107,000 | $107,001-160,000 | $160,001-214,000 | $214,001or more | ||
| Couples | $170,000 or less | $170,001-214,000 | $214,001-320,000 | $320,001-428,000 | $428,001or more | ||
| Historical and projected Part D premium amounts under current law | |||||||
| Ultimate percentage of program costs represented by premium | |||||||
| Standard | Income-related | ||||||
| Calendar year | 25.5% | 35.0% | 50.0% | 65.0% | 80.0% | Total per capitaPart D costs* | Annual growth rate |
| 2007 | $27.35 | n/a | n/a | n/a | n/a | $107.25 | |
| 2008 | $27.93 | n/a | n/a | n/a | n/a | $109.53 | 2.1% |
| 2009 | $30.36 | n/a | n/a | n/a | n/a | $119.06 | 8.7% |
| 2010 | $31.94 | n/a | n/a | n/a | n/a | $125.25 | 5.2% |
| 2011 | $32.34 | $44.34 | $63.44 | $82.44 | $101.44 | $126.82 | 1.3% |
| 2012 | $31.08 | $42.66 | $60.94 | $79.22 | $97.51 | $121.88 | -3.9% |
| 2013 | $31.17 | $42.77 | $61.07 | $79.47 | $97.77 | $122.24 | 0.3% |
| 2014 | $32.42 | $44.52 | $63.52 | $82.62 | $101.72 | $127.14 | 4.0% |
| Projected Part D premium amounts under current-law intermediate estimates | |||||||
| 2015 | $36.68 | $50.38 | $71.88 | $93.48 | $115.08 | $143.84 | 13.1% |
| 2016 | $38.66 | $53.06 | $75.76 | $98.56 | $121.26 | $151.61 | 5.4% |
| 2017 | $41.28 | $56.68 | $80.98 | $105.18 | $129.48 | $161.88 | 6.8% |
| 2018 | $43.99 | $60.39 | $86.29 | $112.09 | $137.99 | $172.51 | 6.6% |
| 2019 | $46.99 | $64.49 | $92.19 | $119.79 | $147.39 | $184.27 | 6.8% |
| 2020 | $50.18 | $68.88 | $98.38 | $127.88 | $157.38 | $196.78 | 6.8% |
| 2021 | $53.28 | $73.08 | $104.48 | $135.78 | $167.18 | $208.94 | 6.2% |
| 2022 | $56.59 | $77.69 | $110.99 | $144.29 | $177.49 | $221.92 | 6.2% |
| NOTE: *Total per capita Part D costs consist of the 25.5 percent standard beneficiary premium payment and the 74.5 percent federal contribution.SOURCE: Kaiser Family Foundation analysis of current-law intermediate estimates from the 2013 Annual Report of the Boards of Trustees of the Federal Hospital Insurance and Federal Supplementary Medical Insurance Trust Funds. | |||||||
| TABLE 5: Estimates of Medicare Part B Premiums From 2017-2022 Under Changes Proposed in the President’s FY 2014 Budget | |||||||||||||
| Income thresholds | |||||||||||||
| Ultimate percentage of program costs represented by premium | |||||||||||||
| Standard | Income-related | ||||||||||||
| 25.0% | 40.0% | 46.5% | 53.0% | 59.% | 66.0% | 72.5% | 79.0% | 85.5% | 90% | ||||
| Singles | $85,000 or less | $85,001-92,333 | $92,334-99,667 | $99,668-107,000 | $107,001-124,667 | $124,668-142,334 | $142,334-160,000 | $160,001-178,000 | $178,001-196,000 | $196,001 or more | |||
| Couples | $170,000 or less | $170,001-184,666 | $184,666-199,334 | $199,334-214,000 | $214,001-249,334 | $249,334-284,666 | $284,666-320,000 | $320,001-356,000 | $356,001-392,000 | $392,001 or more | |||
| Part B premium amounts under intermediate estimates with proposed changes | |||||||||||||
| 2017 | $120.90 | $193.44 | $224.87 | $256.31 | $287.74 | $319.18 | $350.61 | $382.04 | $413.48 | $435.24 | |||
| 2018 | $127.40 | $203.84 | $236.96 | $270.09 | $303.21 | $336.34 | $369.46 | $402.58 | $435.71 | $458.64 | |||
| 2019 | $134.40 | $215.04 | $249.98 | $284.93 | $319.87 | $354.82 | $389.76 | $424.70 | $459.65 | $483.84 | |||
| 2020 | $141.80 | $226.88 | $263.75 | $300.62 | $337.48 | $374.35 | $411.22 | $448.09 | $484.96 | $510.48 | |||
| 2021 | $150.00 | $240.00 | $279.00 | $318.00 | $357.00 | $396.00 | $435.00 | $474.00 | $513.00 | $540.00 | |||
| 2022 | $160.50 | $256.80 | $298.53 | $340.26 | $381.99 | $423.72 | $465.45 | $507.18 | $548.91 | $577.80 | |||
| SOURCE: Kaiser Family Foundation analysis of current-law intermediate estimates from the 2013 Annual Report of the Boards of Trustees of the Federal Hospital Insurance and Federal Supplementary Medical Insurance Trust Funds and proposed changes based on the President’s FY 2014 Budget. | |||||||||||||
| TABLE 6: Estimates of Medicare Part D Premiums From 2017-2022 Under Changes Proposed in the President’s FY 2014 Budget | |||||||||||||
| Income thresholds | |||||||||||||
| Ultimate percentage of program costs represented by premium | |||||||||||||
| Standard | Income-related | ||||||||||||
| 25.5% | 40.0% | 46.5% | 53.0% | 59.% | 66.0% | 72.5% | 79.0% | 85.5% | 90% | ||||
| Singles | $85,000 or less | $85,001-92,333 | $92,334-99,667 | $99,668-107,000 | $107,001-124,667 | $124,668-142,334 | $142,334-160,000 | $160,001-178,000 | $178,001-196,000 | $196,001 or more | |||
| Couples | $170,000 or less | $170,001-184,666 | $184,666-199,334 | $199,334-214,000 | $214,001-249,334 | $249,334-284,666 | $284,666-320,000 | $320,001-356,000 | $356,001-392,000 | $392,001 or more | |||
| Part D premium amounts under intermediate estimates with proposed changes | |||||||||||||
| 2017 | $41.28 | $64.75 | $75.28 | $85.80 | $96.32 | $106.84 | $117.36 | $127.89 | $138.41 | $145.69 | |||
| 2018 | $43.99 | $69.00 | $80.22 | $91.43 | $102.64 | $113.86 | $125.07 | $136.28 | $147.50 | $155.26 | |||
| 2019 | $46.99 | $73.71 | $85.69 | $97.67 | $109.64 | $121.62 | $133.60 | $145.58 | $157.55 | $165.85 | |||
| 2020 | $50.18 | $78.71 | $91.50 | $104.30 | $117.09 | $129.88 | $142.67 | $155.46 | $168.25 | $177.11 | |||
| 2021 | $53.28 | $83.58 | $97.16 | $110.74 | $124.32 | $137.90 | $151.48 | $165.06 | $178.64 | $188.05 | |||
| 2022 | $56.59 | $88.77 | $103.19 | $117.62 | $132.04 | $146.47 | $160.89 | $175.32 | $189.74 | $199.73 | |||
| SOURCE: Kaiser Family Foundation analysis of current-law intermediate estimates from the 2013 Annual Report of the Boards of Trustees of the Federal Hospital Insurance and Federal Supplementary Medical Insurance Trust Funds and proposed changes based on the President’s FY 2014 Budget. | |||||||||||||
Methodology
The analysis of Medicare beneficiaries estimated to pay the income-related premium under current and proposed law are based on the Urban Institute’s Dynamic Simulation of Income Model (DYNASIM3). DYNASIM3 starts with a self-weighting sample of 103,072 individuals from the 1990 to 1993 panels of the Survey of Income and Program Participation (SIPP) and ages this starting sample in yearly increments to 2085 using parameters estimated from longitudinal data sources. The model integrates many important trends and differences among groups in life course processes, including birth, death, schooling, leaving home, first marriage, remarriage, divorce, disability, work, retirement, and earnings. Projections of fertility, disability, mortality, net immigration, employment, average earnings, and price changes are aligned to be consistent with 2013 OASDI Trustees projections, based on the intermediate demographic and economic assumptions (available at http://www.ssa.gov/oact/tr/2013/trTOC.html). For a fuller description of DYNASIM3, see Karen E. Smith, “Projection Methods Used in the Dynamic Simulation of Income Model (DYNASIM3),” Urban Institute Program on Retirement Policy (2012).
The Centers for Medicare & Medicaid Services Office of the Actuary (OACT) has released estimates of actual and projected Part B and Part D enrollees paying income-related premiums under current law, but OACT has not released projections of how many Medicare beneficiaries would pay income-related premiums for Part B or Part D under the proposals discussed in this brief. DYNASIM produces estimates of enrollees paying income-related premiums that are very similar to, but not exactly the same as, OACT’s estimates under current law. The sensitivity analysis of the projected year when one-quarter of Medicare enrollees would be paying the income-related premium is based on DYNASIM projections using the low-cost and high-cost economic growth assumptions from the 2013 OASDI Trustees report. For the purpose of this sensitivity analysis, only the economic assumptions (consumer price index, average wage index, taxable payroll, gross domestic product, and compound interest rates) were modified; the fertility, mortality, disability, immigration, and employment assumptions were unchanged from the intermediate scenario. The low-cost scenario assumes low inflation and interest and high real wage growth. The high-cost scenario assumes high inflation and interest and low real wage growth.
Endnotes
- For a summary of several recent proposals, see Kaiser Family Foundation, “Medicare and the Federal Budget: Comparison of Medicare Provisions in Recent Federal Debt and Deficit Reduction Proposals,” January 2014. ↩︎
- Bipartisan Policy Center, “A Bipartisan Rx for Patient-Centered Care and System-Wide Cost Containment,” April 2013, http://bipartisanpolicy.org/sites/default/files/BPC%20Cost%20Containment%20Report.pdf. ↩︎
- Center for American Progress, “The Senior Protection Plan,” November 2012, http://www.americanprogress.org/wp-content/uploads/2012/11/SeniorProtectionPlan-3.pdf. ↩︎
- The Moment of Truth Project, “A Bipartisan Path Forward to Securing America’s Future,” April 2013, http://www.momentoftruthproject.org/sites/default/files/Full%20Plan%20of%20Securing%20America%27s%20Future.pdf. ↩︎
- Earlier versions of this proposal were included in the Obama Administration’s broader set of recommendations to the Joint Select Committee on Deficit Reduction, and as part of the House Republican’s proposed legislation to extend the Social Security payroll tax reduction for 2012 (along with other provisions). See Office of Management and Budget, “Living Within Our Means and Investing in the Future: The President’s Plan for Economic Growth and Deficit Reduction,” September 19, 2011; and H.R. 3630, “Middle Class Tax Relief and Job Creation Act of 2011,” as introduced on December 9, 2011 http://rules.house.gov/Media/file/PDF_112_1/legislativetext/HR_1209.pdf. ↩︎
- Congressional Budget Office, “Estimated Effects on Direct Spending and Revenues for Health Care Programs of Proposals in the President’s 2014 Budget,” May 2013, http://www.cbo.gov/sites/default/files/cbofiles/attachments/44247_APB_HealthCarePrograms.pdf. Separately, CBO has estimated the cost of freezing all of the income thresholds for income-related premiums through 2023, extending the current freeze by four years. CBO estimates that this option would reduce net Medicare spending by $20 billion between 2020 and 2023, and the share of enrollees paying income-related premiums would rise from 10 percent in 2019 to 13 percent in 2023; see Congressional Budget Office, http://www.cbo.gov/sites/default/files/cbofiles/attachments/44715-OptionsForReducingDeficit-2_1.pdf ↩︎
- Congressional Budget Office, “Estimate of the Effects of Medicare, Medicaid, and Other Mandatory Health Provisions Included in the President’s Budget Request for Fiscal Year 2013 – March 2012 Baseline,” March 2012, http://www.cbo.gov/sites/default/files/cbofiles/attachments/FY2013ReestimateofthePresidentsBudget-Health.pdf ↩︎
- For beneficiaries with low incomes, Medicaid pays the Part B premium on their behalf. ↩︎
- Urban Institute tabulations from DYNASIM for the Kaiser Family Foundation. See also: Gretchen Jacobson, Jennifer Huang, Patricia Neuman, and Karen E. Smith, “Income and Assets of Medicare Beneficiaries, 2013-2030,” Kaiser Family Foundation, January 2014. ↩︎
- The Patient Protection and Affordable Care Act (P.L. 111-148), as modified by the Health Care and Education Reconciliation Act of 2010 (P.L. 111-152). ↩︎
- The Congressional Budget Office estimated this provision in the ACA would generate savings to the federal government of $25.0 billion from 2010 to 2019. ↩︎
- Estimates of Part B enrollees paying income-related premiums under current law are from the Urban Institute analysis of DYNASIM for the Kaiser Family Foundation. Estimates from DYNASIM are very similar to estimates from the Centers for Medicare & Medicaid Services Office of the Actuary (December 2010). ↩︎
- Although more than 5 percent of Medicare beneficiaries are estimated to have incomes greater than $85,000 in 2013 (according to Urban Institute analysis of DYNASIM for the Kaiser Family Foundation), not all Medicare beneficiaries are enrolled in Part B and thus not all higher-income people on Medicare are paying the income-related premiums. This is partly due to the fact that people ages 65 and older who are currently working and have group health insurance through an employer can opt out of Part B until they stop working or lose access to employment-based coverage. This group of active workers may be comprised disproportionately of higher-income people ages 65 and older who would otherwise be enrolled in Medicare Part B and paying the higher-income premiums. ↩︎
- 2013 Annual Report of the Boards of Trustees of the Federal Hospital Insurance and Federal Supplementary Medical Insurance Trust Funds. ↩︎
- Estimates are based on the 2013 Annual Report of the Boards of Trustees of the Federal Hospital Insurance and Federal Supplementary Medical Insurance Trust Funds. ↩︎
- With the exception of beneficiaries receiving low-income subsidies, who pay no or low premiums, with subsidy levels set on a sliding scale. ↩︎
- The Congressional Budget Office estimated this provision in the ACA would generate savings to the federal government of $10.7 billion from 2010 to 2019. ↩︎
- Centers for Medicare & Medicaid Services, “Annual Release of Part D National Average Bid Amount and other Part C & D Bid Related Information,” July 30, 2013. ↩︎
- Jack Hoadley, Juliette Cubanski, Elizabeth Hargrave, and Laura Summer, “Medicare Part D: A First Look at Part D Plan Offerings in 2014,” Kaiser Family Foundation, November 2013, http://modern.kff.org/medicare/issue-brief/medicare-part-d-a-first-look-at-plan-offerings-in-2014/. ↩︎
- If the benefit payment is insufficient to allow the Part D-IRMAA withholding, or an individual is not receiving benefit payments from SSA, RRB, or OPM, the Part D-IRMAA will be collected directly from these beneficiaries. ↩︎
- Estimates of Part D enrollees paying income-related premiums under current law are from the Urban Institute analysis of DYNASIM for the Kaiser Family Foundation. Estimates from DYNASIM are very similar to estimates from the Centers for Medicare & Medicaid Services Office of the Actuary (December 2010). ↩︎
- Excluding those who receive the Retiree Drug Subsidy (RDS). ↩︎
- Centers for Medicare & Medicaid Services, “Annual Release of Part D National Average Bid Amount and other Part C & D Bid Related Information,” July 30, 2013. ↩︎
- 2013 Annual Report of the Boards of Trustees of the Federal Hospital Insurance and Federal Supplementary Medical Insurance Trust Funds. ↩︎
- OACT projects that the number of beneficiaries with the RDS will decline over time. ↩︎
- Kaiser Family Foundation analysis of the CMS Medicare Current Beneficiary Survey 2006 Cost and Use file. ↩︎
- Bipartisan Policy Center, “A Bipartisan Rx for Patient-Centered Care and System-Wide Cost Containment,” April 2013, http://bipartisanpolicy.org/sites/default/files/BPC%20Cost%20Containment%20Report.pdf ↩︎
- Center for American Progress, “The Senior Protection Plan,” November 2012, http://www.americanprogress.org/wp-content/uploads/2012/11/SeniorProtectionPlan-3.pdf ↩︎
- Moment of Truth Project, “A Bipartisan Path Forward to Securing America’s Future,” April 2013, http://www.momentoftruthproject.org/sites/default/files/Full%20Plan%20of%20Securing%20America%27s%20Future.pdf ↩︎
- U.S. Office of Management and Budget, Budget of the United States Government, Fiscal Year 2013, http://www.gpo.gov/fdsys/pkg/BUDGET-2013-BUD/pdf/BUDGET-2013-BUD.pdf ↩︎
- Budget of the United States Government, Fiscal Year 2014, http://www.whitehouse.gov/sites/default/files/omb/budget/fy2014/assets/budget.pdf ↩︎