How Many Medicare Part D Enrollees Had High Out-of-Pocket Drug Costs in 2017?
Data Note
The Medicare Part D prescription drug benefit has helped improve the affordability of medications for people with Medicare. Yet Part D enrollees can face relatively high out-of-pocket costs because the Part D benefit does not have a hard cap on out-of-pocket spending. For drug costs above the catastrophic threshold, enrollees are required to pay up to 5 percent of their total drug costs, unless they receive low-income subsidies (LIS) that help pay Part D premiums and cost sharing.
1 million Medicare beneficiaries had out-of-pocket prescription drug spending above the Part D catastrophic threshold in 2017, with such spending on drugs averaging more than $3,200 per person.
As policymakers continue to discuss ways to reduce Medicare prescription drug spending, proposals to place a hard cap on out-of-pocket spending in Part D have gained bipartisan support in the 116th Congress. This analysis presents the latest data on out-of-pocket drug spending among Medicare Part D enrollees without the LIS who have costs above the catastrophic threshold, referred to here as enrollees with high out-of-pocket drug costs.
Key Findings
- In 2017, 1 million Medicare Part D enrollees had out-of-pocket spending above the catastrophic threshold, with average annual out-of-pocket costs exceeding $3,200—over six times the average for all non-LIS enrollees.
- Treatments for autoimmune diseases, hepatitis C, and certain types of cancer were among the 10 highest-cost medications for these 1 million enrollees in 2017, with annual out-of-pocket spending per drug for each of the 10 medications averaging over $5,000.
- Part D enrollees without low-income subsidies who had high out-of-pocket drug costs in 2017 would have collectively saved $1.4 billion if Part D had a hard cap on out-of-pocket spending that year, rather than requiring enrollees to pay up to 5% coinsurance in the catastrophic phase.
Nearly 1 in 10 Medicare Part D enrollees had drug spending above the catastrophic coverage threshold in 2017, most of whom received low-income subsidies—but 1 million did not
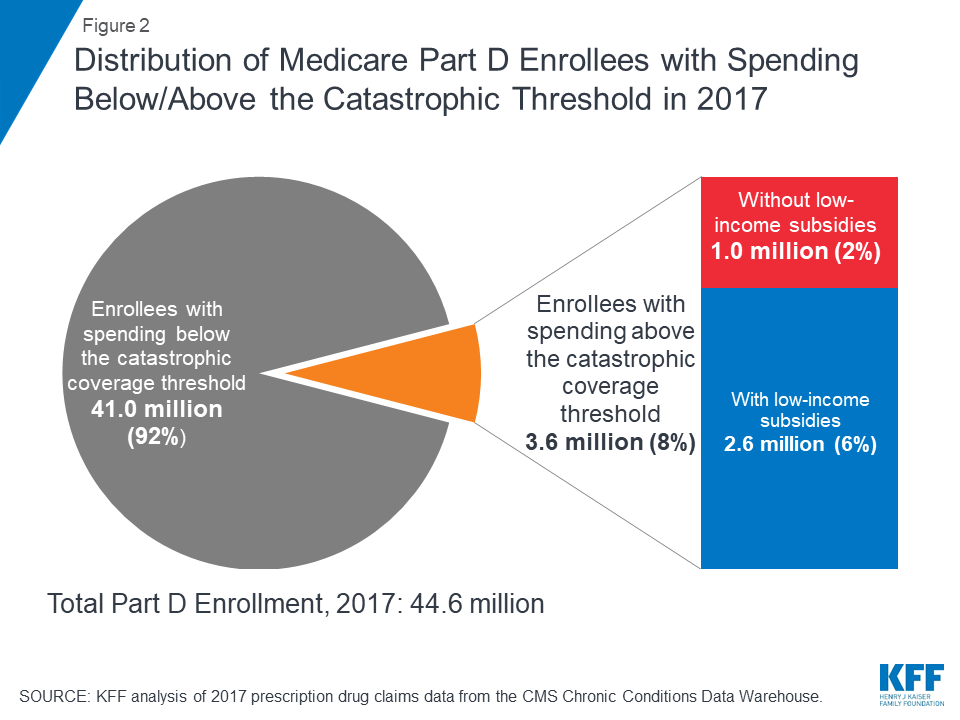
In 2017, 3.6 million Medicare Part D enrollees had total drug spending above the catastrophic coverage threshold, which equaled $8,071 in total drug costs that year. This equals 8% of the 44.6 million Medicare beneficiaries enrolled in Part D plans in 2017. Of this total, 2.6 million enrollees (72%) received low-income subsidies (LIS) to help pay their Part D plan premiums and cost sharing, but 1 million enrollees (28%) did not receive these additional subsidies and were therefore not protected against having high out-of-pocket drug costs.
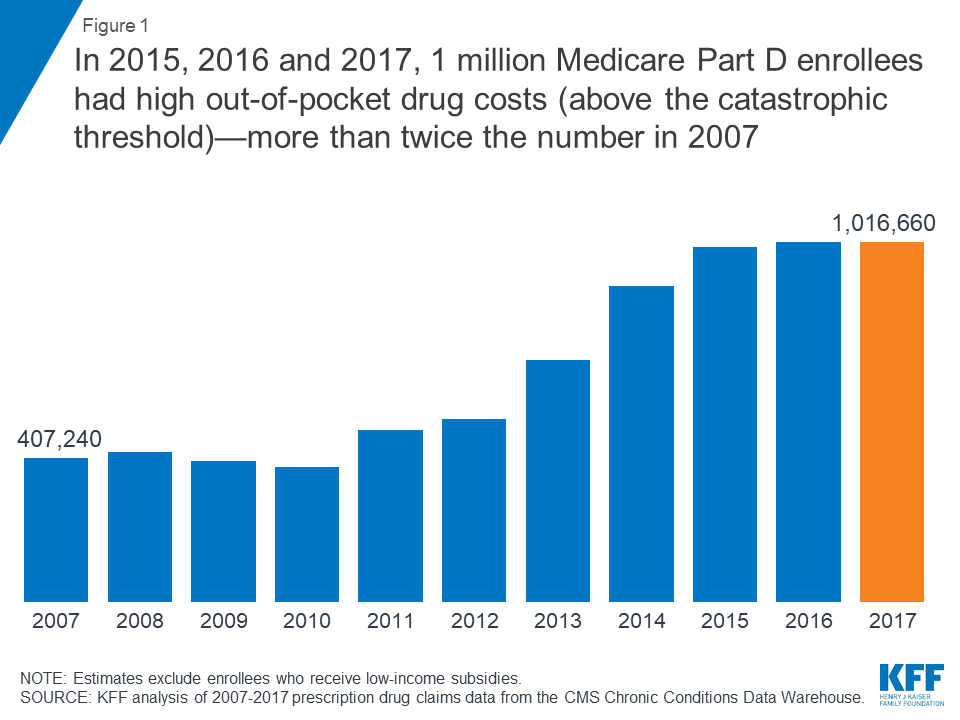
In 2015, 2016 and 2017, 1 million Medicare Part D enrollees without low-income subsidies had high out-of-pocket drug costs (above the catastrophic threshold)—more than twice the number in 2007
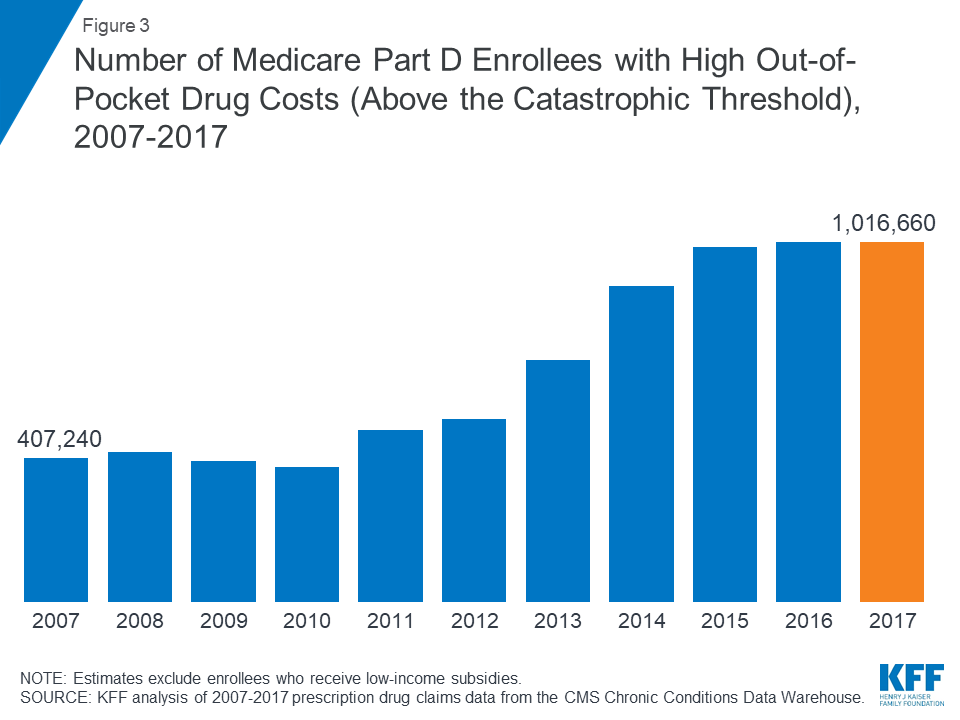
Between 2007 and 2015, the number of Part D enrollees without low-income subsidies who had spending above the catastrophic coverage threshold more than doubled. In each year between 2015 and 2017, 1 million Part D enrollees had high out-of-pocket drug costs.
Part D enrollees with high out-of-pocket drug costs spent over $3,200 out-of-pocket in 2017, more than 6 times overall average out-of-pocket costs among non-LIS enrollees
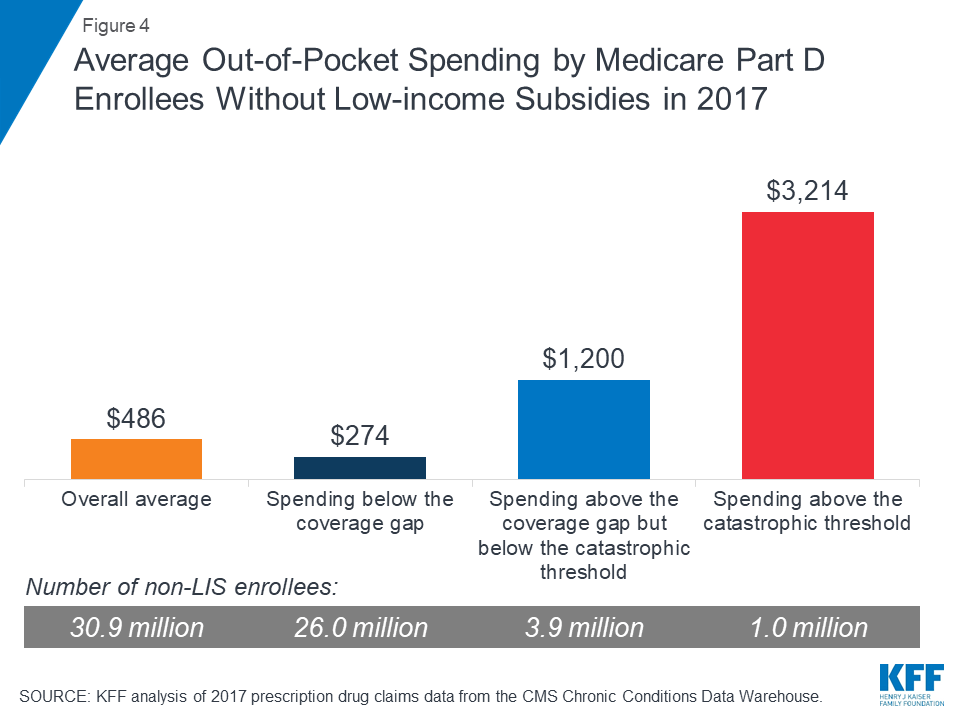
On average, Part D enrollees with high out-of-pocket drug costs spent $3,214 for prescriptions in 2017. This is more than six times average out-of-pocket spending by enrollees without the LIS overall ($486), and more than 2.5 times average out-of-pocket spending by enrollees without the LIS who had spending in the coverage gap but not above the catastrophic threshold ($1,200). Enrollees without the LIS who did not have spending high enough to reach the coverage gap spent $274 out of pocket in 2017.
Medicare Part D enrollees with high out-of-pocket drug costs incurred 44% of their total out-of-pocket costs above the catastrophic coverage threshold in 2017
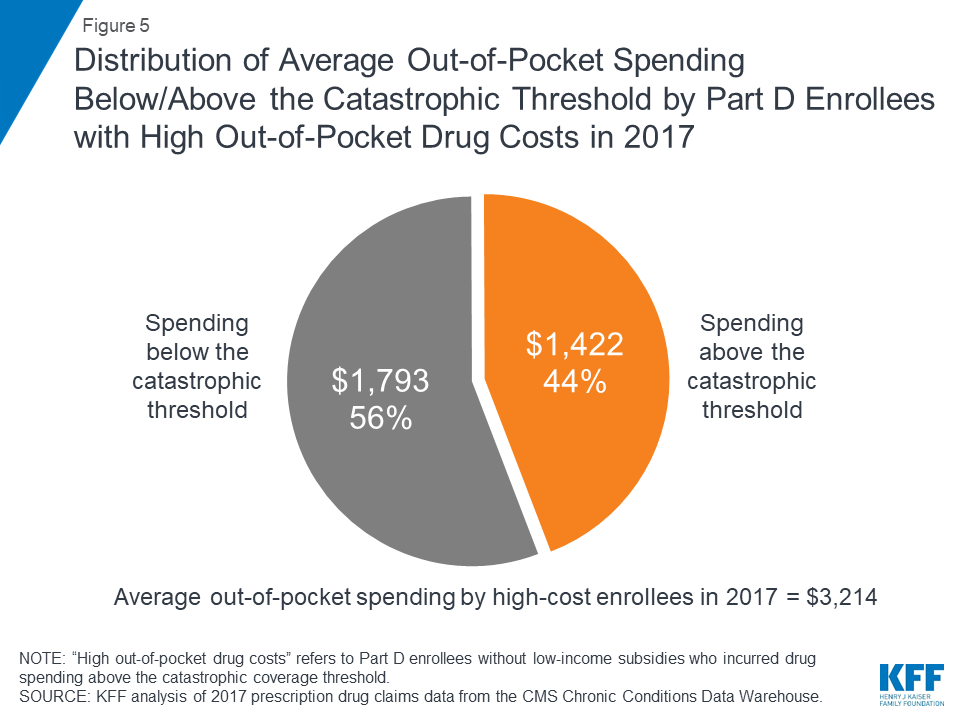
Of their total out-of-pocket costs, non-LIS Part D enrollees with high out-of-pocket costs spent an average of $1,793 (56%) below the catastrophic threshold and $1,422 (44%) above the threshold in 2017. In the aggregate, these Part D enrollees with high out-of-pocket costs spent $1.4 billion on their prescription drug costs above the catastrophic coverage threshold in 2017.
Over time, Part D enrollees with high out-of-pocket drug costs have spent more out of pocket in the catastrophic coverage phase, from 13% in 2007 to 44% in 2017
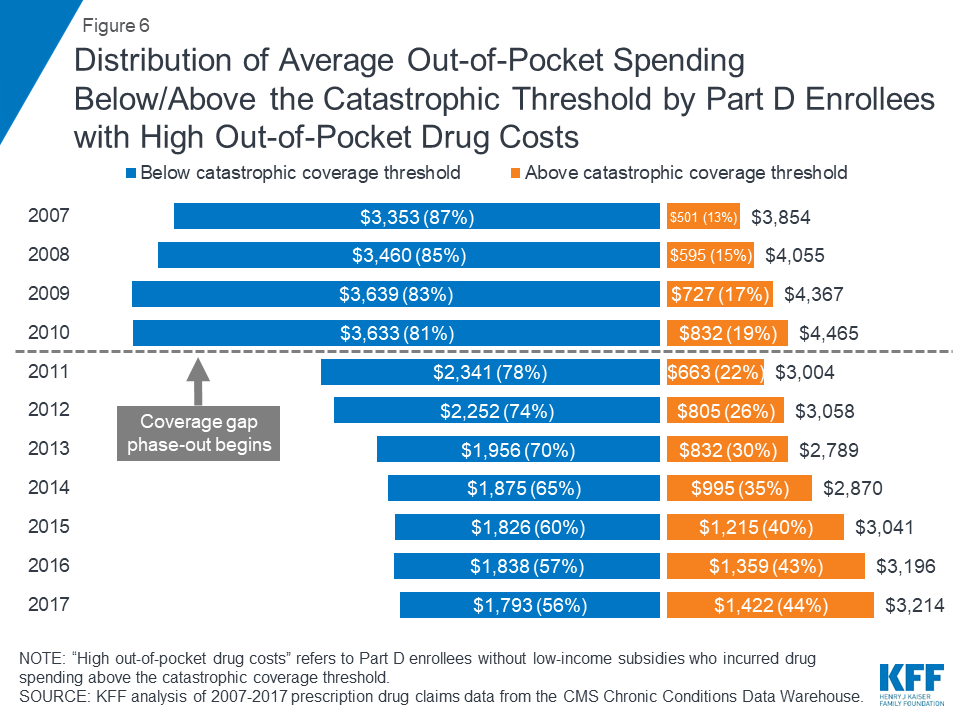
Although total out-of-pocket spending among Part D enrollees with high out-of-pocket drug costs is lower in 2017 than it was in 2007, the share of out-of-pocket spending in the catastrophic coverage phase among these enrollees has increased over time: from 13% in 2007 to 44% in 2017. This increase is related to changes in the Part D benefit design made by the Affordable Care Act (ACA) that have accelerated the pace of beneficiaries moving through the coverage gap and into the catastrophic phase—namely, the phase-out of the coverage gap, with increasing plan liability for total costs over time and a manufacturer discount on brand-name drugs in the coverage gap.
Part D enrollees with high out-of-pocket costs accounted for only 2% of all Part D enrollees in 2017, but their out-of-pocket costs represented 20% of the total
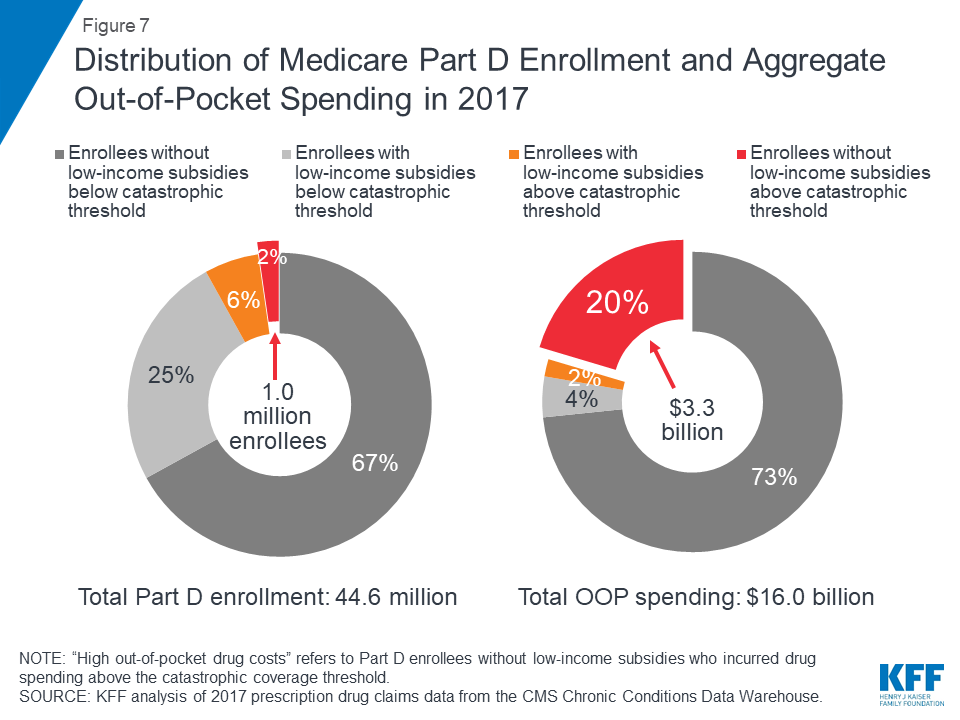
A disproportionate share of aggregate out-of-pocket drug spending by all Medicare beneficiaries enrolled in Part D is accounted for by enrollees without low-income subsidies who face high out-of-pocket costs (above the catastrophic coverage threshold). In 2017, beneficiaries in Part D plans spent a total of $16 billion out of pocket on prescription drugs. Part D enrollees with high out-of-pocket drug costs accounted for 20% of aggregate out-of-pocket drug spending by all enrollees ($3.3 billion), even though they comprised just 2% of all Part D enrollees.
Drugs to treat hepatitis C and cancer were among the 10 drugs with the highest annual out-of-pocket costs per drug for Medicare Part D enrollees with high out-of-pocket drug costs in 2017
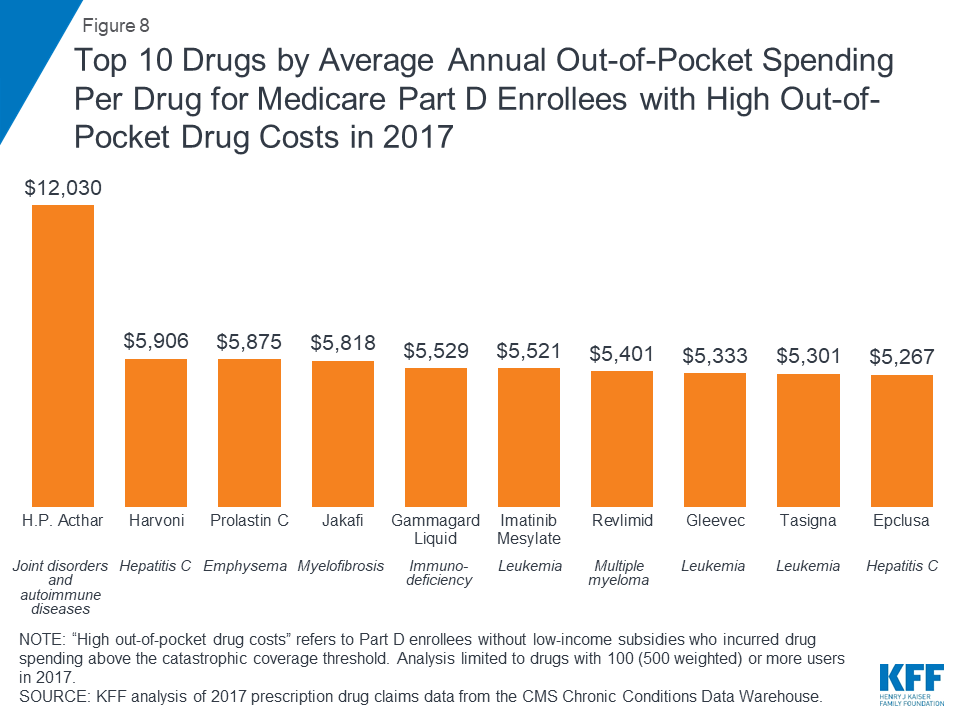
In 2017, H.P. Acthar, a treatment for joint disorders and autoimmune diseases, and Harvoni, a treatment for hepatitis C, were the two most expensive drugs, in terms of average per capita out-of-pocket spending per drug for Part D enrollees without low-income subsidies who had high out-of-pocket drug costs. On average, enrollees who faced high out-of-pocket drug costs in 2017 spent $12,030 for H.P. Acthar alone and $5,906 for Harvoni alone. Several cancer drugs were also among the top 10 drugs with the highest out-of-pocket costs per drug among non-LIS Part D enrollees with spending above the catastrophic threshold in 2017, including Jakafi ($5,818), Gleevec ($5,333), and its generic equivalent, imatinib mesylate ($5,521). Part D enrollees using any of these medications who incurred these high out-of-pocket costs per drug would have spent even more out of pocket in 2017 if were also taking other medications.
In 2017, Part D enrollees in stand-alone drug plans with leukemia and lymphoma who had high out-of-pocket drug costs spent more on their drugs than those with other conditions—nearly $5,000, on average
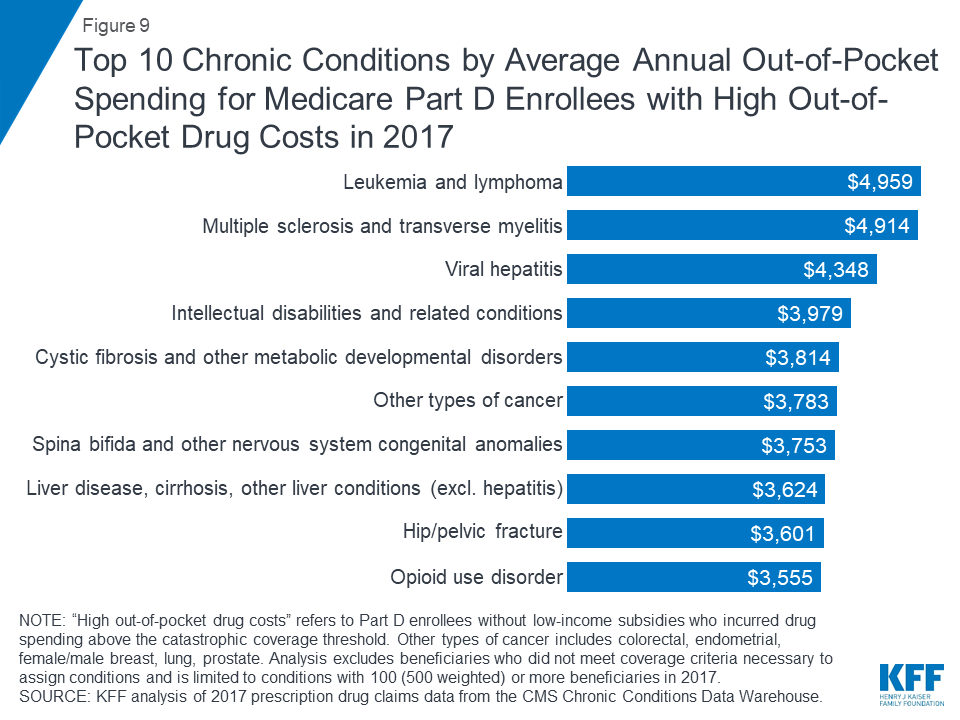
Among stand-alone prescription drug plan (PDP) enrollees without low-income subsidies who had high out-of-pocket drug costs, those with leukemia and lymphoma incurred the highest average out-of-pocket drug spending in 2017 ($4,959), followed by those with multiple sclerosis ($4,914), and those with viral hepatitis ($4,348).
Average out-of-pocket spending by non-LIS Part D enrollees with high out-of-pocket drug costs decreased when the coverage gap phase-out started in 2011—but is on the rise
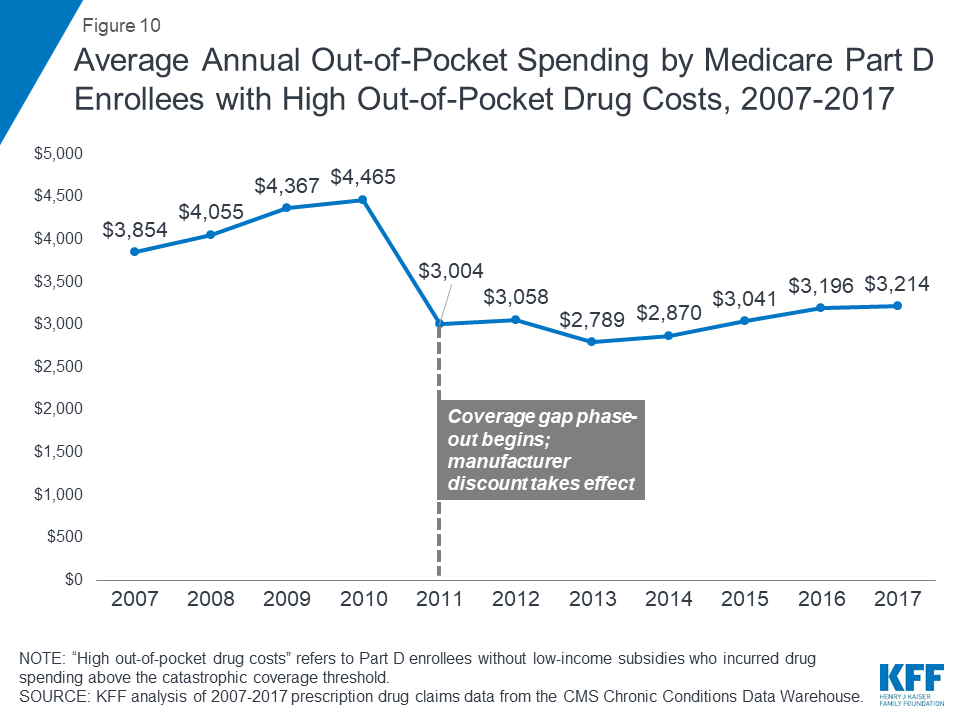
With the ACA provisions to phase out the coverage gap taking effect in 2011, average out-of-pocket spending by Part D enrollees who incur high out-of-pocket costs was lower in 2017 than it was in 2010, before the gap coverage phase-out began. The first-year effect of the ACA changes was a substantial reduction in spending by Part D enrollees who incurred high out-of-pocket drug costs, after increasing every year between 2007 and 2010. But this trend has reversed in recent years.
Between 2010 and 2011, average out-of-pocket spending by Part D enrollees with high out-of-pocket drug costs declined 33%, from $4,465 to $3,004, as the ACA coverage gap phase-out began. But between 2011 and 2017, the average increased by 7%, to $3,214, as new high-cost drugs came to market and prices for existing drugs increased.
Ten brand-name drugs accounted for 20% of aggregate out-of-pocket spending by Medicare Part D enrollees with high out-of-pocket drug costs in 2017
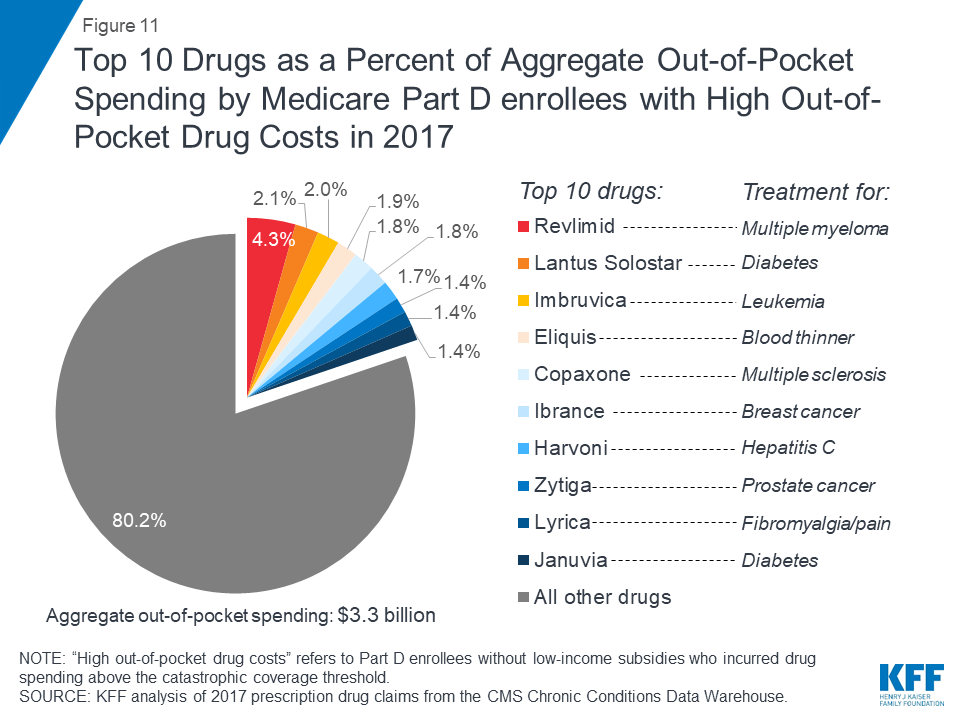
Ten brand-name drugs accounted for 20% of the $3.3 billion in aggregate out-of-pocket spending by Part D enrollees without low-income subsidies who had high out-of-pocket drug costs in 2017. One drug alone—Revlimid, a treatment for multiple myeloma—accounted for 4% of total out-of-pocket costs among the high-spending population without the LIS in 2017, while the top three drugs—Revlimid, Lantus Solostar, a diabetes drug, and Imbruvica, a treatment for leukemia and lymphoma—accounted for 8.5%.
Juliette Cubanski and Tricia Neuman are with the Kaiser Family Foundation.Anthony Damico is an independent consultant.
Methods
Data and Methods
This analysis uses Medicare Part D prescription drug event (PDE) claims data from the Centers for Medicare & Medicaid Services (CMS) Chronic Conditions Data Warehouse (CCW) for Part D enrollees between 2007 and 2017. The PDE claims data includes all prescription drug events reported by Part D plans for their enrollees in a given calendar year, and includes detailed data on spending for each event, corresponding to a single prescription drug fill, including how much was paid by plans, low-income subsidy amounts, and beneficiary out-of-pocket payments. The claims data includes spending for Part D covered drugs, but does not include spending on Part D plan premiums, Part B covered drugs (which are typically administered in providers’ offices or hospital outpatient settings), or the cost of drugs purchased outside the Part D plan. The CCW data also includes flags for several chronic conditions (27 common chronic conditions and 35 other chronic or potentially disabling conditions).
We calculated average out-of-pocket spending for enrollees overall and by benefit phases. Our analysis focuses on beneficiaries enrolled in both stand-alone prescription drug plans (PDPs) and Medicare Advantage prescription drug plans (MA-PDs) who have high out-of-pocket drug costs, which we define as enrollees who have drug spending that exceeds the catastrophic coverage threshold in a given year who do not receive low-income subsidies (LIS). The catastrophic threshold is updated annually by the annual percentage increase in average expenditures for Part D drugs per eligible beneficiary; in 2017, the threshold amount was $8,071. The 2017 20% PDE sample includes 8.9 million Part D enrollees (44.6 million weighted), of whom 718,276 (3.6 million weighted) had spending above the catastrophic coverage threshold, including 203,332 (1.0 million weighted) who had high out-of-pocket drug costs and did not receive the LIS. Our analysis of spending by chronic condition excludes beneficiaries who did not meet coverage criteria necessary to assign conditions, including those with multiple months of Medicare Advantage enrollment. This is because the CCW variables that identify chronic conditions are defined algorithmically based on information in medical claims, which are not available for Medicare Advantage enrollees.
Our analysis of chronic conditions and specific drugs associated with high out-of-pocket spending was limited to conditions and drugs with 100 (500 weighted) or more non-LIS beneficiaries with high out-of-pocket drug costs in 2017 to avoid reporting estimates based on small sample size. For specific drugs, there are two drugs that had higher average out-of-pocket costs among Part D enrollees with high out-of-pocket spending than the top drug we report (H.P. Acthar), but the number of non-LIS users of each of those drugs in the CCW PDE for 2017 was less than 20. Therefore, our analysis of the 10 most expensive drugs among those with high out-of-pocket costs is conservative to the extent that it does not include some drugs with higher out-of-pocket costs but smaller sample sizes.
Appendix
| Medicare Part D Enrollees Without Low-income Subsidies (LIS) With Drug SpendingAbove the Catastrophic Threshold in 2017, by State | |||
| Total non-LIS enrollees | Number reaching catastrophic coverage | Share reaching catastrophic coverage | |
| U.S. Total | 30,890,515 | 1,016,660 | 3.3% |
| Alabama | 480,465 | 16,340 | 3.4% |
| Alaska | 18,840 | 780 | 4.1% |
| Arizona | 686,495 | 19,480 | 2.8% |
| Arkansas | 285,040 | 8,105 | 2.8% |
| California | 3,202,915 | 86,010 | 2.7% |
| Colorado | 489,630 | 12,030 | 2.5% |
| Connecticut | 338,195 | 11,380 | 3.4% |
| Delaware | 114,540 | 4,630 | 4.0% |
| D.C. | 20,835 | 670 | 3.2% |
| Florida | 2,391,780 | 71,060 | 3.0% |
| Georgia | 814,405 | 31,455 | 3.9% |
| Hawaii | 142,185 | 3,745 | 2.6% |
| Idaho | 166,270 | 4,120 | 2.5% |
| Illinois | 1,178,110 | 38,915 | 3.3% |
| Indiana | 699,780 | 25,415 | 3.6% |
| Iowa | 380,250 | 11,905 | 3.1% |
| Kansas | 294,230 | 10,065 | 3.4% |
| Kentucky | 458,755 | 16,835 | 3.7% |
| Louisiana | 396,365 | 12,455 | 3.1% |
| Maine | 147,390 | 3,730 | 2.5% |
| Maryland | 439,465 | 16,015 | 3.6% |
| Massachusetts | 665,075 | 18,595 | 2.8% |
| Michigan | 1,227,025 | 36,550 | 3.0% |
| Minnesota | 602,620 | 15,810 | 2.6% |
| Mississippi | 244,450 | 8,005 | 3.3% |
| Missouri | 684,475 | 21,260 | 3.1% |
| Montana | 116,325 | 3,120 | 2.7% |
| Nebraska | 197,985 | 6,910 | 3.5% |
| Nevada | 265,050 | 7,695 | 2.9% |
| New Hampshire | 149,445 | 4,095 | 2.7% |
| New Jersey | 905,225 | 46,540 | 5.1% |
| New Mexico | 182,375 | 4,295 | 2.4% |
| New York | 1,780,670 | 78,015 | 4.4% |
| North Carolina | 1,016,425 | 33,930 | 3.3% |
| North Dakota | 74,090 | 2,765 | 3.7% |
| Ohio | 1,363,430 | 42,175 | 3.1% |
| Oklahoma | 342,205 | 13,530 | 4.0% |
| Oregon | 464,680 | 11,910 | 2.6% |
| Pennsylvania | 1,556,205 | 60,275 | 3.9% |
| Rhode Island | 118,785 | 3,010 | 2.5% |
| South Carolina | 534,015 | 19,520 | 3.7% |
| South Dakota | 93,865 | 3,145 | 3.4% |
| Tennessee | 681,910 | 22,275 | 3.3% |
| Texas | 1,985,885 | 71,555 | 3.6% |
| Utah | 219,350 | 6,230 | 2.8% |
| Vermont | 73,305 | 2,245 | 3.1% |
| Virginia | 687,875 | 22,950 | 3.3% |
| Washington | 621,620 | 17,665 | 2.8% |
| West Virginia | 199,860 | 6,770 | 3.4% |
| Wisconsin | 635,630 | 18,955 | 3.0% |
| Wyoming | 54,720 | 1,725 | 3.2% |
| SOURCE: KFF analysis of 2017 prescription drug claims data from the CMS Chronic Conditions Data Warehouse. | |||