Medicaid Home and Community-Based Services Programs: 2013 Data Update
Executive Summary
As states continue to implement various aspects of the Affordable Care Act (ACA), developing and expanding home and community-based alternatives to institutional care remains a priority for many state Medicaid programs. 2013 marked the first time that home and community-based services (HCBS) accounted for a majority (51%) of national Medicaid long-term services and supports (LTSS) spending, increasing from 18 percent in 1995.1 The share of Medicaid LTSS spending devoted to HCBS has continued to rise, reaching 53 percent in 2014.0F2 At the same time, state Medicaid programs are operating at a time when state revenues are slowing, forcing more moderate spending growth and, as of 2016, continue to face the competing priorities of implementing the ACA’s streamlined eligibility and enrollment processes, determining whether to adopt the ACA’s Medicaid expansion, and pursuing a variety of delivery and payment system reforms.
This report summarizes the key national trends to emerge from the latest (2013) participant and expenditure data for the three main Medicaid HCBS programs: (1) the mandatory home health services state plan benefit, (2) the optional personal care services state plan benefit, and (3) optional § 1915 (c) HCBS waivers. It also briefly discusses the provision of Medicaid HCBS through § 1115 demonstration waivers and highlights findings from a 2015 survey of Medicaid HCBS participant eligibility, enrollment, and provider reimbursement policies, including those related to the U.S. Department of Labor (DOL) direct care worker rules and the Centers for Medicare and Medicaid Services’ (CMS) home and community-based settings rule. States also may provide HCBS through various options offered by the ACA, which are outside the scope of this report.
Key Findings: Trends in Medicaid HCBS Participants and Expenditures, 2003-2013
- In 2013, almost 3 million people accessed LTSS through one of the three main Medicaid HCBS programs (Figure 1). Within this population, the number of people receiving § 1915 (c) waiver services increased slightly from 2012 to 2013 (by 3%), while the number of people receiving personal care state plan services and home health state plan services decreased (by 18% and 11%, respectively). A total of 672,137 people received home health state plan services (in 50 states and DC), 774,243 received personal care state plan services (in 32 states), and almost 1.55 million were served through § 1915 (c) waivers (in 47 states and DC). The number of individual § 1915 (c) waivers declined slightly from 290 to 289 nationwide in 2013. States also may offer HCBS through the newer ACA options or § 1115 managed care programs instead of or in addition to these three authorities.
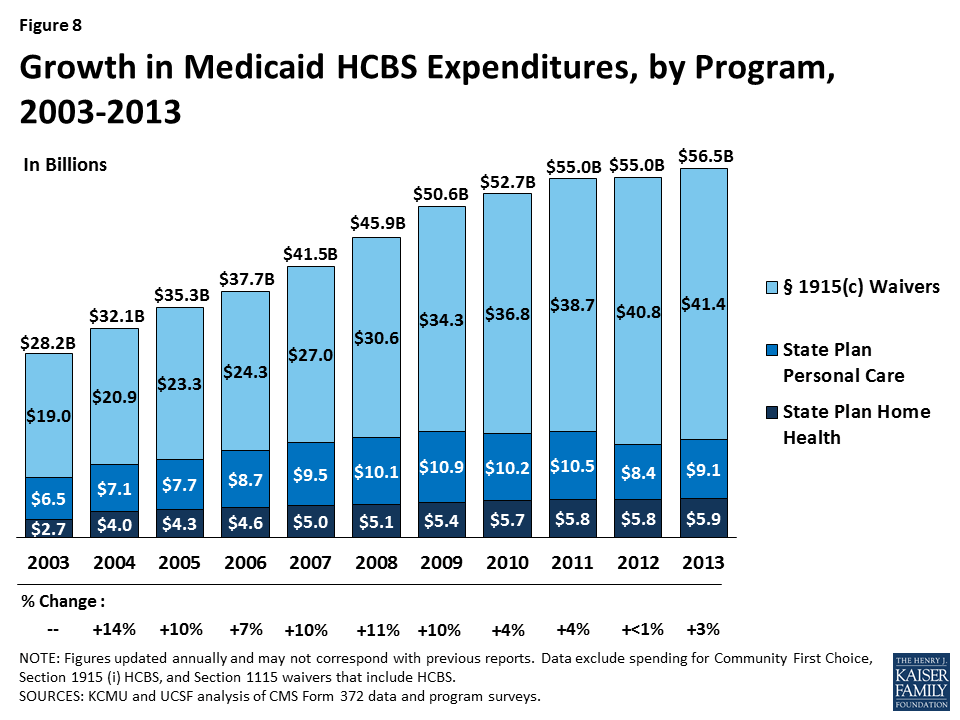
- In 2013, Medicaid HCBS expenditures for home health state plan services, personal care state plan services, and § 1915 (c) waivers totaled $56.5 billion, increasing slightly from 2012, and lower than the 10-year average of seven percent (Figure 2). In 2013, spending growth in HCBS programs was led by personal care state plan services (9%) followed by home health state plan services (2%), while § 1915 (c) waivers increased by only one percent.

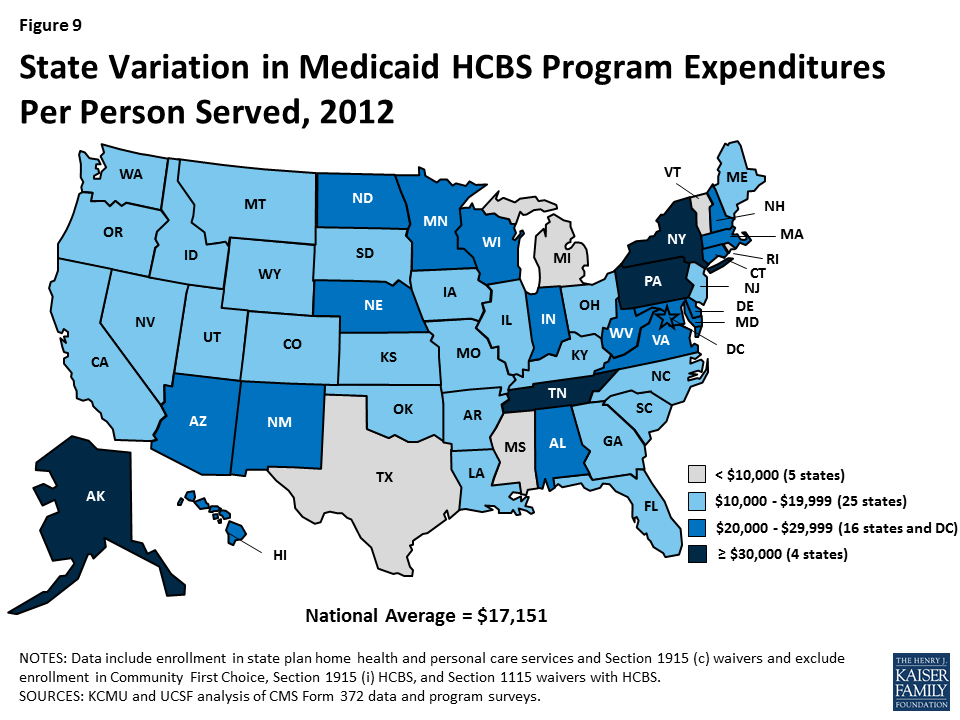
- Per participant annual spending on Medicaid HCBS averaged $18,870 in 2013, but there was considerable variation among states and programs. Across states, Medicaid HCBS expenditures per participant served ranged from $9,641 in Michigan to $49,212 in Delaware. Per participant spending also varied across the three main HCBS programs, ranging from a national average of $8,827 for home health state plan participants to $26,768 for § 1915 (c) waiver participants. These program-to-program differences were due to the types and extent of services offered in the different home and community-based programs. Per participant spending also varied among § 1915 (c) waivers targeted to different beneficiary populations. For example, per participant spending in § 1915 (c) waivers targeted to beneficiaries with intellectual/developmental disabilities (I/DD) was considerably higher than for other beneficiary groups, reflecting the I/DD population’s relatively more intensive need for LTSS.
- The aged/disabled population made up the largest share of waiver enrollment (48%) but accounted for 21 percent of spending on waiver services in 2013 (Figure 3). People with I/DD accounted for 41 percent of HCBS waiver enrollment in 2013, but 71 percent of spending on waiver services was devoted to this population, again reflecting their more intensive need for LTSS relative to other groups.
- A minority of states use § 1115 demonstration waivers to deliver HCBS through capitated managed care. As of 2013, three states (Arizona, Rhode Island, and Vermont) do not operate any § 1915 (c) waivers and instead use § 1115 waivers to administer statewide Medicaid managed care programs that include all covered HCBS for all populations and services. Another five states (Delaware, Hawaii, New York, Tennessee, and Texas) use § 1115 waivers for capitated Medicaid managed care programs that include HCBS for at least some geographic areas and/or populations.
2015 Policies in Medicaid HCBS Programs
- In 2015, all states reported using cost controls in § 1915 (c) waivers, such as restrictive financial and functional eligibility standards, enrollment limits, or waiting lists. About 25 percent of § 1915 (c) waiver programs used financial eligibility standards that were more restrictive than those used to determine eligibility for Medicaid coverage for institutional care. However, six § 1915 (c) waivers used more restrictive functional eligibility criteria than those used for institutional care. More than one half of states offering personal care state plan services (59%, or 20 states) had some form of cost controls in place, with the majority utilizing service unit limitations. Over half of states (59%, or 30 states) had some form of expenditure or service restriction in place in their home health state plan programs.
- In 2015, more than 640,000 people were on 133 § 1915 (c) waiver waiting lists, and the average waiting time exceeded two years. The growth in the number of people on waiting lists grew by 10 percent from 2014 to 2015, outpacing the growth rate of 8.5 percent in the previous period. The average national waiting time for § 1915 (c) waiver services was 27 months, with wide variations among waivers for different target populations and across states. The average length of time a person spent on a waiting list ranged from four months for HIV/AIDS waivers to 43 months for I/DD waivers.
- The use of beneficiary self-direction as an alternative service delivery model was present in each of the three major Medicaid HCBS programs. The self-direction model includes initiatives such as beneficiary choice in the allocation of Medicaid service budgets and/or the selection and dismissal of service providers. Forty-three states (or 91%) with § 1915 (c) waivers permitted or required self-direction in at least one of their waivers in 2015. Of the states offering personal care state plan services, 24 (or 71%) permitted self-direction. In contrast, seven states (or 14%) allowed self-direction of home health state plan services in 2015.
- In 2015, seven states reported plans to restrict caregiver hours or make other policy changes in response to the DOL direct care worker minimum wage and overtime rules, and six states had cost or service caps on self-directed services in place in 2015. Seven states indicated that state funds were budgeted for direct care worker overtime pay in FY 2016, and five states indicated state funds were budgeted for worker travel time.
- Twenty-one states anticipated having to change state rules or policies as part of their transition to CMS’s rule defining the qualities of home and community-based settings, as of 2015. In addition, 11 states planned to submit information to CMS seeking to overcome the regulatory presumption that certain settings are institutional in nature.
- Provider reimbursement rates increased slightly from 2014 to 2015, for both home health and personal care agencies. The national average reimbursement rate per visit for home health agencies was $92.69 and $93.93 in 2014 and 2015, respectively. The hourly reimbursement rate for agencies providing personal care services increased slightly ($18.82 in 2015 and $18.73 in 2014).
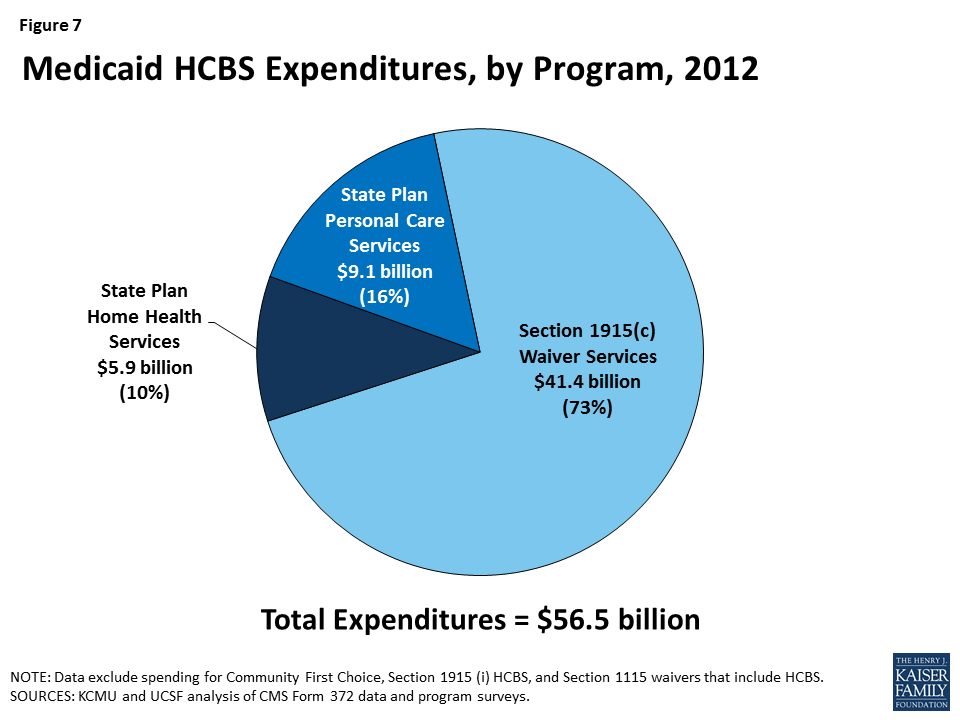
Over the past three decades, the increase in access to community-based alternatives to institutional care has resulted in some rebalancing of national Medicaid LTSS dollars, but the size and scope of Medicaid HCBS programs vary across states. Section 1915 (c) waivers account for the majority (73%) of spending on LTSS provided in community settings. In the coming years, states will be challenged to continue to expand access to high quality, person-centered HCBS in a cost-effective manner, and it will remain important to monitor states’ adoption of state plan options and other initiatives to expand Medicaid HCBS, differences in services and spending, and the impact of cost control policies on access and quality.
Introduction
Developing home and community-based alternatives to institutional care has been a priority for many state Medicaid programs over the past three decades. The national share of Medicaid long term services and supports (LTSS) spending on home and community-based services (HCBS) has nearly tripled, from 18 percent in 1995 to 53 percent in 2014.2F3 States’ efforts to expand HCBS have been driven by beneficiary needs and preferences, the United States Supreme Court’s 1999 Olmstead decision finding that the unjustified institutionalization of people with disabilities violates the Americans with Disabilities Act,3F4 and efforts to control growth in total LTSS expenditures. Spending on LTSS comprised 32 percent of total Medicaid spending in 2014,5 with HCBS typically costing less than comparable institutional care.4F Budgetary constraints during a time when overall state revenues are slowing, forcing more moderate spending growth across state budgets, and the administrative complexities of implementing and coordinating the various Medicaid LTSS options may pose challenges as states and the federal government continue to work to increase beneficiary access to HCBS and rebalance LTSS expenditures.
Over the last fifteen years, the Kaiser Family Foundation’s Commission on Medicaid and the Uninsured (KCMU) has worked with researchers at the University of California, San Francisco (UCSF) to track the development of the three main Medicaid HCBS programs: (1) the home health services state plan benefit, (2) the personal care services state plan benefit, and (3) § 1915 (c) HCBS waivers. Medicaid HCBS also may be provided through options created and expanded by the Affordable Care Act (ACA), such as the § 1915 (i) HCBS state plan option, the Money Follows the Person demonstration,5F6 and the Community First Choice state plan option; participants and expenditures attributable to these programs are outside the scope of this report. In addition, a minority of states provide some or all of their HCBS through § 1115 demonstration waivers, which are briefly discussed in this report.
Beginning in 2002, we also surveyed the policies states use to control spending growth in § 1915 (c) waiver programs, such as eligibility criteria and waiting lists. In 2007, we expanded the policy survey to include home health and personal care services state plan benefits and, in 2015, we added questions about state policy changes in response to new U.S. Department of Labor (DOL) minimum wage and overtime rules affecting direct care workers and the Centers for Medicare and Medicaid Services’ (CMS) rules defining characteristics of Medicaid home and community-based settings. In these state-level surveys, we collect data on eligibility criteria, providers, services, and reimbursement rates. This report summarizes the main trends to emerge from the latest (2013) participant and expenditure data for the three main Medicaid HCBS programs and findings from the 2015 survey of policies impacting the home health and personal care services state plan benefits and § 1915 (c) waivers.
Report
Medicaid HCBS Participants and Expenditures in 2013
Participants in Medicaid Home Health and Personal Care State Plan Services and§ 1915 (c) Waivers
In 2013, almost 3 million individuals received services through the three main Medicaid HCBS programs (Table 1A). Of those participants, 672,137 individuals received home health services through the mandatory state plan benefit, 774,243 individuals received personal care services through the optional state plan benefit, and 1,548,305 individuals were served through § 1915 (c) waivers (Figure 4). All states and DC offered the mandatory home health services state plan benefit in their Medicaid programs (Table 1B), while 32 states actively offered the optional personal care services state plan benefit,7 with Kansas as the latest state to elect this option in 2007 (Table 1C). Forty-seven states and DC operated multiple § 1915 (c) waivers in 2013 (Table 1D).
Participation in the three main HCBS programs declined by six percent between 2012 and 2013, the largest decline in the study period, and accelerating from less than a one percent decline the previous year. This was also well below the 10-year average growth rate of two percent (Table 1A and Figure 5). Some of this decline may be attributable to states offering HCBS through other authorities, such as Community First Choice, § 1915 (i), and/or § 1115 waivers.

Leading the 14 states with a decline in total HCBS enrollment between 2012 and 2013 was Delaware, with a 52 percent decline reported. Maine recorded the second largest decline with a 44 percent drop in total HCBS enrollment between 2012 and 2013 (Table 1A). Delaware’s decline in total HCBS enrollment was due largely to a drop in its § 1915 (c) waiver enrollment as the state shifted most of these waivers to a § 1115 capitated managed care waiver. Maine’s overall decline could be due to its 78 percent drop in its home health program enrollment after two years of growth, attributed to changes in reporting. On the other hand, Indiana, Louisiana, and New Mexico saw the largest increases (16%, 14%, and 14%, respectively) in total HCBS participants in 2013. All three states’ participant growth was driven by large increases in their § 1915 (c) waiver programs.
The decline in total HCBS enrollment in 2013 was led by declines in participation in both the home health state plan program (-11%) and the personal care state plan program (-18%) (Tables 1B and 1C). Declines in participation rates in both programs accelerated from last year, some of which may be attributable to states offering services through Community First Choice, § 1915 (i), and/or § 1115 waivers. Oregon led the decline in home health program enrollment with an 87 percent drop, attributed to a change in reporting, while Texas led the decline in personal care state plan participation with an 80 percent drop in 2013, also attributed to a change in reporting. Nationally, § 1915 (c) waiver program participation increased by three percent from 2012 to 2013, the same rate of increase as the previous year, although nine states reported declines in participation led by Delaware (-71%) and Texas (-16%) (Table 1D). Delaware’s decline is attributable to the state discontinuing several § 1915 (c) waivers and instead providing services through a § 1115 waiver. Figure 6 illustrates the variation in total Medicaid HCBS program participation among the states.
Expenditures in Medicaid Home Health and Personal Care State Plan Services and § 1915 (c) Waivers
In 2013, total Medicaid spending on HCBS across the three main programs was $56.5 billion (Table 2A). As in past years, the large majority of Medicaid spending on HCBS was for § 1915 (c) waivers. In 2013, Medicaid spending on § 1915 (c) waivers was $41.4 billion, compared to $9.1 billion on personal care state plan services and $5.9 billion on home health state plan services (Tables 2B, 2C, 2D and Figure 7).
Between 2003 and 2013, total annual Medicaid spending on HCBS in the three main programs doubled, with an average annual increase of seven percent (Figure 8). After the lowest growth in HCBS spending within the study period between 2011 and 2012, spending growth rebounded to three percent between 2012 and 2013. This was lower than the 6.9 percent growth recorded for total Medicaid spending during the same period.7F8 Amid slow growth in HCBS expenditures, nine states reported a decline in total Medicaid HCBS expenditures between 2012 and 2013. Declines were led by Oregon and Texas (-17% and -13% respectively) (Table 2A).
However, Medicaid HCBS expenditures as a proportion of total Medicaid LTSS expenditures continued to increase between 2012 and 2013 as they have done every year since 1995.9
National total Medicaid HCBS expenditure data mask state-to-state variations in spending across the three major programs. First, while national per participant spending on Medicaid HCBS averaged $18,870 in 2013, state spending ranged from $9,641 in Michigan to $49,212 in Delaware (Table 3A and Figure 9). With the move of Delaware’s other HCBS waiver programs from § 1915 (c) to a § 1115 managed LTSS waiver, the only § 1915 (c) waiver remaining in Delaware is for people with intellectual or developmental disabilities (I/DD), and that population’s more intensive needs may account for the higher per participant spending.
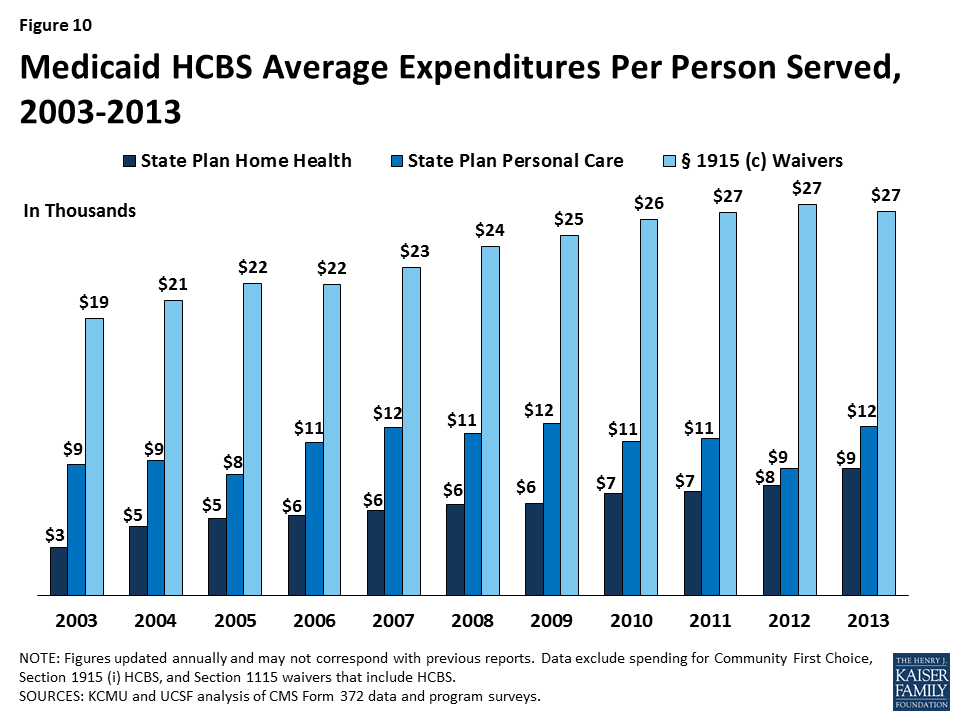
Second, differences exist in spending across the three major Medicaid HCBS programs. National per participant expenditures ranged from $8,827 for home health state plan services participants to $26,768 for § 1915 (c) waiver participants in 2013 (Table 3B, 3C, 3D and Figure 10). This difference was likely due to the types and extent of services provided in each of the three main HCBS programs. The lower national per participant spending on home health state plan services likely reflects shorter periods of per participant service utilization compared to either § 1915 (c) waivers or the personal care services state plan option. Third, there was also significant per participant expenditure variation among § 1915 (c) waivers targeted to different populations (Tables 4 and 7).
Medicaid § 1915 (c) Waivers
Between 2012 and 2013, the number of § 1915 (c) waivers declined slightly from 290 to 289. In 2013, with the exception of Arizona, Rhode Island, and Vermont, which operate their entire Medicaid LTSS programs through § 1115 waivers and therefore do not offer any § 1915 (c) waivers, every state and DC had at least one § 1915 (c) waiver targeted to populations that would otherwise require institutional care. These beneficiary groups include: the aged (age 65 and over), aged or disabled, individuals with physical disabilities, individuals with I/DD, children who are medically fragile or technology-dependent, individuals with HIV/AIDS, and individuals with traumatic brain and/or spinal cord injury (TBI/SCI).
Table 4 details, by waiver type, § 1915 (c) waiver enrollment, total expenditures, and per participant expenditures for the two most recent reporting years. In 2013, 1,548,305 participants were served through Medicaid § 1915 (c) waivers (Tables 4 and 5). The three percent (or 47,963 beneficiaries) increase from 2012 to 2013 is the same rate of increase as between 2011 to 2012. The largest share of § 1915 (c) waiver participants in 2013 (750,783 beneficiaries, or 48%) received services through waivers that targeted the aged and aged or disabled. The next largest group of waiver participants (625,976) was enrolled in § 1915 (c) waivers for people with I/DD, representing 41 percent of national § 1915 (c) waiver enrollment (Table 5 and Figure 11). Enrollment in waivers targeted solely to persons with physical disabilities accounted for only six percent (88,949) of § 1915 (c) waiver participants nationwide. The § 1915 (c) waivers with the smallest enrollment were those for individuals with mental health disabilities (4,243), individuals with HIV/AIDS (12,287), individuals with TBI/SCI (17,134), and children who are medically fragile or technology-dependent (48,933) (Tables 4 and 5). The § 1915 (c) waivers with the largest annual increase in participation were those targeted to seniors (11%), followed by those serving children with disabilities (9%). There was a decline (-9%) in participants for waivers serving individuals with HIV/AIDS, the only decline recorded among all waiver groups (Table 4).

In 2013, overall expenditures for § 1915 (c) waivers increased to $41.4 billion, a one percent increase compared to 2012, and a slowdown from the six percent rise recorded between 2011 to 2012. The vast majority of spending on § 1915 (c) waivers was for individuals with I/DD. Although individuals enrolled in I/DD waivers accounted for just 41 percent of total waiver participants, expenditures for this population accounted for 71 percent of all § 1915 (c) waiver spending (Tables 4 and 6 and Figure 10). Between 2012 and 2013, the annual rate of expenditure growth was highest for waivers serving seniors (15%) and children with disabilities (11%), primarily due to increases in participation. There was a sharp fall (-24%) in expenditures on waivers serving people with mental health disabilities (of which there are only five nationally) as well as a four percent decline recorded in waivers serving individuals with HIV/AIDS (Table 4).
Growth in § 1915 (c) waiver expenditures per participant declined by two percent from 2012 to 2013, the first decline since the study began, with a 10-year average growth of three percent (Tables 4 and 7). People with I/DD had the highest spending per participant served ($46,644). Although this amount was more than four times higher than average waiver spending on both aged ($11,907) and aged or disabled ($11,689) waiver participants, average spending per I/DD participant fell by two percent from 2012. On the other hand, per participant expenditures grew by six percent from 2012 to 2013 for waivers for people with HIV/AIDS while waivers serving people with mental health disabilities and the aged and disabled fell by 28 percent and two percent respectively (Table 4).
Medicaid § 1915 (c) Waiver Services
Our survey also collected service type data for individual § 1915 (c) waivers. States may provide many different services within these waivers, which our survey collapses into six categories: (1) case management; (2) respite/home health/personal care; (3) habilitation/day care; (4) nursing/therapy; (5) residential/foster care; and (6) other services. Participants within a waiver may use more than one service, and as such, the sum of these participants does not equal the unduplicated total waiver participants. Most participants (1,532,316) received “other” services including assistance with chores, meals, transportation, and home modifications. More than 866,000 participants received respite, home health or personal care services within these waivers in 2013, with Ohio providing these services to the most waiver enrollees (75,623) (Table 8).
Of the total $41.4 billion spent on § 1915 (c) waivers in 2013, almost 40% ($16.5 billion) was spent on habilitation or adult day care services, with New York spending more than $5.1 billion and Pennsylvania spending more than $1.7 billion. States spent more than $12.3 billion on respite, home health or personal care services within § 1915 (c) waivers, with Ohio, Virginia and Wisconsin each spending more than $1 billion on such services (Table 9). The most expensive waiver service on a per participant basis in 2013 was habilitation or adult day care services, with $25,068 spent per waiver participant nationwide. There is large inter-state variation in habilitation or adult day care services spending per participant, ranging from $2,028 in New Jersey to $62,304 in Massachusetts. Case management was the least expensive § 1915 (c) waiver service nationwide at $1,786 per participant (Table 10).
HCBS and Managed LTSS within § 1115 Waivers
In addition to the Medicaid home health and personal care services state plan benefits and § 1915 (c) waivers, states can deliver HCBS through § 1115 demonstration waivers.9F10 Section 1115 of the Social Security Act allows the Secretary of the Department of Health and Human Services to waive state compliance with certain federal Medicaid requirements and authorizes the use of federal Medicaid funds in ways that are not otherwise allowable. Section 1115 waivers enable “experimental, pilot or demonstration project[s] which, in the judgment of the Secretary, [are] likely to assist in promoting the objectives [of the Medicaid program].”10F11 Section 1115 waivers have been used to implement a variety of initiatives related to HCBS, such as self-direction of personal care services,11F12 payments to spouses who provide personal care services, and mandatory enrollment in capitated managed LTSS.
In 2013, three states (Arizona, Rhode Island, and Vermont13 ) used § 1115 waivers to administer statewide Medicaid capitated managed care programs14 that include all HCBS covered for all populations; these states do not offer any § 1915 (c) waivers. In 2013, Arizona spent $1.1 billion on HCBS for 45,026 participants, Rhode Island spent $481 million on HCBS for 4,912 participants, and Vermont spent $254 million on HCBS for 5,212 participants.115 In addition to Arizona, Rhode Island, and Vermont’s statewide programs, another five states13F (Delaware, Hawaii, New York, Tennessee, and Texas)16 use § 1115 waivers for Medicaid capitated managed care programs that include HCBS for at least some populations in 2013 (not captured in this report); these states also offer § 1915 (c) waivers for other populations receiving HCBS (which are included in this report).14F17
Eligibility and Cost Containment Policies Used in Medicaid HCBS Programs in 2015
Medicaid § 1915 (c) Waivers
The Medicaid § 1915 (c) waiver authority allows states to use a range of cost-containment strategies to meet federal cost neutrality requirements and limit spending so that expenditures do not exceed state budgetary restrictions. To understand how states controlled spending on HCBS waivers in 2015, we surveyed all state § 1915 (c) waiver program administrators to assess financial and functional eligibility standards, use of enrollment and/or expenditure caps, and waiting list status (i.e., number of individuals on the list(s) and average waiting time). The survey finds that every state used some type of cost-containment tool in its § 1915 (c) waivers beyond the federal cost neutrality requirement that average annual per participant waiver spending not exceed average per participant spending if services were provided in an institutional setting under the state plan absent the waiver. The following summary of the 2015 survey findings illustrates how states use cost control policies to limit access to § 1915 (c) waivers.
Financial Eligibility
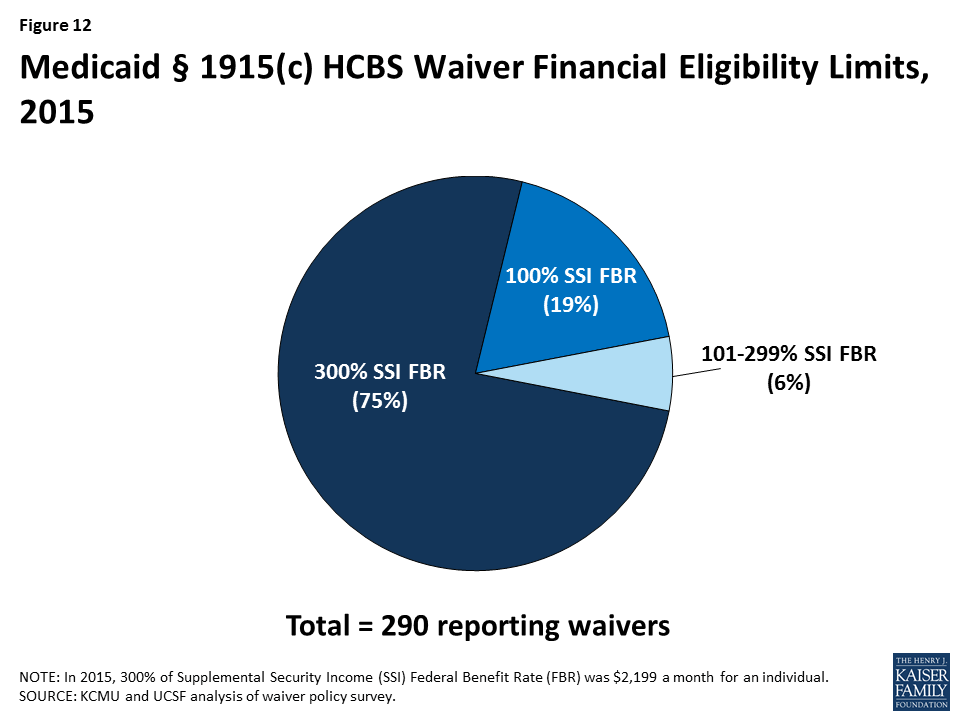
Most states set their Medicaid financial eligibility standard for nursing facility services at 300 percent of the Supplemental Security Income (SSI) federal benefit rate ($2,199/month for an individual in 2015). States may set financial eligibility standards for Medicaid § 1915 (c) waivers at the same level as that for nursing facilities. There is, however, wide variation in financial eligibility standards across states and HCBS waiver programs as shown in Table 11. Twenty-five percent of reporting waiver programs used more restrictive financial eligibility standards (e.g., 100% of SSI) than used for nursing facilities (300% of SSI) in 2015 (Table 11 and Figure 12).
Functional Eligibility
Another way states limit eligibility for § 1915 (c) waivers is by using functional eligibility criteria that are stricter than those used to qualify for coverage of nursing facility care. For example, a state could require an individual to exhibit difficulty in performing at least three activities of daily living (ADLs, e.g., bathing, dressing, transferring, eating, toileting) for waiver eligibility but require limitations in only two ADLs for nursing facility services. The 2015 survey found that six § 1915 (c) waiver programs (2%) used functional eligibility criteria that are more restrictive than the criteria used for institutional care (no table shown); these waivers were reported in Alabama, Georgia, Idaho, Kansas, New York, and Wisconsin.
Cost Controls
Approximately 88 percent (42 states) of all states with § 1915 (c) waivers utilized some form of cost controls above and beyond the federally mandated cost neutrality formula in 2015. Many states used a mixture of fixed expenditure caps, service provision and hourly caps, and geographic limits (Table 12). Of the states with waiver cost controls in place, more than half (22 states) utilized more than one form, such as a combination of expenditure caps and service limitations (Table 12).
Self-Direction
Many states have incorporated some form of mandatory or optional self-direction within their § 1915 (c) waivers. The self-direction service delivery model can include initiatives such as beneficiary choice in the allocation of service budgets and/or the selection, training, and dismissal of service providers. In 2015, 43 states (91% of states) either allowed or required some form of self-direction (Table 12).
Policy Changes Related to U.S. Department of Labor Direct Care Worker Rules
In 2015, states are working to implement the DOL rules that extend Fair Labor Standards Act (FLSA) minimum wage and overtime pay protections to direct care workers who previously were exempt from these requirements.18 Direct care workers who provide HCBS can include certified nursing assistants, home health aides, personal care aides, and other caregivers. The new DOL rules recognize the professionalization and expansion of the direct care workforce as these workers provide increasingly skilled care and more people receive services at home instead of in institutions.19 The changes may affect Medicaid services provided through a self-directed model; CMS anticipates that “many states will determine that, for purposes of the FLSA, home care workers in self-direction programs have joint third party employer(s) [such as the state or another entity] in addition to being employed by the beneficiary”20 and thus the state or other entity is subject to minimum wage and overtime requirements. Consequently, CMS observes that “many states will need to develop policies and consider programmatic changes to address the costs related to overtime and/or worker time spent traveling between worksites (i.e., individuals’ homes), to avoid or minimize negative impacts to individual [service] budgets, and to preserve the ability of individuals to self-direct services and supports effectively.”21 This year’s survey asked states about policy changes in response to the new DOL rules.
In 2015, 11 waivers in seven states (California, Kentucky, Maryland, Maine, New Mexico, Oregon, and Washington) planned to control caregiver hours or make other changes in response to the DOL minimum wage and overtime rules. For example, California increased provider payment rates to meet the DOL requirements, while four states were limiting caregiver hours as a result of the new rule (40 hours per week limit in Maine and New Mexico; 50 hour limit in Oregon; independent providers working over 40 hours in Washington may work overtime up to 65 hours). In addition, 12 waivers in six states (Louisiana, New Mexico, New York, Oregon, Texas, and Washington) had cost or service caps on self-directed § 1915 (c) services in place in 2015. Eighteen waivers in seven states (California, Connecticut, Kentucky, Oregon, Pennsylvania, South Carolina, and Washington) indicated that state funds were budgeted for direct care worker overtime pay in FY 2016, while eleven waivers in five states (California, Connecticut, Oregon, South Carolina, and Washington) reported that state funds were budgeted for direct care worker travel time pay in FY 2016 (no table shown). State policies may continue to evolve in this area as states gain more experience operating under the new rules.
Waiting Lists
States often have more individuals who need Medicaid home and community-based waiver services than the number of available spaces, called “slots,” in a § 1915 (c) waiver (Table 13). Many states maintain waiting lists when their program slots are filled or when state legislatures do not fully fund the maximum number of slots approved by CMS. In 2015, 35 states reported waiver waiting lists, while 12 states and DC reported no such lists (Table 14). In 2015, there were 640,841 individuals on waiver waiting lists across 133 § 1915 (c) waivers. Section 1915 (c) waivers for people with I/DD had the greatest number of individuals on waiting lists (428,151 individuals, or 67% of total waiting list enrollment) followed by waivers serving people who are aged and aged or disabled (145,424 individuals, or 23% of total waiting list enrollment) (Table 14, Figure 13). Most states reported that virtually all of the people on waiver waiting lists currently reside in the community, although they may still be at risk of institutionalization. Due to the varying number of waiver slots available for each population, the average length of time an individual spent on a waiting list differed by population and ranged from four months for HIV/AIDS waivers to 43 months for I/DD waivers, with an average national waiting time of 27 months across all § 1915 (c) waivers with waiting lists (Table 14).
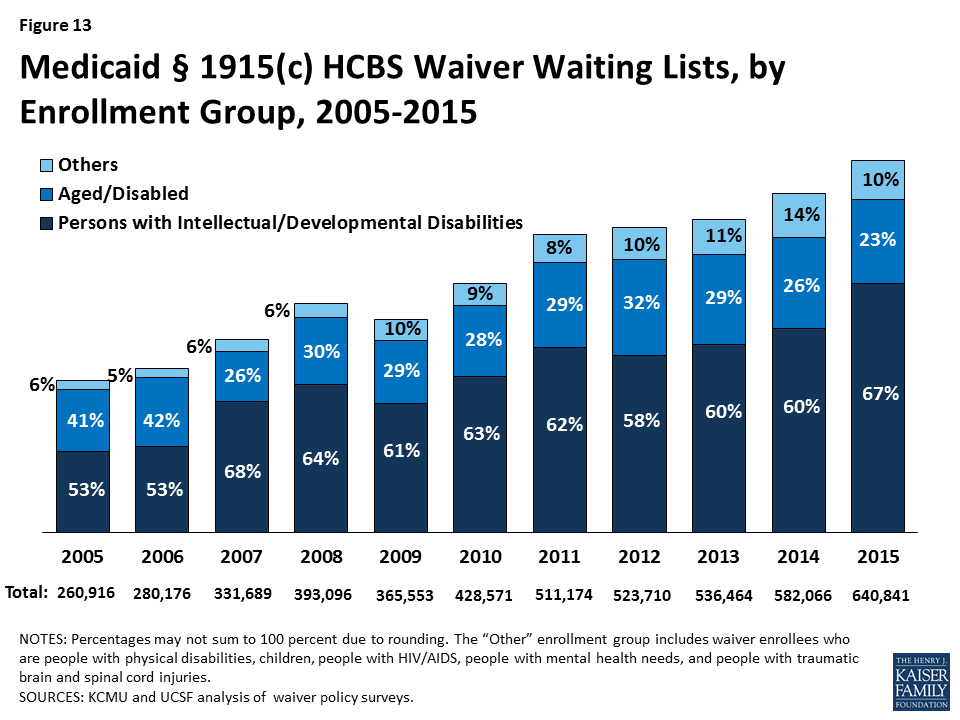
The number of individuals on § 1915 (c) waiver waiting lists grew by 10 percent from 2014 to 2015, outpacing the 8.5 percent growth rate in the 2013-2014 period. From 2005 to 2015, waiting list enrollment grew by an average of 14 percent annually. Waiting lists for some § 1915 (c) waiver target populations increased, with the exception of waivers for people who are aged and disabled, physically disabled, children who are medically frail, and those for people with TBI/SCI (Table 14). The maintenance and length of state waiver waiting lists has implications for states’ compliance with the Olmstead decision, which requires states to provide services outside of institutions if beneficiaries are able to live in the community and do not oppose doing so.
In 2015, two-thirds (67%) of all § 1915 (c) waivers with waiting lists had a policy of screening individuals for Medicaid waiver eligibility before being placed or while on a waiting list (Table 13). In addition, more than two-thirds (70%) of all waivers with waiting lists had a policy of prioritizing certain individuals for waiver services (e.g., people transitioning to the community from an institution get priority for waiver services when slots become available). Ninety-two percent of all waivers with waiting lists provided non-waiver services (i.e., state plan services) to Medicaid eligible individuals on waiver waiting lists.
Implementation of CMS Home and Community-based Settings Rule
States also are working to come into compliance with CMS’s January, 2014 rule defining the qualities of home and community-based settings in which § 1915 (c) waiver services can be provided.22 This rule seeks to ensure that beneficiaries receiving Medicaid HCBS have “full access to the benefits of community living and the opportunity to receive services in the most integrated setting.”23 To be considered community-based, the rule requires that both residential and non-residential settings support an individual’s full access to the greater community; are selected by the individual from options including non-disability specific settings; ensure individual privacy, dignity, respect and freedom from coercion or restraint; optimize individual autonomy in making life choices; and facilitate individual choice regarding services and providers. There are additional criteria applied to provider-owned or –controlled residential settings to ensure individual privacy and autonomy. States had to submit transition plans, which were subject to public notice and comment, that explain how their existing § 1915 (c) waivers will come into compliance with these new standards; most of these plans currently are pending approval by CMS.24
This year’s survey asked states about policy changes in response to the home and community-based settings rule. Twenty-one states (California, Colorado, Connecticut, Idaho, Indiana, Kentucky, Louisiana, Maryland, Missouri, Mississippi, Montana, Nevada, New Mexico, New York, North Carolina, Ohio, Oregon, Pennsylvania, Utah, Washington, and Wyoming) anticipated having to change state rules or policies as part of their transition to the new home and community-based settings rule. Thirty waivers in 13 states (California, Colorado, Indiana, Louisiana, Maryland, Michigan, Missouri, Montana, New Mexico, New York, Oregon, Washington, and Wyoming) had identified some settings that do not meet the new rules and consequently will need to be modified so that beneficiaries can continue to receive Medicaid-funded HCBS there. Additionally, two states (Oregon and Washington) identified some non-residential settings that cannot be modified to meet the new requirements, with the result that beneficiaries will be need to be relocated to continue receiving Medicaid-funded HCBS.
The new rule presumes that certain settings are not community-based because they have institutional qualities, such as those in a facility that provides inpatient treatment, those on the grounds of or adjacent to a public institution, and those that have the effect of isolating individuals from the broader community. However, the rule permits the Secretary to overcome this presumption by applying heightened scrutiny based on information submitted by the state. Eleven states (California, Connecticut, Indiana, Kentucky, Louisiana, Michigan, Missouri, Montana, Nevada, Oregon, and Wyoming) planned to submit information asking the Secretary to determine that such a setting does not have the qualities of an institution and is home and community-based so that the state could continue to provide Medicaid-funded HCBS in those settings. Ten states (California, Colorado, Indiana, Kentucky, Maryland, Missouri, Nevada, Oregon, Washington, and Wyoming) identified settings that effectively isolate beneficiaries from the greater community and therefore are presumed institutional under the rule. As CMS’s review of the states’ transition plans proceeds, additional policy changes in this area may emerge.
Medicaid Home Health and Personal Care Services State Plan Benefits
Unlike waivers, states are not permitted to maintain waiting lists or geographically limit the services provided through Medicaid home health and personal care state plan benefits. State plan services must be available to all beneficiaries as medically necessary. However, federal Medicaid rules allow states to use certain cost-containment strategies for state plan benefits. To understand how states controlled spending for home health and personal care services state plan benefits in 2015, all state Medicaid programs were asked about approved provider types, services provided within the scope of each benefit, the use of any expenditure or service caps, and the availability of self-direction within the programs. The following summary of the 2015 survey findings shows how states use cost control policies to limit access to Medicaid home health and personal care state plan services.25
Providers and Services
To obtain a more comprehensive picture of the three main Medicaid HCBS programs, states were asked about the types of approved providers for state plan HCBS and the scope of benefits provided (no Tables shown). In addition to licensed home health agencies, 17 states (33%) allowed hospice agencies to provide home health state plan services, while Centers for Independent Living and independent providers were allowed to provide personal care state plan services in 14 states (41%) and 19 states (56%), respectively.
In addition to skilled nursing services, therapy services, and home health aide services for assistance with ADLs, 14 states (27%) provided assistance with instrumental ADLs (e.g., medication management, meal preparation) as part of their home health state plan benefit. In addition, although therapy services are optional within the home health services state plan benefit, almost all states provide some form of therapy, such as physical, occupational, or speech. Even though case management is not required under the home health state plan benefit, four states (8%) provided this service.
Among states with personal care state plan services, 30 states (88%) provided assistance with instrumental ADLs, while 14 states (41%) provided some sort of transportation services. Case management was offered in eight states (24%) within the personal care services state plan option.
Cost Controls
More than half of all states (59%, or 30 states) utilized either expenditure or service limits or both in their home health services state plan programs in 2015, while 59 percent of states with the optional personal care services state plan benefit used cost control limits. Among states offering the optional personal care services state plan benefit, 19 states used service limits while only one state used expenditure limits. Among the 30 states with cost controls in their home health services state plan benefit, Connecticut, Michigan and Oregon had a combination of expenditure and service limits while the rest had only one of these limits in place. Service limitations were the most popular form of cost control for home health state plan services, with 26 states (87% of cost control states) using such limits (Table 12).
Self-Direction
In 2015, only seven states allowed self-direction within their home health services state plan programs. In contrast, 71 percent of states (24 states) with the personal care services state plan option allowed self-direction (Table 12).
Provider Reimbursement
The average reimbursement rate that states provided to home health agencies was $93.93 per home health visit in 2015, slightly higher than $92.69 in 2014. In states that paid registered nurses or home health aides directly or mandated their reimbursement rates, the average rate per visit was $87.26 and $52.19, respectively (Table 15). For the personal care services state plan option, the average rate paid to provider agencies was $18.82 per hour in 2015, a slight increase from $18.73 per hour in 2014. In states where personal care services providers were paid directly by the state or where reimbursement rates were determined by the state, the average reimbursement rate was $13.43 per hour in 2015 (Table 1526 ). Medicaid provider reimbursement rates are often set by state legislatures as part of the budget process.
Conclusion
Over the past three decades, the increase in access to community-based alternatives to institutional care has resulted in rebalancing of national Medicaid LTSS dollars, while the size and scope of Medicaid HCBS programs continues to vary across states. Section 1915 (c) waivers still account for the majority (73%) of spending on LTSS provided in the community, and continued growth in waiver waiting list enrollment, to more than 640,000 persons nationally with waiting times of almost two and a half years, highlights the need for HCBS, especially for individuals with I/DD, seniors, and non-elderly people with physical disabilities. States continue to review and change policies in response to new regulatory requirements, including the DOL home care worker rules and CMS’s rule defining the qualities of home and community-based settings.
At the same time, competing pressures in state budgets may mean that states may face uncertainties about funding for Medicaid HCBS in the coming years, and states are continuing to utilize cost control measures within their Medicaid HCBS programs. In response to fiscal pressures and a desire to better coordinate beneficiaries’ LTSS, states continue to incorporate HCBS into Medicaid managed care arrangements. In the coming years, states will be challenged to continue to expand access to high quality, person-centered HCBS in a cost-effective manner, and it will remain important to monitor the adoption of state plan options and other initiatives to expand Medicaid HCBS, differences in services and spending, and the impact of cost control policies on access and quality.
Endnotes
- Steve Eiken, Kate Sredl, Brian Burwell, and Paul Saucier, Medicaid Expenditures for Long Term Services and Supports (LTSS) in FY 2014, (Bethesda, MD: Truven Health Analytics, April 2016), https://www.medicaid.gov/medicaid-chip-program-information/by-topics/long-term-services-and-supports/downloads/ltss-expenditures-2014.pdf. ↩︎
- Id. ↩︎
- Id. ↩︎
- Olmstead v. L.C., 527 U.S. 581 (1999), available at http://www.law.cornell.edu/supct/html/98-536.ZS.html; see also Kaiser Commission on Medicaid and the Uninsured, Olmstead’s Role in Community Integration for People with Disabilities Under Medicaid: 15 Years after the Supreme Court’s Olmstead Decision (Washington, DC: Kaiser Family Foundation, June 2014), https://modern.kff.org/medicaid/issue-brief/olmsteads-role-in-community-integration-for-people-with-disabilities-under-medicaid-15-years-after-the-supreme-courts-olmstead-decision/. ↩︎
- Steve Eiken, Kate Sredl, Brian Burwell, and Paul Saucier, Medicaid Expenditures for Long Term Services and Supports (LTSS) in FY 2014, (Bethesda, MD: Truven Health Analytics, April 2016), https://www.medicaid.gov/medicaid-chip-program-information/by-topics/long-term-services-and-supports/downloads/ltss-expenditures-2014.pdf. ↩︎
- MFP funding expires in September 2016. For more information, see Kaiser Commission on Medicaid and the Uninsured, Money Follows the Person: A 2015 State Survey of Transitions, Services, and Costs (Washington, DC: Kaiser Family Foundation, October 2015), https://modern.kff.org/medicaid/report/money-follows-the-person-a-2015-state-survey-of-transitions-services-and-costs/. ↩︎
- Delaware and Rhode Island had CMS approval to offer personal care state plan services but did not report any participants in their programs. ↩︎
- Kaiser Commission on Medicaid and the Uninsured, Implementing the ACA: Medicaid Spending & Enrollment Growth for FY 2014 and FY 2015 (Washington, DC: Kaiser Family Foundation, October 2014), https://modern.kff.org/medicaid/report-section/implementing-the-aca-medicaid-spending-enrollment-growth-issue-brief. ↩︎
- Steve Eiken, Kate Sredl, Brian Burwell, and Paul Saucier, Medicaid Expenditures for Long Term Services and Supports (LTSS) in FY 2014, (Bethesda, MD: Truven Health Analytics, April 2016), https://www.medicaid.gov/medicaid-chip-program-information/by-topics/long-term-services-and-supports/downloads/ltss-expenditures-2014.pdf. ↩︎
- For background about § 1115 waivers, see Kaiser Commission on Medicaid and the Uninsured, Five Key Questions and Answers About Section 1115 Medicaid Demonstration Waivers (Washington, DC: Kaiser Family Foundation, June 2011), https://modern.kff.org/health-reform/issue-brief/five-key-questions-and-answers-about-section/. ↩︎
- 42 U.S.C. § 1315(a). ↩︎
- Self-direction of personal care services is available to states under the § 1915 (j) option, which allows states to offer self-direction provided that states offer personal care services as an optional state plan benefit or through a § 1915 (c) waiver. 42 U.S.C. § 1396n(j)(4)(A); 42 C.F.R. § 441.452(a). ↩︎
- Vermont’s model is unique in that the state serves as the managed care entity. ↩︎
- Other states implement capitated Medicaid managed LTSS programs through combination § 1915 (b)/(c) waivers. Section 1915 (b) waivers allow states to offer Medicaid services in a managed care model or otherwise limit a beneficiary’s choice of providers. ↩︎
- Expenditure data from Steve Eiken, Kate Sredl, Brian Burwell, and Paul Saucier, Medicaid Expenditures for Long Term Services and Supports (LTSS) in FY 2014, (Bethesda, MD: Truven Health Analytics, April 2016), https://www.medicaid.gov/medicaid-chip-program-information/by-topics/long-term-services-and-supports/downloads/ltss-expenditures-2014.pdf; participant data from Rhode Island Executive Office of Health and Human Services, Quarterly Operation Report: Rhode Island Global Consumer Choice Compact 1115 Waiver Demonstration, January 1, 2013 – March 31, 2013, (Providence, RI: Rhode Island Executive Office of Health and Human Services, September 2013), http://www.eohhs.ri.gov/Portals/0/Uploads/Documents/Quarterly%20Global%20Wavier%20Report%20January%20-%20March%20%202013_1.pdf; State of Vermont Agency of Human Services, Global Commitment to Health, Quarterly Report (Waterbury, VT: State of Vermont Agency of Human Services, November 2013), available at http://dvha.vermont.gov/global-commitment-to-health/gc-ffy13-qtr-4-report.pdf. Arizona participation counts as reported by state officials to KCMU and UCSF, 2016. ↩︎
- Minnesota has a Section 1115 waiver that offers some fee-for-service HCBS, including Section 1915 (i) and Community First Choice services. Kansas has a joint Section 1115/Section 1915 (c) waiver. New Jersey’s Section 1115 waiver was approved in 2012, but enrollment was not effective until July, 2014. ↩︎
- Kaiser Commission on Medicaid and the Uninsured, Key Themes in Capitated Medicaid Managed Long-Term Services and Supports Waivers (Washington, DC: Kaiser Family Foundation, November 2014), https://modern.kff.org/medicaid/issue-brief/key-themes-in-capitated-medicaid-managed-long-term-services-and-supports-waivers/. ↩︎
- U.S. Dep’t of Labor, Information on the Final Rule: Application of the Fair Labor Standards Act to Domestic Service, http://www.dol.gov/whd/homecare/finalrule.htm. While the new rules were to be effective in January, 2015, enforcement was delayed, and they were challenged in litigation. In August, 2015, the D.C. Circuit Court of Appeals upheld the regulations. Home Care Assoc. of America v. Weil, No. 15-5018 (D.C. Cir. Aug. 21, 2015), http://www.dol.gov/whd/homecare/0821appealdecision.pdf. DOL has revised its time-limited non-enforcement policy, with no actions to enforce the new rules until 30 days after the D.C. Circuit Court’s decision became final, and discretion in enforcement actions considering good faith efforts to comply with the new rule through December 2015. U.S. Dep’t of Labor, We Count on Home Care, Time-Limited Non-Enforcement Policy, http://www.dol.gov/whd/homecare/non-enforcement_policy.htm; see also 80 Fed. Reg. 55029 (Sept. 14, 2015), http://www.gpo.gov/fdsys/pkg/FR-2015-09-14/pdf/2015-23092.pdf; U.S. Dep’t of Justice, Civil Rights Division and U.S. Dep’t of Health & Human Servs., Office for Civil Rights, Dear Colleague letter (Dec. 15, 2014), http://www.ada.gov/olmstead/documents/doj_hhs_letter.pdf. ↩︎
- 78 Fed. Reg. 60453-60557 (Oct. 1, 2013), http://webapps.dol.gov/FederalRegister/PdfDisplay.aspx?DocId=27104. ↩︎
- CMS Informational Bulletin, Self-Direction Program Options for Medicaid Payments in the Implementation of the Fair Labor Standards Act Regulation Changes (July 3, 2014), http://www.medicaid.gov/Federal-Policy-Guidance/Downloads/CIB-07-03-2014.pdf. ↩︎
- Id. ↩︎
- 42 C.F.R. § 441.301 (c)(4)-(6). The settings rules also apply to Section 1915 (i) and Community First Choice services. CMS also has indicated it will include these requirements in the special terms and conditions of § 1115 demonstrations that include individuals receiving HCBS. CMS, Questions and Answers – 1915 (i) State Plan Home and Community-Based Services, 5-Year Period for Waivers, Provider Payment Reassignment, Setting Requirements for Community First Choice, and 1915 (c) Home and Community-Based Services Waivers – CMS 2249-F and 2296-F, https://www.medicaid.gov/Medicaid-CHIP-Program-Information/By-Topics/Long-Term-Services-and-Supports/Home-and-Community-Based-Services/Downloads/Final-Q-and-A.pdf. ↩︎
- Disabled and Elderly Health Programs Group, Centers for Medicare & Medicaid Services, Final Rule Medicaid HCBS, (Baltimore, MD: Centers for Medicare & Medicaid Services, January 16, 2014), https://www.medicaid.gov/medicaid-chip-program-information/by-topics/long-term-services-and-supports/home-and-community-based-services/downloads/final-rule-slides-01292014.pdf. ↩︎
- “Statewide Transition Plans,” Medicaid.gov, CMS, accessed October 4, 2016, https://www.medicaid.gov/medicaid-chip-program-information/by-topics/long-term-services-and-supports/home-and-community-based-services/statewide-transition-plans.html. ↩︎
- Although Rhode Island and Delaware did not report participants or expenditures for personal care state plan services in 2015, their policy survey responses are included. ↩︎
- Reimbursement rates for services provided under § 1915 (c) waivers are not included in the policy survey. ↩︎