Public Opinion on Chronic Illness in America
Findings
Key Findings
- Six in ten say they or someone in their immediate family have a chronic health condition that requires ongoing medical treatment. Compared to those without chronic conditions, these individuals are more likely to report having a hard time paying medical bills. One-third (35 percent) of those dealing with a chronic condition requiring ongoing medical care say they or their household have had problems paying medical bills in the past 12 months, compared to one-fourth (27 percent) of the overall public.
- The majority of the public are aware that heart disease, diabetes, asthma, mental health illness, cancer, and arthritis are all illnesses that are considered “chronic diseases,” but less than three in ten are aware of the prevalence of chronic diseases in this country nor how much of health spending is spent treating chronic diseases.
- Seven in ten Americans say chronic diseases are usually due to factors and circumstances beyond a person’s control, while fewer say people who have chronic diseases mostly have themselves to blame for their condition. Despite this, half of the public (including half of those dealing with a chronic illness) say individuals themselves should play the largest role in helping to prevent individuals in this country from getting chronic diseases. This is larger than the share who say the same about health care providers, the government, or employers and businesses.
- When asked whether they favor or oppose various policy proposals aimed at preventing or managing chronic diseases, a majority of the public say they favor proposals aimed at promoting healthy behaviors but fewer say they favor other proposals that either ban or tax unhealthy choices. There are some partisan differences with larger shares of Democrats and independents favoring all of the policy proposals compared to Republicans.
Public Awareness of Chronic Illness
According to the U.S. National Center for Health Statistics, chronic diseases are illnesses that last three or more months and cannot be prevented by vaccination, cured by medication, and do not disappear.1 Overall, the majority of the public are aware of the specific diseases that are categorized as “chronic,” but fewer are aware of the number of people affected by chronic diseases in the U.S. or the amount of resources spent treating these diseases.
The majority of the public are aware that heart disease (81 percent), diabetes (78 percent), asthma (75 percent), mental health illness (73 percent), cancer (72 percent), and arthritis (72 percent) are all illnesses that are considered “chronic diseases.”

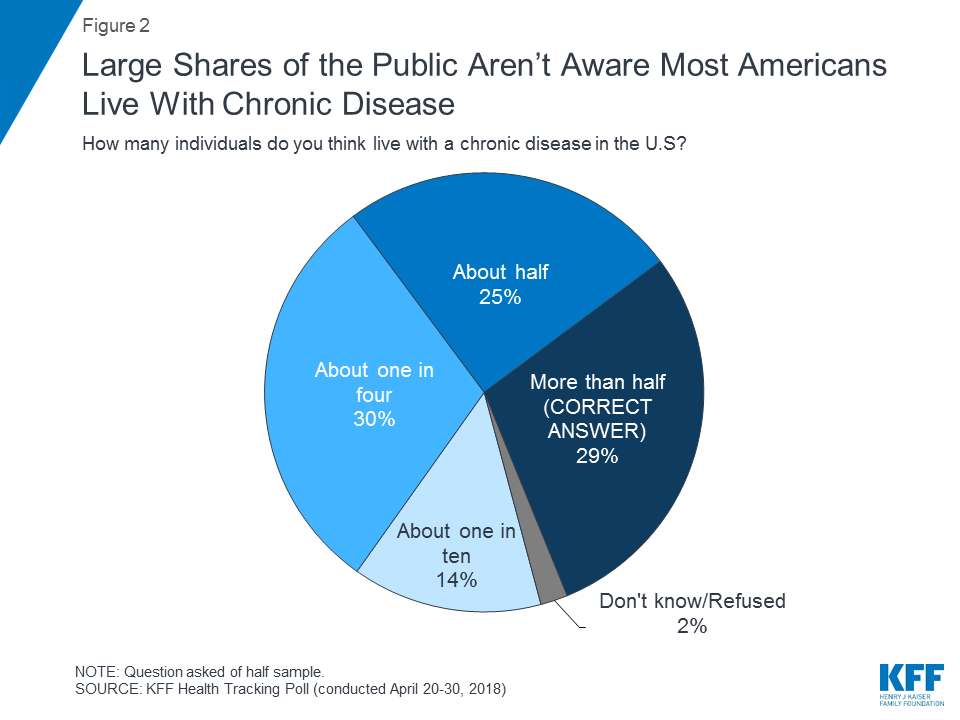
According to the U.S. Department of Health & Human Services’ Medical Expenditure Panel Survey, about two-thirds of adults living in the U.S. have at least one chronic condition.2 The April 2018 Kaiser Health Tracking Poll found that about three in ten of the public (29 percent) are aware of the prevalence of chronic disease in this country, while seven in ten thought that either about half (25 percent), about one in four (30 percent), or about one in ten (14 percent) of the individuals living in the U.S. have a chronic disease.
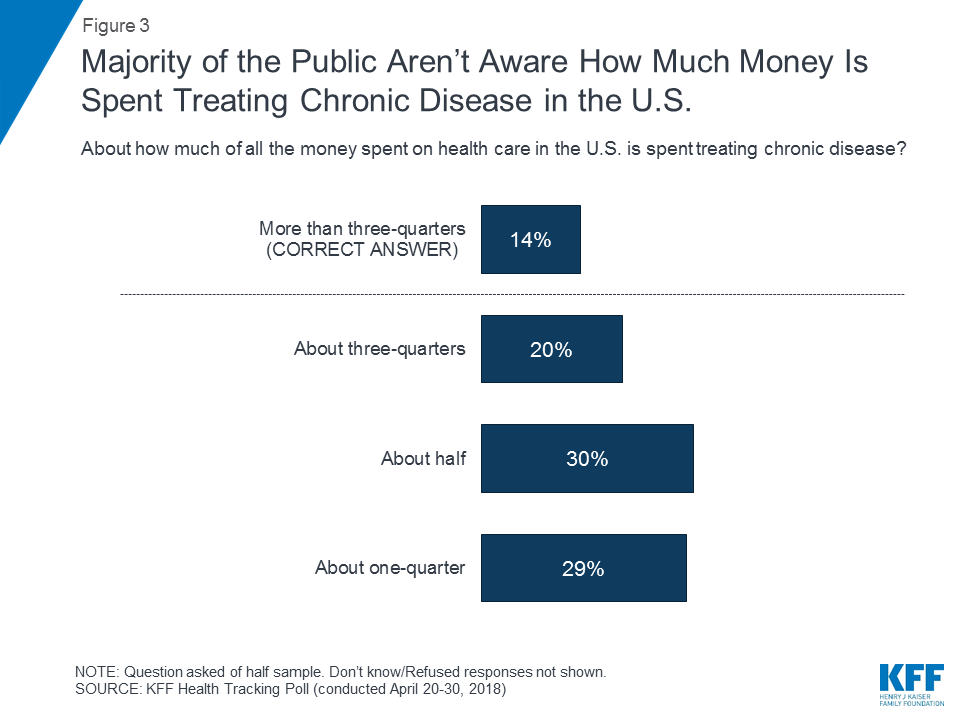
In addition, a majority of the public are unaware that more than three quarters of all of the money spent on health care in the U.S. is spent treating chronic diseases.
Who Is Responsible for Preventing Chronic Illnesses?
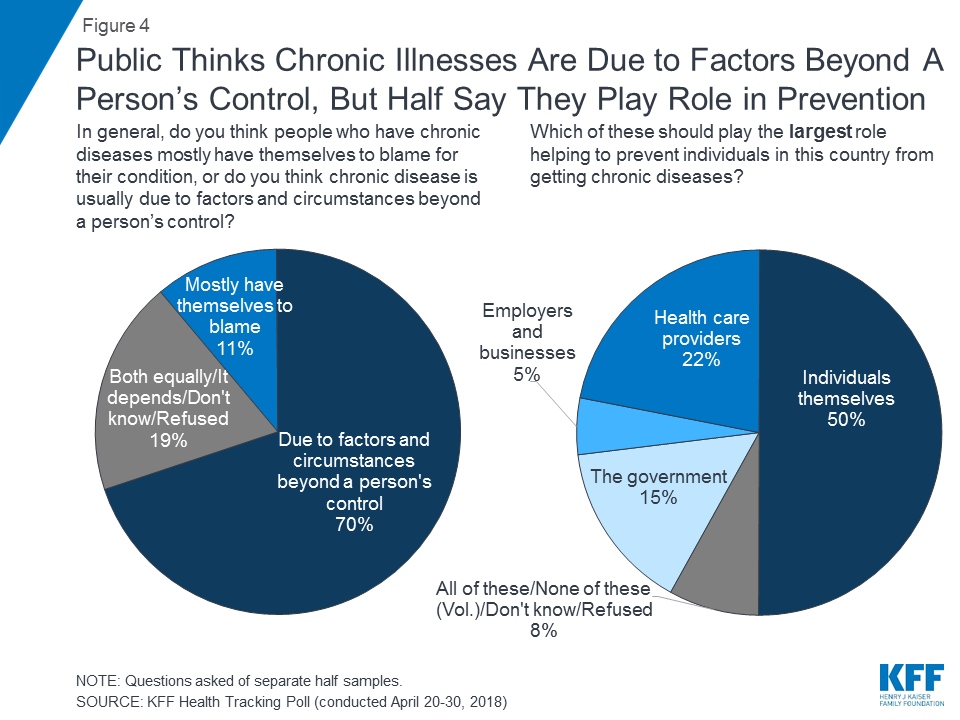
Seven in ten Americans say chronic diseases are usually due to factors and circumstances beyond a person’s control while one in ten (11 percent) say people who have chronic diseases mostly have themselves to blame for their condition. An additional two in ten (19 percent) say either that it is both of these, neither of these, or are unsure.
Despite this, half of the public (including half, 49 percent, of those dealing with a chronic illness) say individuals themselves should play the largest role in helping to prevent individuals in this country from getting chronic diseases. This is larger than the share who say the same about health care providers (22 percent), the government (15 percent), or employers and businesses (5 percent).
Experiences of Those Living With Chronic Illnesses
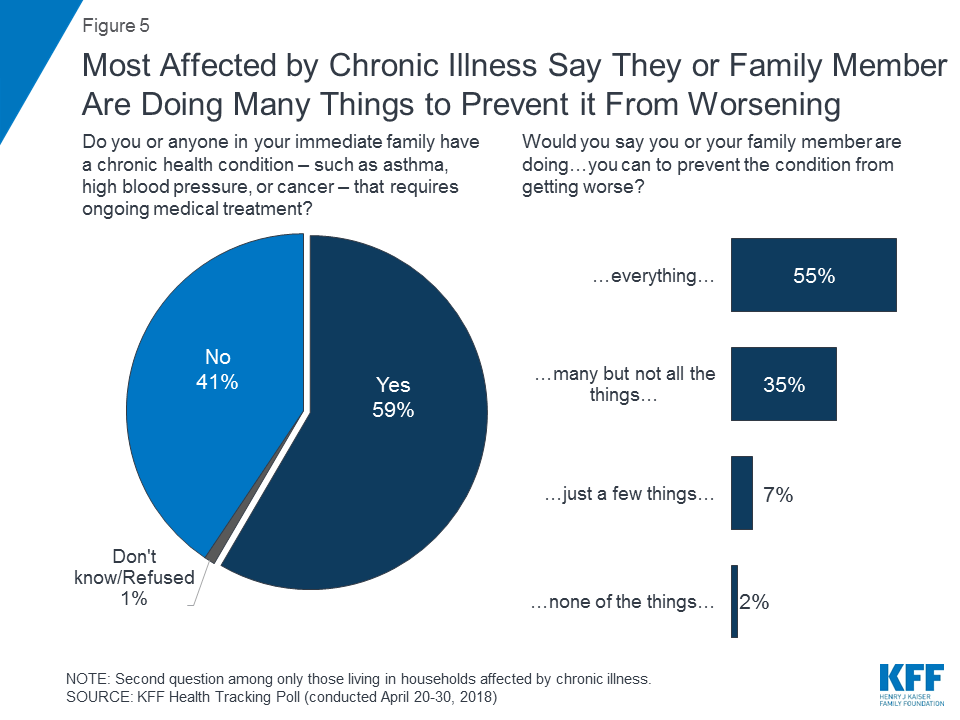
Six in ten (59 percent) say they or someone in their immediate family have a chronic health condition that requires ongoing medical treatment. Compared to those without chronic conditions, these individuals are more likely to report having a hard time paying medical bills. One-third (35 percent) of those dealing with a chronic condition requiring ongoing medical care say they or their household have had problems paying medical bills in the past 12 months, compared to one-fourth (27 percent) of the overall public. To see a complete demographic profile of this group, see the Appendix.
Among those dealing with a chronic health condition (either themselves or an immediate family member) the majority (55 percent) say they are or their family member are doing “everything” they can to prevent the condition from getting worse while an additional one-third (35 percent) say they are doing “many but not all the things” they could do to prevent the condition from getting worse. Fewer (9 percent of those dealing with a chronic health condition) say they are doing “just a few things” or “none of the things” to prevent the condition from getting worse.
Public Support for Policies Aimed at Preventing or Managing Chronic Diseases
When asked whether they favor or oppose various policy proposals aimed at preventing or managing chronic diseases, a majority of the public say they favor proposals aimed at promoting healthy behaviors but fewer than half say they favor other proposals that either ban or tax unhealthy choices. Eight in ten favor proposals such as requiring schools to educate children and promote healthy choices through physical activity and restricting unhealthy choices (81 percent) which is similar to the shares who favor increasing government funding to pay for early childhood health programs, housing programs, and employment assistance for lower-income individuals (76 percent), requiring restaurants and companies to promote healthy choices through menu labeling and posting calorie information (74 percent), and increasing government funding to pay for either healthy alternatives such as farmers’ markets (73 percent) or technology to help lower-income individuals better manage their chronic condition (72 percent).
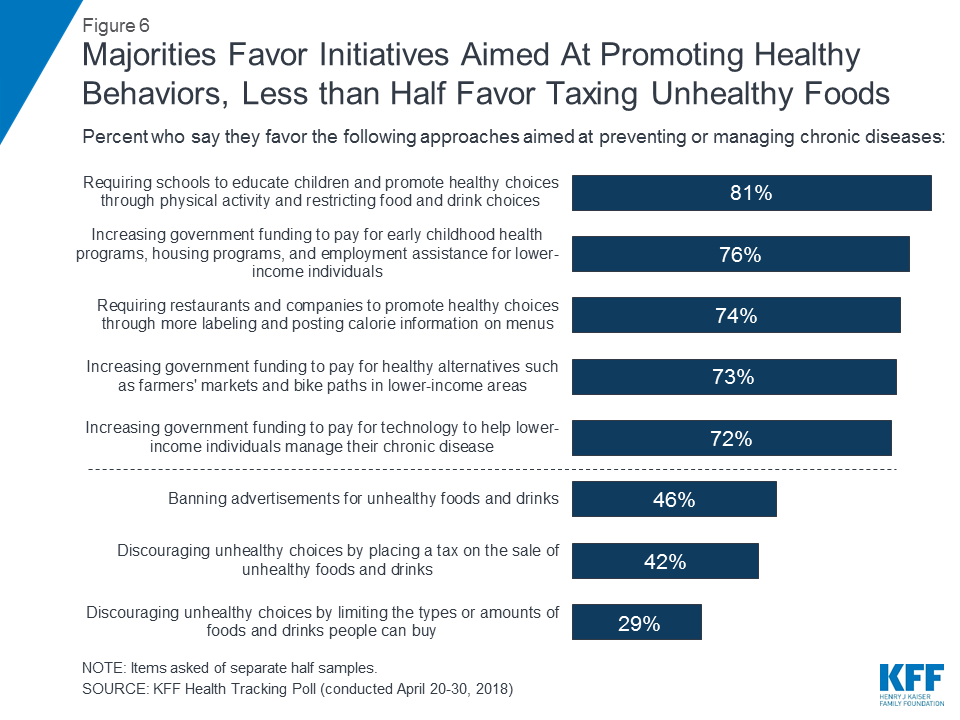
Fewer favor policy proposals banning advertisements for unhealthy foods and drinks (46 percent), or discouraging unhealthy choices by either placing a tax on the sale of unhealthy foods and drinks (42 percent) or limiting the types or amounts of these choices people can buy (29 percent).
Smaller Shares of Republicans, But Still Majorities Favor Policy Proposals Aimed At Promoting Healthy Choices
There are some partisan differences with larger shares of Democrats and independents favoring all of the policy proposals compared to Republicans. Yet, majorities of Republicans still favor proposals aimed at promoting healthy behaviors.
| Table 1: Support for Policy Proposals by Party Identification | |||
| Democrats | Independents | Republicans | |
| Requiring schools to educate children and promote healthy choices through more physical activity and restricting food/drink choices. | 87% | 82% | 70% |
| Increasing government funding to pay for early childhood programs, housing programs, and employment assistance for low-income people. | 89 | 78 | 56 |
| Requiring restaurants/companies to promote healthy choices through more labeling and posting calorie info on menus. | 82 | 76 | 63 |
| Increasing government funding to pay for healthy alternatives like farmers’ markets and bike paths in low-income areas. | 84 | 75 | 55 |
| Increasing government funding to pay for technology to help lower-income people manage their chronic disease. | 88 | 73 | 55 |
| Banning advertisements for unhealthy foods and drinks. | 50 | 47 | 39 |
| Discouraging unhealthy choices by placing a tax on the sale of unhealthy foods and drinks. | 46 | 44 | 33 |
| Discouraging unhealthy choices by limiting the types and amounts of foods and drinks people can buy. | 38 | 29 | 17 |
Methodology
This Kaiser Health Tracking Poll was designed and analyzed by public opinion researchers at the Kaiser Family Foundation (KFF). The survey was conducted April 20th–30th 2018, among a nationally representative random digit dial telephone sample of 2,000 adults ages 18 and older, living in the United States, including Alaska and Hawaii (note: persons without a telephone could not be included in the random selection process). Computer-assisted telephone interviews conducted by landline (699) and cell phone (1,301, including 864 who had no landline telephone) were carried out in English and Spanish by SSRS of Glen Mills, PA. To efficiently obtain a sample of lower-income and non-White respondents, the sample also included an oversample of prepaid (pay-as-you-go) telephone numbers (25% of the cell phone sample consisted of prepaid numbers) as well as a subsample of respondents who had previously completed Spanish language interviews on the SSRS Omnibus poll (n=14). Both the random digit dial landline and cell phone samples were provided by Marketing Systems Group (MSG). For the landline sample, respondents were selected by asking for the youngest adult male or female currently at home based on a random rotation. If no one of that gender was available, interviewers asked to speak with the youngest adult of the opposite gender. For the cell phone sample, interviews were conducted with the adult who answered the phone. KFF paid for all costs associated with the survey.
The combined landline and cell phone sample was weighted to balance the sample demographics to match estimates for the national population using data from the Census Bureau’s 2016 American Community Survey (ACS) on sex, age, education, race, Hispanic origin, and region along with data from the 2010 Census on population density. The sample was also weighted to match current patterns of telephone use using data from the January-June 2017 National Health Interview Survey. The weight takes into account the fact that respondents with both a landline and cell phone have a higher probability of selection in the combined sample and also adjusts for the household size for the landline sample, and design modifications, namely, the oversampling of prepaid cell phones. All statistical tests of significance account for the effect of weighting.
The margin of sampling error including the design effect for the full sample is plus or minus 3 percentage points. Numbers of respondents and margins of sampling error for key subgroups are shown in the table below. For results based on other subgroups, the margin of sampling error may be higher. Sample sizes and margins of sampling error for other subgroups are available by request. Note that sampling error is only one of many potential sources of error in this or any other public opinion poll. Kaiser Family Foundation public opinion and survey research is a charter member of the Transparency Initiative of the American Association for Public Opinion Research.
| Group | N (unweighted) | M.O.S.E. |
| Total | 2,000 | ±3 percentage points |
| Registered voters | 1,655 | ±3 percentage points |
| Democrats | 528 | ±5 percentage points |
| Republicans | 486 | ±5 percentage points |
| Independents | 506 | ±5 percentage points |
| Voters in competitive elections | 500 | ±5 percentage points |
| Health Care voters | 353 | ±6 percentage points |
Endnotes
- Centers for Disease Control, Summary Health Statistics for the U.S. Population: National Health Interview Survey, 2012. https://www.cdc.gov/nchs/data/series/sr_10/sr10_259.pdf ↩︎
- Medical Expenditures Panel Survey is available at https://meps.ahrq.gov/mepsweb/ ↩︎