Kaiser Health Tracking Poll: July 2016
Findings
KEY FINDINGS:
- In a campaign that so far has not been about policy issues, equal shares of voters name terrorism and national security, along with a candidate’s personal characteristics like leadership ability, character, values, and experience, as top voting considerations for the 2016 presidential election, with health care ranking further down the list with a cluster of other issues.
- While overall attitudes of the ACA lean unfavorable, a larger share of voters say they trust the Democratic Party than say they trust the Republican Party to do a better job dealing with health care issues including determining the future of the ACA, Medicare, lowering prescription drug costs, and dealing with the opioid epidemic, with the widest issue advantage for either political party being women’s reproductive health.
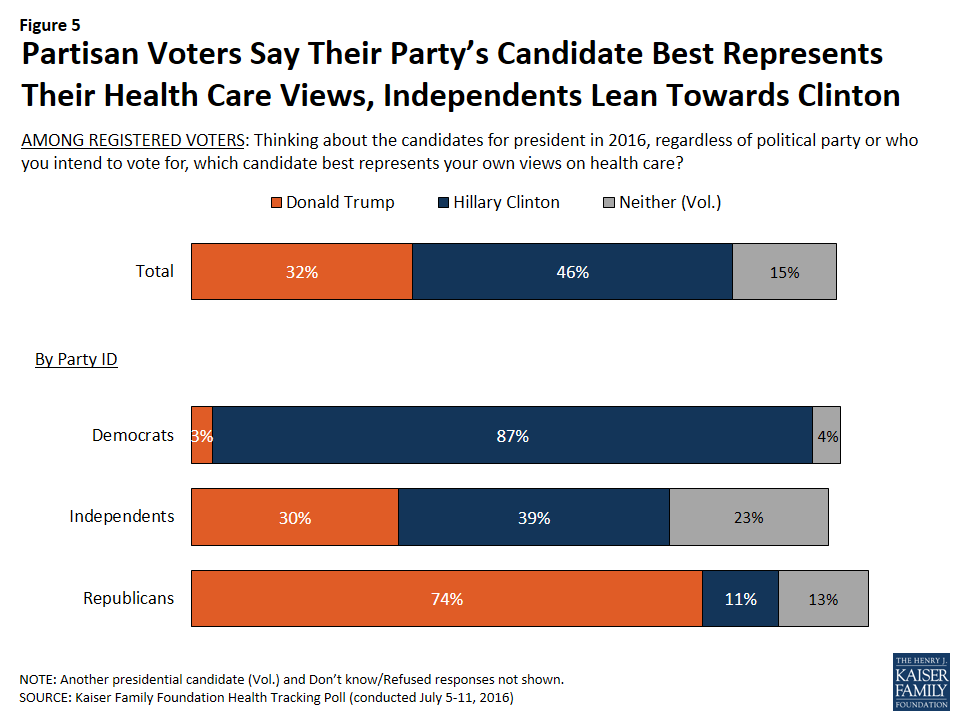
- Overall, the survey finds more voters say the Democratic Party (47 percent) than the Republican Party (35 percent) best represents their health care views. When asked which of the major party’s presumptive presidential nominees best represents their health care views, more voters choose Hillary Clinton (46 percent) than Donald Trump (32 percent).
Election Watch: The Role of Health Care Issues in the 2016 Presidential Election
The presidential campaign is in full swing with candidates and political parties negotiating party platforms, frequent murmurings about possible vice presidential candidates, and party conventions starting in days. As part of Kaiser’s ongoing analysis of the role of health care issues in the political debate, the July Kaiser Health Tracking Poll examines the role that health care may play in the 2016 presidential election, how important health care is to voters, what health care issues voters would most like to hear the candidates discuss, and which party and candidates voters feel most closely aligned with on health care issues.
Terrorism is Top Issue For Voters, Large Shares Also Say Candidate’s Personal Characteristics Are Important
Terrorism and national security is the top issue for registered voters in the 2016 presidential election, according to the most recent tracking survey.1 Nearly half (46 percent) of all voters say terrorism and national security is “extremely” important to their vote for president. About four in ten voters (37 percent) say health care is “extremely” important, which is similar to the share of voters who say the same about gun policy (38 percent), education (35 percent), and the economy and jobs (37 percent). Smaller shares of voters in the presidential election say foreign policy, the federal budget deficit, immigration, and taxes are “extremely” important to their vote.
While a large share of voters say specific issues will be important to their vote for president, previous research demonstrates that voters also make their decision to support candidates based on other factors including their perceptions of the personal characteristics of the candidate – including their leadership ability, character, values, and experience. Slightly less than half (46 percent) of voters say a candidate’s personal characteristic are “extremely” important to their vote for president, which is the same as the share who say terrorism and national security is important. Unlike policy issues cited by voters, the share naming personal characteristics as important to their vote does not vary by party affiliation.
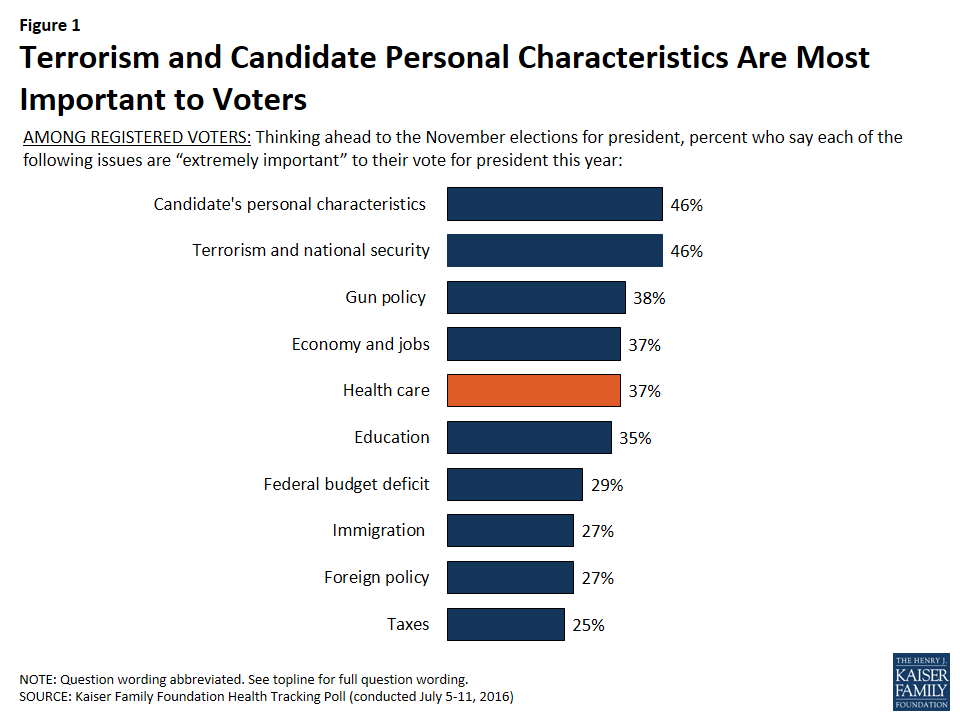
Across the factors that are important to voters, there are noticeable party differences. Nearly two-thirds (63 percent) of voters who identify as Republicans say terrorism and national security is “extremely” important to their vote compared to 40 percent of voters who identify as Democrats and 43 percent of independents. The top issues for Democratic voters are education (46 percent) and health care (42 percent). Among independent voters, terrorism and national security is the top issue (43 percent) but a larger share of independents say a candidate’s personal characteristics is important (46 percent) than who say the same about any other substantive policy issues.
| Table 1: Top Issues for American Voters in 2016 Presidential Election | ||||
| The percent who said the following are“extremely” important to their votefor president this year | All Registered Voters | Republican Voters | Democratic Voters | Independent Voters |
| Candidate Personal Characteristics | 46% | 45% | 47% | 46% |
| Terrorism and National Security | 46 | 63 | 40 | 43 |
| Gun Policy | 38 | 40 | 40 | 35 |
| Economy and Jobs | 37 | 48 | 35 | 34 |
| Health Care, including costs and the ACA | 37 | 38 | 42 | 34 |
| Education | 35 | 25 | 46 | 35 |
| The Federal Budget Deficit | 29 | 42 | 17 | 29 |
| Foreign Policy | 27 | 29 | 25 | 29 |
| Immigration | 27 | 40 | 24 | 24 |
| Taxes | 25 | 34 | 20 | 24 |
| NOTE: Question wording abbreviated. For full question wording, see topline. | ||||
Partisanship and Health Care
The July Tracking Survey also examines how voters view each political party and their prospective presidential candidates on health care issues.
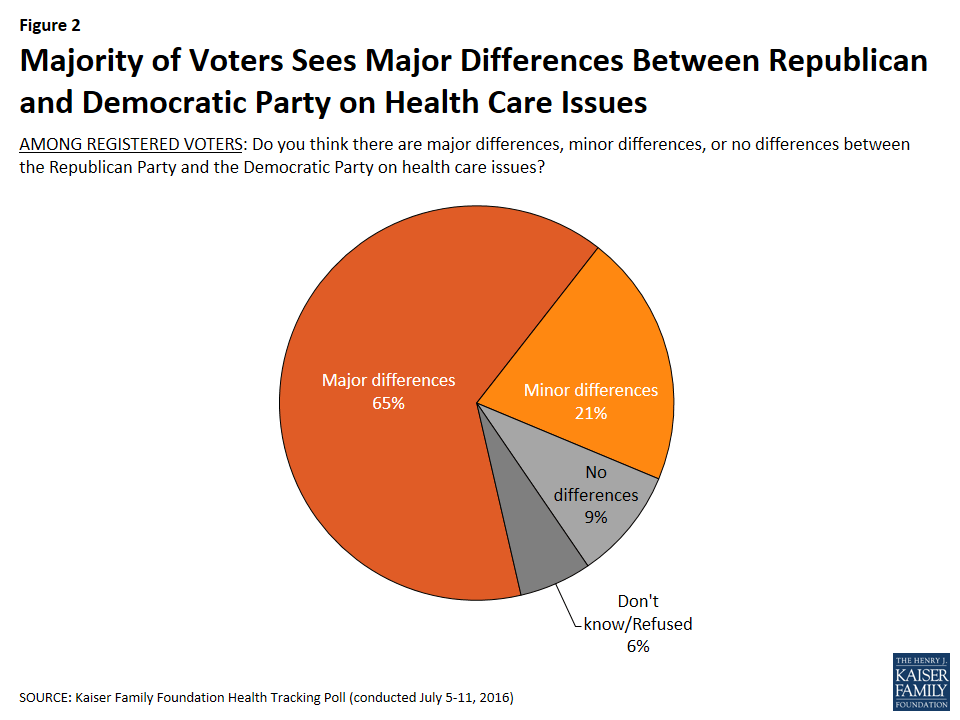
Overall Party Differences on Health Care Issues
When it comes to perceptions of whether the two political parties differ on health care issues, 65 percent of voters say there are major differences between the parties with an additional 21 percent saying there are minor differences. Overall, majorities across political parties say there are major differences between the Republican Party and the Democratic Party on health care issues.
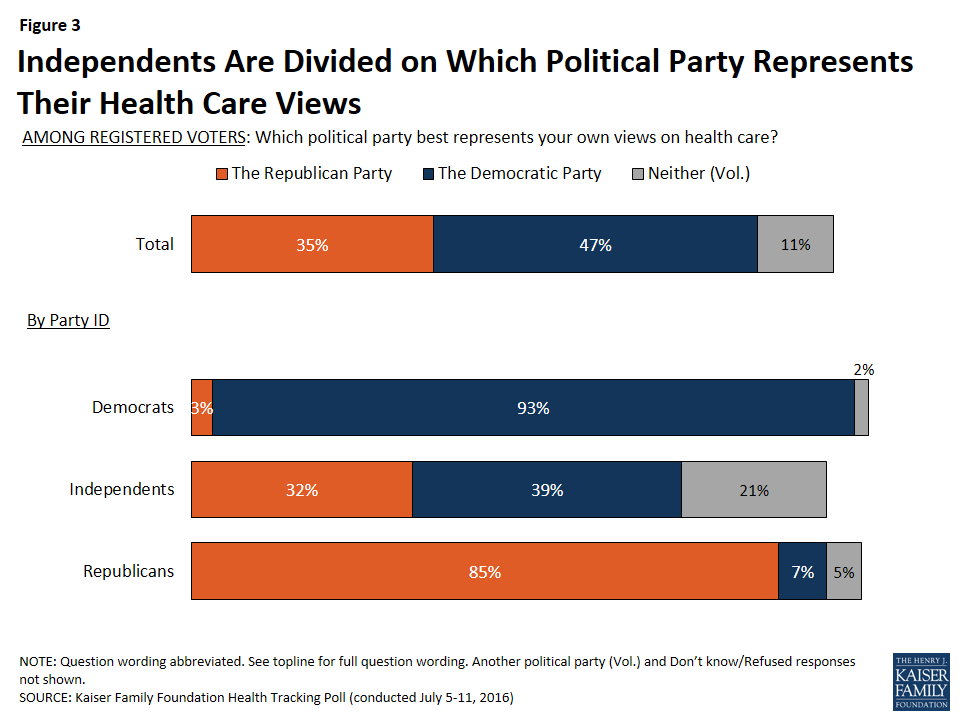
Voters Trust Their Own Political Party on Health Care Issues
In general, 85 percent of Republican voters and 93 percent of Democratic voters say their own political party best represents their views on health care. Independents are much more closely divided with four in ten (39 percent) saying the Democratic Party best represents their health care views and one-third (32 percent) saying the Republican Party represents their views. In addition, one in five independents (21 percent) say that neither political party represents their own views on health care.
When asked which political party (the Republican Party or the Democratic Party) they trust to do a better job dealing with a series of health care issues, a larger share of voters say they trust the Democratic Party to do a better job than the Republican Party.
The widest issue advantage for either political party was women’s reproductive health, with voters saying at a margin of 2 to 1 that they trust the Democratic Party to do a better job of making decisions about women’s reproductive health choices and services than the Republican Party (58 percent compared to 30 percent). The Democratic Party also holds a significant advantage over the Republican Party when it comes to lowering the cost of prescription drugs (50 percent and 32 percent). Larger shares also say they trust the Democratic Party rather than the Republican Party on Zika funding (45 percent vs. 31 percent) and the opioid epidemic in the U.S. (41 percent vs. 34 percent).
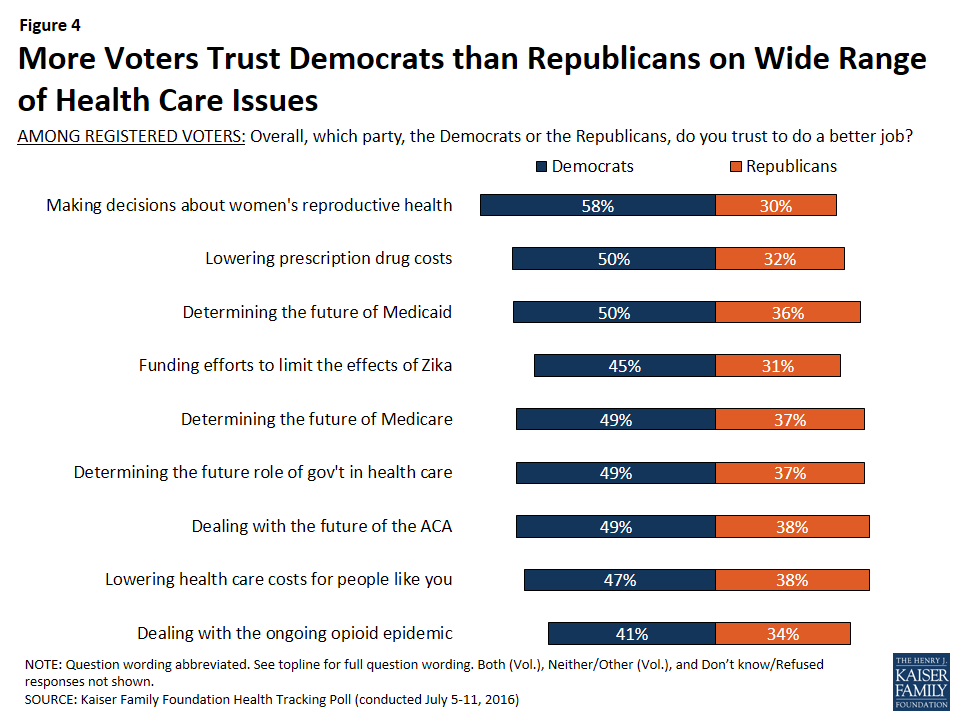
Higher shares of female voters and younger voters say they trust the Democratic Party than say they trust the Republican Party on all of these health issues, with the largest differences found on women’s health issues and lowering prescription drug costs. On these two issues, more than half of female voters and voters between the ages of 18 and 29 say they trust the Democratic Party compared to less than one-third of each group who say they trust the Republican Party. Among voters 65 and older, similar shares say they trust both parties on most health issues. For example, when it comes to determining the future of the Medicare program, similar shares of senior voters say they trust the Democratic Party (45 percent) and the Republican Party (41 percent).
Across all issues, vast majorities of both Republican voters and Democratic voters say they trust their own political party to do a better job handling each health care issue and very few say they trust the opposing party. For example, nine out of ten Democratic voters (91 percent) say they trust the Democratic Party to do a better job determining the future role of government in health care, while a similar share of Republican voters (87 percent) say they trust the Republican Party to do a better job.
With both Republican voters and Democratic voters saying they trust their own political party to do a better job handling each of the health care issues, independent voters’ views play an important role. Overall, larger shares of independent voters trust the Democratic Party than the Republican Party to do a better job of making decisions about women’s reproductive health (60 percent compared to 25 percent), lowering prescription drug costs (46 percent vs. 28 percent), and funding efforts to limit the effects of the Zika virus outbreak (42 percent vs. 24 percent). Independents are more split on whether they trust the Democratic Party or the Republican Party on the other issues, with similar shares saying they trust the Democratic Party and the Republican Party on dealing with the future of the 2010 health care law, lowering health care costs for people like them, and dealing with the opioid epidemic.
| Table 2: Independent Voters Are More Likely to Trust Democratic Party on Some Health Care Issues | ||
| The percent who trust to do a better job… | Independent Voters Who Trust Republican Party | Independent Voters Who Trust Democratic Party |
| Making decisions about women’s reproductive health choices and services | 25% | 60% |
| Lowering the cost of prescription drugs | 28 | 46 |
| Funding efforts to limit the effects of the Zika virus | 24 | 42 |
| Determining the future of the Medicaid program | 34 | 46 |
| Determining the future of the Medicare program | 35 | 44 |
| Determining the future role of government in health care | 36 | 44 |
| Dealing with the future of the 2010 health care law | 38 | 44 |
| Lowering health care costs for people like you | 36 | 42 |
| Dealing with the ongoing opioid addiction epidemic | 31 | 36 |
| NOTE: Question wording abbreviated. For full question wording, see topline. | ||
Views of the 2016 Presidential Candidates On Health Care
Majorities of Voters Say Their Party’s Candidate Represents Their Views on Health Care
When asked which presidential candidate best represents their own views on health care, nearly half of voters (46 percent) choose Hillary Clinton while about one-third (32 percent) say Donald Trump best represents their views. As expected, a vast majority of Democratic voters (87 percent) say Hillary Clinton best represents their own views on health care, while only 3 percent say Donald Trump. On the other side of the political spectrum, three-fourths of Republican voters (74 percent) say Donald Trump best represents their own views on health care, while one in ten (11 percent) say Hillary Clinton and 13 percent say neither candidate represents their views. More independent voters say Hillary Clinton best presents their health care views than Donald Trump — 39 percent compared to 30 percent – yet one in four (23 percent) say neither candidate represents theirs health care views.
Large Shares of Voters Say Candidates and Political Parties Are Paying too Little Attention to Health Care Issues
With less than one week before the start of the 2016 presidential conventions,2 the majority of American voters say they are interested in what happens during the Republican National Convention (71 percent) and the Democratic National Convention (65 percent), and more than half of individuals from both parties say they care “a lot” about what is included in their party’s platform.
And while the political parties and their presumptive candidates, Donald Trump and Hillary Clinton, are working on defining their party’s 2016 platforms, slightly more than half of voters say the Republican Party and Donald Trump are paying too little attention to health issues. More than half of voters (56 percent) say Donald Trump is paying too little attention and 55 percent say the Republican Party is paying too little attention to health care issues. In contrast, about one-third of voters say Hillary Clinton (35 percent) and the Democratic Party (33 percent) is paying too little attention to health care issues, while about four in ten say the Democratic Party and Hillary Clinton are paying the right amount of attention.
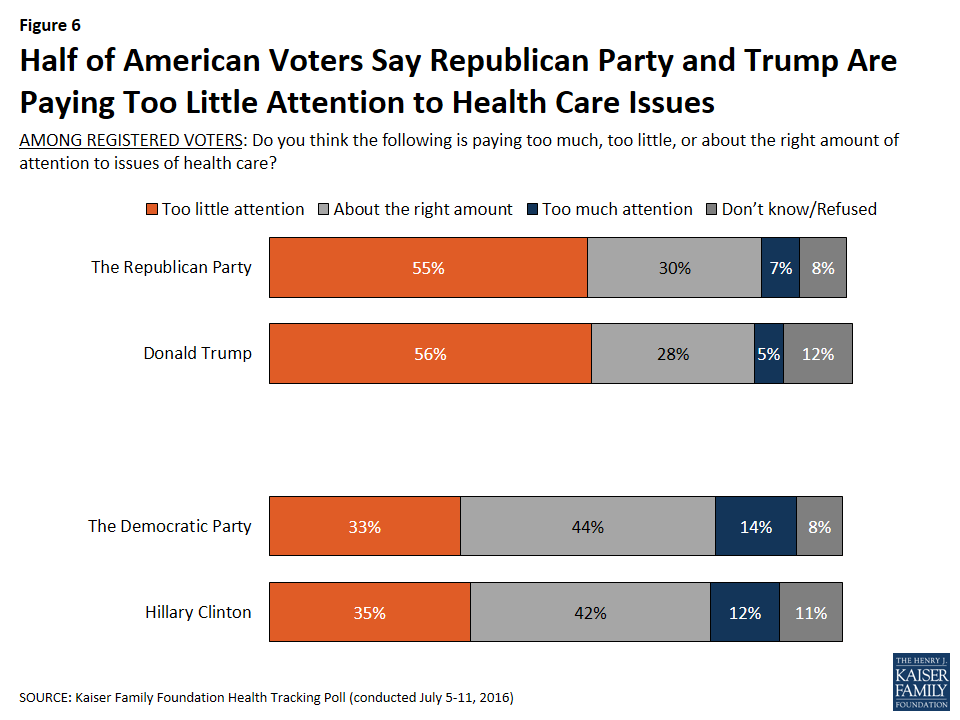
There are distinct partisan differences in these findings: larger shares of Republican voters say the Democratic Party and Hillary Clinton are paying too little attention, 43 percent and 44 percent, while large majorities of Democratic voters say the Republican Party and Donald Trump are paying too little attention, 71 percent and 75 percent. About half of independent voters say Donald Trump and the Republican Party are paying too little attention to health care issues, 54 percent each, compared to about four in ten who say the same about Hillary Clinton (40 percent) and the Democratic Party (37 percent).
| Table 3: Larger Shares of Voters Say Republican Party and Donald Trump Are Paying Too Little Attention to Health Care Issues | ||||
| Percent who say each of the following is paying too little attention to issues of health care | Total Voters | Republican Voters | Democratic Voters | Independent Voters |
| Republican Party | 55% | 36% | 71% | 54% |
| Donald Trump | 56 | 33 | 75 | 54 |
| Democratic Party | 33 | 43 | 22 | 37 |
| Hillary Clinton | 35 | 44 | 21 | 40 |
Republicans Want to Hear Candidates Discuss ACA, Democrats Want to Hear About Health Care Costs
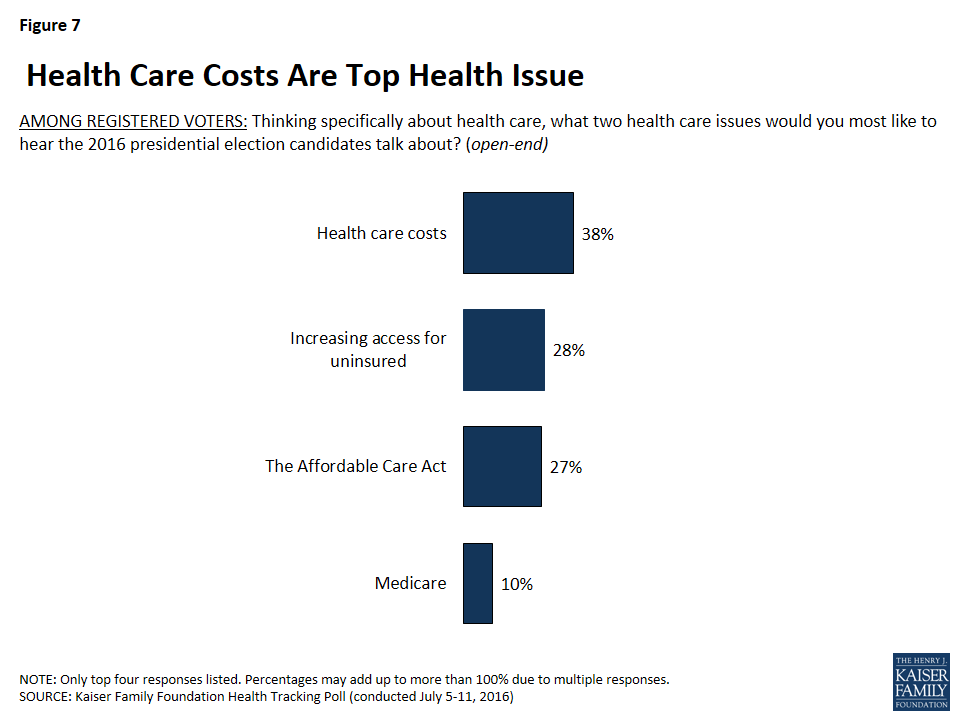
When asked specifically what health issues they want to hear the presidential candidates talk about, health care costs are mentioned more often than any other health issue (38 percent), followed by increasing access for uninsured (28 percent), the ACA (27 percent), and Medicare (10 percent).
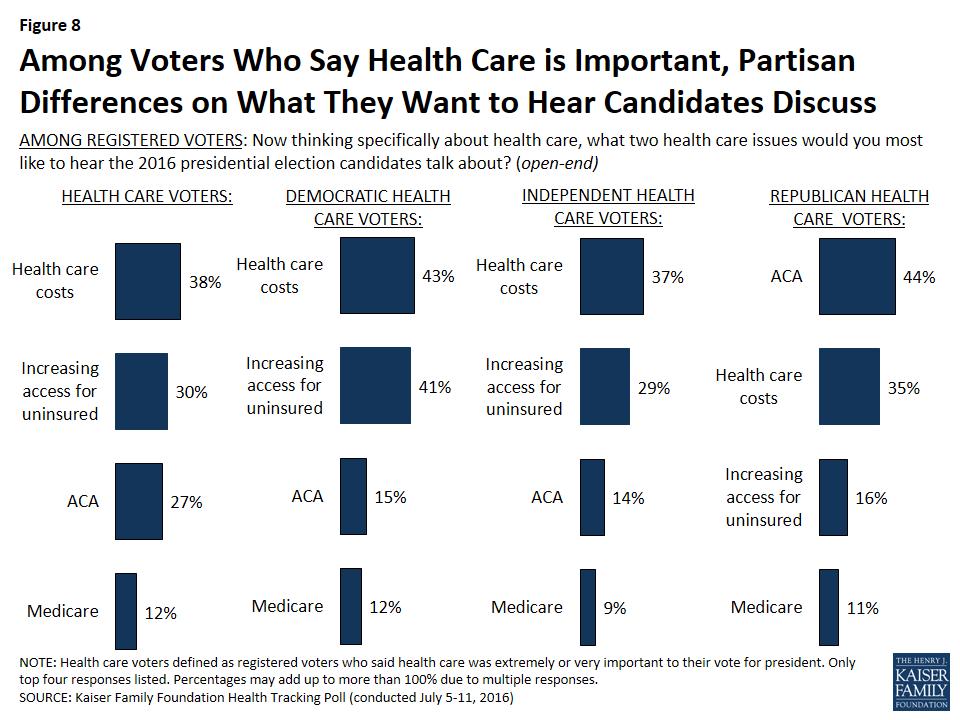
Four in ten Republican voters (41 percent) say they want to hear the 2016 presidential candidates talk about the ACA (of which 26 percent say they want to hear the candidates talk about repealing or opposing the law), compared to one-fourth of independent voters (26 percent) who want to hear the candidates discuss the ACA and only 15 percent of Democratic voters. By comparison, four in ten Democratic voters say they want the candidates to talk about health care costs (41 percent) and expanding health insurance coverage for the currently uninsured (40 percent). A larger share of independent voters (39 percent) say they want candidates to discuss health care costs than say they want the candidates to talk about expanding access to the uninsured (27 percent) or the ACA (26 percent).
While health care is currently not the top issue for voters, majorities of Republicans, Democrats, and independents say it is “extremely” or “very” important to their presidential vote choice (71 percent, 86 percent, and 75 percent, respectively). Among the individuals, regardless of party, who say health care is important to their vote for president this year, 38 percent say health care costs is the health issue they most want to hear the presidential candidates discuss, followed by increasing access to the uninsured (30 percent) and the ACA (27 percent). Similar to the partisan differences found among all voters, a higher share of Democratic voters who say health care is “extremely” or “very” important say they want to hear the candidates discuss health care costs more than any other issue; Republican health care voters want to hear the candidates discuss the ACA.
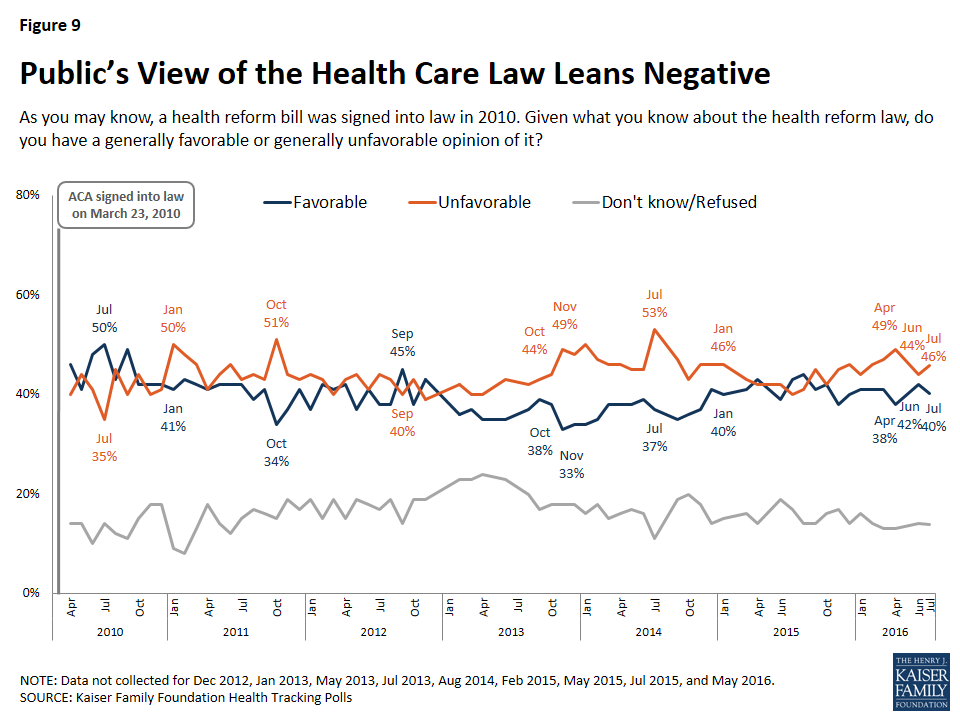
Americans’ Opinions of the Affordable Care Act
While the ACA remains a top health care issue for Republican voters, overall attitudes toward the law remained largely unchanged over the past month. The most recent survey finds 40 percent of Americans reporting favorable opinions of the health care law and 46 percent reporting unfavorable opinions.
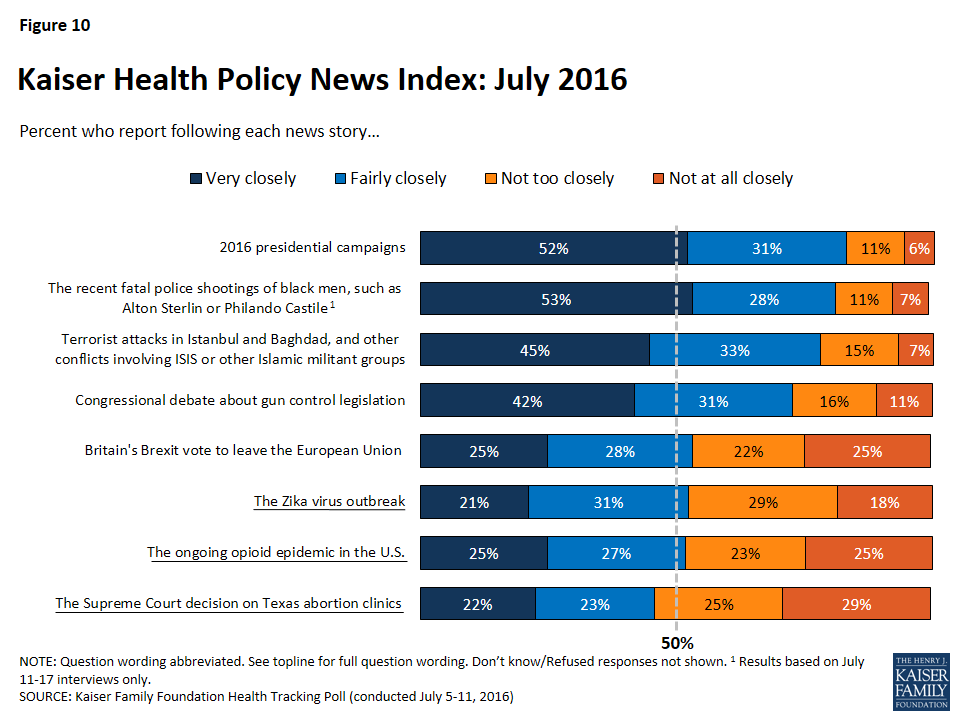
Kaiser Health Policy News Index: July 2016
This month’s Health Policy News Index finds a large majority (83 percent) of the American public reports closely following news about the 2016 presidential campaigns, up slightly from 79 percent in June. This is similar to the share who say they have closely followed news this month about recent fatal police shootings of black men like Alton Sterling and Philando Castile3 (81 percent) and the share who report closely following news about terrorist attacks in Istanbul and Baghdad and other conflicts involving ISIS or other militant groups (78 percent). Congressional debate about gun control legislation also garnered significant attention in July, with nearly three-fourths of Americans (72 percent) saying they have followed news about it closely, while Britain’s vote to leave the European Union – Brexit – was closely followed by a smaller share (53 percent). Fewer Americans report following this month’s top health stories, with about half closely following the Zika virus outbreak and news about the ongoing opioid epidemic in the nation (52 percent each) and 46 percent closely following the Supreme Court decision regarding Texas abortion clinics.
The Zika Virus Outbreak
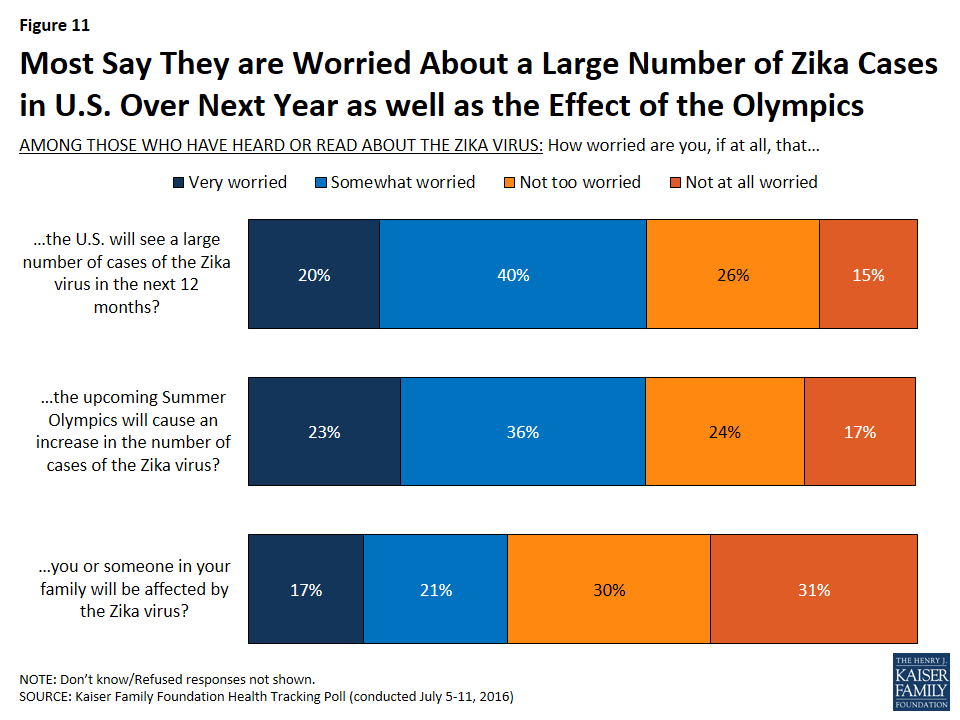
The Kaiser Tracking Poll has been tracking the public’s awareness of the Zika virus since February 2016. The most recent survey finds that the vast majority of Americans (89 percent) have heard or read at least a little about the Zika virus, up slightly from June 2016.4 While the majority of those who have heard or read about the virus are not worried that they or someone in their family will be affected by the virus, six in ten are worried the U.S. will see a large number of cases of the virus (59 percent) and the upcoming summer Olympics will cause an increase in the number of cases (59 percent).
The Ongoing Opioid Epidemic
On July 8th, the U.S. House of Representatives passed the Comprehensive Addiction and Recovery Act (CARA). This bill, which is also supported by the Senate and President Obama, is part of the government’s effort to combat the ongoing opioid epidemic in the U.S. Similar to results from the April,5 the June Tracking Poll finds that slightly more than four in ten Americans (43 percent) say they know someone who has been addicted to prescription painkillers, including one in five (19 percent) who say they have a family member who has been addicted.

Methodology
This Kaiser Health Tracking Poll was designed and analyzed by public opinion researchers at the Kaiser Family Foundation (KFF). The survey was conducted July 5-11, 2016, among a nationally representative random digit dial telephone sample of 1,212 adults ages 18 and older, living in the United States, including Alaska and Hawaii (note: persons without a telephone could not be included in the random selection process). Computer-assisted telephone interviews conducted by landline (426) and cell phone (786, including 477 who had no landline telephone) were carried out in English and Spanish by Princeton Data Source under the direction of Princeton Survey Research Associates International (PSRAI). Both the random digit dial landline and cell phone samples were provided by Survey Sampling International, LLC. For the landline sample, respondents were selected by asking for the youngest adult male or female currently at home based on a random rotation. If no one of that gender was available, interviewers asked to speak with the youngest adult of the opposite gender. For the cell phone sample, interviews were conducted with the adult who answered the phone. KFF paid for all costs associated with the survey.
The combined landline and cell phone sample was weighted to balance the sample demographics to match estimates for the national population using data from the Census Bureau’s 2014 American Community Survey (ACS) on sex, age, education, race, Hispanic origin, and region along with data from the 2010 Census on population density. The sample was also weighted to match current patterns of telephone use using data from the January-June 2015 National Health Interview Survey. The weight takes into account the fact that respondents with both a landline and cell phone have a higher probability of selection in the combined sample and also adjusts for the household size for the landline sample. All statistical tests of significance account for the effect of weighting.
The margin of sampling error including the design effect for the full sample is plus or minus 3 percentage points. Numbers of respondents and margins of sampling error for key subgroups are shown in the table below. For results based on other subgroups, the margin of sampling error may be higher. Sample sizes and margins of sampling error for other subgroups are available by request. Note that sampling error is only one of many potential sources of error in this or any other public opinion poll. Kaiser Family Foundation public opinion and survey research is a charter member of the Transparency Initiative of the American Association for Public Opinion Research.
| Group | N (unweighted) | M.O.S.E. |
| Total | 1212 | ±3 percentage points |
| Registered Voters | ||
| Total RV | 1015 | ±3 percentage points |
| Democratic RV | 311 | ±6 percentage points |
| Republican RV | 257 | ±7 percentage points |
| Independent RV | 366 | ±6 percentage points |
| Female RV | 419 | ±5 percentage points |
| RV 18-29 years of age | 141 | ±9 percentage points |
| RV 65 and older | 314 | ±6 percentage points |
| Health Care Voters | ||
| Total | 918 | ±4 percentage points |
| Democratic Health Care Voters | 266 | ±7 percentage points |
| Republican Health Care Voters | 182 | ±8 percentage points |
| Independent Health Care Voters | 268 | ±7 percentage points |
| Party Identification | ||
| Democrats | 365 | ±6 percentage points |
| Republicans | 295 | ±6 percentage points |
| Independents | 450 | ±5 percentage points |
| Heard/Read Anything About | ||
| Zika virus | 1107 | ±3 percentage points |
Endnotes
- The July Kaiser Tracking Poll was in the field from July 5th to July 11th, one week after the terrorist attacks at Istanbul’s airport and two days following the attacks in Baghdad which killed more than 200 civilians. During this week, there were also several domestic incidents, including police-involved shootings in Baton Rouge and Minnesota and the attack targeting police officers in Dallas on July 7th. ↩︎
- The Republican National Convention starts on July 18th, 2016 and the Democratic National Convention starts on July 25th, 2016. ↩︎
- The police-involved shooting of Alton Sterling in Baton Rouge, La. occurred on July 5th and the police-involved shooting of Philando Castille in Minnesota occurred on July 6th. The items were included in interviews beginning on July 7th. ↩︎
- A Kirzinger, E Sugarman, M Brodie, Kaiser Health Tracking Poll: June 2016. https://modern.kff.org/global-health-policy/poll-finding/kaiser-health-tracking-poll-june-2016/ ↩︎
- J Firth, A Kirzinger, M Brodie, Kaiser Health Tracking Poll: April 2016. https://modern.kff.org/health-reform/report/kaiser-health-tracking-poll-april-2016/ ↩︎