Kaiser Health Tracking Poll: November 2012
The November poll finds that while health care ranked as a second-tier issue in this month’s election, President Obama and Republican nominee Mitt Romney tied among voters who felt strongly about the Affordable Care Act, and President Obama won an advantage among voters who said Medicare was important to their vote, and among women on women’s health issues.
The November poll is the latest in a series designed and analyzed by the Foundation’s public opinion research team.

Findings (.pdf)

Chartpack (.pdf)

Toplines (.pdf)
Health Care Factored In 2012 Election, But Far From A Starring Role
As predicted, there was a role for health care issues in voters’ 2012 election decision, but Kaiser’s November Health Tracking Poll—fielded in the days immediately following last week’s presidential election—suggests it was a trailing issue rather than a leading one.
| FIGURE 1: Health Care On The List Of Most Important Factors To Vote, But Not At The Top | ||
| What one factor mattered most to you in deciding who you voted for in the presidential election? What would you say was the second most important factor in deciding who you voted for in the presidential election? (Total mentions; open-ended question) | ||
| Rank | Voted for President Obama | Voted for Governor Romney |
| 1 | Candidate characteristics/record (55%) | Candidate characteristics/record (48%) |
| 2 | Economy and jobs (18%) | Economy and jobs (48%) |
| 3 | Health care (16%) | Health care (13%) |
| 4 | Social issues (9%) | Social issues (13%) |
| 5 | Women’s issues (7%) | Foreign policy/Budget deficit (each named by 11%) |
To keep the issue list in perspective, the November survey first asked voters to name the top two factors in their vote in an open-ended question, without providing answer choices. Here we confirm the importance of the candidates’ personal characteristics in voters’ decisions: for both those supporting President Barack Obama and those backing Governor Mitt Romney, it was the voters’ sense of the characteristics and records of the candidates themselves rather than any one issue that was at the top of their minds. Taken together, health care issues came in third (or tied for third) among both groups, volunteered by 16 percent of Obama voters and 13 percent of Romney voters as one of the two most important factors in their vote. More specifically, eight percent of all voters mentioned something about the Affordable Care Act (ACA) as important to their vote, either pro or con, while one percent volunteered something about the Medicare program and the same share volunteered Medicaid [see question 5/6 of the topline for full results]. Interestingly, while the economy and jobs were just as important as the candidates’ own strengths for Romney voters, it was named by significantly fewer Obama voters.
Health Care Is More Than Just the ACA
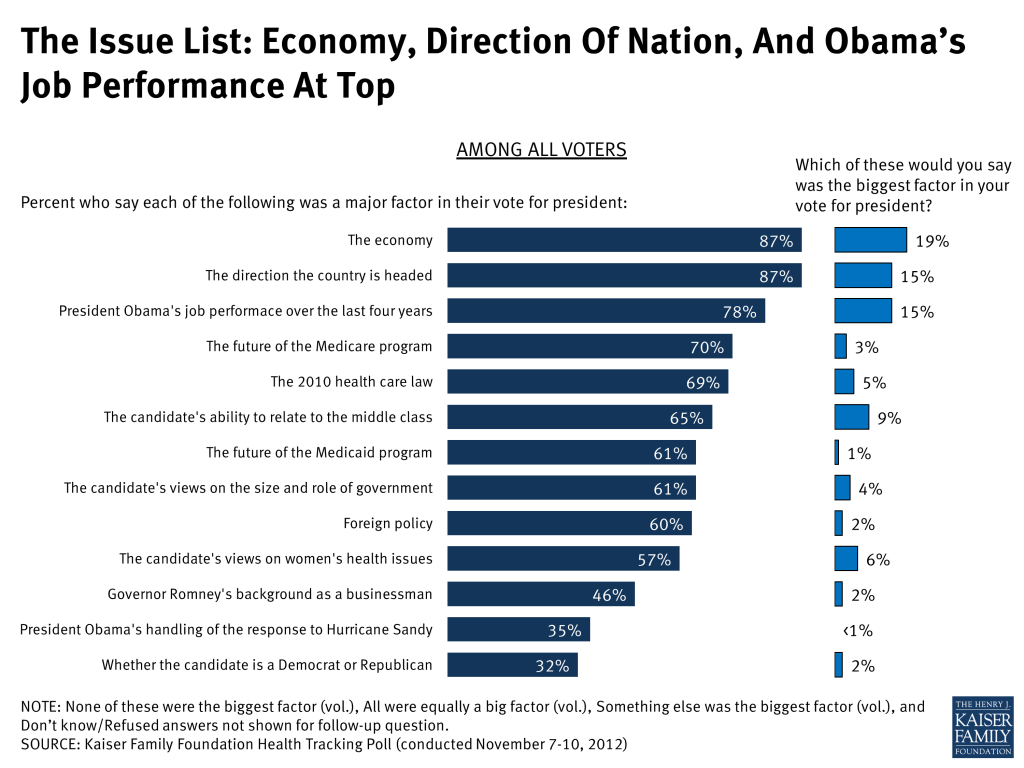
As previous months of Kaiser polling have shown, however, when voters talked about ‘health care’ they were talking about much more than the ACA, even though the signature Obama administration legislation looms large for those deeply immersed in the latest health policy developments. When voters were asked to assess the importance of a lengthy list of issues to their votes, large shares named a variety of health issues as a major factor in their vote, including: the future of the Medicare program (70 percent), the ACA (69 percent), the future of Medicaid (61 percent), and the candidates’ views on women’s health issues (57 percent).
Pressed to choose among this admittedly long laundry list of issues, voters splintered in their priorities, and no health care issue garnered more than single digit support as the biggest factor in their choice in 2012. That honor was saved for the economy (19 percent), the direction of the nation (15 percent), and President Obama’s performance during his first term (15 percent).
Did Health Care Issues Benefit One Candidate Over The Other?
The national exit poll1 conducted by a consortium of major media organizations on election night also found health care in the mix as a second tier issue (18 percent picked health care from a list of four possible issues, compared to 59 percent that picked the economy), and suggested that health care voters were much more likely to have voted for President Obama than for Governor Romney. Kaiser’s November tracking survey also found voters that volunteered a health care-related issue as one of the top two factors in their choice gave the edge to President Obama, 55 percent to 41 percent, though by a significantly smaller margin than the exit poll found in answer to a closed-ended version of the most important issue question.
| FIGURE 3: A Look at How Health Care Voters Voted: Across Several Possible Definitions of “Health Care Voters”, President Obama Had the Edge. The One Exception, The ACA, Where The Candidates Were Tied | ||||||
| Data from National Exit Poll | Data from KFF November Health Tracking Poll – Among Voters Who… | |||||
| Selected health care as their top issue (closed-end) | …said health care was top factor to vote (open-end) | …said the 2010 health care law was a ‘major factor’ in their vote | …said the future of the Medicare program was a ‘major factor’ in their vote | …said the future of the Medicaid program was a ‘major factor’ in their vote | …said the candidate’s stance on women’s health issues was a ‘major factor’ in their vote | |
| Share of electorate | 18% | 14% | 69% | 70% | 61% | 57% |
| % who voted for Pres. Obama | 75% | 55% | 46% | 50% | 52% | 59% |
| % who voted for Gov. Romney | 24 | 41 | 47 | 41 | 39 | 31 |
| Obama – Romney percentage point diffc. | +51 | +14 | -1 | +9 | +13 | +28 |
Among the much larger groups of the electorate that did not necessarily name a health care issue as the “biggest” factor in their vote, but still agreed that a variety of related issues did play some role, President Obama’s edge over Governor Romney varied. For example among those that agreed women’s health or Medicaid played a role, the incumbent had a double digit advantage over his challenger (28 percentage points and 13 points respectively). On one of the other controversial issues of the election, the 70 percent of voters that said the future of Medicare played some role in their vote went for President Obama somewhat more narrowly, 50 percent compared to 41 percent for Gov. Romney.
Finally, the two candidates were tied among those voters that said the ACA was a major factor in their vote, suggesting that the controversial health law worked both ways in the election. According to the November tracking poll, supporters of the law were just as likely to name it as a factor in their vote as opponents, suggesting it motivated both sides on the issue in equal measure.
| FIGURE 4: ACA Motivated Both Opponents and Supporters Equally | ||
| Percent of voters that said the 2010 health care law was… | Among voters who have a favorable view of the ACA | Among voters who have an unfavorable view of the ACA |
| …a ‘major factor’ in their vote for president | 71% | 73% |
| …the ‘biggest factor’ in their vote for president | 5% | 7% |
Women were a key constituency in the president’s win and women’s issues, including those related to their reproductive health choices, were a small, but measureable factor for this group. Six percent of women voters specifically mentioned women’s issues as one of the most important factors to their vote in the open-end, compared to one percent of men. Two-thirds (65 percent) of female voters rated “the candidate’s views on women’s health issues, including birth control and abortion” as a major factor in their vote choice (compared to about half of men), with eight percent naming it as the biggest factor.
A Post-Election Look At Seniors
Seniors have been an interesting group to watch this election cycle: previous polling shows that they have been more likely than others to prioritize Medicare in their electoral choice, more likely to oppose changing the program to a premium support system along the lines proposed by Gov. Romney and his running-mate Congressman Paul Ryan, but at the same time more likely to give Gov. Romney a small edge as the candidate they trusted with the future of the program. This new post-election poll finds similar results, but also echoes the theme above that health care wasn’t moving extremely large portions of any segment of the electorate this year.
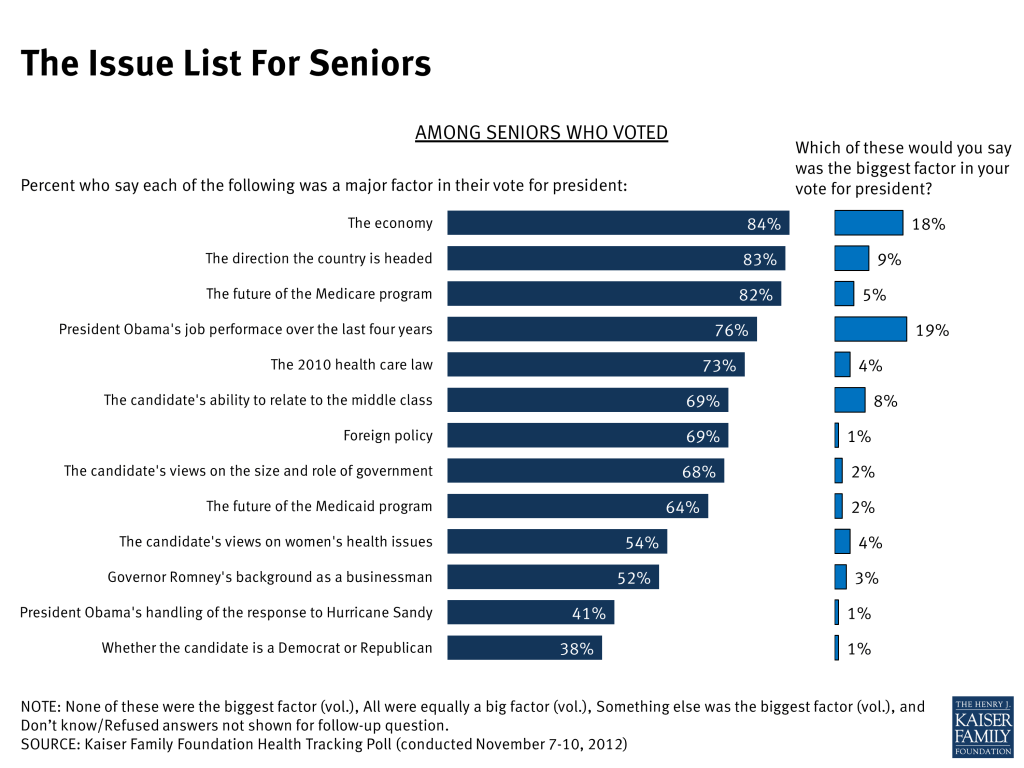
There was an age gap in prioritizing the nation’s primary health program for retirees: A large majority of voters aged 65 and older said Medicare’s future was a major factor in their vote (82 percent), 16 percentage points higher than among younger voters. But, as was true nationwide, few senior voters named it as the ‘biggest’ single factor in their vote choice (5 percent), and in the open-ended item, only 12 percent of seniors named any health issue as one of the primary elements in their decision, with only one percent offering up Medicare specifically. Meanwhile, though seniors have remained somewhat more skeptical than younger Americans of the Affordable Care Act, the November survey finds them more in line with the rest of the public on the 2010 law, with 40 percent favorable versus 40 percent unfavorable and the remaining two in ten not offering an opinion.
According to the national exit poll, Gov. Romney won among seniors by a comfortable margin. Even so, more of those aged 65 and up say that President Obama’s policies will be good for seniors as a group than expect they will be bad (47 percent versus 33 percent). Similarly, somewhat more seniors expect his policies will be good for the Medicare program than bad (45 percent compared to 35 percent).
As To The Affordable Care Act, Not Even An Election Can Disturb Its Consistent Ratings
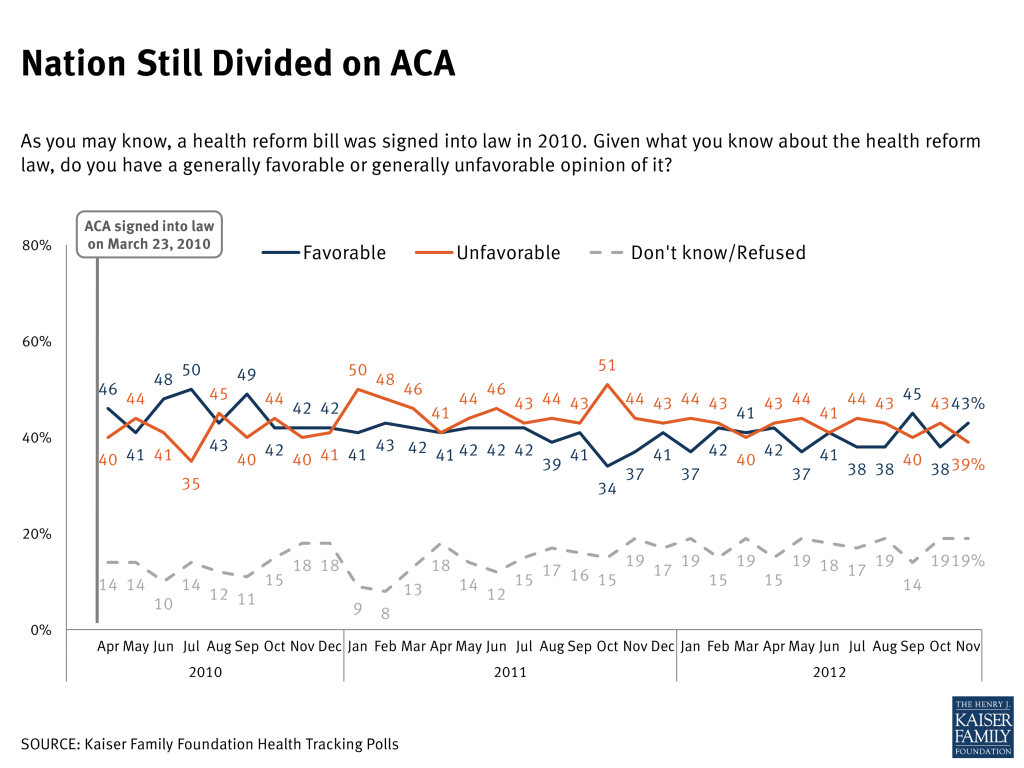
Meanwhile, not even a presidential election can disturb the relatively stable opinion trend on the Affordable Care Act. Looking among the American public as a whole in the days after the long race ended, the November survey found the public comfortably in the relatively narrow band that we have seen since passage of roughly split views. Meanwhile, not surprisingly, three-quarters of Obama voters reported having favorable views of the ACA, while eight in ten Romney voters reported the opposite, with 65 percent saying their views of the law were “very” unfavorable.
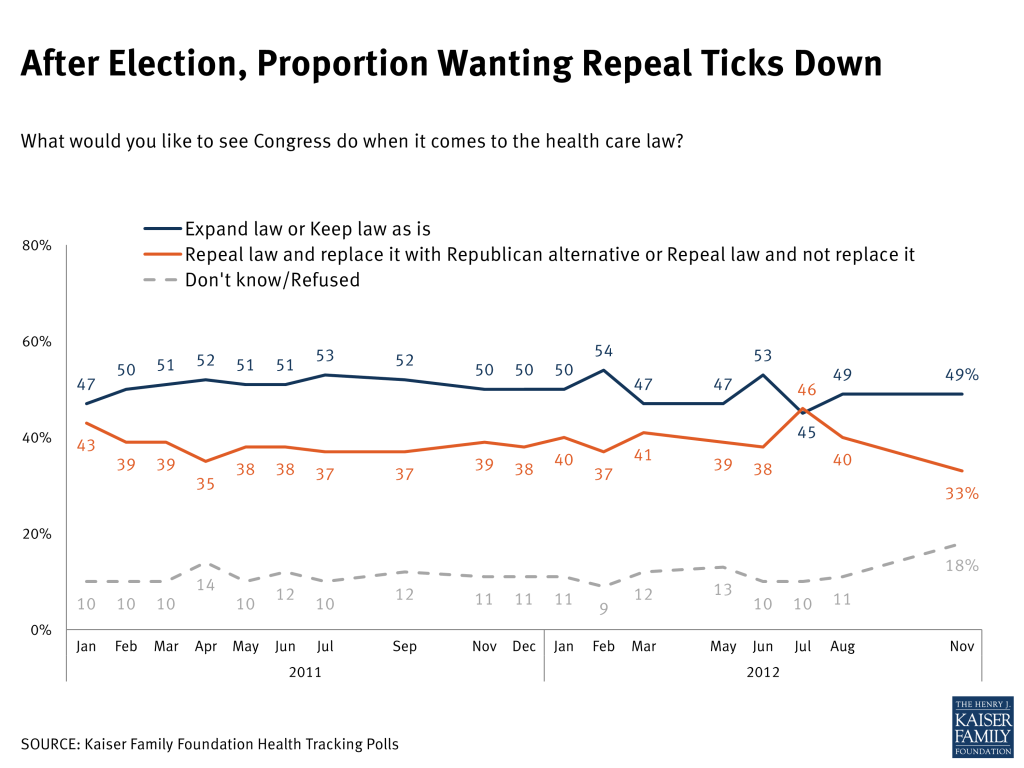
At the same time, the proportion of Americans that report wanting to see the law repealed dropped to a new low of 33 percent. (Last week returning Republican House Majority Leader John Boehner told a network TV interviewer that “Obamacare is the law of the land” and the House will not move forward with further votes to repeal the law.)
Going Forward: Views Of President Obama’s Second Term
A clear majority of Americans anticipate President Obama’s second term will be good for lower income Americans and for women, while Americans are quite divided on what it will mean for the wealthy. In terms of health issues, more think President Obama’s policies will be good for Medicare, Medicaid and the ACA, than think they will be bad.
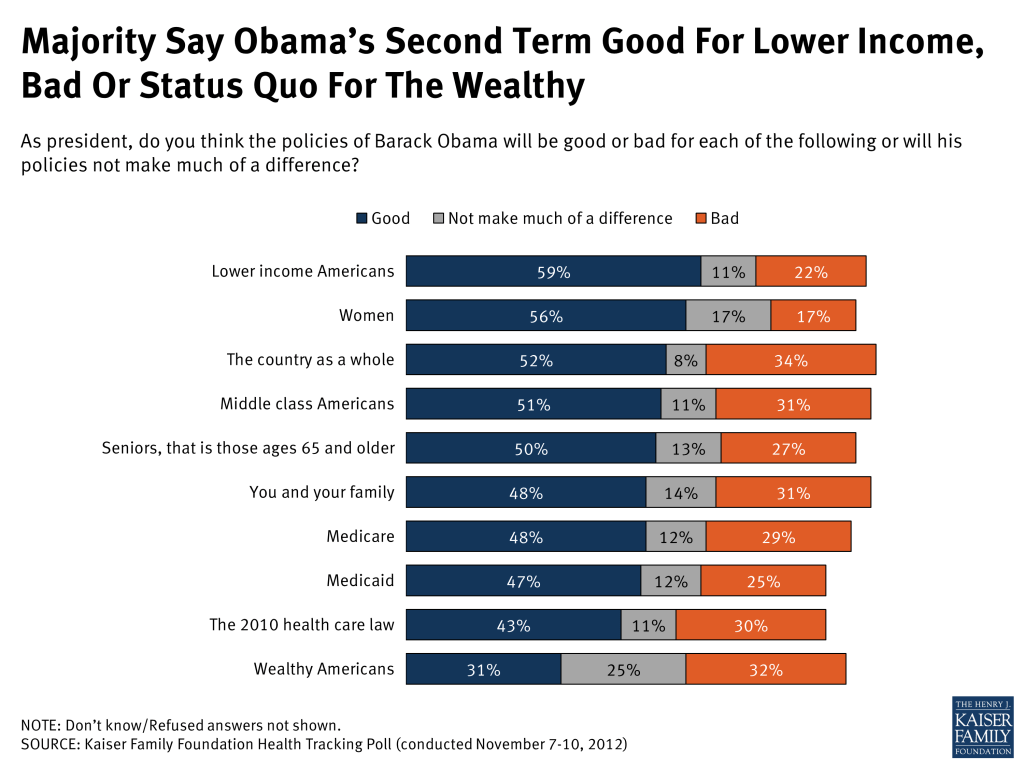
Below is an abbreviated version of the chartpack for the November 2012 Kaiser Health Tracking Poll. To view the full chartpack, please download the PDF under Related Materials.
This Kaiser Health Tracking Poll was designed and analyzed by public opinion researchers at the Kaiser Family Foundation led by Mollyann Brodie, Ph.D., including Claudia Deane, Sarah Cho, and Theresa Boston. The survey was conducted November 7-10, 2012, among a nationally representative random digit dial telephone sample of 1,223 adults ages 18 and older, living in the United States, including Alaska and Hawaii (note: persons without a telephone could not be included in the random selection process). Computer-assisted telephone interviews conducted by landline (708) and cell phone (515, including 274 who had no landline telephone) were carried out in English and Spanish by Braun Research, Inc. under the direction of Princeton Survey Research Associates International (PSRAI). Both the landline and cell phone samples were provided by Survey Sampling International, LLC. For the landline sample, respondents were selected by asking for the youngest adult male or female currently at home based on a random rotation. If no one of that gender was available, interviewers asked to speak with the youngest adult of the opposite gender. For the cell phone sample, interviews were conducted with the person who answered the phone.
The combined landline and cell phone sample was weighted to balance the sample demographics to match estimates for the national population data from the Census Bureau’s 2011 Annual Social and Economic Supplement (ASEC) on sex, age, education, race, Hispanic origin, nativity (for Hispanics only), and region along with data from the Census on population density. The sample was also weighted to match current patterns of telephone use using data from the July-December 2011 National Health Interview Survey. The weight takes into account the fact that respondents with both a landline and cell phone have a higher probability of selection in the combined sample and also adjusts for the household size for the landline sample. All statistical tests of significance account for the effect of weighting. Weighted and unweighted values for key demographic variables are shown in the table below.
| Sample Demographics | ||
| Unweighted | Weighted | |
| Gender | ||
| Male | 48.2% | 48.6% |
| Female | 51.8% | 51.4% |
| Age | ||
| 18-24 | 8.7% | 12.4% |
| 25-34 | 13.6% | 17.8% |
| 35-44 | 13.7% | 16.7% |
| 45-54 | 18.5% | 18.8% |
| 55-64 | 19.5% | 15.7% |
| 65+ | 23.9% | 17.0% |
| Education | ||
| Less than HS Grad. | 8.0% | 12.5% |
| HS Grad. | 25.4% | 33.6% |
| Some College | 24.6% | 24.3% |
| College Grad. | 40.1% | 28.2% |
| Race/Ethnicity | ||
| White/not Hispanic | 71.2% | 66.4% |
| Black/not Hispanic | 11.0% | 11.2% |
| Hisp – US born | 5.8% | 6.5% |
| Hisp – born outside | 4.0% | 6.8% |
| Other/not Hispanic | 5.1% | 6.3% |
| Party Identification | ||
| Democrat | 34.0% | 33.9% |
| Independent | 31.8% | 32.3% |
| Republican | 24.4% | 22.8% |
| Other | 4.9% | 5.0% |
The number of respondents and the margin of sampling error for key subgroups are presented in the table below. For results based on subgroups, the margin of sampling error may be higher. Sample sizes and margin of sampling errors for other subgroups are available by request. Note that sampling error is only one of many potential sources of error in this or any other public opinion poll.
| Number of respondents | Margin of sampling error | |
| Total | 1,223 | ±3 percentage points |
| All voters | 947 | ±4 percentage points |
| Obama voters | 452 | ±5 percentage points |
| Romney voters | 410 | ±5 percentage points |
| Did not vote | 276 | ±6 percentage points |
Note, the data was not weighted to the final popular vote numbers and as a result the reported vote number in Q3/Q4 does not exactly match the popular vote. In this survey, 70 percent of the public overall reported voting in the presidential election, which is much higher than the estimated 57.5 percent of the voting-eligible population that actually turned out to vote. Vote over-reporting is common in public opinion surveys. In this poll, 47 percent of voters reported voting for President Obama and 43 percent reported voting for Governor Romney. If these responses are re-calculated based on those who reported their vote for president, then 50 percent reported voting for President Obama and 45 percent for Governor Romney. This is reasonably close to the actual national vote count of about 50.5 percent Obama, 48 percent Romney.
The response rate calculated based on the American Association of Public Opinion Research’s Response Rate 3 formula was 13 percent for the landline sample and 11 percent for the cell phone sample.
Endnotes
- Data for the 2012 exit poll were collected by Edison Research for the National Election Pool, a consortium of ABC News, The Associated Press, CBS News, CNN, Fox News and NBC News. The data from this survey is available online on a number of media websites. See, for example, http://www.washingtonpost.com/wp-srv/special/politics/2012-exit-polls/table.html ↩︎