Kaiser Health Tracking Poll: Future Directions for the ACA and Medicaid
Findings
KEY FINDINGS:
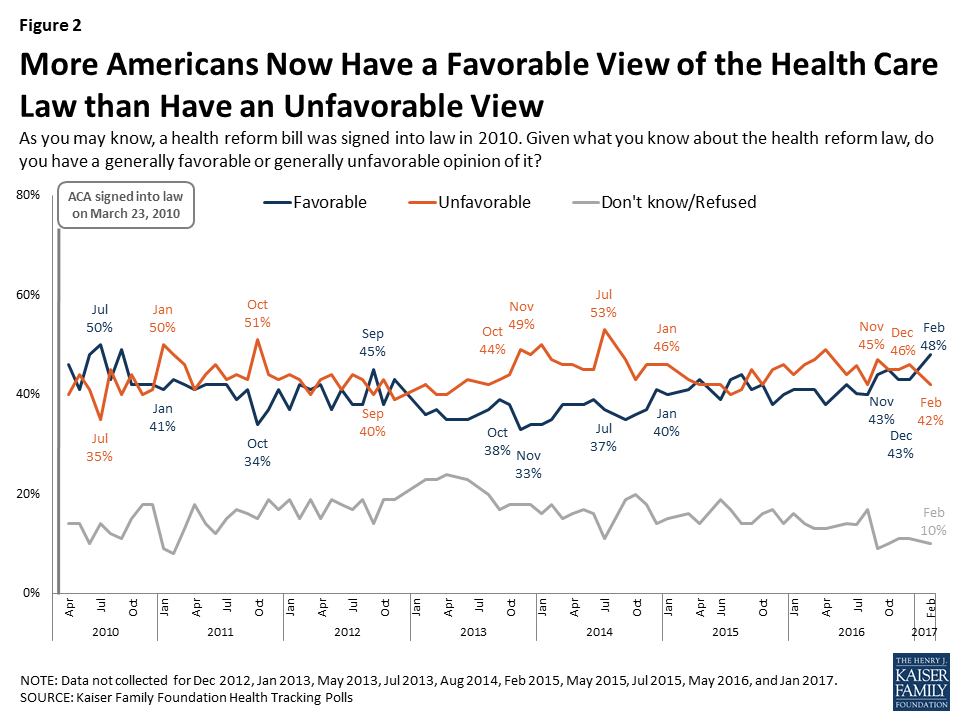
- The latest Kaiser Health Tracking Poll finds attitudes towards the Affordable Care Act (ACA) have shifted with a larger share reporting a favorable opinion towards the law (48 percent) than reporting an unfavorable opinion (42 percent). This is the highest level of favorability of the ACA measured in more than 60 Kaiser Health Tracking Polls since 2010 and is largely driven by a change in the views of independents, among which 50 percent now view the law favorably.
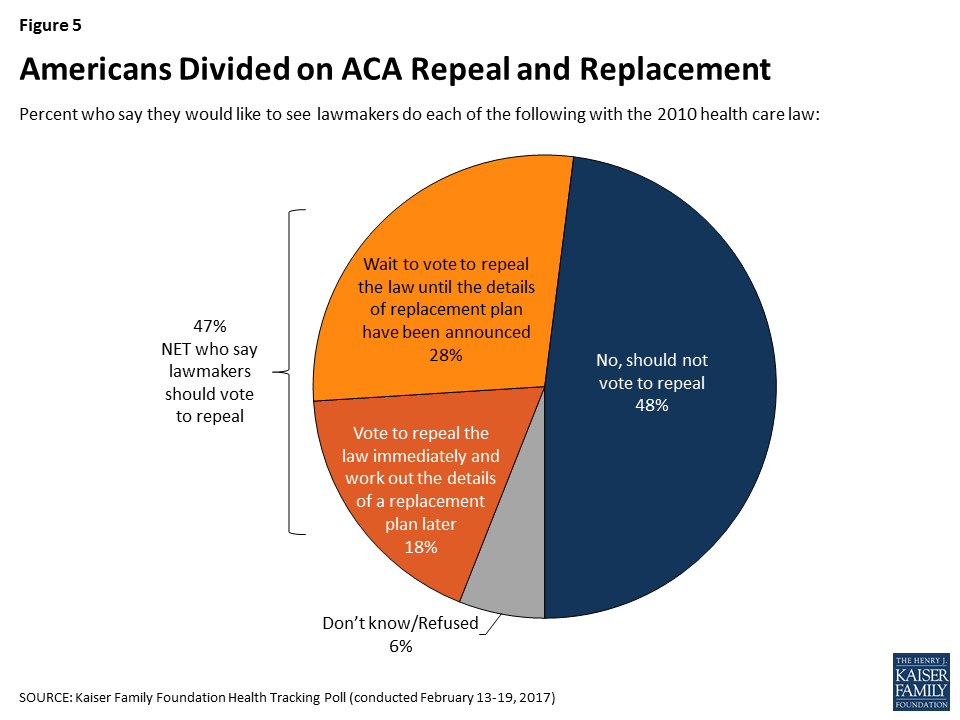
- Despite this shift in overall favorability, the public remains divided on what they would like lawmakers to do when it comes to the 2010 health care law with 47 percent wanting lawmakers to vote to repeal the law compared to 48 percent who say they should not vote to repeal it. Of those who want to see Congress vote to repeal the law, a larger share say they want lawmakers to wait to vote to repeal the law until the details of a replacement plan have been announced (28 percent) than say Congress should vote to repeal the law immediately and work out the details of a replacement plan later (18 percent).
- Republican lawmakers have also discussed possible changes to Medicaid – to either a per capita allotment program or to giving states the option to receive federal Medicaid funding in the form of a block grant. When examining these two proposed changes to Medicaid, more Americans (65 percent) would prefer to see Medicaid continue as it is today than either of the offered alternatives to the current federal funding structure.
- The vast majority of Americans say it is either “very important” (55 percent) or “somewhat important” (29 percent) for ACA replacement plans to ensure that states that have received federal funds to expand Medicaid continue to receive those funds, with majorities of Democrats (95 percent), independents (84 percent), and Republicans (69 percent) saying it is important.
The February 2017 Kaiser Health Tracking Poll finds that Americans have concerns about the shifting landscape of health care in this country. Six in ten (62 percent) Americans say that when it comes to health care, things in this country have pretty seriously gotten off on the wrong track, compared to three in ten who say things are generally going in the right direction.
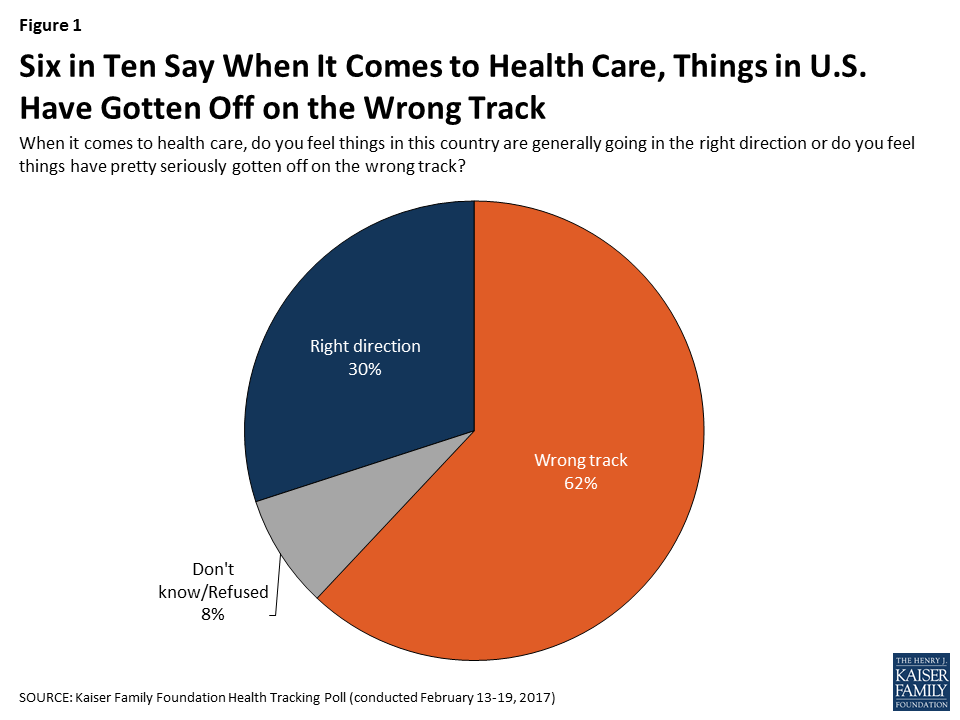
These results are consistent across demographic groups with roughly twice as many individuals – regardless of party identification or health status – saying things are on the wrong track as saying things are headed in the right direction. This month’s survey examines two specific policy areas that may be driving these concerns: the future of the Affordable Care Act and Medicaid.
Future Directions for the Affordable Care Act
With lawmakers debating the future of the Affordable Care Act (ACA), the latest Kaiser Health Tracking survey finds that more Americans now have a favorable view of the health care law (48 percent) than have an unfavorable opinion (42 percent).
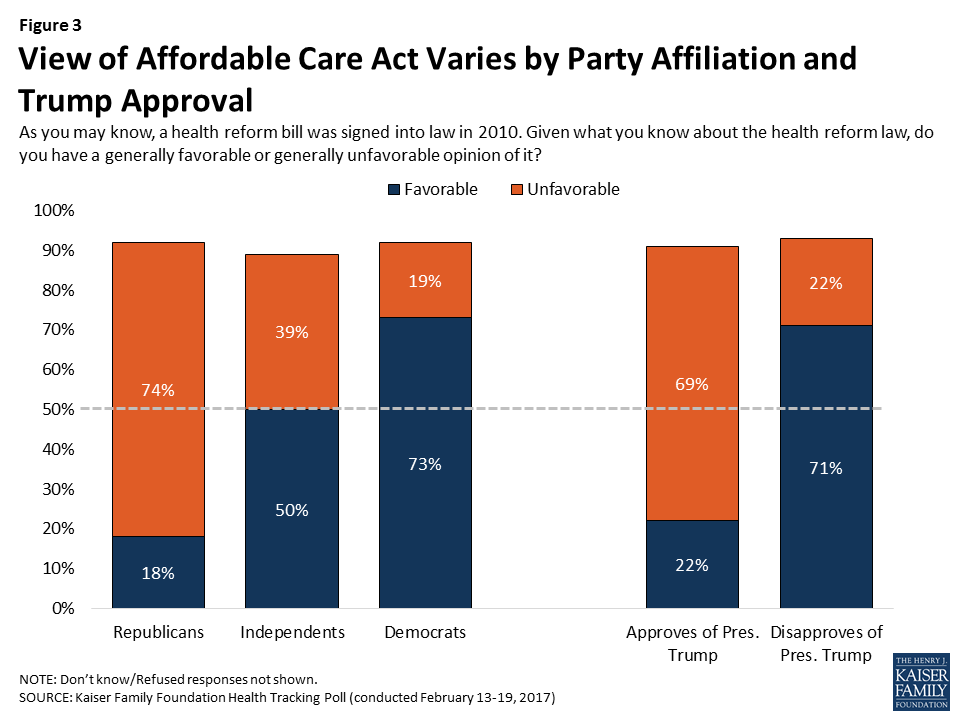
Attitudes towards the ACA are largely viewed through a partisan lens with about seven in ten Republicans and about seven in ten of those who approve (either somewhat or strongly) of the way President Trump is handling his job reporting an unfavorable opinion towards the law (74 percent and 69 percent, respectively). This compares to a majority of both Democrats and those who disapprove of President Trump reporting a favorable view of the law (73 percent and 71 percent).
The Shifting Attitudes of Independents
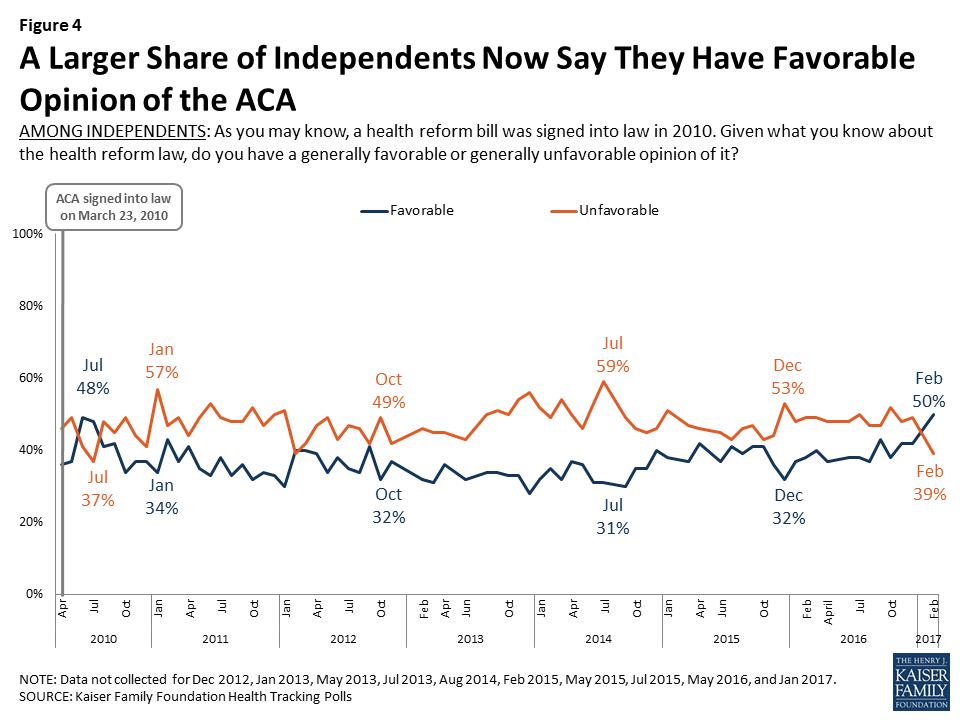
The latest shift in favorability of the law is largely driven by the views of independents, among whom a larger share now say they have a favorable opinion (50 percent) of the law than an unfavorable opinion (39 percent). This is the first survey since 2010 that has found a larger share of independents reporting a favorable view than an unfavorable view.1
Repealing and Replacing the Affordable Care Act
As lawmakers debate replacement plans for the ACA, Americans are divided on what they want to see lawmakers do with the health care law, with 48 percent saying they do not want Congress to vote to repeal the law and 47 percent saying they want Congress to vote to repeal it. Of those who want to see Congress vote to repeal the law, a larger share say they want lawmakers to wait to vote on repeal until the details of a replacement plan have been announced (28 percent) than say Congress should vote to repeal the law immediately and work out the details of a replacement plan later (18 percent). These findings are similar to the results from the December 2016 Kaiser Health Tracking Poll.2
Attitudes on the ACA’s next steps are largely partisan with the vast majority of Democrats (78 percent) saying they do not want Congress to vote to repeal the health care law compared to about half of independents and 16 percent of Republicans who say the same. On the other hand, while the majority of Republicans want to see Congress vote to repeal the law, fewer want them to vote to repeal the law immediately (31 percent) than want them to wait until they have the details of a replacement plan announced (48 percent). With more than half of Republicans (64 percent) wanting lawmakers to do something other than immediate repeal of the ACA, this is a clear indication of the challenge facing Republican lawmakers.
| Table 1: Next Steps for the ACA | ||||
Percent who would like to see lawmakers do each of the following with the 2010 health care law: | Total | Democrats | Independents | Republicans |
| Should not vote to repeal | 48% | 78% | 47% | 16% |
| Should vote to repeal (NET) | 47 | 18 | 46 | 82 |
| Wait to vote to repeal the law until the details of a replacement plan have been announced | 28 | 8 | 31 | 48 |
| Vote to repeal the law immediately and work out the details of a replacement plan later | 18 | 9 | 14 | 31 |
| Don’t know/Refused | 6 | 5 | 7 | 5 |
How ACA Repeal Efforts Are Affecting Americans
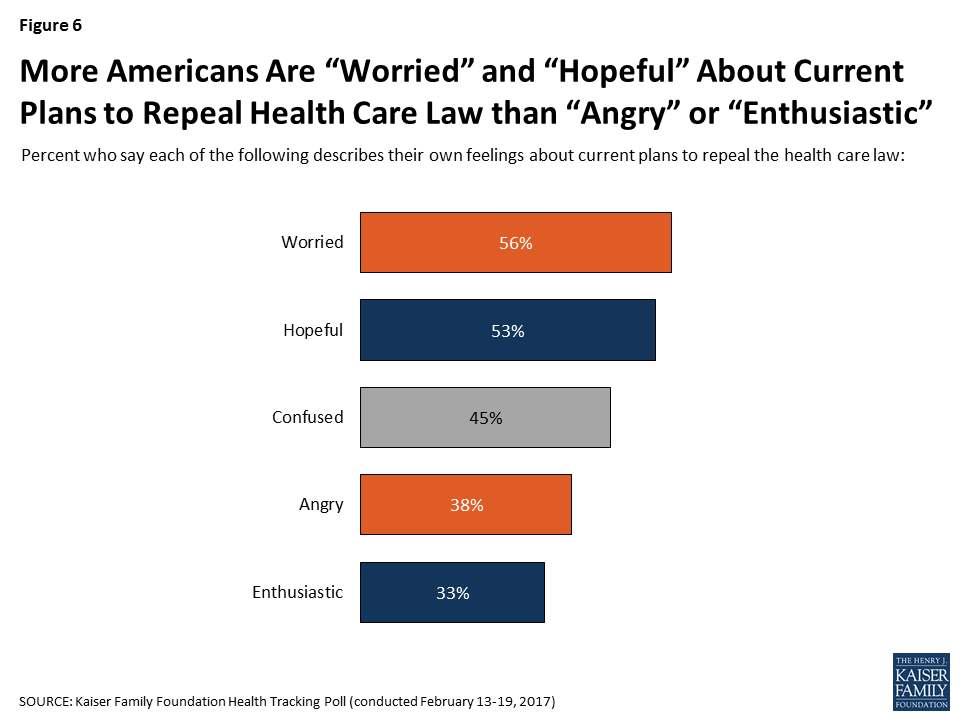
As Americans watch their elected leaders debate repeal and replacement plans for the ACA, more feel worried (56 percent) and hopeful (53 percent) than confused (45 percent), angry (38 percent), or enthusiastic (33 percent).
Related to the partisan nature of the health care law and current repeal efforts, Democrats (81 percent) are more likely to say they feel “worried” about current plans than independents (57 percent) and Republicans (26 percent). Republicans, on the other hand, are more likely to report feeling “hopeful” than independents and Democrats (78 percent compared to 55 percent and 30 percent, respectively). An equal share of independents report feeling “worried” (57 percent) as report feeling “hopeful” (55 percent).
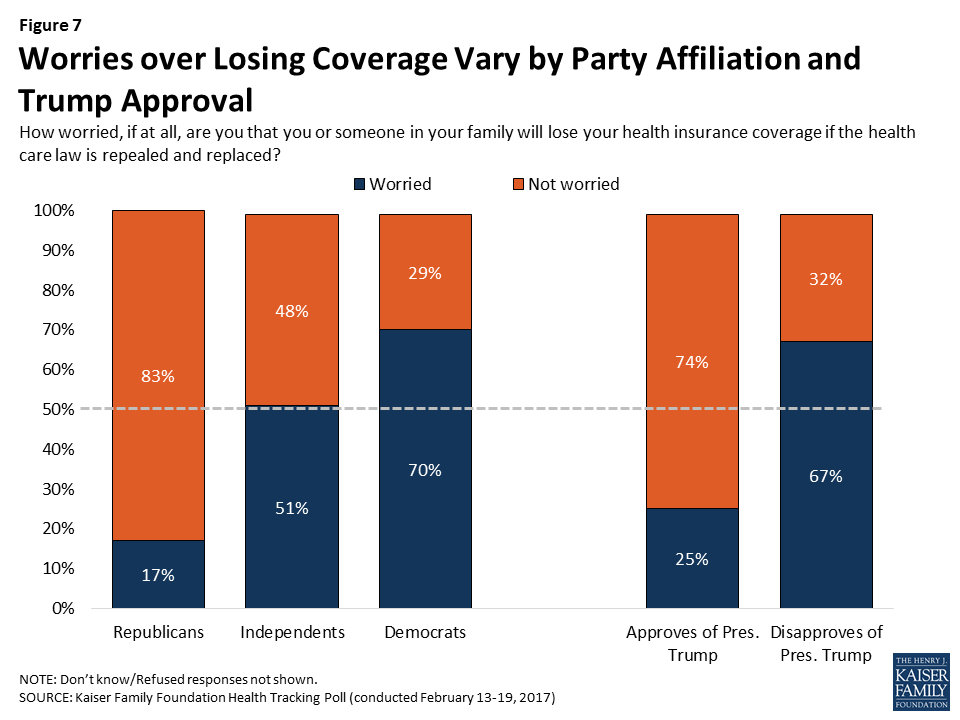
Underscoring that perceptions sometimes exceeds the impact of what policies may or may not be, half of Americans (48 percent) are either “very worried” (26 percent) or “somewhat worried” (22 percent) that they or someone in their family will lose their health insurance coverage if the health care law is repealed and replaced, compared to 51 percent of those who are not worried. A larger share of Democrats and independents report being worried about losing their health insurance than Republicans (70 percent, 51 percent, and 17 percent, respectively). In addition, 67 percent of those who disapprove of President Trump say they are worried about losing their coverage under an ACA replacement plan, as do one-fourth of those who approve of President Trump.
Individuals in families with ongoing health needs and individuals who report being in fair or poor health are more likely to be worried about losing their health insurance coverage if the ACA is repealed and replaced. Among those who report being in fair or poor health, 64 percent say they are either “very” or “somewhat” worried about losing their health insurance coverage compared to 44 percent of those in excellent, very good, or good health. About half (55 percent) of individuals with a chronic health condition that requires ongoing medical treatment also report being worried about losing their coverage compared to 41 percent of those without ongoing health needs.
| Table 2: Health Status Affects How Worried Individuals Are About Losing Coverage | |||||
| How worried, if at all, are you that you or someone in your family will lose your health insurance coverage if the health care law is repealed and replaced? | Total | Health Status | Ongoing Health Needs | ||
| Excellent/ Very Good/ Good | Fair/Poor | No | Yes | ||
| Worried (NET) | 48% | 44% | 64% | 41% | 55% |
| Not worried (NET) | 51 | 55 | 35 | 59 | 44 |
| NOTE: Don’t know/Refused responses not shown. | |||||
Future Directions for Medicaid
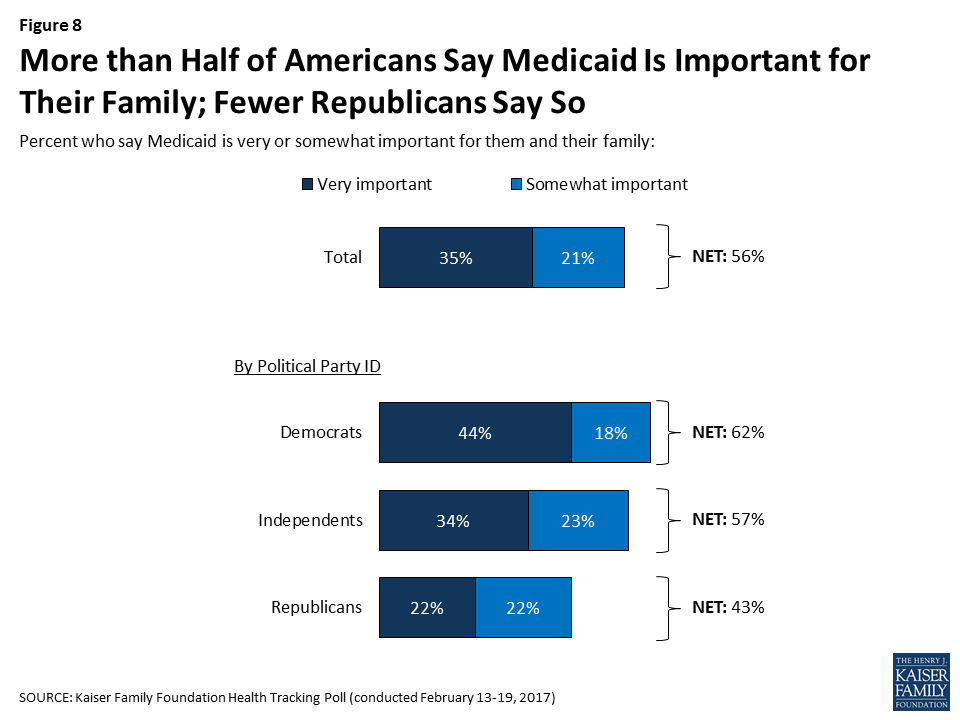
Republican lawmakers’ plans to repeal and replace the 2010 health care law also include proposed changes to Medicaid – the program that provides coverage for medical care and long-term care services to low-income people. Overall, nearly six in ten Americans (56 percent) say Medicaid is either “very” or “somewhat” important to them and their family; however, this does vary by party identification with larger shares of Democrats (62 percent) and independents (57 percent) reporting that the program is important than Republicans (43 percent).
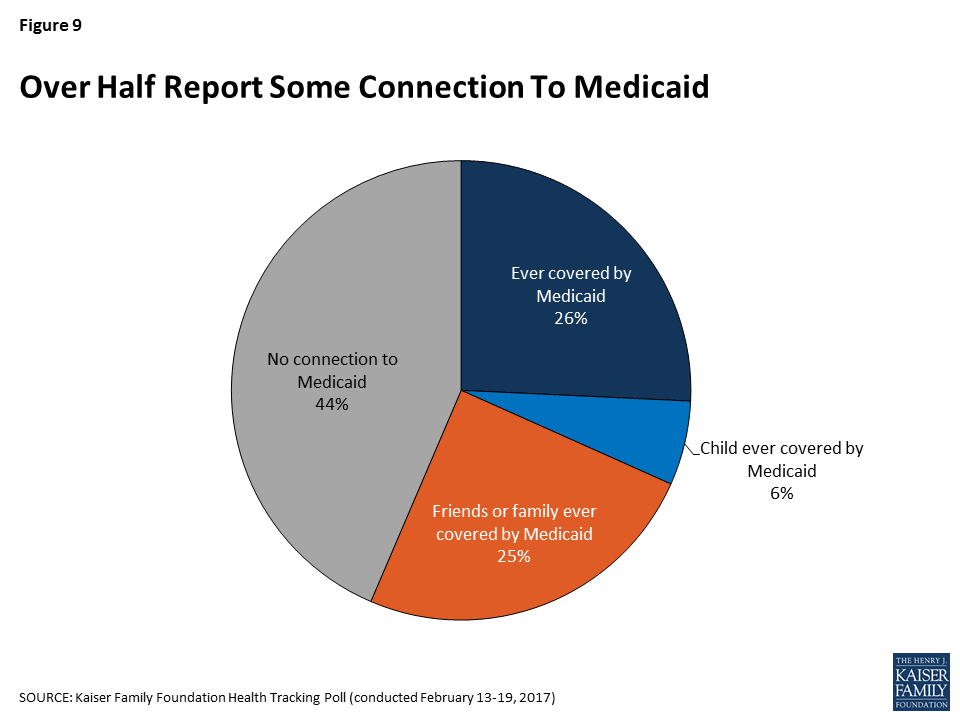
In addition, over half of Americans report some connection to the Medicaid program, either because they personally have received some assistance from Medicaid (26 percent) or they have close friends or family who have (31 percent).
Proposed Changes to Federal Funding for Medicaid
Currently, Medicaid is jointly financed by federal and state governments, with each state deciding how to structure benefits, eligibility, and care delivery within guidelines set by the federal government. The federal government matches state spending on an open-ended basis but Republican lawmakers are proposing two alternatives to this current structure: per capita allotments and block grants.
Medicaid Per Capita Allotment vs. Block Grant Proposal
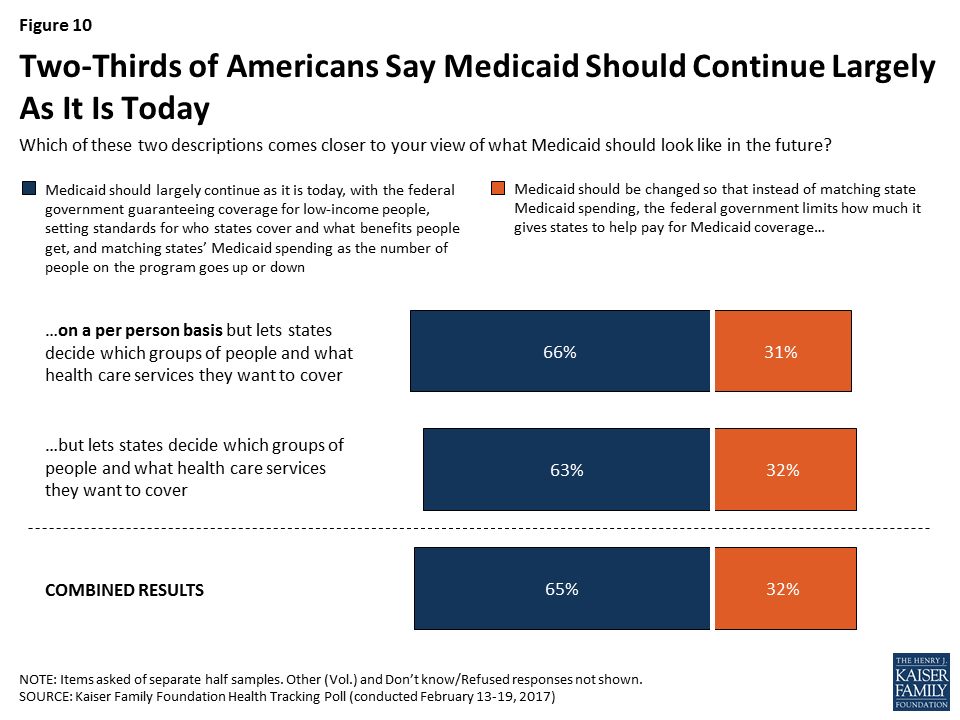
Under a Medicaid per capita cap, the federal government would set a limit on how much to reimburse states per enrollee. When provided with the option of keeping Medicaid largely as it is today or changing to a per capita allotment program, Americans largely prefer the status quo with two-thirds saying the program should continue as it is today with the federal government guaranteeing coverage, setting standards and benefits, and matching state spending. About a third (31 percent) say, instead, Medicaid should be changed to a per capita allotment structure rather than matching state Medicaid spending.
Another option that has been proposed by Republican lawmakers calls for giving states the option to receive federal Medicaid funding in the form of a block grant. Under a block grant structure, the federal government would limit the amount it gives states to help pay for Medicaid coverage but could allow states more flexibility in determining which groups of people and what services are covered under the program. Here again, most Americans prefer the status quo, with 63 percent saying the program should continue as it is today while 32 percent say Medicaid should be changed to a block grant structure.
When examining these two proposed changes to Medicaid, more Americans (65 percent) would prefer to see Medicaid continue as it is today than either of the offered alternatives to the current federal funding structure.
Six in ten Republicans support the per capita allotment proposal while about half of Republicans support changing Medicaid to a block grant program.
| Table 3: Proposed Changes to Medicaid | |||||
Which of these descriptions comes closer to your view of what Medicaid should look like in the future? | Total | Democrats | Independents | Republicans | |
| OPTION A | Medicaid should largely continue as it is today, with the federal government guaranteeing coverage for low-income people, setting standards for who states cover and what benefits people get, and matching states’ Medicaid spending as the number of people on the program goes up or down (NET) | 65% | 88% | 65% | 39% |
| OPTION B | Medicaid should be changed so that instead of matching state Medicaid spending, the federal government limits how much it gives states to help pay for Medicaid coverage but lets states decide which groups of people and what health care services they want to cover. | 32 | 13 | 35 | 53 |
| Medicaid should be changed so that instead of matching state Medicaid spending, the federal government limits how much it gives states to help pay for Medicaid coverage on a per person basis but lets states decide which groups of people and what health care services they want to cover. | 31 | 8 | 31 | 57 | |
| NOTE: OPTION B items were asked of separate half samples. | |||||
Vast Majority of Americans Think Continuing Federal Funding for Medicaid Expansion is Important
Medicaid is also one of the primary ways the Affordable Care Act expanded coverage to millions more low-income, uninsured adults. The vast majority of Americans say it is either “very important” (55 percent) or “somewhat important” (29 percent) for ACA replacement plans to make sure that states that have received federal funds to expand Medicaid continue to receive those funds – with majorities of Democrats (95 percent), independents (84 percent), and Republicans (69 percent) saying it is important.
| Table 4: Majorities of Democrats, Independents, and Republicans Say Continued Federal Funding for Medicaid Expansion Is Important | ||||
If lawmakers decide to repeal and replace the 2010 health care law, how important is it to you that a replacement plan makes sure states that received federal funds to expand Medicaid continue to receive those funds? | Total | Democrats | Independents | Republicans |
| Important (NET) | 84% | 95% | 84% | 69% |
| Very important | 55 | 77 | 55 | 31 |
| Somewhat important | 29 | 17 | 29 | 38 |
| Not important (NET) | 15 | 4 | 15 | 28 |
| Not too important | 7 | 3 | 8 | 12 |
| Not at all important | 8 | 1 | 7 | 15 |
| Don’t know/Refused | 1 | 1 | 1 | 1 |
Attitudes Towards Continued Federal Funding for Medicaid Expansion in States That Have Expanded Medicaid
The vast majority (87 percent) of individuals living in the 16 states that have expanded Medicaid and have a Republican governor say it is either “very” or “somewhat” important that a replacement plan makes sure states that received federal funds to expand Medicaid continue to receive those funds. This is similar to the share of those living in Medicaid expansion states with Democratic governors (85 percent) and more than those living in states without Medicaid expansion (80 percent).

Medicaid Spending Compared to Other National Priorities
Reflecting the high regard the public holds for Medicaid, Americans are generally opposed to cutting back federal spending on the program. Overall, about half of Americans want to keep federal spending on Medicaid the same, while 36 percent want to increase spending and 12 percent want to decrease spending.
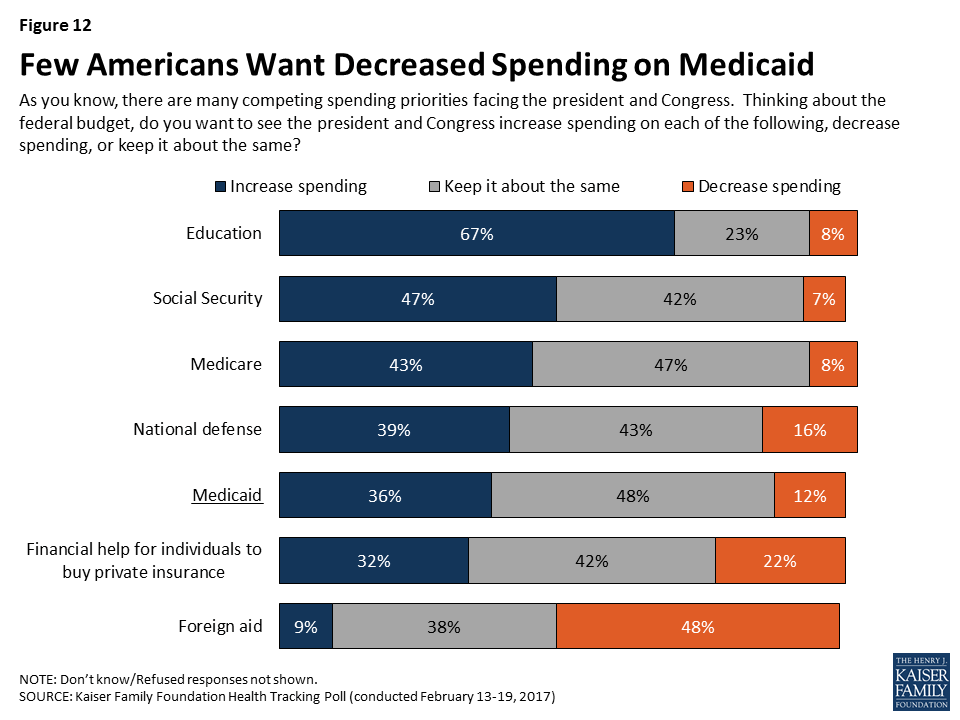
With the exception of increased spending on education, partisans have largely different spending priorities. Majorities of Democrats (81 percent), independents (66 percent), and Republicans (57 percent) would like to see the president and Congress increase spending on education; yet, that is where the consensus ends with a majority of Republicans calling for increased spending on national defense and about half of Democrats calling for increased spending on each of the three major entitlement programs – Medicare, Social Security, and Medicaid.
| Table 5: Partisans Differ on Spending Priorities | ||||
Percent who want to see the president and Congress increase spending on each of the following: | Total | Democrats | Independents | Republicans |
| Education | 67% | 81% | 66% | 57% |
| Social security | 47 | 53 | 53 | 36 |
| Medicare | 43 | 51 | 44 | 35 |
| National defense | 39 | 20 | 39 | 63 |
| Medicaid | 36 | 47 | 40 | 22 |
| Financial help for individuals to buy private health insurance | 32 | 40 | 32 | 26 |
| Foreign aid | 9 | 17 | 8 | 2 |
| NOTE: Some items asked of separate half-samples. | ||||
While partisans may have different spending priorities, even among Republicans, few want to see Medicaid spending decreased (19 percent).
Which Sources Does the Public Trust?
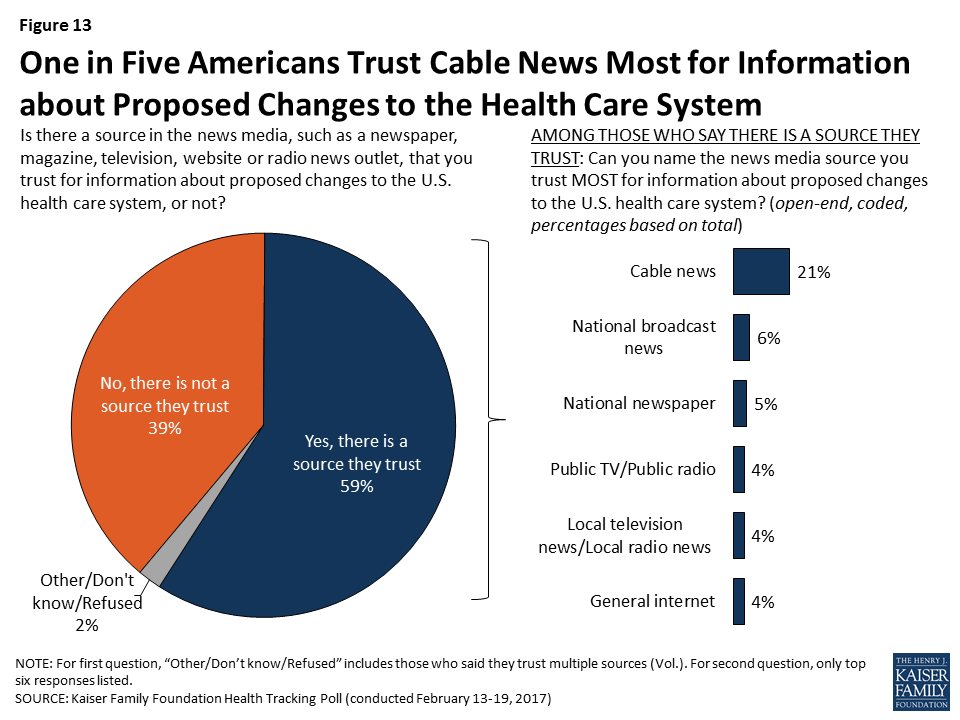
President Trump’s administration has frequently lamented the accuracy of news from major news organizations. Therefore, this month’s Tracking Poll aims to find out if there are sources that Americans trust when it comes to news about proposed changes to the U.S. health care system. Overall, six in ten (59 percent) Americans say there is a source in the news media that they trust compared to 39 percent who say there is no source that they trust for information about proposed changes to the health care system. One-fifth of all Americans say they most trust a cable news network for information about proposed changes to the U.S. health care system, with 10 percent of those saying they trust Fox News, 8 percent saying they trust CNN, and 3 percent saying they trust MSNBC. Smaller shares of Americans say they most trust national broadcast news (6 percent), national newspapers (5 percent), public television or radio (4 percent), local television or radio news (4 percent), and the internet (4 percent).
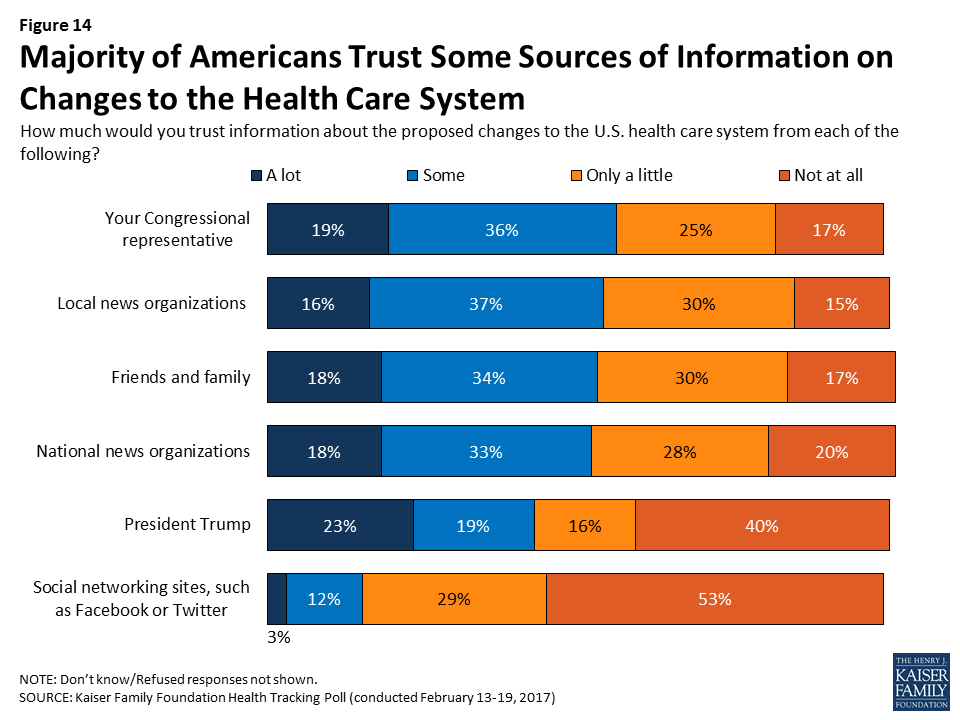
When it Comes to Health Care News, Americans Are Divided on What Sources They Trust
When it comes to information about proposed changes to the U.S. health care system, Americans are more likely to say they trust their Congressional representative (55 percent), their friends and family (51 percent), and local (53 percent) and national news organizations (51 percent) than say the same about information from President Trump (42 percent) or social networking sites, such as Facebook and Twitter (16 percent). While fewer than half of Americans say they trust information about proposed changes to the U.S. health care system from President Trump “a lot” or “some,” about one-fourth of Americans do say they trust information from the President “a lot” (23 percent) which may be an indication of the current divisive political environment. In fact, about half of Republicans say they trust information from President Trump “a lot” compared to 19 percent of independents and 4 percent of Democrats.
Methodology
This Kaiser Health Tracking Poll was designed and analyzed by public opinion researchers at the Kaiser Family Foundation (KFF). The survey was conducted February 13-19, 2017, among a nationally representative random digit dial telephone sample of 1,160 adults ages 18 and older, living in the United States, including Alaska and Hawaii (note: persons without a telephone could not be included in the random selection process). Computer-assisted telephone interviews conducted by landline (389) and cell phone (771, including 464 who had no landline telephone) were carried out in English and Spanish by Princeton Data Source under the direction of Princeton Survey Research Associates International (PSRAI). Both the random digit dial landline and cell phone samples were provided by Survey Sampling International, LLC. For the landline sample, respondents were selected by asking for the youngest adult male or female currently at home based on a random rotation. If no one of that gender was available, interviewers asked to speak with the youngest adult of the opposite gender. For the cell phone sample, interviews were conducted with the adult who answered the phone. KFF paid for all costs associated with the survey.
The combined landline and cell phone sample was weighted to balance the sample demographics to match estimates for the national population using data from the Census Bureau’s 2015 American Community Survey (ACS) on sex, age, education, race, Hispanic origin, and region along with data from the 2010 Census on population density. The sample was also weighted to match current patterns of telephone use using data from the January-June 2016 National Health Interview Survey. The weight takes into account the fact that respondents with both a landline and cell phone have a higher probability of selection in the combined sample and also adjusts for the household size for the landline sample. All statistical tests of significance account for the effect of weighting.
The margin of sampling error including the design effect for the full sample is plus or minus 3 percentage points. Numbers of respondents and margins of sampling error for key subgroups are shown in the table below. For results based on other subgroups, the margin of sampling error may be higher. Sample sizes and margins of sampling error for other subgroups are available by request. Note that sampling error is only one of many potential sources of error in this or any other public opinion poll. Kaiser Family Foundation public opinion and survey research is a charter member of the Transparency Initiative of the American Association for Public Opinion Research.
| Group | N (unweighted) | M.O.S.E. |
| Total | 1160 | ±3 percentage points |
| Half Sample A | 586 | ±5 percentage points |
| Half Sample B | 574 | ±5 percentage points |
| Party Identification | ||
| Democrats | 375 | ±6 percentage points |
| Republicans | 324 | ±6 percentage points |
| Independents | 348 | ±6 percentage points |
| Presidential Approval | ||
| Approves of President Trump | 495 | ±5 percentage points |
| Disapproves of President Trump | 590 | ±5 percentage points |
| Health Status | ||
| Excellent/Very good/Good | 938 | ±4 percentage points |
| Fair/Poor | 217 | ±8 percentage points |
| Ongoing Health Needs | ||
| Individuals with ongoing health needs | 605 | ±5 percentage points |
| Individuals without ongoing health needs | 551 | ±5 percentage points |
| Medicaid Expansion + Governor | ||
| States that expanded Medicaid with Republican governors | 311 | ±7 percentage points |
| States that expanded Medicaid with Dem. or Ind. governors | 388 | ±6 percentage points |
| States that have not expanded Medicaid | 461 | ±5 percentage points |
Endnotes
- On average, individuals who identify as political independents have accounted for about one-third of the total sample in Kaiser Health Tracking Polls. ↩︎
- A Kirzinger, B Wu, M Brodie, Kaiser Health Tracking Poll: Health Care Priorities for 2017. https://modern.kff.org/health-costs/poll-finding/kaiser-health-tracking-poll-health-care-priorities-for-2017/ ↩︎