Kaiser Health Policy Tracking Poll: December 2014
Kaiser Health Tracking Poll: December 2014 Findings
With many of the Affordable Care Act’s (ACA) major provisions taking effect this past year, such as the individual mandate and coverage expansions through Medicaid and the health insurance marketplaces, the December Kaiser Health Tracking Poll finds that many Americans are aware of the main parts of the law and, with the exception of the individual mandate, at least 6 in 10 feel favorably towards them. However, as the employer requirement takes effect in January for firms with 100 or more workers, Americans’ initial opinions of the provision are malleable, particularly if they hear it may cause some employers to move workers from full time to part time. Similarly, opinions on the individual mandate can change when more information is provided.
Despite the individual provisions receiving high marks, opinion of the law overall remains stable with 46 percent reporting an unfavorable view and 41 percent reporting a favorable view. The public is fractured over what Congress should do next with the law with 3 in 10 preferring repeal, about 1 in 10 saying they would like Congress to scale back the law, a fifth saying they want implementation to continue, and a quarter favoring expanding the law. Americans give a wide variety of answers when asked to say in their own words what the law does, but about 4 in 10 say that it expands access to health care and health insurance. And, about one month into the ACA’s second open enrollment period, the poll finds the vast majority of the uninsured don’t know the deadline to enroll, most expect to get health insurance in the next few months, and nearly two-thirds say they don’t think they’ll have to pay a fine, or don’t know if they will, for not having coverage this year.
Employer And Individual Requirements
The Public’s Views On The Eve Of The Employer Requirement
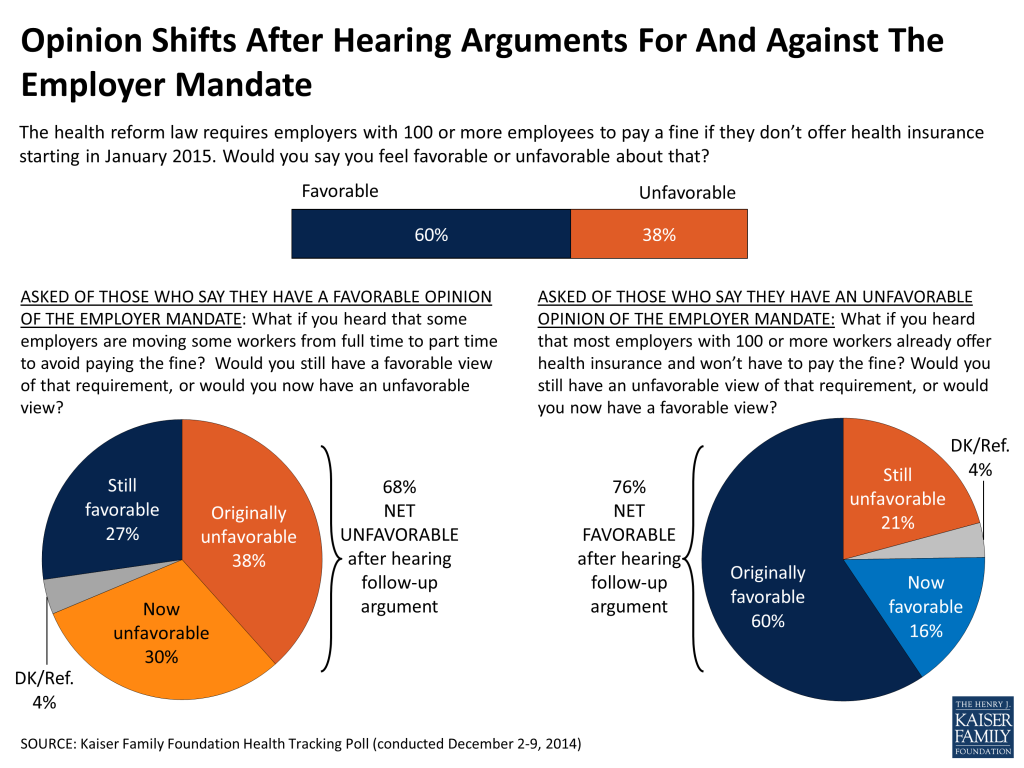
In January, the employer requirement to offer coverage or pay a penalty goes into effect for employers with 100 or more workers. The public generally has a favorable view of the employer requirement with 60 percent favoring the provision and 38 percent with an unfavorable view.
But, opinion on the employer mandate is not fixed and there is some room for movement. After providing those in favor of the employer mandate with the statement that “some employers are moving some workers from full time to part time to avoid paying the fine,” the share with an unfavorable opinion rises from 38 percent to 68 percent.
In contrast, when those with unfavorable views of the employer mandate are provided with the statement that “most employers with 100 or more workers already offer health insurance and won’t have to pay the fine,” the share with a favorable view of the employer requirement rises from 60 percent to 76 percent.
A Focus On The Individual Mandate
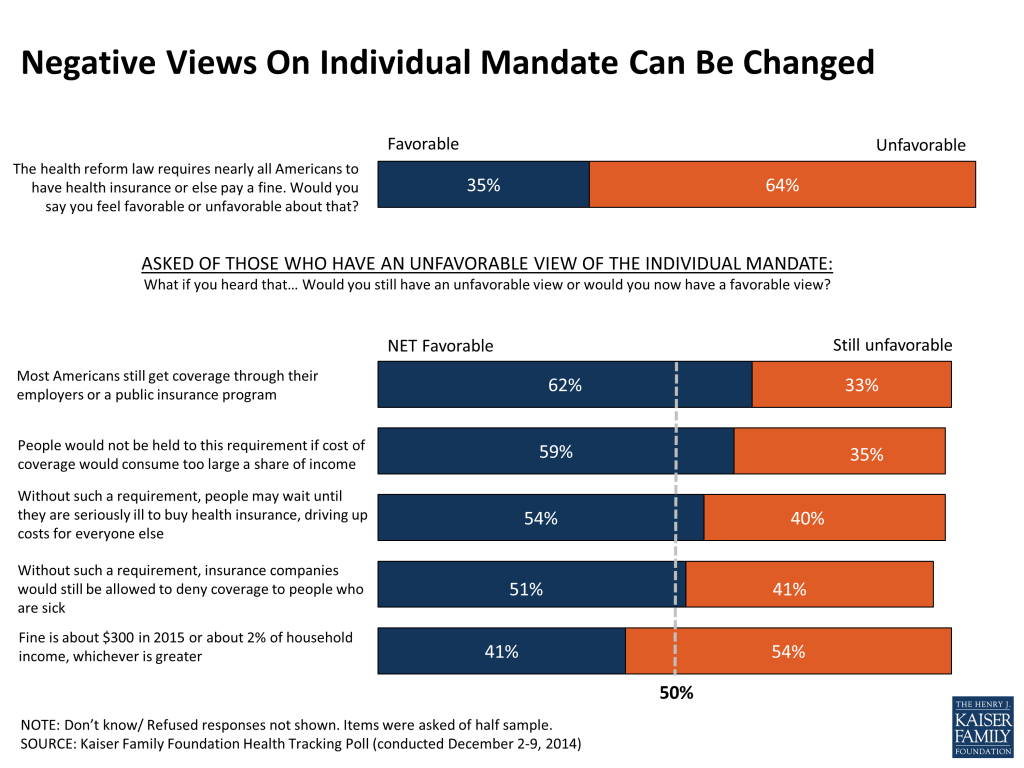
This year marks the first year the individual mandate was in effect, requiring nearly all Americans to have health insurance or else pay a fine. The public generally holds an unfavorable view of this provision (64 percent), but some report a favorable view of it (35 percent). However, like in the case of the employer mandate, opinion on the individual mandate is somewhat malleable. The most persuasive message of those tested to move opponents to supporters is the reminder that “most Americans still get coverage through their employers or a public insurance program and so automatically satisfy the requirement without having to buy any new insurance.” Upon hearing this, about 6 in 10 (62 percent) have a favorable view of the requirement to have coverage. Other statements also move opinion more favorably on the individual mandate and over the 50 percent mark, including mention of the hardship exemptions (59 percent), the fact that without the mandate people may wait to buy insurance until they’re sick resulting in higher costs for others (54 percent), and that without such a requirement insurers may deny coverage to those who are sick (51 percent). Being told the actual amount of the fine is not as influential in terms of changing people’s views and leaves about four in 10 (41 percent) with a favorable view of the provision.
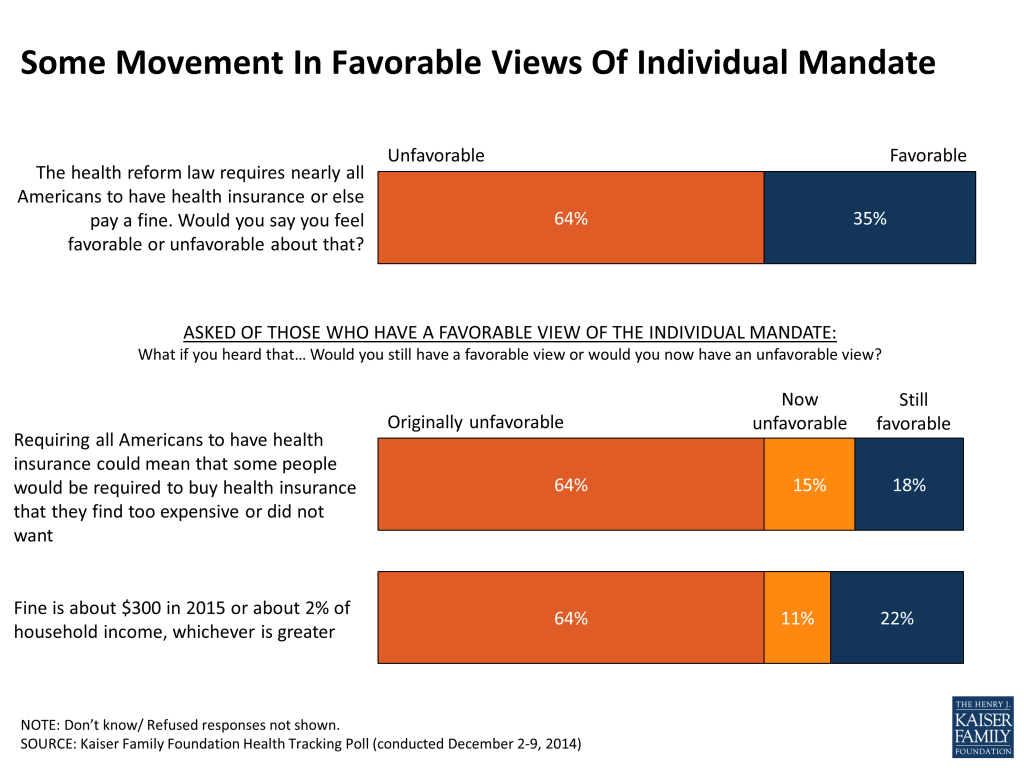
Alternatively, some who originally hold favorable views of the provision can also be moved to view the requirement unfavorably. The share with an unfavorable view of the mandate goes up from 64 percent to three-quarters or more after hearing that “requiring all Americans to have health insurance could mean that some people would be required to buy health insurance that they find too expensive or didn’t want” or after hearing the amount of the fine.
Views Of The ACA One Year Into Coverage Expansions
The ACA In Their Own Words
When asked to say in their own words the main thing the law does, 4 in 10 (41 percent) say it expands access to health care and health insurance, with some naming specific groups such as those with lower incomes (7 percent) and the uninsured (5 percent) that stand to benefit from increased access. Many fewer say the law increases costs or makes insurance too expensive (8 percent), requires people to purchase insurance (7 percent), helps them personally or people generally (7 percent), or that it makes health care more affordable (5 percent).
| FIGURE 4: In Their Own Words | ||
| Can you tell me, in your own words, what do you think the main thing the health care law does? | ||
| Category | Percent Mentioning | Quotes |
| Expands Access | 41% | “Gets everyone insured.”“Makes insurance more available for everyone.”“Provides healthcare.” |
| Increases Costs/ Too Expensive | 8 | “Raised cost of healthcare.”“Raises the premium.”“It costs us money.” |
| Requires people to buy coverage | 7 | “Forced to buy healthcare.”“Requires everybody to get insurance.”“Requires people to be insured.” |
| Helps me/ people | 7 | “I think it helps people that need help.”“Helps me to pay my monthly insurance bill.”“Helps people who are less fortunate.” |
| Made insurance more affordable | 5 | “It creates a way for people to afford health care.”“It allows more affordable health care.”“It helps people afford their own insurance.” |
These responses vary by overall opinion of the law. About 6 in 10 of those with a favorable view of the law (62 percent) say the law expands access, compared to a quarter of those with an unfavorable view (24 percent) who also say the law increases costs (16 percent) or requires people to purchase health coverage (12 percent).
Opinion On The ACA Remains Stable
Nearly 5 years after passage and a year after the coverage expansions under the ACA took effect, overall opinion on the law remains stable with 46 percent of the public reporting an unfavorable view of the law and 41 percent a favorable view. Party identification has long been the factor dividing opinion on the law and the results from this month’s tracking are no different. Eight in 10 Republicans (79 percent) say they have an unfavorable view compared to 7 in 10 Democrats (69 percent) who say they have a favorable view. Independents are more divided with 46 percent favorable and 40 percent unfavorable.

The Public Is Divided On What Next
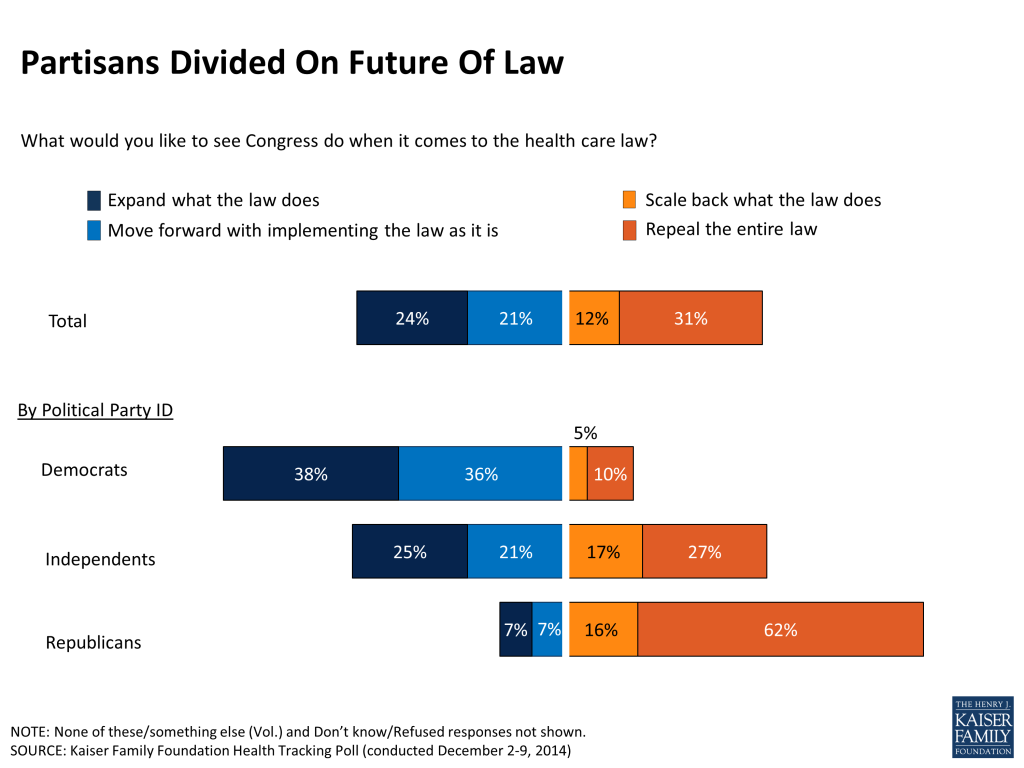
As a Republican-led Congress prepares to get down to work in January, Americans remain split on what Congress should do next with the law. About 3 in 10 (31 percent) say the law should be repealed entirely, 12 percent say they would like Congress to scale back what the law does, 2 in 10 (21 percent) say the law should be implemented as is, and a quarter say the law should be expanded (24 percent). But like opinion of the law overall, opinion is divided by party. About 6 in 10 Republicans (62 percent) share the view that the law should be repealed entirely, while Democrats feel the law should be expanded (38 percent) or continued as is (36 percent). Opinion among independents is more scattered. For example, 25 percent of independents say they want the law expanded and 27 percent say they would prefer the law repealed.
A Closer Look At Awareness And Views Of Specific ACA Provisions
While opinion on the law overall remains negative, large shares of Americans report feeling favorably toward a number of the law’s specific provisions, including the creation of the marketplaces where people can shop for and purchase coverage (78 percent), the financial assistance available to low- and moderate-income people (76 percent), the option for states to expand their Medicaid programs (75 percent), and, as noted earlier, the requirement that employers with 100 or more full time workers offer coverage or pay a penalty (60 percent). And, while Republicans are relatively unified in their dislike of the law overall, at least half say they have favorable opinions of the provisions that create marketplaces (66 percent), provide financial assistance (55 percent), and allow for the expansion of Medicaid (52 percent). Support drops off considerably among Republicans for the employer mandate (34 percent), compared to majorities of Democrats (78 percent) and independents (61 percent).
A clear exception to the favorable views of several of the law’s provisions is in views of the requirement that nearly all Americans have insurance or else pay a fine. Nearly two-thirds (64 percent) say they have an unfavorable opinion of this provision, including 45 percent who say they feel “very unfavorable.”
| FIGURE 7: Many Elements Of ACA Continue To Be Popular Across Parties | ||||
| Percent who say they have a FAVORABLE opinion of each provision of the law | Total Public | Democrat | Independent | Republican |
| Create exchanges/marketplaces | 78% | 91% | 79% | 66% |
| Subsidy assistance to individuals | 76% | 90% | 78% | 55% |
| Medicaid expansion | 75% | 90% | 78% | 52% |
| Employer mandate/penalty for large employers | 60% | 78% | 61% | 34% |
| Individual mandate/penalty | 35% | 53% | 31% | 17% |
| Note: Question wording abbreviated. For full question wording, see survey topline. | ||||
In addition to viewing most of these provisions favorably, many people also recognize that these elements are included in the law. The most widely recognized provision is the individual mandate (77 percent), but still roughly two-thirds are aware that the law requires employers with 100 or more employees to offer coverage or else pay a fine (69 percent), creates marketplaces (67 percent), provides financial assistance to low- and moderate-income individuals (67 percent), and gives states the option to expand the Medicaid program (62 percent).

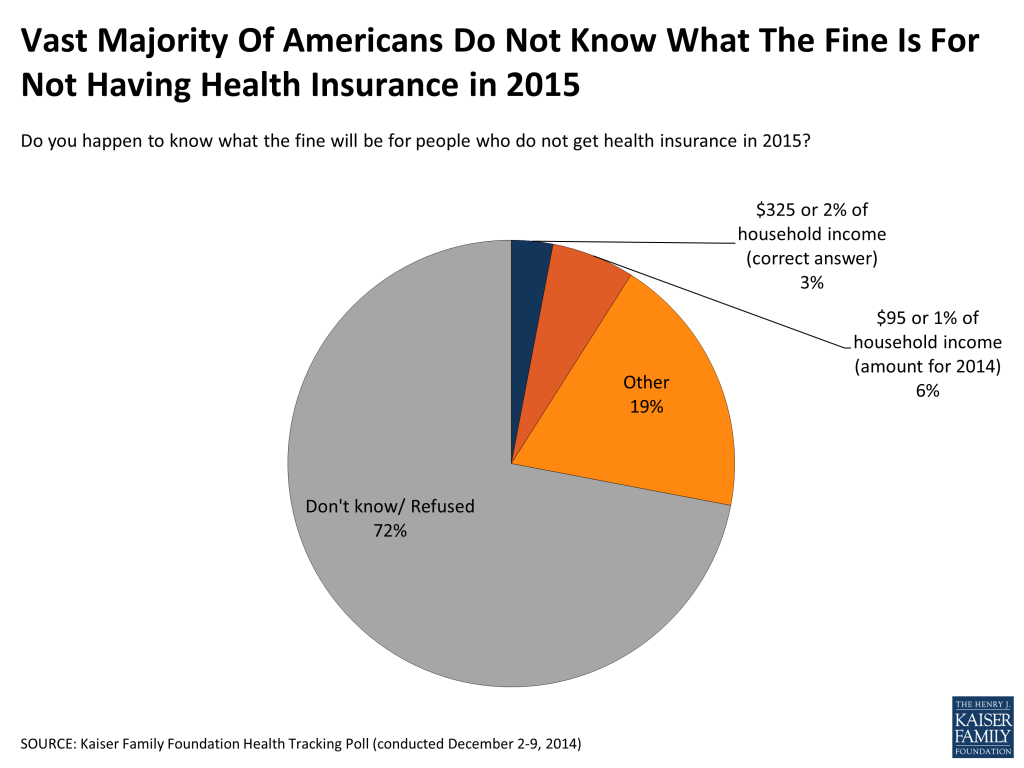
While the public recognizes many of the law’s main provisions, they are less familiar with the law’s practical implications, such as the fine for not having health insurance. Over 7 in 10 (72 percent) say they do not know what the fine will be for people who do not get insurance in 2015, and another 19 percent say some amount other than the 2014 or 2015 actual amounts. Six percent reported the 2014 amount ($95 per person or 1% of household income), and just 3 percent responded with an amount similar to the 2015 fine of $325 per person or 2% of household income.
Americans also continue to hold misperceptions about some aspects of the law. For example, about 4 in 10 say the law allows undocumented immigrants to receive financial help from the government to buy health insurance or that it establishes a government panel to make decisions about end-of-life care for people on Medicare, and another 2 in 10 say they are unsure if the law does these things.
| FIGURE 10: Misperceptions About ACA Continue | |||
| To the best of your knowledge, would you say the health reform law does or does not do each of the following? | CORRECT | INCORRECT | |
| No | Yes | Don’t Know/Refused | |
| Allow undocumented immigrants to receive financial help from the government to buy health insurance | 38% | 43% | 19% |
| Establish a government panel to make decisions about end-of-life care for people on Medicare | 41% | 41% | 19% |
A Look At The Uninsured
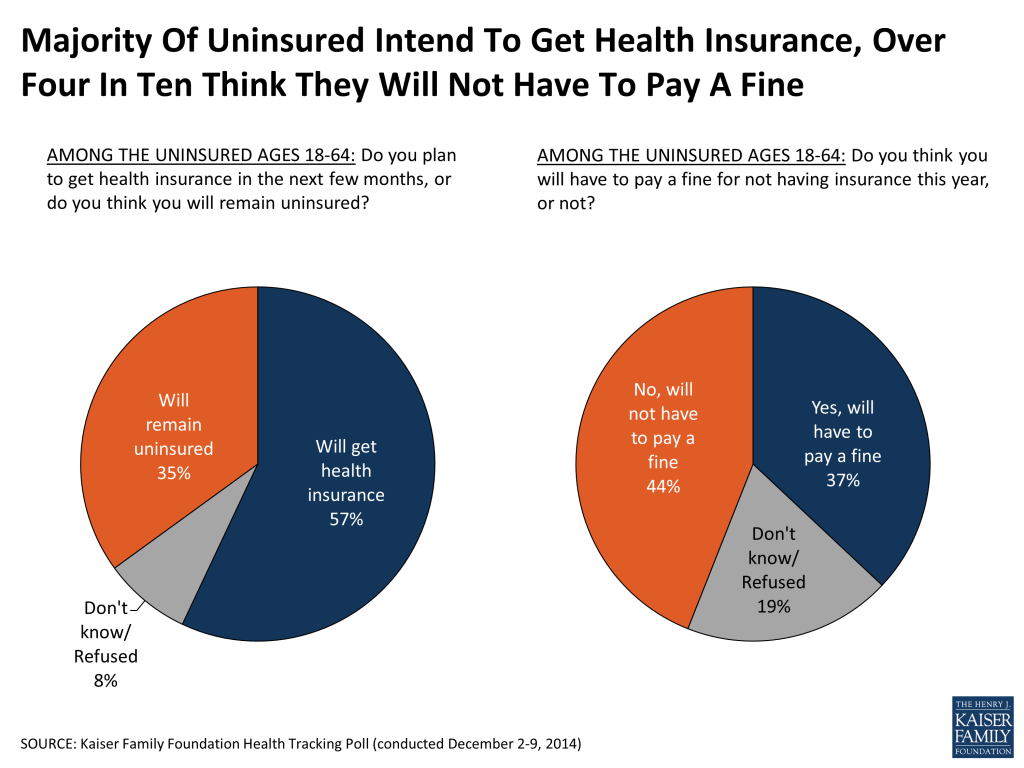
About a month into the ACA’s second open enrollment period, very few of the uninsured (5 percent) are aware that the deadline to enroll is February 15 and 13 percent believe the deadline is the end of 2014. A majority of the uninsured explicitly say they don’t know when the deadline is (57 percent), give a date outside of this year’s open enrollment period (12 percent), or say the deadline already passed or that there is no deadline (12 percent). The vast majority of the uninsured are also unaware of what the fine for not having health insurance will be in 2015. Just 3 percent respond with an amount similar to the 2015 fine, while the rest provide an amount similar to the 2014 fine (7 percent), some other amount (17 percent), or say they don’t know (74 percent).

While many uninsured don’t know the fine amount, a little over a third of the uninsured (37 percent) expect to have to pay a fine for not having coverage this year, while over 4 in 10 say they will not (44 percent) and 19 percent say they don’t know. In fact, many uninsured may be exempt from paying a fine due to financial hardship or other exemptions under the law.
Kaiser Health Tracking Poll: December 2014 Methodology
This Kaiser Health Tracking Poll was designed and analyzed by public opinion researchers at the Kaiser Family Foundation (KFF). The survey was conducted December 2-9, 2014, among a nationally representative random digit dial telephone sample of 1,505 adults ages 18 and older, living in the United States, including Alaska and Hawaii (note: persons without a telephone could not be included in the random selection process). Computer-assisted telephone interviews conducted by landline (750) and cell phone (755, including 421 who had no landline telephone) were carried out in English and Spanish by Princeton Data Source under the direction of Princeton Survey Research Associates International (PSRAI). Both the random digit dial landline and cell phone samples were provided by Survey Sampling International, LLC. For the landline sample, respondents were selected by asking for the youngest adult male or female currently at home based on a random rotation. If no one of that gender was available, interviewers asked to speak with the youngest adult of the opposite gender. For the cell phone sample, interviews were conducted with the adult who answered the phone. KFF paid for all costs associated with the survey.
The combined landline and cell phone sample was weighted to balance the sample demographics to match estimates for the national population using data from the Census Bureau’s 2012 American Community Survey (ACS) on sex, age, education, race, Hispanic origin, nativity (for Hispanics only), and region along with data from the 2010 Census on population density. The sample was also weighted to match current patterns of telephone use using data from the July-December 2013 National Health Interview Survey. The weight takes into account the fact that respondents with both a landline and cell phone have a higher probability of selection in the combined sample and also adjusts for the household size for the landline sample. All statistical tests of significance account for the effect of weighting.
The margin of sampling error including the design effect for the full sample is plus or minus 3 percentage points. Numbers of respondents and margin of sampling error for key subgroups are shown in the table below. For results based on other subgroups, the margin of sampling error may be higher. Sample sizes and margin of sampling errors for other subgroups are available by request. Note that sampling error is only one of many potential sources of error in this or any other public opinion poll. Kaiser Family Foundation public opinion and survey research is a charter member of the Transparency Initiative of the American Association for Public Opinion Research.
| Group | N (unweighted) | M.O.S.E. |
| Total | 1,505 | ±3 percentage points |
| Party Identification | ||
| Democrats | 467 | ±5 percentage points |
| Republicans | 378 | ±6 percentage points |
| Independents | 464 | ±5 percentage points |
| Insurance Status | ||
| Uninsured, ages 18-64 | 131 | ±9 percentage points |
| Insured, ages 18-64 | 963 | ±4 percentage points |
| Employer Mandate | ||
| Favorable opinion | 855 | ±4 percentage points |
| Unfavorable opinion | 611 | ±5 percentage points |
| Half Samples | ||
| Half Sample A | 753 | ±4 percentage points |
| Half Sample B | 752 | ±4 percentage points |