
Medicaid Enrollment Snapshot: December 2013
Issue Brief
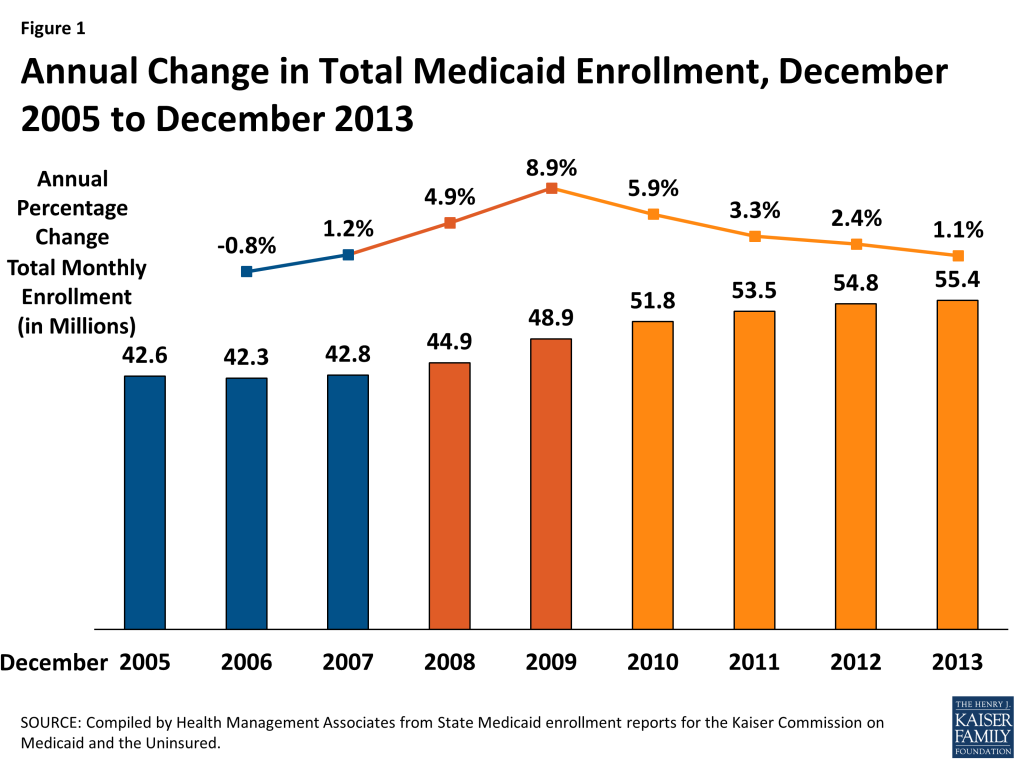
As of December 2013, nearly 55.4 million individuals were enrolled in Medicaid. Compared to one year earlier, enrollment grew by 1.1 percent – the slowest rate since before the Great Recession. (Figure 1) An additional 585,000 individuals were enrolled in Medicaid programs across the country in December 2013 compared to one year earlier, a fraction of the increases seen at the height of the recession,1 when 4 million additional individuals enrolled over a 12 month period between December 2008 and 2009. This is also the monthly period immediately before the January 2014 implementation of the adult Medicaid expansion.
This report focuses on changes in monthly Medicaid enrollment between December 2012 and December 2013. (Appendix Table A-1, which also includes data from our separate CHIP report) This is a long standing report series that collects monthly Medicaid enrollment data for December (and June, not reported here) going back to 2000. While the most recent data included in this report predate preliminary data released by CMS that show the early effects of full implementation of the ACA, this report series is an important source of historical trend data that provides the necessary context to understand these new sources of Medicaid enrollment data. In addition to providing historical trends (Appendix Tables A2-A3), these data also provide more detail about enrollment, such as the distribution of the enrollment among children, adults, or the elderly and people with disabilities, as well as Medicaid enrollment trends for each of these groups (Appendix Tables A4-A6.) While not directly comparable to the enrollment data released by CMS (see methodology for more details) – this report provides helpful context, additional detail and historical trend information not available in the CMS data.
During the period from December 2012 to December 2013, there were a number of factors likely influencing Medicaid enrollment in different directions, most notably:
Continued improvement in economic conditions resulted in slower Medicaid enrollment growth. Medicaid is a countercyclical program; when economic conditions worsen, people lose their jobs, their income declines and they become eligible for Medicaid. The reverse is also true; as economic conditions improve, unemployment declines, income rises and people no longer qualify for Medicaid coverage. During 2013, economic conditions continued to improve, particularly in comparison to the earlier recessionary periods, applying downward pressure on Medicaid enrollment growth.
Early expansion of Medicaid in some states, as well as successful outreach and enrollment efforts for new Marketplaces pushed enrollment up in some states. Implementation of the major coverage provisions of the ACA had begun but had not been completed. Broad outreach efforts to encourage individuals to apply for coverage (through Medicaid, the Marketplaces, or CHIP) were underway by December 2013, and in the past such efforts have put upward pressure on Medicaid enrollment. While the Medicaid expansion was not set to begin until January 2014 (just after this data collection period) states such as California and Colorado, which had elected to expand coverage to childless adults and parents ahead of time saw increased enrollment in these programs, boosting Medicaid enrollment totals. Changes related to the Medicaid coverage expansion in other states and other enrollment effects of the ACA more broadly would start until January 2014, the month following this data.
Problems implementing new enrollment systems for the Federally Facilitated Marketplace (FFM) and State Based Marketplaces (SBM) put downward pressure on Medicaid enrollment growth. States and the Federal Government faced IT systems challenges, particularly early on in the open enrollment period for the Marketplace, which may have applied some downward pressure on Medicaid enrollment during this period. States that relied on FFMs had significant problems with “account transfers” from the FFM to Medicaid. Many individuals were assessed or determined eligible for Medicaid through the FFMs, but because of system problems, accounts could not be easily transferred to effectuate enrollment. There were also some SBMs that faced similar issues. Although problems persist, some progress in resolving these issues was made after the timeframe for this report.
Enrollment Trends across states
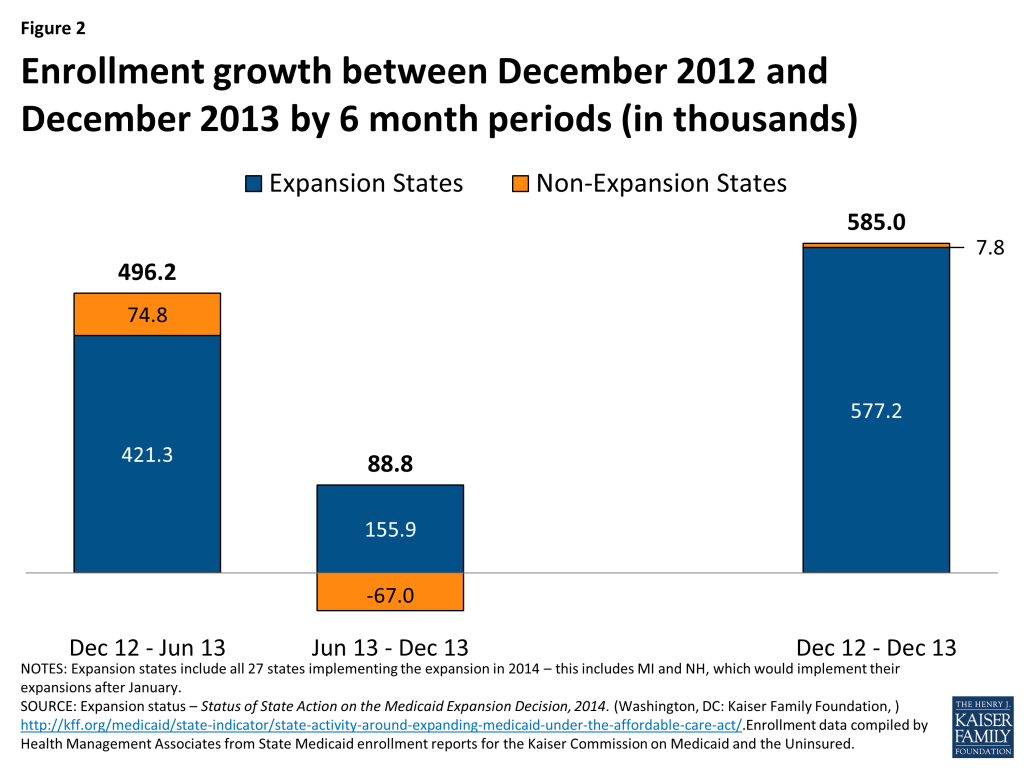
(Appendix Tables A1-A3)Medicaid enrollment increased slightly to 55.4 million as 585,000 more individuals (on net) were enrolled in Medicaid in December 2013 compared to December 2012. Enrollment growth over the year was lower than previous trends but slowed even further in the second half of this 12 month period (June 2013 to December 2013) as the number of people enrolled increased by only 88,800 compared to an increase of 496,200 enrollees between December 2012 and June 2013. (Figure 2) Nearly all states saw slower enrollment growth between June 2013 and December 2013 than in the prior six month period, but the decline was particularly notable in states not expanding their Medicaid programs; virtually all of these states were also coordinating with the FFM and many faced the IT systems issues noted above.
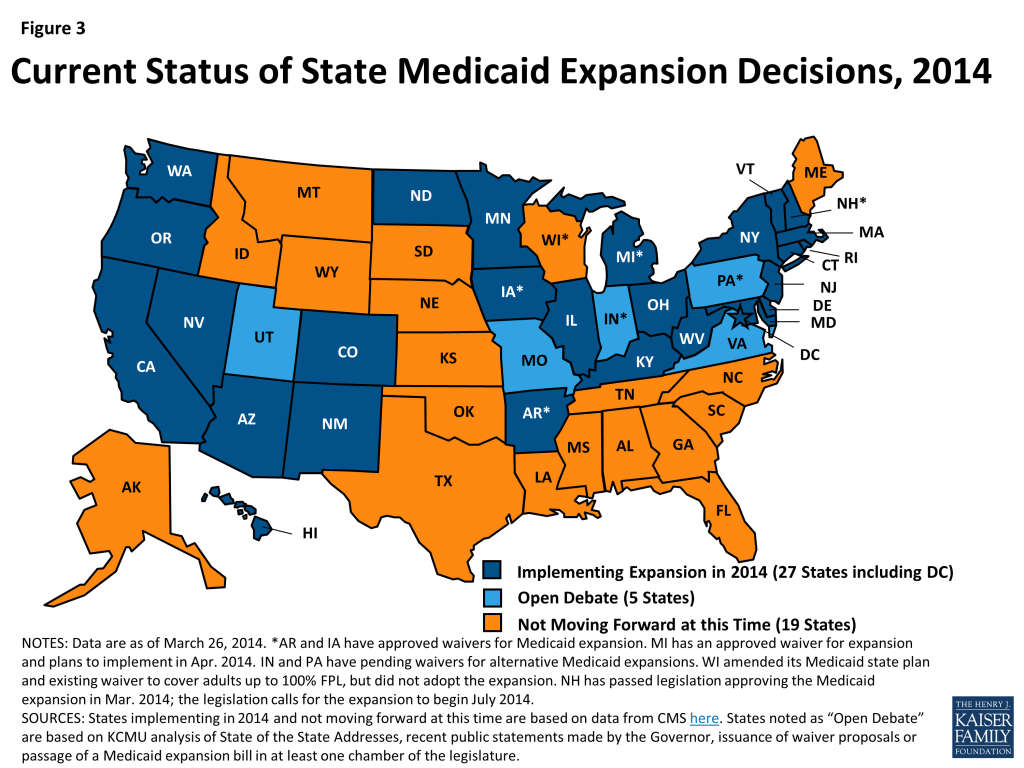
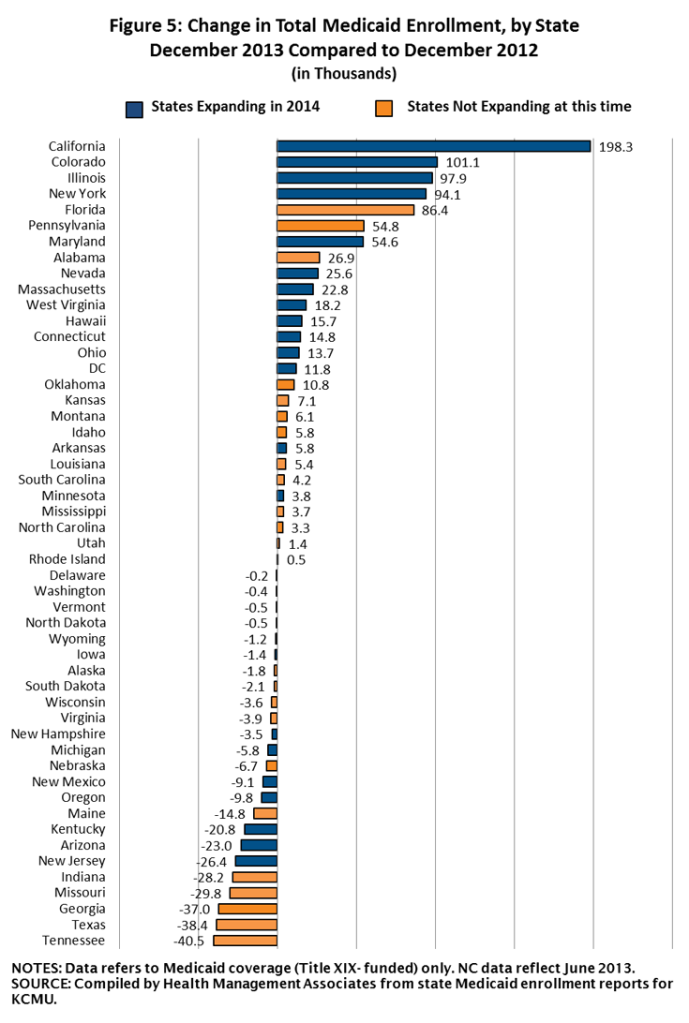
To date, 27 states are implementing the expansion in 2014 (Figure 3). All of these states except Michigan and New Hampshire started enrolling people in the new eligibility group in January 2014; Michigan began enrolling individuals in the new eligibility group in April 2014 and New Hampshire, which passed legislation to adopt the Medicaid expansion in March 2014, plans to start enrollment for the new eligibility group in July 2014. The remaining 24 states were not implementing the expansion in 2014 although debate about the expansion was on-going in 5 states at the time of this report.2
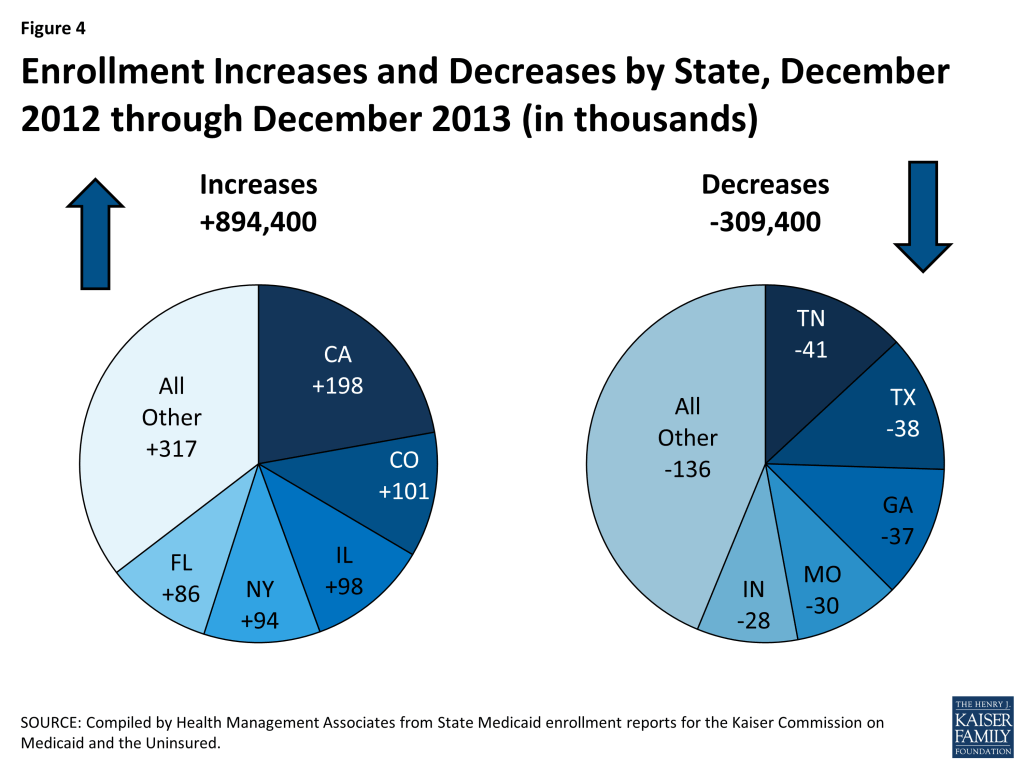
In contrast to previous releases of this report, nearly half of states (24) reported enrollment declines during this period as 309,400 fewer individuals were enrolled in these states in December 2013 compared to one year earlier. However, in 27 states enrollment grew during this period as 894,400 more individuals were enrolled in Medicaid in December 2013 compared to one year earlier. (Figures 4 and 5)
Enrollment Growth Across Eligibility groups
(Appendix Tables A1, A4-A6)
Enrollment growth between December 2012 and December 2013 was driven by enrollment growth among adults and children as opposed to the elderly and people with disabilities. (Figure 6)
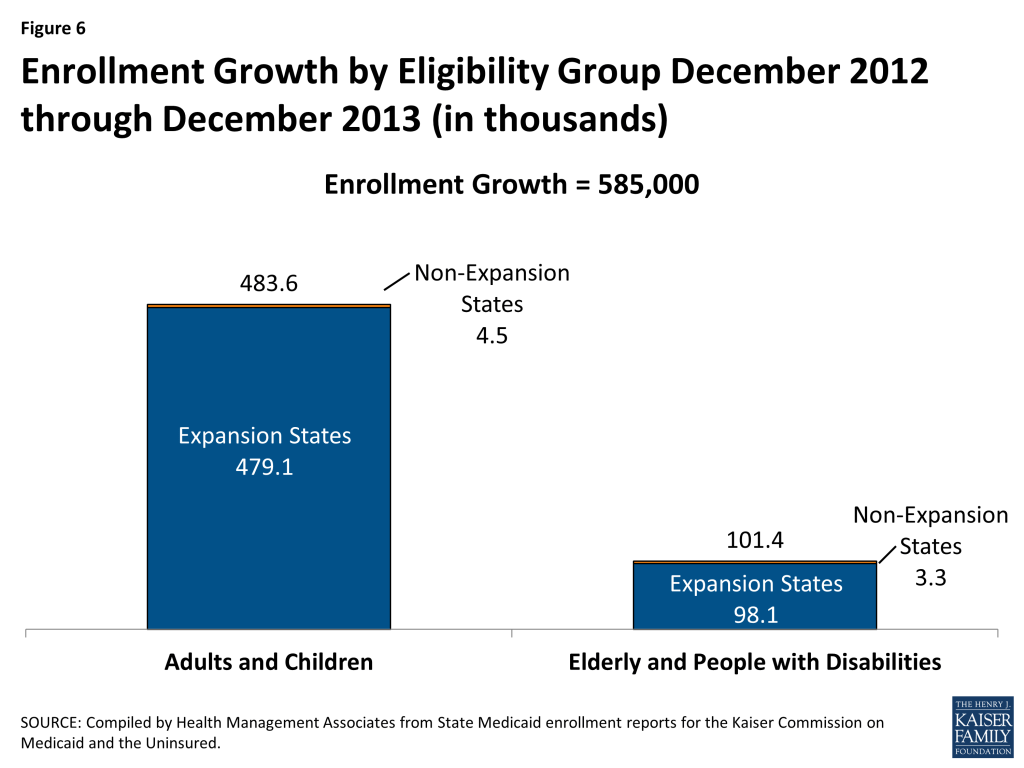
On net, enrollment of adults and children increased by 483,600 between December 2012 and December 2013. This reflects a net increase of 577,900 adults during this period, concentrated in states expanding Medicaid in 2014. States that were driving increases include:
- California‘s increase among adults enrolled in Medicaid was driven by continued growth in its Low Income Health Program (LIHP.) Enacted as part of the state’s Bridge to Reform waiver, LIHP allowed counties to expand eligibility to adults with incomes up to 133 percent of the Federal Poverty Level (FPL), starting in July 2011. California’ LIHP enrollment increased quickly. By December 2013, total enrollment in the program reached 704,016. (These individuals were transitioned by the state in January 2014 to the new ACA Medicaid expansion group).3
- Colorado implemented a Section 1115 waiver program to cover childless adults with incomes below 10% FPL in early 2012 with an enrollment cap of 10,000, which was reached before the end of the first year. After deciding to implement the Medicaid expansion, the state gradually raised the enrollment cap starting in April 2013.4 Enrollment increased by over 7,000 between December 2012 and December 2013. (The state automatically transitioned these 17,000 individuals along with the roughly 9,000 still on the waiting list over to the new Medicaid expansion group in January 2014).5
- In late 2012, Illinois obtained a Section 1115 demonstration waiver, “CountyCare,” which provided Medicaid coverage to adults age 19-64 with incomes below 133% FPL who lived in Cook County, Illinois (which encompasses the city of Chicago and the surrounding area). The demonstration was designed to help the state and Cook County Health and Hospitals System build capacity and experience to support implementation of the Medicaid expansion in 2014 and get a jump-start on enrollment. Enrollment for the program began in February 2013; by December 2013, enrollment had reached nearly 80,000.6
- New York, a state that had expanded coverage to childless adults well ahead of the ACA, saw across the board enrollment growth, including its TANF-related groups and its expansion to safety-net adults.7
- Florida and Pennsylvania, both states not expanding in 2014 and coordinating with the FFM, saw notable enrollment growth as well. Florida saw across the board enrollment growth throughout the year, particularly among children covered under Medicaid. Pennsylvania enrollment appears to show notable growth among adults during this period, nearly all of which occurred in the second half of the year. While some of this growth is driven by an increase among some TANF-related adults, changes in reporting also occurred during this period that may result in including groups normally excluded from this report, making it appear there is higher growth than there would be otherwise.8
In contrast to adults, Medicaid enrollment of children actually saw a small decline on net during this period as 26 states saw declines in Medicaid enrollment of children (most notably in Illinois, Texas, Michigan, Georgia, and Indiana) while 25 states saw increases (most notably in Colorado, Florida, New York, Alabama and Maryland.) States that are implementing the Medicaid expansion in 2014 experienced relatively flat growth among children whereas states not implementing the Medicaid expansion in 2014 saw a more substantial decline in enrollment of children in Medicaid. Some of these children may have transitioned to CHIP as family income increased; CHIP enrollment grew during this same period by 175,020.9 The decline in Medicaid enrollment of children was concentrated in the second half of the period (June 2013 to December 2013) and in states not expanding Medicaid in 2014 nearly all of which opted to coordinate with the FFM; this may be a reflection of the initial difficulties states and the federal government faced with IT systems and file transfers. A few states, most notably California and Colorado, were in the process of transitioning children from their stand-alone CHIP programs to Medicaid during this period. These children are still funded through Title XXI and therefore are not included in the counts reported here; they are included in the counts reported in a separate companion report on CHIP enrollment.
Enrollment increases among the elderly and people with disabilities contributed to total enrollment growth during this period, but to a lesser extent than in recent years. Medicaid enrollment among the elderly and people with disabilities grew very little in Medicaid programs across the country during this period, as 101,400 more aged and disabled beneficiaries were enrolled in December 2013 than in December 2012 (0.7% growth compared to enrollment growth of 2.7% in the prior annual period.) Overall, enrollment grew in all but 12 states for this group; the largest declines occurred in Pennsylvania, California, Georgia, Tennessee, and Kentucky largely among disabled groups. Over two-thirds of states saw slower growth from June 2013 to December 2013 than in the previous six month period.
CONCLUSION
During 2013, Medicaid enrollment growth continued to slow to levels not seen since before the Great Recession. Changes in Medicaid enrollment growth during this period were likely influenced by a number of factors, including a continually improving economy (applying downward pressure on Medicaid enrollment) but also by the early stages of implementation of the major coverage provisions of the ACA (which likely applied both upward pressure on Medicaid enrollment from increased outreach as well as enrollment growth among early expansion states and downward pressure from IT systems issues both states and the federal government faced in the early part of the Marketplace open enrollment period.) Medicaid enrollment growth seen during this period was largely driven by increased enrollment of adults in states that are expanding Medicaid in 2014.
However, after a slow rate of growth in 2013, Medicaid enrollment appears to have increased substantially during the beginning of 2014; preliminary data from CMS shows that combined Medicaid and CHIP enrollment grew by at least 4.8 million or 8.2% during the open enrollment period. According to this preliminary data, nearly all of the enrollment growth during this period occurred in states that implemented the Medicaid expansion; these states experienced substantially higher growth in Medicaid enrollment than states that have not expanded (12.9% vs. 2.6%).10 CMS, which is collecting this data as part of efforts to collect a broad set of eligibility and enrollment performance indicators to inform program management and oversight, has indicated that more detailed information on which eligibility groups are driving enrollment in each state is anticipated to be released sometime over the summer.
Methodology
This report is based on data provided by each of the 50 states and the District of Columbia. Health Management Associates (HMA) asked each state to provide the internal reports they use to track enrollment in the program. Each state’s report included total enrollment and enrollment in certain eligibility categories. Report categories are not standardized across states. Where it was possible to do so, the state enrollment data were grouped to further examine trends in specific Medicaid eligibility categories. The data tables and graphs in this document present “point-in-time” monthly Medicaid enrollment counts for the months of June and December of each year from 2000 through 2013 rather than “ever-enrolled” counts published by CMS. The data were provided to HMA by each state Medicaid program in March and April 2014. Historical data may change over time as states change how they report their enrollment data as well as if a state provides revised data for previous time periods.
Net Change. The data collected for this report are net changes in enrollment across the program and within select eligibility groups, taking into account the net impact of individuals enrolling and disenrolling from the Medicaid program. Because these data are not individual level data and states do not make a distinction between enrollment among current beneficiaries and new beneficiaries, it is not possible to determine from this data the number of individuals that left the program and the number that newly enrolled in a given time period.
Definitions of Medicaid Enrollment. The counts provided by the states reflect all persons with Medicaid eligibility for each month. Every person with Medicaid coverage was counted as an enrollee with the exception of family planning waiver and pharmacy plus waiver enrollees. No adjustment was made for other persons who are enrolled in Medicaid categories with less than full coverage. Therefore the enrollment figures reported here include a small number of individuals that are covered by Medicaid only for emergency services and persons with Medicare and Medicaid dual eligibility enrolled as either Specified Low-Income Medicare Beneficiaries (SLMBs), Qualified Individuals (QIs), and as Qualified Medicare Beneficiaries (QMBs). To the extent possible, state-only health coverage programs and Medicaid expansion CHIP enrollees not funded by Medicaid are excluded.
Non-Disabled Children and Non-Disabled Adults. To remain consistent with other enrollment reports, such as the Medicaid Statistical Information System (MSIS), this report groups disabled children in the elderly and disabled category. However, the detail provided in enrollment reports from states varies in the level of detail available. Most states are able to provide data that breaks out the number of non-disabled children either within the same report or through a separate report. In 2 states (IL and WI) some estimation is required due to differences in report totals to determine the number of non-disabled children. For CA, data available for 2012 onward allows for breakouts of children from adults in each eligibility category reported; this data is used to estimate such breaks in data from 2011 and earlier. Additionally, there are a relatively small number of enrollees whose eligibility pathway was not identified. These individuals were included in the non-elderly non-disabled adult counts unless clearly identified as children.
State Variation in Enrollment Reports. Common variations across the states include how states count “spend-down” enrollees and whether states adjust for “retroactive” eligibiles. Some states include in their enrollment counts persons with excess income that qualify to “spend-down” to Medicaid eligibility whether or not they have incurred sufficient medical costs to become eligible for Medicaid in that month. Other states only include those individuals that have met their “spend-down” requirement. Since a primary goal of this report is to identify trends, these variations have been deemed acceptable given that the state does not change its methodology over time. Data for some states include “retroactive” eligibles, i.e., individuals whose Medicaid eligibility is established at a later date, but whose coverage is retroactive to a prior point in time. Effort was made to use reports that reflect retroactive eligibility where they exist. Yet, it is possible that additional changes occurred after the counts provided for use here.
Differences between this report and preliminary data released by CMS of monthly enrollment trends. Starting in April 2014, CMS began publishing monthly reports that include total Medicaid and CHIP enrollment as part of an initiative to provide data on a broad set of Medicaid and CHIP eligibility and enrollment performance indicators to inform program management and oversight.11 However, this data resource, while providing some of the most timely Medicaid enrollment data in the program’s history, is still in its early stages of development. Notable differences between that data and the data provided here include:
- Definition of Medicaid beneficiary. CMS limits the definition of Medicaid beneficiary to those receiving comprehensive benefits and therefore excludes populations such as 1) partial-benefit Duals (QMBs, SLMBs, QIs), 2) 1115 waivers providing limited benefits, 3) those receiving emergency services through Medicaid due to immigration status issues. The data provided in this report includes all of these groups.
- Inclusion of CHIP. The CMS report combines enrollment figures for Medicaid (Title XIX) and CHIP (Title XXI.) We report these two groups separately; Medicaid enrollment (Title XIX) is included in this report and CHIP enrollment (Title XXI) is included in a separate report https://modern.kff.org/medicaid/issue-brief/chip-enrollment-snapshot-december-2013.
- Reporting Method. CMS asks states to submit their enrollment data through an online portal each month, revising data reported for the previous month only. As discussed above, this report is compiled from off the shelf reports states submit to Health Management Associates for June and December of each year. States are asked to submit updated data as far back as they desire each time the data are collected.
- Retroactive Eligibles. Medicaid allows for up to three months of retroactive eligibility. Because of the timeliness of the data collection process, the CMS data do not generally reflect retroactive enrollment. For this report, we ask states to include retroactive enrollment whenever possible.
- Trend. This data sources goes back to 2000, showing enrollment trends in monthly enrollment for December and June between 2000 and 2014. The CMS data captures monthly enrollment before open enrollment for the Marketplaces began (average of enrollment between June and September 2013) and enrollment for January, February and March 2014.
- Enrollment by Eligibility Group. Data reported by CMS shows total enrollment across Medicaid and CHIP, but cannot, at this point in time, show enrollment by eligibility group (children, adults, aged and disabled.) This however, is something that is expected to change in the near future.
Tables
| Table A-1: December 2013 Snapshot of Medicaid and CHIP enrollment | ||||||
| State | Children in Medicaid | Adults | Elderly and People with Disabilities | Medicaid Total | CHIP | Total |
| Alabama | 483,945 | 51,733 | 320,853 | 856,531 | 84,431 | 941,815 |
| Alaska | 62,509 | 19,438 | 25,198 | 107,145 | 10,199 | 117,933 |
| Arizona | 619,070 | 360,811 | 265,403 | 1,245,284 | 46,761 | 1,288,495 |
| Arkansas | 299,803 | 42,932 | 211,134 | 553,869 | 93,173 | 630,196 |
| California | 3,634,161 | 2,771,442 | 1,931,403 | 8,337,006 | 1,324,146 | 9,590,645 |
| Colorado | 435,891 | 194,759 | 142,304 | 772,954 | 88,513 | 862,549 |
| Connecticut | 290,713 | 237,476 | 90,510 | 618,699 | 12,874 | 631,274 |
| DC | 73,279 | 84,322 | 56,247 | 213,848 | 6,285 | 220,556 |
| Delaware | 86,704 | 84,642 | 39,779 | 211,125 | 6,843 | 217,801 |
| Florida | 1,706,485 | 566,255 | 1,067,841 | 3,340,581 | 246,273 | 3,603,561 |
| Georgia | 877,947 | 181,525 | 449,560 | 1,509,032 | 222,373 | 1,736,905 |
| Hawaii | 118,586 | 108,120 | 50,946 | 277,652 | 29,784 | 306,542 |
| Idaho | 137,805 | 25,151 | 71,654 | 234,610 | 26,166 | 258,950 |
| Illinois | 1,521,722 | 643,308 | 524,995 | 2,690,025 | 251,257 | 2,934,163 |
| Indiana | 548,017 | 163,036 | 279,708 | 990,761 | 84,541 | 1,073,116 |
| Iowa | 220,963 | 107,460 | 133,393 | 461,816 | 64,493 | 525,340 |
| Kansas | 209,915 | 37,923 | 102,464 | 350,302 | 56,101 | 405,965 |
| Kentucky | 382,994 | 97,012 | 302,772 | 782,778 | 64,844 | 847,848 |
| Louisiana | 561,925 | 161,978 | 331,219 | 1,055,122 | 121,699 | 1,176,564 |
| Maine | 112,335 | 77,286 | 77,316 | 266,937 | 12,009 | 279,318 |
| Maryland | 458,354 | 305,701 | 202,271 | 966,326 | 98,552 | 1,063,575 |
| Massachusetts | 412,956 | 437,128 | 426,251 | 1,276,335 | 121,775 | 1,396,037 |
| Michigan | 892,494 | 504,933 | 495,167 | 1,892,594 | 49,549 | 1,939,665 |
| Minnesota | 389,676 | 287,640 | 195,675 | 872,991 | 1,658 | 874,883 |
| Mississippi | 332,762 | 51,839 | 240,782 | 625,383 | 69,609 | 695,324 |
| Missouri*** | 445,646 | 97,876 | 232,224 | 775,746 | 69,854 | 845,600 |
| Montana | 68,054 | 11,448 | 36,786 | 116,288 | 31,844 | 148,107 |
| Nebraska | 118,560 | 27,497 | 55,132 | 201,189 | 31,939 | 233,321 |
| Nevada | 206,894 | 45,261 | 79,168 | 331,323 | 22,116 | 352,589 |
| New Hampshire | 88,585 | 14,187 | 32,545 | 135,317 | 12,911 | 147,932 |
| New Jersey | 558,385 | 112,909 | 288,379 | 959,673 | 172,764 | 1,129,849 |
| New Mexico | 309,021 | 93,639 | 98,403 | 501,063 | 7,448 | 508,825 |
| New York | 1,839,093 | 2,064,290 | 1,258,003 | 5,161,386 | 460,723 | 5,626,023 |
| North Carolina* | 869,242 | 168,498 | 463,520 | 1,501,260 | 190,681 | 1,699,903 |
| North Dakota*** | 35,858 | 9,737 | 18,814 | 64,409 | 4,956 | 69,365 |
| Ohio | 978,409 | 558,312 | 539,891 | 2,076,612 | 151,195 | 2,227,864 |
| Oklahoma | 420,291 | 84,155 | 175,270 | 679,716 | 73,867 | 753,233 |
| Oregon | 263,689 | 151,688 | 143,048 | 558,425 | 79,899 | 635,112 |
| Pennsylvania** | 993,004 | 317,795 | 827,616 | 2,138,416 | 184,501 | 2,322,189 |
| Rhode Island | 68,819 | 46,075 | 59,904 | 174,798 | 15,647 | 189,977 |
| South Carolina | 429,494 | 114,223 | 233,462 | 777,179 | 66,818 | 844,564 |
| South Dakota | 61,000 | 13,314 | 26,035 | 100,349 | 13,712 | 113,463 |
| Tennessee | 620,370 | 290,891 | 362,146 | 1,273,407 | 84,349 | 1,356,284 |
| Texas | 2,573,257 | 245,404 | 795,863 | 3,614,524 | 596,651 | 4,256,160 |
| Utah | 161,657 | 41,543 | 80,203 | 283,403 | 33,877 | 318,885 |
| Vermont | 54,172 | 47,053 | 40,108 | 141,333 | 4,042 | 145,219 |
| Virginia | 468,169 | 107,330 | 267,490 | 842,989 | 113,216 | 957,110 |
| Washington | 666,552 | 169,251 | 296,530 | 1,132,333 | 28,293 | 1,164,459 |
| West Virginia | 176,391 | 41,866 | 132,121 | 350,378 | 25,011 | 375,057 |
| Wisconsin | 466,099 | 250,361 | 228,905 | 945,365 | 91,412 | 1,037,425 |
| Wyoming | 42,096 | 8,008 | 15,887 | 65,991 | 5,908 | 71,977 |
| Total | 27,853,818 | 12,736,460 | 14,822,298 | 55,412,577 | 5,767,542 | 61,149,511 |
| NOTES: Data refers to Medicaid coverage (Title XIX- funded) only for all groups except CHIP; CHIP data reported her are collected in a separate report focused on Title XXI-funded coverage. *NC data for Medicaid and Medicaid Expansion CHIP reflect June 2013. **PA included a new category in December 2013 which appears to contain some Title XXI –funded enrollees as well as some family planning enrollees, both of which are excluded from other states. ***CHIP enrollment data for MO and ND are from June 2013.SOURCE: Compiled by Health Management Associates from state Medicaid and CHIP enrollment reports for KCMU. | ||||||
| Table A-2: Total Medicaid Enrollment by State (Monthly Enrollment in Thousands), December 2006 – 2013 | ||||||||
State | 2006 | 2007 | 2008 | 2009 | 2010 | 2011 | 2012 | 2013 |
| Alabama | 665.6 | 673.1 | 710.8 | 748.6 | 806.1 | 839.5 | 829.7 | 856.5 |
| Alaska | 81.1 | 77.7 | 80.7 | 94.4 | 102.2 | 108.1 | 108.9 | 107.1 |
| Arizona | 970.9 | 1,023.4 | 1,101.1 | 1,345.0 | 1,350.5 | 1,350.7 | 1,268.3 | 1,245.3 |
| Arkansas | 489.7 | 504.2 | 495.7 | 526.4 | 534.6 | 543.2 | 548.1 | 553.9 |
| California | 6,360.6 | 6,444.4 | 6,653.8 | 7,039.6 | 7,289.6 | 7,633.1 | 8,138.7 | 8,337.0 |
| Colorado | 390.5 | 380.7 | 429.8 | 494.7 | 556.1 | 620.8 | 671.9 | 773.0 |
| Connecticut | 386.8 | 406.2 | 428.7 | 456.0 | 550.9 | 574.2 | 603.9 | 618.7 |
| DC | 125.9 | 125.6 | 130.1 | 140.4 | 185.3 | 194.5 | 202.1 | 213.8 |
| Delaware | 142.8 | 149.0 | 158.0 | 174.4 | 193.4 | 205.5 | 211.3 | 211.1 |
| Florida | 2,104.4 | 2,082.6 | 2,304.6 | 2,676.9 | 2,917.5 | 3,070.7 | 3,254.2 | 3,340.6 |
| Georgia | 1,277.1 | 1,252.5 | 1,330.1 | 1,447.3 | 1,512.8 | 1,508.9 | 1,546.0 | 1,509.0 |
| Hawaii | 182.3 | 183.6 | 202.6 | 225.7 | 241.7 | 257.7 | 262.0 | 277.7 |
| Idaho | 171.0 | 163.7 | 168.7 | 194.9 | 214.9 | 217.7 | 228.8 | 234.6 |
| Illinois | 1,873.0 | 1,992.4 | 2,098.8 | 2,272.5 | 2,510.5 | 2,606.3 | 2,592.1 | 2,690.0 |
| Indiana | 781.6 | 795.8 | 881.7 | 941.5 | 968.9 | 987.0 | 1,019.0 | 990.8 |
| Iowa | 308.2 | 324.2 | 353.7 | 392.5 | 418.4 | 440.9 | 463.2 | 461.8 |
| Kansas | 245.0 | 252.0 | 257.2 | 275.5 | 289.7 | 337.3 | 343.2 | 350.3 |
| Kentucky | 687.4 | 702.3 | 724.5 | 763.6 | 786.6 | 796.5 | 803.6 | 782.8 |
| Louisiana | 865.7 | 847.5 | 877.6 | 928.9 | 974.2 | 1,024.8 | 1,049.7 | 1,055.1 |
| Maine | 258.2 | 259.2 | 253.2 | 268.6 | 282.7 | 287.8 | 281.8 | 266.9 |
| Maryland | 523.7 | 536.8 | 595.5 | 713.8 | 811.8 | 870.6 | 911.8 | 966.3 |
| Massachusetts | 1,007.0 | 1,031.4 | 1,049.4 | 1,129.4 | 1,185.6 | 1,190.3 | 1,253.5 | 1,276.3 |
| Michigan | 1,499.0 | 1,496.4 | 1,609.7 | 1,751.6 | 1,949.4 | 1,901.3 | 1,898.4 | 1,892.6 |
| Minnesota | 581.9 | 590.3 | 615.7 | 689.8 | 733.9 | 860.6 | 869.2 | 873.0 |
| Mississippi | 520.8 | 521.1 | 541.1 | 595.9 | 610.3 | 619.9 | 621.7 | 625.4 |
| Missouri*** | 725.3 | 721.3 | 755.2 | 810.3 | 824.1 | 818.2 | 805.6 | 775.7 |
| Montana | 82.0 | 89.5 | 91.2 | 94.7 | 104.9 | 105.9 | 110.1 | 116.3 |
| Nebraska | 176.0 | 174.6 | 178.8 | 200.0 | 206.5 | 205.9 | 207.9 | 201.2 |
| Nevada | 166.5 | 180.0 | 195.0 | 238.6 | 280.3 | 297.2 | 305.7 | 331.3 |
| New Hampshire | 107.9 | 110.4 | 117.1 | 128.1 | 132.0 | 133.7 | 138.8 | 135.3 |
| New Jersey | 752.0 | 766.5 | 796.3 | 840.6 | 872.3 | 969.3 | 986.0 | 959.7 |
| New Mexico | 388.0 | 401.6 | 448.1 | 501.6 | 508.5 | 507.4 | 510.2 | 501.1 |
| New York | 4,125.2 | 4,093.7 | 4,239.6 | 4,596.0 | 4,805.3 | 4,939.8 | 5,067.3 | 5,161.4 |
| North Carolina* | 1,180.8 | 1,208.1 | 1,281.7 | 1,337.4 | 1,377.8 | 1,443.5 | 1,498.0 | 1,501.3 |
| North Dakota*** | 50.7 | 52.4 | 55.5 | 62.8 | 64.9 | 65.1 | 64.9 | 64.4 |
| Ohio | 1,587.3 | 1,602.7 | 1,708.5 | 1,870.7 | 1,979.5 | 2,016.3 | 2,062.9 | 2,076.6 |
| Oklahoma | 514.7 | 522.4 | 533.3 | 588.0 | 624.0 | 651.0 | 668.9 | 679.7 |
| Oregon | 342.2 | 338.4 | 371.2 | 427.4 | 509.2 | 556.6 | 568.2 | 558.4 |
| Pennsylvania** | 1,872.0 | 1,893.9 | 1,963.9 | 2,052.9 | 2,166.8 | 2,088.4 | 2,083.7 | 2,138.4 |
| Rhode Island | 166.2 | 162.6 | 155.9 | 166.0 | 169.7 | 171.9 | 174.3 | 174.8 |
| South Carolina | 634.3 | 618.8 | 661.1 | 668.4 | 684.0 | 701.5 | 773.0 | 777.2 |
| South Dakota | 89.4 | 90.2 | 91.7 | 98.5 | 101.5 | 102.3 | 102.4 | 100.3 |
| Tennessee | 1,243.5 | 1,244.0 | 1,227.5 | 1,248.1 | 1,280.5 | 1,324.7 | 1,313.9 | 1,273.4 |
| Texas | 2,789.9 | 2,864.4 | 2,921.0 | 3,249.0 | 3,509.9 | 3,652.9 | 3,652.9 | 3,614.5 |
| Utah | 189.1 | 186.9 | 204.7 | 236.2 | 259.3 | 273.9 | 282.0 | 283.4 |
| Vermont | 116.0 | 120.8 | 126.7 | 133.5 | 137.4 | 138.8 | 141.8 | 141.3 |
| Virginia | 636.6 | 650.8 | 687.4 | 759.5 | 802.2 | 820.7 | 846.9 | 843.0 |
| Washington | 853.0 | 864.8 | 917.2 | 1,009.7 | 1,064.9 | 1,130.6 | 1,132.8 | 1,132.3 |
| West Virginia | 300.2 | 302.7 | 310.8 | 327.0 | 334.2 | 335.6 | 332.2 | 350.4 |
| Wisconsin | 655.8 | 674.7 | 753.7 | 921.5 | 958.5 | 968.6 | 948.9 | 945.4 |
| Wyoming | 56.8 | 55.5 | 57.4 | 63.9 | 68.0 | 67.2 | 67.2 | 66.0 |
| Total | 42,301 | 42,808 | 44,903 | 48,918 | 51,804 | 53,535 | 54,828 | 55,413 |
| NOTES: Data refers to Medicaid coverage (Title XIX- funded) only. *NC data reflect June 2013. **PA included a new category in December 2013 which appears to contain some Title XXI –funded enrollees as well as some family planning enrollees, both of which are excluded in all other periods and from other states. ***CHIP enrollment data that is used to subtract out Title XXI-funded enrollees from Medicaid enrollment for MO and ND was from June 2013, not December 2013.SOURCE: Compiled by Health Management Associates from state Medicaid enrollment reports for KCMU. | ||||||||
| Table A-3: Total Medicaid Enrollment by State (Percentage Change), December 2005 – 2013 | ||||||||
State | 05-06 | 06-07 | 07-08 | 08-09 | 09-10 | 10-11 | 11-12 | 12-13 |
| Alabama | -2.3% | 1.1% | 5.6% | 5.3% | 7.7% | 4.1% | -1.2% | 3.2% |
| Alaska | -4.6% | -4.1% | 3.8% | 16.9% | 8.3% | 5.8% | 0.7% | -1.6% |
| Arizona | -2.9% | 5.4% | 7.6% | 22.2% | 0.4% | 0.0% | -6.1% | -1.8% |
| Arkansas | 2.2% | 3.0% | -1.7% | 6.2% | 1.6% | 1.6% | 0.9% | 1.1% |
| California | -1.2% | 1.3% | 3.2% | 5.8% | 3.6% | 4.7% | 6.6% | 2.4% |
| Colorado | -1.5% | -2.5% | 12.9% | 15.1% | 12.4% | 11.6% | 8.2% | 15.0% |
| Connecticut | -2.0% | 5.0% | 5.5% | 6.4% | 20.8% | 4.2% | 5.2% | 2.4% |
| DC | -1.1% | -0.3% | 3.6% | 7.9% | 32.0% | 4.9% | 3.9% | 5.8% |
| Delaware | 0.6% | 4.3% | 6.0% | 10.4% | 10.9% | 6.2% | 2.8% | -0.1% |
| Florida | -4.8% | -1.0% | 10.7% | 16.2% | 9.0% | 5.3% | 6.0% | 2.7% |
| Georgia | -9.7% | -1.9% | 6.2% | 8.8% | 4.5% | -0.3% | 2.5% | -2.4% |
| Hawaii | -2.8% | 0.7% | 10.3% | 11.4% | 7.1% | 6.6% | 1.7% | 6.0% |
| Idaho | 2.7% | -4.3% | 3.1% | 15.5% | 10.3% | 1.3% | 5.1% | 2.5% |
| Illinois | 5.5% | 6.4% | 5.3% | 8.3% | 10.5% | 3.8% | -0.5% | 3.8% |
| Indiana | 2.2% | 1.8% | 10.8% | 6.8% | 2.9% | 1.9% | 3.2% | -2.8% |
| Iowa | 0.4% | 5.2% | 9.1% | 10.9% | 6.6% | 5.4% | 5.1% | -0.3% |
| Kansas | -7.5% | 2.8% | 2.1% | 7.1% | 5.2% | 16.4% | 1.8% | 2.1% |
| Kentucky | 1.9% | 2.2% | 3.2% | 5.4% | 3.0% | 1.3% | 0.9% | -2.6% |
| Louisiana | -5.0% | -2.1% | 3.5% | 5.8% | 4.9% | 5.2% | 2.4% | 0.5% |
| Maine | 4.5% | 0.4% | -2.3% | 6.1% | 5.3% | 1.8% | -2.1% | -5.3% |
| Maryland | 3.5% | 2.5% | 10.9% | 19.9% | 13.7% | 7.2% | 4.7% | 6.0% |
| Massachusetts | 5.7% | 2.4% | 1.7% | 7.6% | 5.0% | 0.4% | 5.3% | 1.8% |
| Michigan | 3.7% | -0.2% | 7.6% | 8.8% | 11.3% | -2.5% | -0.2% | -0.3% |
| Minnesota | -0.1% | 1.4% | 4.3% | 12.0% | 6.4% | 17.3% | 1.0% | 0.4% |
| Mississippi | -7.2% | 0.1% | 3.8% | 10.1% | 2.4% | 1.6% | 0.3% | 0.6% |
| Missouri*** | -11.4% | -0.5% | 4.7% | 7.3% | 1.7% | -0.7% | -1.5% | -3.7% |
| Montana | -3.1% | 9.1% | 2.0% | 3.7% | 10.9% | 1.0% | 4.0% | 5.6% |
| Nebraska | -0.2% | -0.8% | 2.4% | 11.9% | 3.3% | -0.3% | 1.0% | -3.2% |
| Nevada | -3.7% | 8.1% | 8.3% | 22.4% | 17.5% | 6.0% | 2.9% | 8.4% |
| New Hampshire | 0.5% | 2.3% | 6.0% | 9.5% | 3.0% | 1.3% | 3.8% | -2.5% |
| New Jersey | 1.8% | 1.9% | 3.9% | 5.6% | 3.8% | 11.1% | 1.7% | -2.7% |
| New Mexico | 5.4% | 3.5% | 11.6% | 12.0% | 1.4% | -0.2% | 0.5% | -1.8% |
| New York | -1.5% | -0.8% | 3.6% | 8.4% | 4.6% | 2.8% | 2.6% | 1.9% |
| North Carolina* | 2.1% | 2.3% | 6.1% | 4.3% | 3.0% | 4.8% | 3.8% | 0.2% |
| North Dakota*** | -2.8% | 3.3% | 6.0% | 13.1% | 3.4% | 0.4% | -0.4% | -0.8% |
| Ohio | 0.3% | 1.0% | 6.6% | 9.5% | 5.8% | 1.9% | 2.3% | 0.7% |
| Oklahoma | 4.8% | 1.5% | 2.1% | 10.3% | 6.1% | 4.3% | 2.8% | 1.6% |
| Oregon | -5.3% | -1.1% | 9.7% | 15.1% | 19.2% | 9.3% | 2.1% | -1.7% |
| Pennsylvania** | 2.7% | 1.2% | 3.7% | 4.5% | 5.5% | -3.6% | -0.2% | 2.6% |
| Rhode Island | -1.3% | -2.2% | -4.1% | 6.5% | 2.2% | 1.3% | 1.4% | 0.3% |
| South Carolina | -2.0% | -2.4% | 6.8% | 1.1% | 2.3% | 2.6% | 10.2% | 0.5% |
| South Dakota | 0.7% | 0.9% | 1.6% | 7.4% | 3.1% | 0.8% | 0.2% | -2.0% |
| Tennessee | -1.7% | 0.0% | -1.3% | 1.7% | 2.6% | 3.5% | -0.8% | -3.1% |
| Texas | 0.0% | 2.7% | 2.0% | 11.2% | 8.0% | 4.1% | 0.0% | -1.1% |
| Utah | -6.1% | -1.2% | 9.5% | 15.4% | 9.8% | 5.6% | 3.0% | 0.5% |
| Vermont | 1.3% | 4.2% | 4.9% | 5.4% | 2.9% | 1.1% | 2.1% | -0.3% |
| Virginia | -0.5% | 2.2% | 5.6% | 10.5% | 5.6% | 2.3% | 3.2% | -0.5% |
| Washington | -1.0% | 1.4% | 6.1% | 10.1% | 5.5% | 6.2% | 0.2% | 0.0% |
| West Virginia | -2.8% | 0.8% | 2.7% | 5.2% | 2.2% | 0.4% | -1.0% | 5.5% |
| Wisconsin | 0.3% | 2.9% | 11.7% | 22.3% | 4.0% | 1.1% | -2.0% | -0.4% |
| Wyoming | -1.1% | -2.2% | 3.3% | 11.4% | 6.4% | -1.1% | -0.1% | -1.8% |
| Total | -0.8% | 1.2% | 4.9% | 8.9% | 5.9% | 3.3% | 2.4% | 1.1% |
| NOTES: Data refers to Medicaid coverage (Title XIX- funded) only. *NC data reflect June 2013. **PA included a new category in December 2013 which appears to contain some Title XXI –funded enrollees as well as some family planning enrollees, both of which are excluded in all other periods and from other states. ***CHIP enrollment data that is used to subtract out Title XXI-funded enrollees from Medicaid enrollment for MO and ND was from June 2013, not December 2013.SOURCE: Compiled by Health Management Associates from state Medicaid enrollment reports for KCMU. | ||||||||
| Table A-4: Non-Disabled, Non-Elderly Enrollees (Monthly Enrollment in Thousands), June 2006 – 2013 | ||||||||
| State | 2006 | 2007 | 2008 | 2009 | 2010 | 2011 | 2012 | 2013 |
| Alabama | 396.7 | 399.7 | 429.5 | 469.4 | 518.7 | 544.6 | 513.7 | 535.7 |
| Alaska | 61.1 | 57.4 | 59.9 | 72.7 | 79.2 | 83.5 | 83.6 | 81.9 |
| Arizona | 772.2 | 818.0 | 889.8 | 1123.7 | 1117.4 | 1104.0 | 1012.3 | 979.9 |
| Arkansas | 322.4 | 330.3 | 315.5 | 340.5 | 340.4 | 341.3 | 340.0 | 342.7 |
| California | 4665.2 | 4707.5 | 4873.3 | 5214.7 | 5422.2 | 5729.7 | 6190.0 | 6405.6 |
| Colorado | 287.0 | 274.9 | 319.2 | 380.0 | 436.2 | 493.8 | 537.4 | 630.7 |
| Connecticut | 303.5 | 321.7 | 342.4 | 369.1 | 461.7 | 485.5 | 513.5 | 528.2 |
| DC | 85.3 | 84.1 | 86.4 | 93.6 | 135.4 | 142.8 | 148.4 | 157.6 |
| Delaware | 111.4 | 116.7 | 124.6 | 139.9 | 157.5 | 168.0 | 172.5 | 171.3 |
| Florida | 1362.1 | 1320.0 | 1506.4 | 1819.8 | 1987.6 | 2082.0 | 2212.0 | 2272.7 |
| Georgia | 919.2 | 889.3 | 954.5 | 1058.6 | 1101.8 | 1076.9 | 1088.7 | 1059.5 |
| Hawaii | 142.1 | 142.5 | 159.9 | 181.1 | 195.5 | 209.3 | 212.5 | 226.7 |
| Idaho | 125.0 | 115.2 | 118.2 | 135.9 | 152.5 | 157.1 | 160.1 | 163.0 |
| Illinois | 1425.7 | 1552.3 | 1651.5 | 1810.4 | 2029.6 | 2102.0 | 2079.6 | 2165.0 |
| Indiana | 583.3 | 592.7 | 672.1 | 722.2 | 732.9 | 734.0 | 747.4 | 711.1 |
| Iowa | 196.2 | 212.1 | 239.3 | 275.6 | 299.0 | 317.8 | 332.0 | 328.4 |
| Kansas | 165.3 | 169.1 | 170.5 | 184.2 | 193.9 | 237.8 | 242.6 | 247.8 |
| Kentucky | 414.8 | 422.3 | 439.1 | 471.8 | 487.3 | 491.0 | 494.4 | 480.0 |
| Louisiana | 598.0 | 574.3 | 593.5 | 633.9 | 663.8 | 704.0 | 722.4 | 723.9 |
| Maine | 180.8 | 180.2 | 173.8 | 186.9 | 199.1 | 212.2 | 204.7 | 189.6 |
| Maryland | 357.5 | 368.9 | 422.6 | 534.8 | 622.6 | 675.7 | 714.9 | 764.1 |
| Massachusetts | 665.1 | 682.2 | 693.6 | 762.1 | 802.4 | 797.3 | 839.6 | 850.1 |
| Michigan | 1107.4 | 1097.4 | 1196.8 | 1322.3 | 1497.2 | 1425.6 | 1411.6 | 1397.4 |
| Minnesota | 418.4 | 422.1 | 442.4 | 510.0 | 546.9 | 668.2 | 673.2 | 677.3 |
| Mississippi | 304.7 | 307.7 | 326.5 | 373.4 | 383.6 | 386.1 | 384.5 | 384.6 |
| Missouri*** | 531.7 | 524.0 | 529.3 | 575.3 | 582.2 | 574.3 | 569.4 | 543.5 |
| Montana | 54.9 | 61.2 | 62.1 | 62.7 | 71.6 | 71.3 | 74.3 | 79.5 |
| Nebraska | 127.7 | 126.3 | 129.6 | 149.4 | 153.9 | 152.5 | 153.3 | 146.1 |
| Nevada | 115.2 | 126.0 | 138.6 | 179.4 | 214.8 | 224.9 | 229.8 | 252.2 |
| New Hampshire | 79.4 | 80.1 | 84.4 | 93.8 | 96.2 | 95.8 | 104.6 | 102.8 |
| New Jersey | 503.9 | 513.5 | 536.5 | 575.9 | 600.4 | 686.6 | 695.2 | 671.3 |
| New Mexico | 304.6 | 315.6 | 359.3 | 410.4 | 413.6 | 410.1 | 411.7 | 402.7 |
| New York | 3095.1 | 3038.4 | 3152.7 | 3469.0 | 3636.0 | 3733.5 | 3829.1 | 3903.4 |
| North Carolina* | 782.8 | 802.8 | 868.0 | 914.2 | 941.1 | 993.3 | 1036.7 | 1037.7 |
| North Dakota*** | 33.6 | 35.1 | 38.1 | 45.0 | 46.5 | 46.6 | 46.2 | 45.6 |
| Ohio | 1161.3 | 1165.6 | 1247.0 | 1390.5 | 1472.9 | 1500.1 | 1544.6 | 1536.7 |
| Oklahoma | 367.0 | 369.5 | 376.0 | 425.0 | 454.2 | 478.2 | 494.4 | 504.4 |
| Oregon | 239.3 | 232.4 | 260.1 | 310.2 | 384.3 | 424.8 | 430.9 | 415.4 |
| Pennsylvania** | 1131.2 | 1131.7 | 1168.3 | 1215.8 | 1274.3 | 1200.4 | 1197.9 | 1310.8 |
| Rhode Island | 109.8 | 106.5 | 100.0 | 109.4 | 112.0 | 113.4 | 115.5 | 114.9 |
| South Carolina | 445.6 | 429.6 | 451.2 | 454.0 | 461.8 | 470.8 | 537.9 | 543.7 |
| South Dakota | 66.8 | 67.4 | 68.5 | 74.8 | 77.4 | 77.5 | 77.0 | 74.3 |
| Tennessee | 843.1 | 842.3 | 814.5 | 909.3 | 938.4 | 964.9 | 945.1 | 911.3 |
| Texas | 2155.2 | 2206.0 | 2240.1 | 2539.2 | 2771.2 | 2886.3 | 2870.4 | 2818.7 |
| Utah | 130.4 | 126.9 | 141.1 | 169.2 | 188.9 | 198.9 | 204.5 | 203.2 |
| Vermont | 91.1 | 83.8 | 88.6 | 95.3 | 99.1 | 100.3 | 101.8 | 101.2 |
| Virginia | 414.4 | 423.6 | 454.5 | 519.2 | 551.8 | 562.4 | 582.9 | 575.5 |
| Washington | 627.4 | 632.1 | 676.6 | 758.2 | 799.3 | 852.2 | 841.5 | 835.8 |
| West Virginia | 185.5 | 184.9 | 189.8 | 203.4 | 206.5 | 205.0 | 203.3 | 218.3 |
| Wisconsin | 476.9 | 490.9 | 563.4 | 722.9 | 749.4 | 751.3 | 725.4 | 716.5 |
| Wyoming | 43.9 | 42.3 | 43.8 | 49.8 | 53.2 | 51.9 | 51.6 | 50.1 |
| Total | 30,088 | 30,317 | 31,984 | 35,608 | 37,916 | 39,197 | 40,107 | 40,590 |
| NOTES: This group includes children, parents, pregnant women and childless adults. Data refers to Medicaid coverage (Title XIX- funded) only. *NC data for December 2013 reflect June 2013.**PA included a new category in December 2013 which appears to contain some Title XXI –funded enrollees as well as some family planning enrollees, both of which are excluded in all other periods and from other states. ***CHIP enrollment data that is used to subtract out Title XXI-funded enrollees from Medicaid enrollment for MO and ND was from June 2013, not December 2013.SOURCE: Compiled by Health Management Associates from state Medicaid enrollment reports for KCMU. | ||||||||
| Table A-5: Non-Disabled Children (Monthly Enrollment in Thousands), December 2006 – 2013 | ||||||||
State | 2006 | 2007 | 2008 | 2009 | 2010 | 2011 | 2012 | 2013 |
| Alabama | 356.0 | 359.0 | 385.9 | 422.4 | 466.0 | 490.2 | 463.1 | 483.9 |
| Alaska | 49.0 | 45.7 | 47.3 | 58.3 | 61.7 | 64.3 | 63.8 | 62.5 |
| Arizona | 470.3 | 493.7 | 530.1 | 640.7 | 627.0 | 648.1 | 637.2 | 619.1 |
| Arkansas | 278.6 | 286.2 | 273.4 | 295.9 | 295.7 | 297.2 | 295.6 | 299.8 |
| California* | 2884.7 | 2917.9 | 3032.2 | 3251.5 | 3398.7 | 3431.3 | 3648.2 | 3634.2 |
| Colorado | 221.1 | 214.1 | 248.7 | 294.5 | 318.2 | 354.4 | 379.5 | 435.9 |
| Connecticut | 217.9 | 226.4 | 236.9 | 253.9 | 273.5 | 281.7 | 288.3 | 290.7 |
| DC | 64.9 | 63.3 | 64.9 | 70.4 | 72.9 | 74.0 | 75.1 | 73.3 |
| Delaware | 64.3 | 66.0 | 68.9 | 74.5 | 81.1 | 84.8 | 86.7 | 86.7 |
| Florida | 1080.5 | 1049.3 | 1178.2 | 1414.7 | 1527.4 | 1594.8 | 1668.7 | 1706.5 |
| Georgia | 742.7 | 714.9 | 774.5 | 874.0 | 909.2 | 889.1 | 902.5 | 877.9 |
| Hawaii | 87.7 | 86.9 | 93.8 | 102.2 | 108.8 | 113.0 | 115.8 | 118.6 |
| Idaho | 109.1 | 102.4 | 104.5 | 118.5 | 133.3 | 137.2 | 136.7 | 137.8 |
| Illinois | 1115.8 | 1208.4 | 1282.5 | 1397.3 | 1527.6 | 1586.1 | 1573.8 | 1521.7 |
| Indiana | 459.8 | 475.1 | 516.8 | 553.7 | 564.9 | 557.3 | 570.5 | 548.0 |
| Iowa | 143.1 | 151.3 | 169.5 | 193.4 | 206.0 | 213.7 | 220.3 | 221.0 |
| Kansas | 137.9 | 139.9 | 144.6 | 159.5 | 162.8 | 202.7 | 207.5 | 209.9 |
| Kentucky | 320.0 | 326.0 | 338.4 | 366.8 | 380.7 | 385.5 | 391.0 | 383.0 |
| Louisiana | 504.0 | 484.5 | 499.3 | 533.8 | 559.0 | 562.8 | 562.8 | 561.9 |
| Maine | 97.6 | 98.2 | 99.3 | 106.8 | 110.0 | 113.5 | 112.0 | 112.3 |
| Maryland | 289.5 | 293.0 | 318.1 | 367.7 | 407.4 | 430.8 | 441.2 | 458.4 |
| Massachusetts | 359.5 | 362.9 | 360.1 | 386.6 | 395.7 | 392.2 | 405.0 | 413.0 |
| Michigan | 794.7 | 795.0 | 762.7 | 828.5 | 921.6 | 911.2 | 929.1 | 892.5 |
| Minnesota | 309.0 | 311.2 | 324.6 | 357.9 | 378.8 | 382.5 | 387.2 | 389.7 |
| Mississippi | 271.9 | 274.5 | 286.6 | 327.3 | 335.9 | 336.6 | 334.3 | 332.8 |
| Missouri**** | 424.6 | 424.7 | 430.7 | 465.7 | 474.0 | 469.0 | 465.5 | 445.6 |
| Montana | 44.0 | 49.3 | 50.3 | 50.3 | 58.6 | 59.7 | 63.2 | 68.1 |
| Nebraska | 105.0 | 105.9 | 108.3 | 124.6 | 122.2 | 121.0 | 121.6 | 118.6 |
| Nevada | 96.4 | 102.6 | 116.1 | 149.1 | 176.6 | 188.2 | 194.2 | 206.9 |
| New Hampshire | 65.5 | 66.6 | 70.1 | 77.8 | 79.7 | 80.1 | 88.2 | 88.6 |
| New Jersey | 429.1 | 438.5 | 462.8 | 503.3 | 528.4 | 557.7 | 571.0 | 558.4 |
| New Mexico | 250.1 | 254.5 | 274.7 | 302.4 | 312.9 | 312.4 | 314.1 | 309.0 |
| New York | 1619.2 | 1583.7 | 1624.8 | 1734.6 | 1774.8 | 1798.1 | 1804.5 | 1839.1 |
| North Carolina** | 616.8 | 635.8 | 682.8 | 750.6 | 771.1 | 821.8 | 868.0 | 869.2 |
| North Dakota**** | 24.0 | 25.2 | 28.6 | 34.3 | 35.2 | 35.7 | 35.6 | 35.9 |
| Ohio | 803.4 | 808.8 | 853.9 | 934.2 | 971.1 | 986.7 | 985.3 | 978.4 |
| Oklahoma | 324.8 | 330.8 | 337.2 | 380.9 | 401.1 | 406.4 | 416.3 | 420.3 |
| Oregon | 170.4 | 174.7 | 185.9 | 232.5 | 258.5 | 282.4 | 270.3 | 263.7 |
| Pennsylvania*** | 886.5 | 890.4 | 933.0 | 988.8 | 1040.3 | 983.9 | 996.6 | 993.0 |
| Rhode Island | 67.0 | 65.8 | 61.0 | 66.4 | 67.9 | 68.1 | 69.5 | 68.8 |
| South Carolina | 355.9 | 341.0 | 357.9 | 351.5 | 349.2 | 355.9 | 423.7 | 429.5 |
| South Dakota | 52.0 | 52.8 | 54.2 | 59.2 | 60.9 | 63.1 | 62.9 | 61.0 |
| Tennessee | 551.7 | 540.3 | 554.4 | 606.1 | 622.5 | 647.0 | 637.6 | 620.4 |
| Texas | 1941.8 | 2001.5 | 2038.3 | 2325.7 | 2544.1 | 2648.1 | 2623.4 | 2573.3 |
| Utah | 97.4 | 94.1 | 106.7 | 127.7 | 149.9 | 160.4 | 163.2 | 161.7 |
| Vermont | 49.2 | 50.2 | 51.5 | 52.9 | 53.1 | 53.5 | 54.1 | 54.2 |
| Virginia | 340.9 | 347.4 | 370.4 | 426.9 | 452.3 | 460.5 | 475.0 | 468.2 |
| Washington | 510.9 | 521.3 | 561.8 | 628.3 | 655.3 | 670.8 | 672.8 | 666.6 |
| West Virginia | 155.9 | 154.1 | 157.9 | 168.4 | 170.7 | 170.2 | 168.4 | 176.4 |
| Wisconsin | 319.7 | 329.3 | 357.5 | 413.1 | 442.2 | 452.9 | 463.9 | 466.1 |
| Wyoming | 36.0 | 34.9 | 36.2 | 41.1 | 44.1 | 43.2 | 43.2 | 42.1 |
| Total | 21,767 | 21,970 | 23,009 | 25,447 | 26,841 | 27,432 | 27,948 | 27,854 |
| NOTES: Data refers to Medicaid coverage (Title XIX- funded) only. *CA data reported here for December 2011 and earlier periods are based on some estimation of the number of non-disabled children. **NC data for December 2013 reflect June 2013. ***PA included a new category in December 2013 which appears to contain some Title XXI –funded enrollees as well as some family planning enrollees, both of which are excluded in all other periods and from other states. ****CHIP enrollment data that is used to subtract out Title XXI-funded enrollees from Medicaid enrollment for MO and ND was from June 2013, not December 2013.SOURCE: Compiled by Health Management Associates from state Medicaid enrollment reports for KCMU. | ||||||||
| Table A-6: Non-Elderly, Non-Disabled Adults (Monthly Enrollment in Thousands), December 2006 – 2013 | ||||||||
State | 2006 | 2007 | 2008 | 2009 | 2010 | 2011 | 2012 | 2013 |
| Alabama | 40.6 | 40.7 | 43.6 | 47.0 | 52.7 | 54.4 | 50.6 | 51.7 |
| Alaska | 12.1 | 11.7 | 12.6 | 14.4 | 17.6 | 19.3 | 19.9 | 19.4 |
| Arizona | 301.9 | 324.3 | 359.7 | 483.0 | 490.4 | 455.9 | 375.1 | 360.8 |
| Arkansas | 43.8 | 44.1 | 42.1 | 44.5 | 44.8 | 44.1 | 44.4 | 42.9 |
| California* | 1780.4 | 1789.6 | 1841.1 | 1963.2 | 2023.5 | 2298.5 | 2541.8 | 2771.4 |
| Colorado | 65.9 | 60.9 | 70.5 | 85.5 | 118.0 | 139.4 | 157.9 | 194.8 |
| Connecticut | 85.6 | 95.3 | 105.5 | 115.2 | 188.3 | 203.8 | 225.2 | 237.5 |
| DC | 20.4 | 20.7 | 21.5 | 23.2 | 62.5 | 68.7 | 73.3 | 84.3 |
| Delaware | 47.1 | 50.7 | 55.8 | 65.4 | 76.3 | 83.1 | 85.9 | 84.6 |
| Florida | 281.6 | 270.7 | 328.2 | 405.0 | 460.1 | 487.2 | 543.3 | 566.3 |
| Georgia | 176.5 | 174.4 | 180.0 | 184.6 | 192.7 | 187.8 | 186.2 | 181.5 |
| Hawaii | 54.4 | 55.7 | 66.1 | 78.9 | 86.7 | 96.3 | 96.7 | 108.1 |
| Idaho | 15.9 | 12.7 | 13.7 | 17.5 | 19.2 | 19.9 | 23.4 | 25.2 |
| Illinois | 309.9 | 343.9 | 369.0 | 413.1 | 502.0 | 516.0 | 505.7 | 643.3 |
| Indiana | 123.5 | 117.6 | 155.3 | 168.5 | 168.0 | 176.7 | 176.9 | 163.0 |
| Iowa | 53.1 | 60.8 | 69.8 | 82.2 | 93.1 | 104.0 | 111.7 | 107.5 |
| Kansas | 27.4 | 29.2 | 25.9 | 24.7 | 31.2 | 35.1 | 35.1 | 37.9 |
| Kentucky | 94.9 | 96.3 | 100.7 | 105.0 | 106.6 | 105.5 | 103.5 | 97.0 |
| Louisiana | 94.0 | 89.9 | 94.2 | 100.1 | 104.8 | 141.2 | 159.6 | 162.0 |
| Maine | 83.2 | 82.0 | 74.5 | 80.1 | 89.1 | 98.6 | 92.6 | 77.3 |
| Maryland | 68.0 | 75.8 | 104.6 | 167.1 | 215.1 | 245.0 | 273.6 | 305.7 |
| Massachusetts | 305.6 | 319.2 | 333.6 | 375.5 | 406.7 | 405.1 | 434.7 | 437.1 |
| Michigan | 312.7 | 302.4 | 434.1 | 493.9 | 575.6 | 514.4 | 482.6 | 504.9 |
| Minnesota | 109.5 | 110.9 | 117.8 | 152.1 | 168.1 | 285.7 | 286.0 | 287.6 |
| Mississippi | 32.8 | 33.2 | 40.0 | 46.1 | 47.7 | 49.5 | 50.2 | 51.8 |
| Missouri**** | 107.1 | 99.4 | 98.6 | 109.6 | 108.1 | 105.3 | 103.9 | 97.9 |
| Montana | 10.9 | 11.9 | 11.8 | 12.3 | 13.0 | 11.6 | 11.2 | 11.4 |
| Nebraska | 22.7 | 20.4 | 21.3 | 24.8 | 31.8 | 31.5 | 31.7 | 27.5 |
| Nevada | 18.9 | 23.3 | 22.6 | 30.3 | 38.2 | 36.7 | 35.6 | 45.3 |
| New Hampshire | 13.9 | 13.6 | 14.3 | 16.0 | 16.5 | 15.7 | 16.4 | 14.2 |
| New Jersey | 74.7 | 75.0 | 73.7 | 72.6 | 71.9 | 128.9 | 124.2 | 112.9 |
| New Mexico | 54.5 | 61.1 | 84.7 | 108.0 | 100.7 | 97.7 | 97.6 | 93.6 |
| New York | 1475.9 | 1454.7 | 1527.9 | 1734.5 | 1861.3 | 1935.3 | 2024.7 | 2064.3 |
| North Carolina** | 166.0 | 167.0 | 185.1 | 163.6 | 170.0 | 171.5 | 168.7 | 168.5 |
| North Dakota**** | 9.5 | 10.0 | 9.5 | 10.7 | 11.3 | 10.9 | 10.5 | 9.7 |
| Ohio | 357.9 | 356.8 | 393.1 | 456.2 | 501.8 | 513.4 | 559.3 | 558.3 |
| Oklahoma | 42.2 | 38.7 | 38.8 | 44.1 | 53.1 | 71.8 | 78.1 | 84.2 |
| Oregon | 68.9 | 57.7 | 74.2 | 77.7 | 125.8 | 142.4 | 160.6 | 151.7 |
| Pennsylvania*** | 244.7 | 241.3 | 235.2 | 226.9 | 234.0 | 216.5 | 201.3 | 317.8 |
| Rhode Island | 42.8 | 40.7 | 39.0 | 43.0 | 44.1 | 45.2 | 46.0 | 46.1 |
| South Carolina | 89.7 | 88.6 | 93.3 | 102.5 | 112.6 | 114.9 | 114.1 | 114.2 |
| South Dakota | 14.8 | 14.6 | 14.3 | 15.6 | 16.5 | 14.4 | 14.0 | 13.3 |
| Tennessee | 291.4 | 302.1 | 260.2 | 303.2 | 315.9 | 317.9 | 307.5 | 290.9 |
| Texas | 213.3 | 204.4 | 201.8 | 213.5 | 227.1 | 238.3 | 246.9 | 245.4 |
| Utah | 33.1 | 32.8 | 34.4 | 41.5 | 38.9 | 38.5 | 41.3 | 41.5 |
| Vermont | 42.0 | 33.6 | 37.1 | 42.5 | 46.0 | 46.8 | 47.8 | 47.1 |
| Virginia | 73.6 | 76.2 | 84.1 | 92.3 | 99.6 | 101.9 | 107.9 | 107.3 |
| Washington | 116.5 | 110.9 | 114.8 | 129.9 | 143.9 | 181.4 | 168.7 | 169.3 |
| West Virginia | 29.6 | 30.9 | 31.9 | 34.9 | 35.8 | 34.8 | 34.9 | 41.9 |
| Wisconsin | 157.2 | 161.6 | 205.9 | 309.9 | 307.2 | 298.4 | 261.6 | 250.4 |
| Wyoming | 7.9 | 7.4 | 7.6 | 8.6 | 9.2 | 8.7 | 8.5 | 8.0 |
| Total | 8,321 | 8,347 | 8,975 | 10,161 | 11,075 | 11,765 | 12,159 | 12,736 |
| NOTES: Data refers to Medicaid coverage (Title XIX- funded) only. *CA data reported here for December 2011 and earlier periods are based on some estimation of the number of non-elderly, non-disabled adults. **NC data for December 2013 reflect June 2013. ***PA included a new category in December 2013 which appears to contain some Title XXI –funded enrollees as well as some family planning enrollees, both of which are excluded in all other periods and from other states. ****CHIP enrollment data that is used to subtract out Title XXI-funded enrollees from Medicaid enrollment for MO and ND was from June 2013.SOURCE: Compiled by Health Management Associates from state Medicaid enrollment reports for KCMU. | ||||||||
| Table A-7: Elderly and People with Disabities (Monthly Enrollment in Thousands), June 2006 – 2013 | ||||||||
| State | 2006 | 2007 | 2008 | 2009 | 2010 | 2011 | 2012 | 2013 |
| Alabama | 269.0 | 273.3 | 281.3 | 279.1 | 287.4 | 294.9 | 316.0 | 320.9 |
| Alaska | 20.0 | 20.4 | 20.8 | 21.7 | 23.0 | 24.6 | 25.3 | 25.2 |
| Arizona | 198.7 | 205.4 | 211.3 | 221.3 | 233.1 | 246.7 | 256.0 | 265.4 |
| Arkansas | 167.2 | 173.9 | 180.2 | 186.0 | 194.2 | 201.9 | 208.2 | 211.1 |
| California | 1,695.4 | 1,736.8 | 1,780.5 | 1,824.9 | 1,867.4 | 1,903.4 | 1,948.7 | 1,931.4 |
| Colorado | 103.6 | 105.7 | 110.5 | 114.7 | 120.0 | 127.0 | 134.5 | 142.3 |
| Connecticut | 83.3 | 84.5 | 86.3 | 87.0 | 89.2 | 88.7 | 90.5 | 90.5 |
| DC | 40.6 | 41.5 | 43.7 | 46.9 | 49.9 | 51.7 | 53.7 | 56.2 |
| Delaware | 31.4 | 32.3 | 33.3 | 34.5 | 36.0 | 37.5 | 38.8 | 39.8 |
| Florida | 742.3 | 762.6 | 798.2 | 857.1 | 929.9 | 988.7 | 1,042.2 | 1,067.8 |
| Georgia | 357.8 | 363.2 | 375.6 | 388.7 | 411.0 | 432.1 | 457.3 | 449.6 |
| Hawaii | 40.2 | 41.1 | 42.7 | 44.6 | 46.2 | 48.4 | 49.5 | 50.9 |
| Idaho | 45.9 | 48.5 | 50.6 | 59.0 | 62.4 | 60.6 | 68.7 | 71.7 |
| Illinois | 447.3 | 440.0 | 447.3 | 462.1 | 480.9 | 504.2 | 512.5 | 525.0 |
| Indiana | 198.3 | 203.1 | 209.6 | 219.3 | 236.0 | 253.0 | 271.6 | 279.7 |
| Iowa | 112.0 | 112.1 | 114.5 | 116.8 | 119.4 | 123.2 | 131.2 | 133.4 |
| Kansas | 79.7 | 82.9 | 86.8 | 91.2 | 95.8 | 99.4 | 100.6 | 102.5 |
| Kentucky | 272.6 | 280.0 | 285.3 | 291.8 | 299.3 | 305.5 | 309.2 | 302.8 |
| Louisiana | 267.7 | 273.2 | 284.1 | 295.0 | 310.4 | 320.8 | 327.3 | 331.2 |
| Maine | 77.3 | 79.0 | 79.4 | 81.7 | 83.6 | 75.7 | 77.1 | 77.3 |
| Maryland | 166.2 | 167.9 | 172.9 | 179.0 | 189.3 | 194.9 | 196.9 | 202.3 |
| Massachusetts | 341.9 | 349.3 | 355.8 | 367.3 | 383.2 | 393.0 | 413.9 | 426.3 |
| Michigan | 391.7 | 398.9 | 412.9 | 429.3 | 452.2 | 475.8 | 486.7 | 495.2 |
| Minnesota | 163.5 | 168.1 | 173.3 | 179.8 | 187.0 | 192.3 | 196.0 | 195.7 |
| Mississippi | 216.1 | 213.5 | 214.6 | 222.5 | 226.7 | 233.8 | 237.1 | 240.8 |
| Missouri | 193.6 | 197.3 | 225.9 | 235.0 | 242.0 | 243.9 | 236.2 | 232.2 |
| Montana | 27.1 | 28.3 | 29.1 | 32.0 | 33.3 | 34.7 | 35.8 | 36.8 |
| Nebraska | 48.4 | 48.3 | 49.2 | 50.6 | 52.5 | 53.4 | 54.6 | 55.1 |
| Nevada | 51.2 | 54.0 | 56.3 | 59.1 | 65.5 | 72.3 | 76.0 | 79.2 |
| New Hampshire | 28.5 | 30.3 | 32.6 | 34.4 | 35.8 | 37.9 | 34.1 | 32.5 |
| New Jersey | 248.1 | 253.0 | 259.7 | 264.7 | 271.9 | 282.8 | 290.9 | 288.4 |
| New Mexico | 83.4 | 86.0 | 88.8 | 91.3 | 94.9 | 97.3 | 98.5 | 98.4 |
| New York | 1,030.1 | 1,055.3 | 1,086.9 | 1,127.0 | 1,169.2 | 1,206.4 | 1,238.1 | 1,258.0 |
| North Carolina* | 398.1 | 405.3 | 413.7 | 423.2 | 436.7 | 450.2 | 461.3 | 463.5 |
| North Dakota | 17.1 | 17.2 | 17.4 | 17.8 | 18.4 | 18.6 | 18.7 | 18.8 |
| Ohio | 426.0 | 437.2 | 461.4 | 480.3 | 506.5 | 516.2 | 518.3 | 539.9 |
| Oklahoma | 147.8 | 152.9 | 157.3 | 163.1 | 169.8 | 172.8 | 174.6 | 175.3 |
| Oregon | 103.0 | 106.0 | 111.1 | 117.2 | 124.9 | 131.8 | 137.3 | 143.0 |
| Pennsylvania | 740.7 | 762.3 | 795.6 | 837.2 | 892.5 | 888.0 | 885.8 | 827.6 |
| Rhode Island | 56.4 | 56.1 | 55.8 | 56.6 | 57.7 | 58.5 | 58.8 | 59.9 |
| South Carolina | 188.6 | 189.2 | 210.0 | 214.4 | 222.2 | 230.7 | 235.1 | 233.5 |
| South Dakota | 22.6 | 22.8 | 23.2 | 23.7 | 24.1 | 24.8 | 25.5 | 26.0 |
| Tennessee | 400.4 | 401.6 | 413.0 | 338.8 | 342.0 | 359.8 | 368.7 | 362.1 |
| Texas | 634.8 | 658.4 | 680.9 | 709.8 | 738.7 | 766.6 | 782.6 | 795.9 |
| Utah | 58.6 | 60.0 | 63.5 | 67.0 | 70.5 | 75.0 | 77.5 | 80.2 |
| Vermont | 24.8 | 37.0 | 38.1 | 38.2 | 38.3 | 38.5 | 40.0 | 40.1 |
| Virginia | 222.2 | 227.2 | 232.9 | 240.3 | 250.4 | 258.3 | 264.1 | 267.5 |
| Washington | 225.6 | 232.6 | 240.6 | 251.5 | 265.7 | 278.4 | 291.3 | 296.5 |
| West Virginia | 114.7 | 117.8 | 120.9 | 123.7 | 127.7 | 130.6 | 128.9 | 132.1 |
| Wisconsin | 178.9 | 183.8 | 190.2 | 198.6 | 209.0 | 217.3 | 223.5 | 228.9 |
| Wyoming | 12.9 | 13.2 | 13.6 | 14.2 | 14.8 | 15.3 | 15.5 | 15.9 |
| Total | 12,213 | 12,490 | 12,919 | 13,311 | 13,889 | 14,338 | 14,721 | 14,822 |
| NOTES: Data refers to Medicaid coverage (Title XIX- funded) only. *NC data for December 2013 reflect June 2013.SOURCE: Compiled by Health Management Associates from state Medicaid enrollment reports for KCMU. | ||||||||
Endnotes
- The Great Recession officially began in December 2007 and officially ended in July 2009 according to the National Bureau of Economic Research; however, the effects of the Great Recession continued well past this point. ↩︎
- State Health Facts, Status of State Action on the Medicaid Expansion Decision, 2014. (Washington, DC: Kaiser Family Foundation, ) downloaded May 27, 2014. https://modern.kff.org/medicaid/state-indicator/state-activity-around-expanding-medicaid-under-the-affordable-care-act/. ↩︎
- Research and Analytic Studies Division, Medi-Cal Statistical Brief: Medi-Cal Monthly Eligibles Trend Report for January 2014. (California: Department of Health Care Services,) 2014. http://www.dhcs.ca.gov/dataandstats/statistics/Documents/RASB_Issue_Brief_Medi-Cal_Eligibles_Trend_Report_for_January_2014%20(Feb%202014).pdf. ↩︎
- Colorado Department of Health Care Policy and Financing, Colorado Medicaid Will Enroll More Childless adults from Waitlist. (Colorado: Colorado State Government,) February 21, 2013. http://www.colorado.gov/cs/Satellite?blobcol=urldata&blobheader=application%2Fpdf&blobkey=id&blobtable=MungoBlobs&blobwhere=1251855278811&ssbinary=true. ↩︎
- Colorado Department of Health Care Policy and Financing, Medicaid Expansion Update. (Colorado: Colorado State Government,) December, 16 2013. http://www.colorado.gov/cs/Satellite?blobcol=urldata&blobheader=application%2Fpdf&blobkey=id&blobtable=MungoBlobs&blobwhere=1251919771103&ssbinary=true. ↩︎
- Artiga, Samantha. Profiles of Medicaid Outreach and Enrollment Strategies: The Cook County Early Expansion Initiative. (Washington, DC: Kaiser Family Foundation,) April 2014. https://modern.kff.org/medicaid/issue-brief/profiles-of-medicaid-outreach-and-enrollment-strategies-the-cook-county-early-expansion-initiative/. ↩︎
- The only exception was a small decline in enrollment in its Family Health Plus program, a long-standing 1115 waiver to extend coverage to adults with income up to 150% FPL; the state reduced eligibility for this program down to 138% FPL in January 2014 and had previously reported plans to use Medicaid funds to help further subsidize coverage for those previously covered under the program purchasing coverage through the state’s Marketplace. Vernon Smith, Kathleen Gifford, Eileen Ellis, Robin Rudowitz and Laura Snyder, Medicaid in a Historic Time of Transformation: Results from a 50-State Budget Survey for State Fiscal Years 2013 and 2014. (Washington, DC: Kaiser Family Foundation,) October 2013. https://modern.kff.org/medicaid/report/medicaid-in-a-historic-time-of-transformation-results-from-a-50-state-medicaid-budget-survey-for-state-fiscal-years-2013-and-2014/. ↩︎
- According to guidance issued by the state to counties in September 2013 (see below), the new MG category includes the following groups that are normally excluded from counts in this report: children with income between 100 and 133 percent FPL ages 6-18 who were previously eligible under CHIP (also known as stairstep children) and women enrolled in SelectPlan, the state’s family planning waiver. According to the memo, those that have submitted applications on or after October 1, 2013 will be enrolled under the new MG categories; it was not possible at the time of this report to separate out these two groups either reenrolled or newly enrolled from the others in this group. Tom Strickler, Director of Bureau Operations. Operations Memorandum #13-09-04: Medicaid Eligibility Rule Changes Under the Affordable Care Act (ACA). (Pennsylvania: Pennsylvania Department of Public Welfare,) September 27, 2013. http://services.dpw.state.pa.us/oimpolicymanuals/manuals/bop/ma/OPS1300904.pdf. ↩︎
- Two states were not able to provide updated CHIP enrollment data for December 2013 – Missouri and North Dakota. Vern Smith, Laura Snyder and Robin Rudowitz. CHIP Enrollment Snapshot: December 2013. (Washington, DC: Kaiser Family Foundation,) May 2014. ↩︎
- Medicaid & CHIP: March 2014 Monthly Applications, Eligibility Determinations, and Enrollment Report, (Washington, DC: Centers for Medicare and Medicaid Services,) May 1, 2014. http://medicaid.gov/AffordableCareAct/Medicaid-Moving-Forward-2014/medicaid-moving-forward-2014.html#. In calculating these rates of growth, CMS excluded CT, DE, ND, ME and MO as they had not reported complete data for either the baseline period or for March 2014. Also, MI and NH were not included in the calculations for the rate of growth in expansion states as neither state had yet implemented their expansion (MI implemented in April 2014 while NH is planning to implement in July 2014.) ↩︎
- See Monthly Medicaid and CHIP reports, Medicaid Moving Forward 2014, Eligibility Data http://medicaid.gov/AffordableCareAct/Medicaid-Moving-Forward-2014/medicaid-moving-forward-2014.html#. ↩︎