Survey of Non-Group Health Insurance Enrollees, Wave 2
Survey Of Non-group Health Insurance Enrollees, Wave 2: Findings
Introduction
This survey reports on the views and experiences of people purchasing health insurance coverage in the non-group market. Over the past few years, the Affordable Care Act (ACA) has had a significant impact on this group, as new rules took effect that standardized coverage, guaranteed coverage for those with pre-existing conditions, and established income-based federal financial assistance to those buying insurance through new health insurance Exchanges or Marketplaces. Starting on January 1st, 2014, all coverage newly purchased either through a Marketplace or directly from an insurance company had to follow new rules under the ACA (i.e. “ACA-compliant”).
The survey, conducted February 18 – April 5, 2015, after the close of the second open enrollment period, includes individuals who purchased ACA-compliant coverage inside or outside of a Marketplace, as well as those who are currently enrolled in “non-ACA compliant” plans. Non-ACA compliant plans are those purchased before the law was enacted in March 2010 and were grandfathered in under the ACA, as well as those purchased before October 2013 and allowed to continue under a federal transition policy at the discretion of states.1 This survey is the second in a series that seeks to shed light on the experiences and opinions of those purchasing their own health insurance. In addition to stand-alone findings, this report draws trends and comparisons using data from the first survey in the series, conducted at the end of the first open enrollment period, April 3-May 11, 2014.
Related: This Data Note looks at predictors of positive and negative attitudes toward the ACA among non-group enrollees.
Key Findings
Section 1: Basic Demographics Of The Non-Group Market
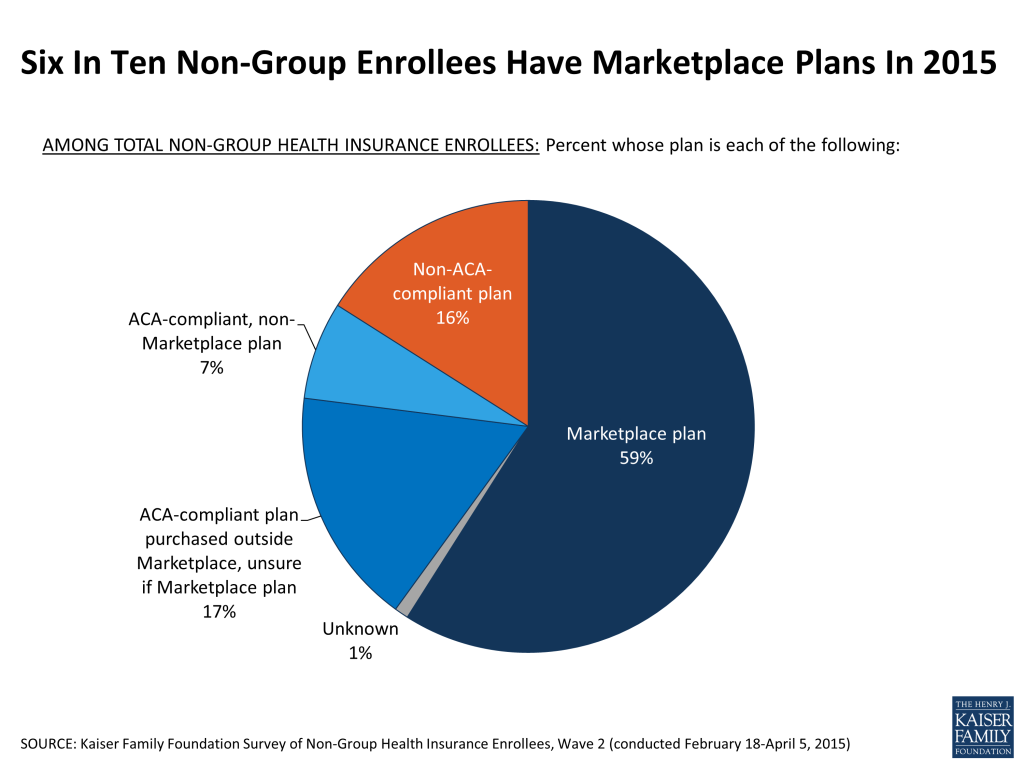
Looking at the non-group market as a whole, about six in ten enrollees (59 percent) report being in Marketplace plans (including plans purchased directly from a Marketplace and Marketplace plans purchased from an insurance company or an insurance agent2 ), an increase from 48 percent last year following the first open enrollment period. In addition, many insurance companies continue to sell non-group insurance policies outside the Marketplaces. Seven percent of all non-group enrollees report having these ACA-compliant, non-Marketplace plans. Another 17 percent purchased ACA-compliant plans from either an insurance company or a broker but say they are unsure whether their plan is a Marketplace plan or not. Sixteen percent of enrollees remain in pre-2014, non-ACA-compliant plans, down from 31 percent in 2014.
An important change made by the ACA prohibited insurers from denying coverage or charging higher premiums to people with non-group coverage because of their health. One concern raised about this change was whether the number of healthy people enrolling because of the new premium tax credits and the law’s individual mandate would be sufficient to offset the higher claims from less healthy people enrolling because insurers could no longer exclude them. At the end of the second open enrollment period, the self-reported health status of people in ACA-compliant plans (which insurers rate as a single risk pool) looks much like it did in 2014, with the vast majority (85 percent) saying their health is excellent, very good, or good. However, as in 2014, those with ACA-compliant plans are somewhat more likely than those with non-ACA compliant plans to report their health as “only fair” or “poor” (15 percent versus 6 percent).
| Figure 2: Self-Reported Health Status Of Enrollees In ACA-Compliant And Non-ACA Compliant Plans | |||||
| ACA-compliant plans | Non-ACA compliant plans | ||||
| In general, would you say your health is excellent, very good, good, fair, or poor? | 2014 | 2015 | 2014 | 2015 | |
| Excellent | 22% | 24% | 28% | 33% | |
| Very good | 29 | 33 | 37 | 34 | |
| Good | 31 | 28 | 28 | 27 | |
| Fair | 13 | 11 | 6 | 5 | |
| Poor | 4 | 4 | <1 | 1 | |
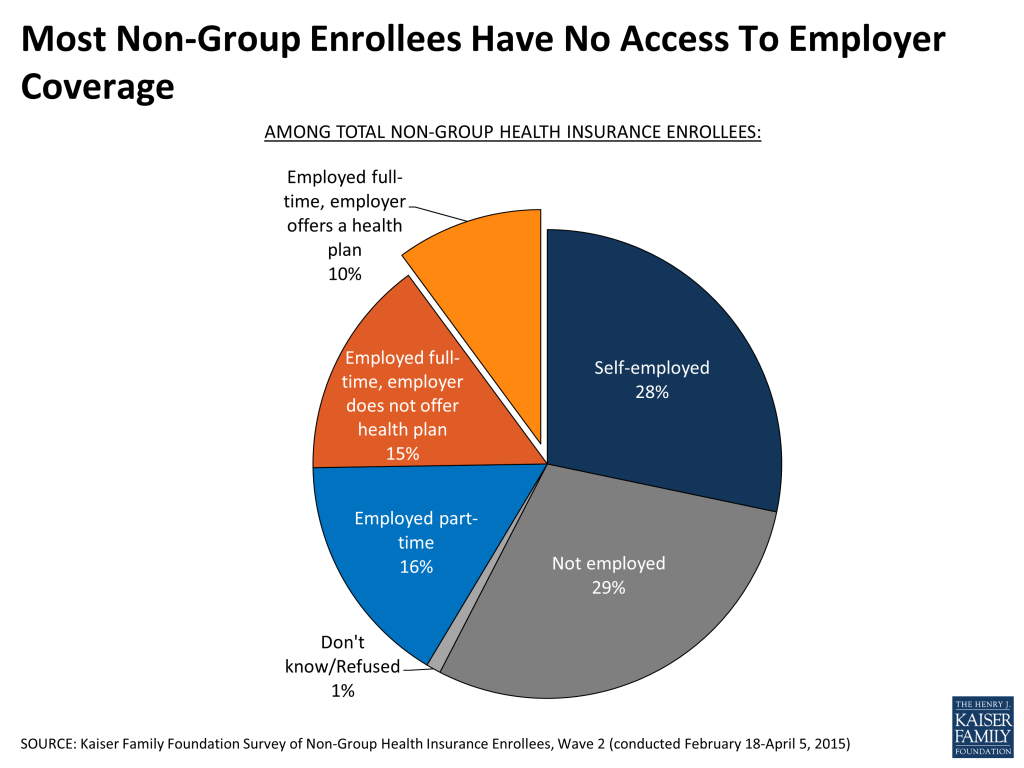
Most people in the non-group market do not have access to employer coverage. Over half are either not employed (29 percent) or self-employed (28 percent), and another 16 percent are employed part-time and likely do not have an offer of coverage.3 Of the one in four (26 percent) who work full-time for someone else, about four in ten, or just 10 percent of all non-group enrollees, say their employer or union offers a health plan to at least some of its employees. Among those whose employers offer a health plan, the largest share says that the main reason they don’t participate in their employer’s plan is because it is less expensive to buy their own coverage than to pay their portion of the cost for the plan at work.
Section 2: Shopping, renewing, and switching coverage
This year’s open enrollment period saw a number of new buyers in the market — more than a third (36 percent) of those with ACA-compliant plans did not have non-group coverage in 2014. The largest share of this group was uninsured immediately prior to purchasing their current plan (72 percent of those new to the non-group market, or 26 percent of all those with ACA-compliant coverage). Among those who had non-group coverage in 2014, most chose to renew their existing plan rather than make a switch. About half (48 percent) of those currently in ACA-compliant plans say they renewed a health plan they had in 2014; only 15 percent say they switched between non-group plans.
| Figure 4: Previous Insurance Status Of Enrollees In ACA-Compliant Plans | |
| Did not have non-group coverage in 2014 | 36% |
| Previously uninsured4 | 26 |
| Previously covered by an employer/COBRA | 7 |
| Previously Medicaid or other public coverage | 2 |
| Previously through a family member/other source | 1 |
| Renewed ACA-compliant 2014 plan | 48 |
| Switched non-group plans 2014 to 2015 | 15 |
| Undetermined | 1 |
Although relatively few switched plans, many of those who did cite cost-related reasons for making a change, including finding a lower monthly premium than what they would have paid to renew their previous plan (6 percent of all those with ACA-compliant plans), and wanting a plan with a lower annual deductible (3 percent of total). Seven percent of those with ACA-compliant coverage say they switched plans because their previous plan was cancelled. Only one percent say they switched because they were unhappy with their plan’s choice of providers, they wanted to be eligible for government financial help, or their family’s health needs changed.
A large majority of those who renewed an ACA-compliant plan this year say it was very or somewhat easy to renew, including three-quarters of those with Marketplace plans (77 percent). About half (52 percent) say they were automatically re-enrolled, while 46 percent say they took action to renew their plan.
| Figure 5: Reported Ease Of Renewal Among Those Who Renewed ACA-Compliant Plans | |||
| Total ACA-compliant | Marketplace | ||
| How easy or difficult was it for you to renew your health plan? | Very easy | 56% | 52% |
| Somewhat easy | 23 | 25 | |
| Somewhat difficult | 12 | 14 | |
| Very difficult | 6 | 6 | |
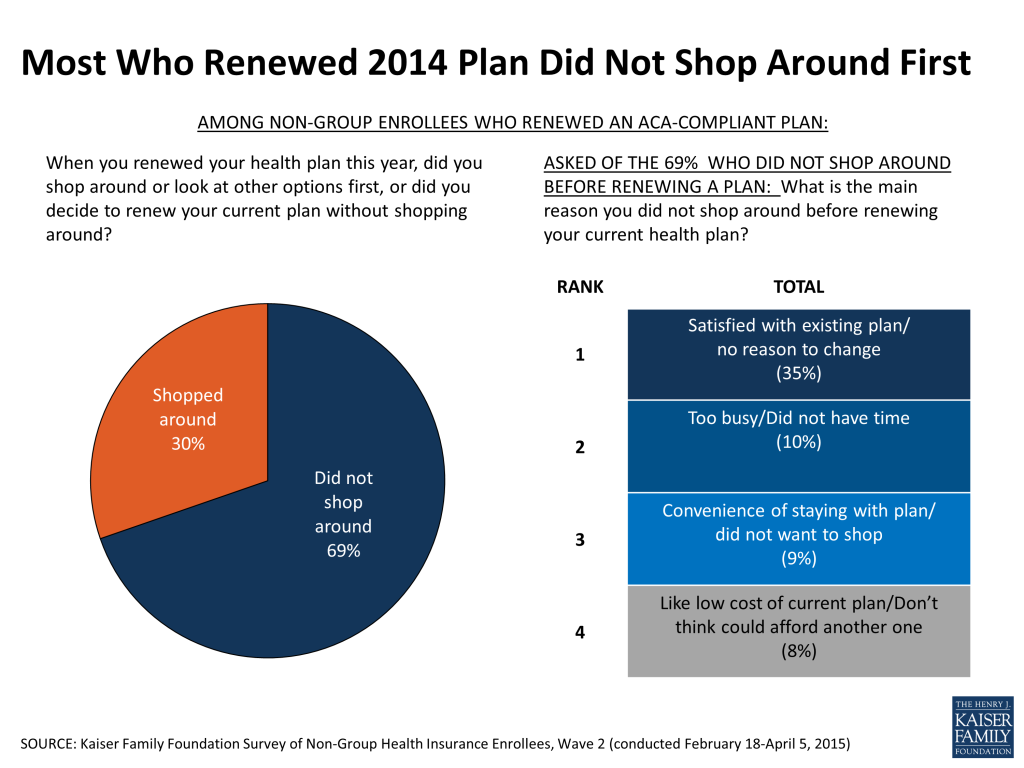
About seven in ten (69 percent) of those who renewed an ACA-compliant plan say they did not shop around before renewing. The most common reason for not shopping was that they were satisfied with their current plan (35 percent). About one in ten each say they were too busy or didn’t have time to shop (10 percent), they didn’t want to deal with the hassle of shopping (9 percent), or they didn’t think they could find a more affordable option (8 percent).
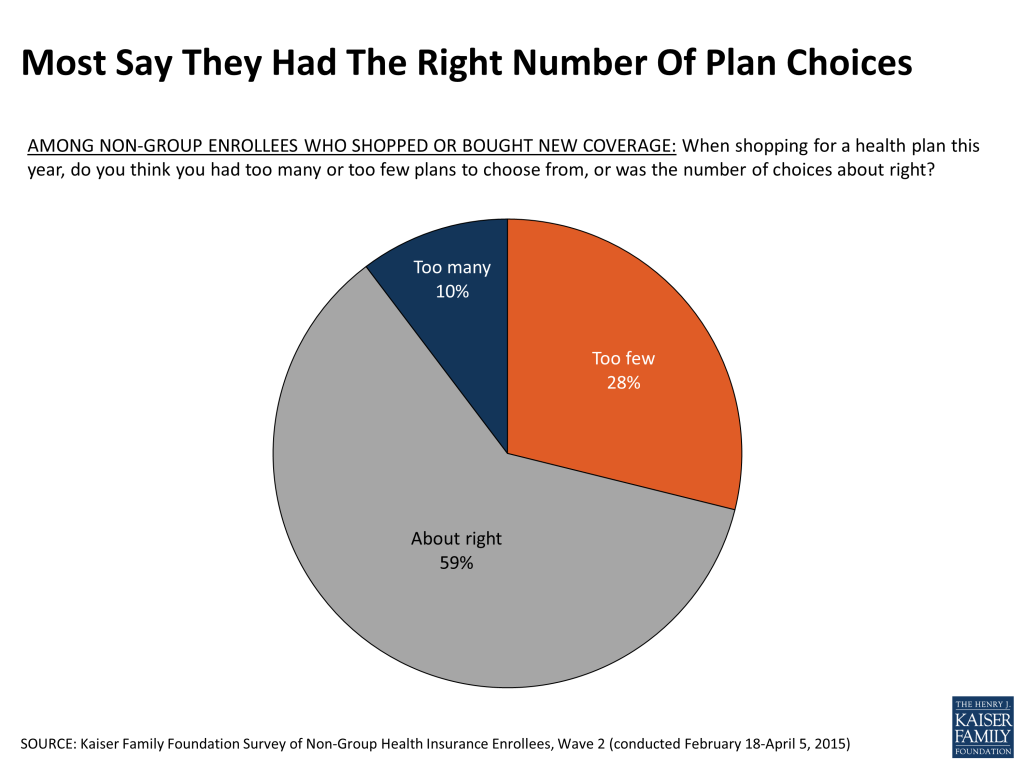
Most (59 percent) of those who did shop for a plan this year (including those who purchased a new plan and those who shopped around but decided to renew a previous plan) say they had about the right number of plans to choose from. This is true of those who bought their coverage both inside and outside the ACA Marketplaces. Still, nearly three in ten (28 percent) feel they had too few plans to choose from, while one in ten say they had too many.
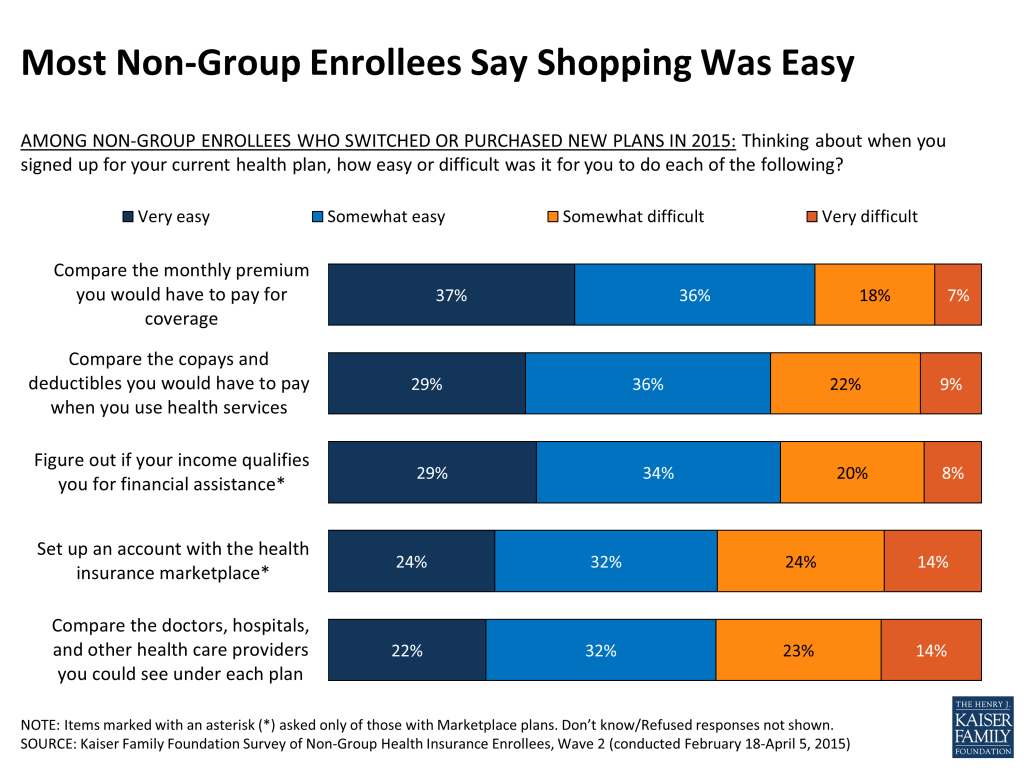
Among those who enrolled in a new plan this year (both those purchased within and outside of the Marketplace) most say that when they signed up for their current plan, it was easy to compare premiums and cost-sharing and to figure out if their income qualifies them for coverage. However, nearly four in ten say it was difficult to set up an account with the marketplace (38 percent) and to compare the providers covered under each plan (37 percent). Reported experiences in the second open enrollment period are very similar to last year, despite the problematic launch of healthcare.gov and state-based Marketplace websites that was widely covered by the media during the first open enrollment.
Last year, with the launch of the new Marketplaces and the accompanying technical issues, personal help with the enrollment process was an important factor in getting people signed up for coverage. Personal help was also important this year, particularly for those new to the market or switching plans. Overall, about six in ten of those either new to the non-group market (60 percent) or those who switched plans this year (57 percent) report getting help with enrollment, while most of those who renewed an ACA-compliant 2014 plan say they completed the process on their own (63 percent).
| Figure 9: Reported Help With Enrollment/Renewal Among Those With ACA-Compliant Plans | |||
| Did someone help you (enroll in health insurance/renew your health plan for 2015) or did you complete the (enrollment/renewal) process on your own? | Switched non-group plans 2014 to 2015 | New to non-group market | Renewed ACA-compliant plan |
| Someone helped you (enroll/renew) | 57% | 60% | 28% |
| Completed the (enrollment/renewal) process on your own | 43 | 39 | 63 |
| Auto-renewed (Vol.) | N/A | N/A | 8 |
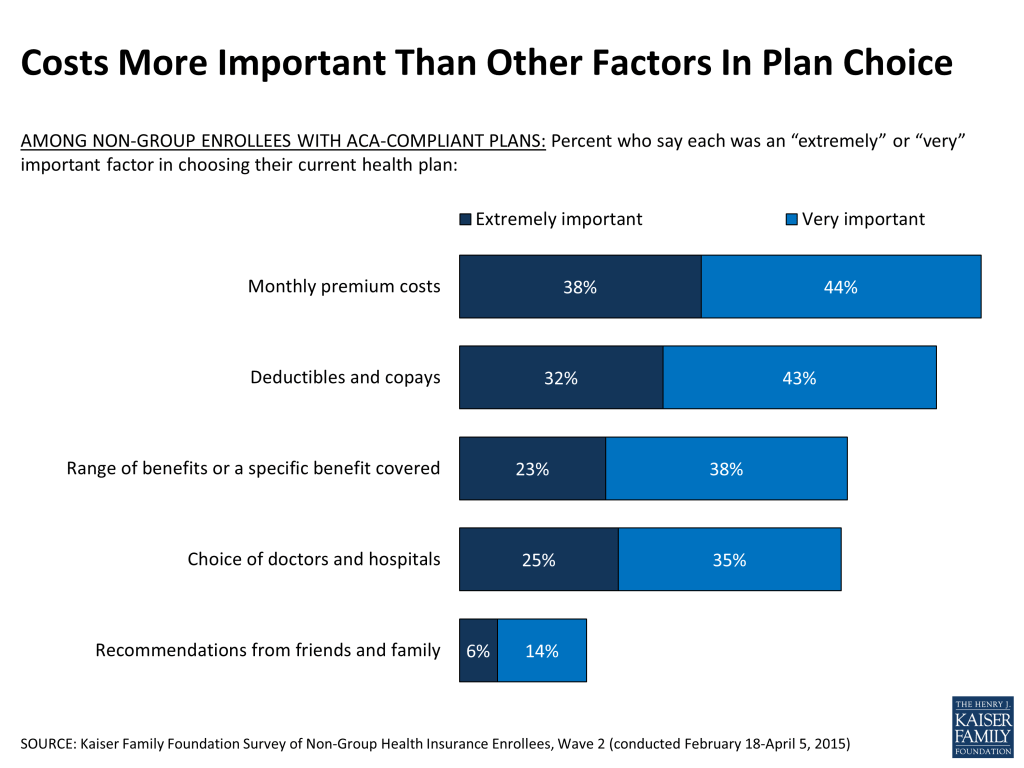
In weighing their plan options, those purchasing ACA-compliant plans report considering a number of factors, with costs rising to the top. Nearly four in ten (38 percent) cite the monthly premium costs as an extremely important factor in their plan choice, followed by the deductibles and copays (32 percent). Roughly a quarter say that the plan’s choice of doctors and hospitals was an extremely important factor (25 percent) along with the range of benefits covered (23 percent). Fewer say that recommendations from friends and family were a top factor (6 percent).
Section 3: Plan ratings and satisfaction
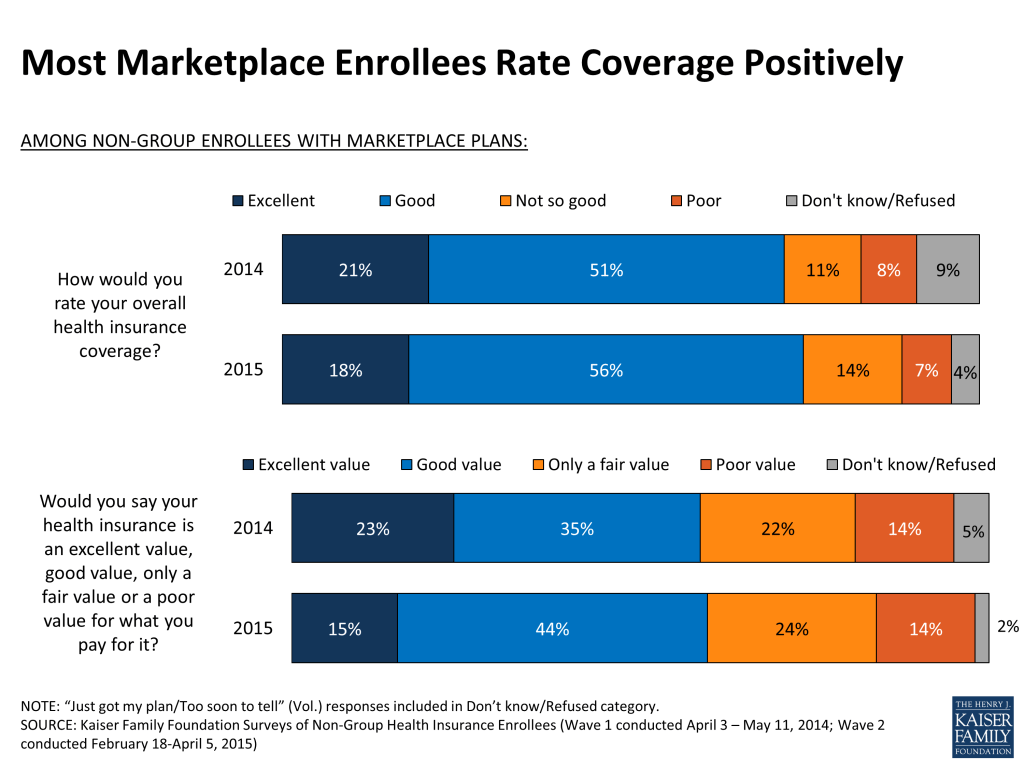
A large majority of those in ACA-compliant plans, including three quarters (74 percent) of those with Marketplace coverage, rate their overall health insurance coverage as excellent or good. More than half also say their plan is an excellent or good value for what they pay for it, while about four in ten say the value is only fair or poor. Among those with Marketplace coverage, plan ratings are similar to 2014, though the share saying their plan is an “excellent” value decreased somewhat from 23 percent to 15 percent. Although not a large decrease, further changes in how Marketplace enrollees are assessing their plans’ value should be watched closely in the coming years.
Enrollees in ACA-compliant plans (including those purchased from a Marketplace) give similar ratings to their overall coverage and value for the money compared to those in pre-ACA, non-compliant plans. As was true in 2014, those with non-group coverage give their plans lower ratings overall compared to those with employer-sponsored insurance interviewed as part of a separate survey.
| Figure 12: Ratings of Coverage Among Those With ACA-Compliant, Non-ACA Compliant, and Employer Plans | |||||
| Total ACA-compliant plans | Marketplace plans | Non-ACA compliant plans | Employer-sponsored coverage5 | ||
| How would you rate your overall health insurance coverage? | Excellent | 18% | 18% | 21% | 37% |
| Good | 56 | 56 | 62 | 54 | |
| Not so good | 13 | 14 | 12 | 7 | |
| Poor | 7 | 7 | 4 | 1 | |
| Would you say your health insurance is an excellent value, good value, only a fair value or a poor value for what you pay for it? | Excellent value | 13 | 15 | 10 | N/A |
| Good value | 42 | 44 | 39 | N/A | |
| Only a fair value | 26 | 24 | 20 | N/A | |
| Poor value | 16 | 14 | 30 | N/A | |
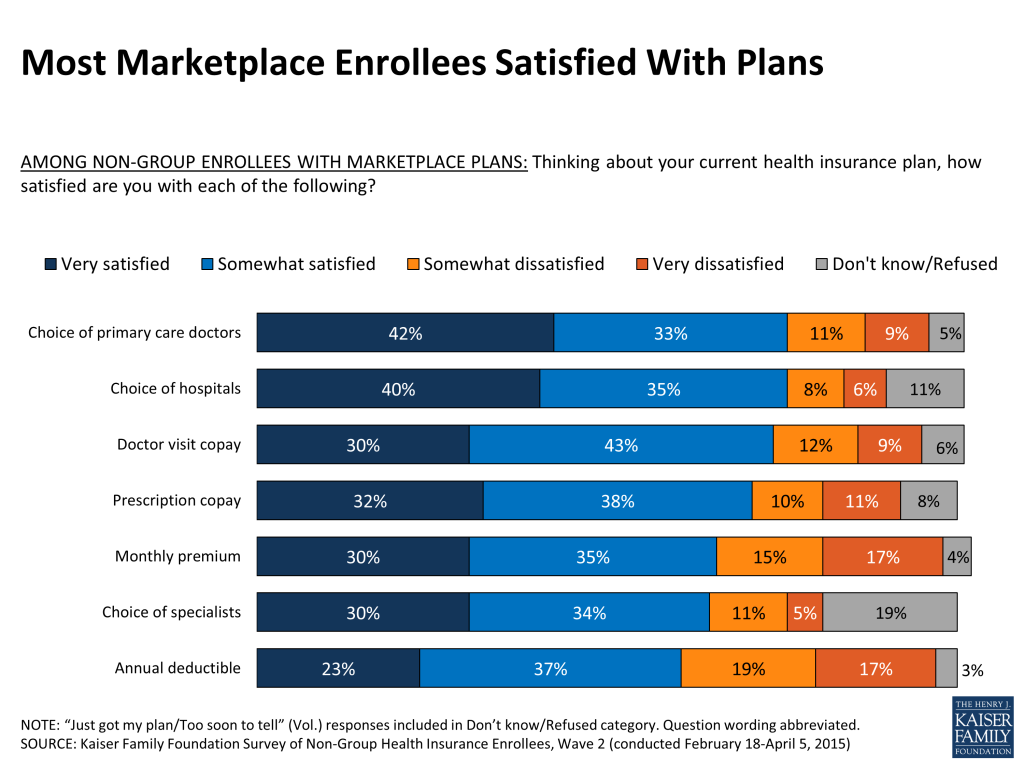
Similar to findings from the 2014 survey, most people with ACA-compliant plans say they are satisfied with various elements of their plans, including their choice of providers, copays, premiums, and deductibles. Among those with Marketplace coverage, at least seven in ten say they are “very” or “somewhat” satisfied with their plan’s choice of primary care providers (75 percent) and hospitals (75 percent), as well as their copays for doctor’s visits (73 percent) and prescriptions (70 percent). About two-thirds (64 percent) say they are satisfied with their choice of specialists, while 16 percent are dissatisfied and about one in five (19 percent) say they don’t know, likely because they have not tried to use a specialist under their plan. While majorities of Marketplace enrollees say they are satisfied with their premiums and deductibles, substantial shares express dissatisfaction, including 32 percent who say they are dissatisfied with their premium and 36 percent who are dissatisfied with their deductible.
Compared to those with older, non-ACA compliant non-group coverage, enrollees in ACA-compliant plans (including those purchased through a Marketplace) are somewhat less likely to say they are satisfied with their plan’s choice of primary care doctors and hospitals, but somewhat more likely to express satisfaction with their monthly premiums and annual deductibles. This is likely because many of them are receiving premium tax credits and cost-sharing subsidies that are not available to those in non-ACA compliant plans. As was true with the 2014 survey findings, satisfaction rates are generally lower among non-group plan enrollees compared to those with employer-sponsored insurance interviewed as part of a separate survey.
| Figure 14: Plan Satisfaction Among Those With ACA-Compliant, Non-ACA Compliant, And Employer Plans | |||||
| Percent who say they are satisfied/dissatisfied with each of the following: | Total ACA-compliant plans | Marketplace plans | Non-ACA compliant plans | Employer-sponsored coverage6 | |
| Choice of primary care doctors | Very or somewhat satisfied | 77% | 75% | 91% | 92% |
| Very or somewhat dissatisfied | 18 | 20 | 8 | 6 | |
| Don’t know/Refused | 5 | 5 | <1 | 1 | |
| Choice of hospitals | Very or somewhat satisfied | 75 | 75 | 88 | 92 |
| Very or somewhat dissatisfied | 15 | 14 | 9 | 6 | |
| Don’t know/Refused | 10 | 11 | 4 | 2 | |
| Choice of specialists | Very or somewhat satisfied | 64 | 64 | 64 | 86 |
| Very or somewhat dissatisfied | 16 | 16 | 11 | 7 | |
| Don’t know/Refused | 19 | 19 | 25 | 7 | |
| Doctor visit copay | Very or somewhat satisfied | 72 | 73 | 77 | 81 |
| Very or somewhat dissatisfied | 23 | 21 | 22 | 18 | |
| Don’t know/Refused | 5 | 6 | 2 | 1 | |
| Prescription copay | Very or somewhat satisfied | 68 | 70 | 65 | 81 |
| Very or somewhat dissatisfied | 23 | 21 | 31 | 17 | |
| Don’t know/Refused | 9 | 8 | 3 | 2 | |
| Monthly premium | Very or somewhat satisfied | 61 | 65 | 45 | 73 |
| Very or somewhat dissatisfied | 35 | 32 | 53 | 26 | |
| Don’t know/Refused | 4 | 4 | 5 | 1 | |
| Annual deductible | Very or somewhat satisfied | 59 | 60 | 49 | 72 |
| Very or somewhat dissatisfied | 37 | 36 | 49 | 25 | |
| Don’t know/Refused | 3 | 3 | 2 | 3 | |
Section 4: Financial protection
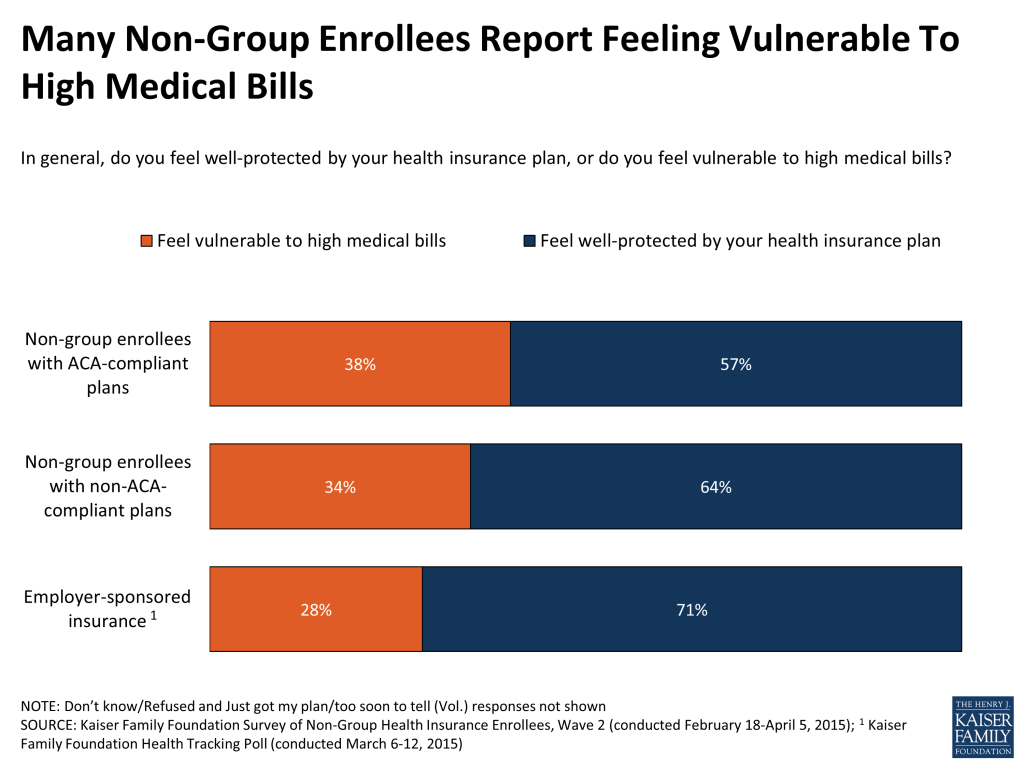
Despite relatively high plan ratings and satisfaction levels, many non-group enrollees report feeling vulnerable to high medical bills and say they have encountered problems with health care costs. Over half (57 percent) of those with ACA-compliant plans say they feel well-protected by their plan, but nearly four in ten (38 percent) feel vulnerable to high medical bills (similar to 2014). Those with new plans purchased under the ACA are not the only ones feeling financially precarious; a similar share (34 percent) of those with pre-2014, non-ACA compliant plans says they feel vulnerable to high medical bills. Among those with employer-sponsored coverage interviewed as part of a separate survey, a somewhat smaller share, but still nearly three in ten (28 percent), reports feeling financially vulnerable.
Many also worry about future health care costs. Nearly six in ten (56 percent) of those with ACA-compliant plans say they are at least somewhat worried they won’t be able to afford the health care services they need. But again, worry is not confined to those with newer non-group plans; a similar share (57 percent) of those with older, non-ACA-compliant plans report the same worry. And equal shares of those with ACA-compliant and non-compliant plans (46 percent of each group) say it is difficult for them to afford to pay the cost of their health insurance each month.
| Figure 16: Financial Worries Among Those In ACA-Compliant And Non-ACA Compliant Plans | |||
| ACA-compliant plans | Non-ACA compliant plans | ||
| How worried are you, if at all, that you won’t be able to afford the health care services you need? | Very worried | 20% | 15% |
| Somewhat worried | 36 | 42 | |
| Not too worried | 29 | 26 | |
| Not at all worried | 15 | 16 | |
| How easy or difficult is it for you to afford to pay the cost of your health insurance each month? | Very easy | 21 | 21 |
| Somewhat easy | 31 | 32 | |
| Somewhat difficult | 31 | 35 | |
| Very difficult | 15 | 11 | |
As other surveys have found, having health insurance is not a panacea against problems with medical bills, even for those who are continuously insured. Among enrollees in ACA-compliant plans who’ve had their plan for at least a year, 16 percent say that they’ve had problems paying medical bills in the past 12 months. Some also say they or a family member covered by their plan didn’t fill a prescription (18 percent) or didn’t get needed health care (11 percent) because of cost concerns in the past 12 months7 . Enrollees in non-ACA compliant plans, who by definition have had their plan for an even longer period of time, are less likely than those with compliant plans to report problems paying medical bills or delaying care due to cost.

Section 5: Opinions and Experiences of Those In High-Deductible Plans
One group that may be particularly vulnerable to high out-of-pocket health care costs are those with high deductible health plans. In the non-group market as a whole (including those in ACA-compliant and non-ACA compliant plans), four in ten enrollees (40 percent) have a plan with a high deductible (defined for purposes of this analysis as $1,500 or more for an individual or $3,000 or more for a family-level deductible). Another four in ten (43 percent) have plans with lower deductibles, while 17 percent are unsure of their deductible amount.
Comparing those with high-deductible versus lower deductible health plans, those with high deductibles are more likely to be in non-ACA compliant plans (22 percent versus 12 percent), and have higher incomes on average. Consequently, they are less likely to report getting government financial assistance to pay their premium (36 percent versus 56 percent).
| Figure 18: Income And Tax Credit Status Of Those In High- Versus Lower-Deductible Non-Group Plans | |||
| High-deductible plans | Lower-deductible plans | ||
| Self-reported income as a percentage of Federal Poverty Level (FPL) | <138% FPL | 14% | 40% |
| 138-250% FPL | 23 | 24 | |
| 250-400% FPL | 23 | 14 | |
| 400%+ FPL | 32 | 14 | |
| Undetermined | 7 | 7 | |
| Premium tax credit status | Likely receiving tax credit8 | 36 | 56 |
| Not likely receiving tax credit | 61 | 43 | |
| Undetermined | 3 | 1 | |
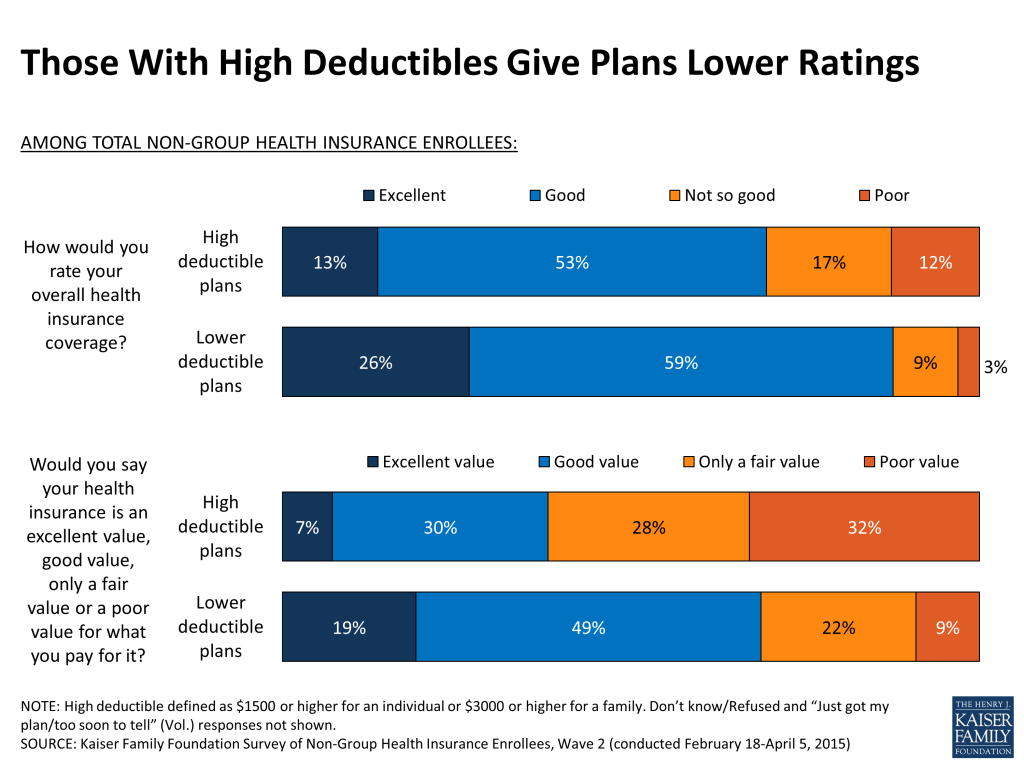
Those in high deductible plans generally report being less happy with their plans than those with lower deductibles. They are more than twice as likely to rate their health plan as “not so good” or “poor” (29 percent versus 12 percent) and to say the value for what they pay is “only fair” or “poor” (60 percent versus 31 percent).
Those with higher deductibles are also less likely than those with lower deductibles to report being satisfied with their deductible and other cost-sharing arrangements of their plan, including their office visit and prescription copays.

In addition, those with higher deductibles are significantly more likely than those with lower deductibles to say they feel vulnerable to high medical bills (55 percent versus 22 percent). These differences between those with high and lower deductibles hold true regardless of income level or whether or not they are receiving federal financial assistance.
However, there is no significant difference between these two groups in reports of cost-related problems, including problems paying medical bills or skipping needed medical care or prescriptions in the past twelve months because of the cost. This may be due to the fact that while higher deductibles leave this group potentially more vulnerable to out-of-pocket costs, their relatively higher incomes make it somewhat easier for them to absorb these costs.
Many non-group enrollees in both high-deductible and lower-deductible plans say they lack the financial resources to cover a large unexpected medical bill without going into debt. When asked hypothetically about an unexpected medical bill for which the portion not covered by insurance is $500, four in ten non-group enrollees overall (44 percent) say they would be able to pay it off without going into debt, but a third (34 percent) say they would have to go into credit card debt or borrow money to pay it and 13 percent say they would not be able to pay the bill at all. For a hypothetical medical bill on which they owe $1,500, just about a quarter could pay it off without going into debt, while four in ten would have to borrow money and nearly a quarter wouldn’t be able to pay the bill at all. In general, those in high-deductible plans are somewhat more likely than those in lower-deductible plans to say they could weather these expenses without going into debt, perhaps because of their relatively higher incomes. Still, among those in high-deductible plans, 43 percent say they would have to borrow money or go into credit card debt to cover a $1500 medical bill, and 15 percent say they wouldn’t be able to pay such a bill at all.
| Figure 21: Responses To A Hypothetical Medical Bill Of $500/$1500 Among Those In Non-Group Plans | ||||||
| Suppose you had an unexpected medical bill and the amount not covered by your insurance was $500/$1500. Based on your current financial situation, would you… | Total non-group | High-deductible health plans | Lower-deductible health plans | |||
| $500 | $1500 | $500 | $1500 | $500 | $1500 | |
| Would pay bill without borrowing (NET) | 44% | 26% | 55% | 31% | 36% | 24% |
| Pay right away by cash or check | 30 | 16 | 38 | 19 | 25 | 17 |
| Put on credit card and pay off at next statement | 14 | 10 | 17 | 12 | 11 | 7 |
| Would pay bill by borrowing (NET) | 34 | 41 | 28 | 43 | 37 | 38 |
| Put on a credit card and pay off over time | 26 | 32 | 21 | 35 | 30 | 30 |
| Borrow from bank, payday lender, friends, or family | 8 | 9 | 7 | 8 | 7 | 8 |
| Would arrange payment plan with provider (Vol.) | 6 | 6 | 7 | 9 | 4 | 3 |
| Would not able to pay at all | 13 | 23 | 8 | 15 | 19 | 32 |
Section 6: Non-Group Enrollees’ Opinions of the ACA
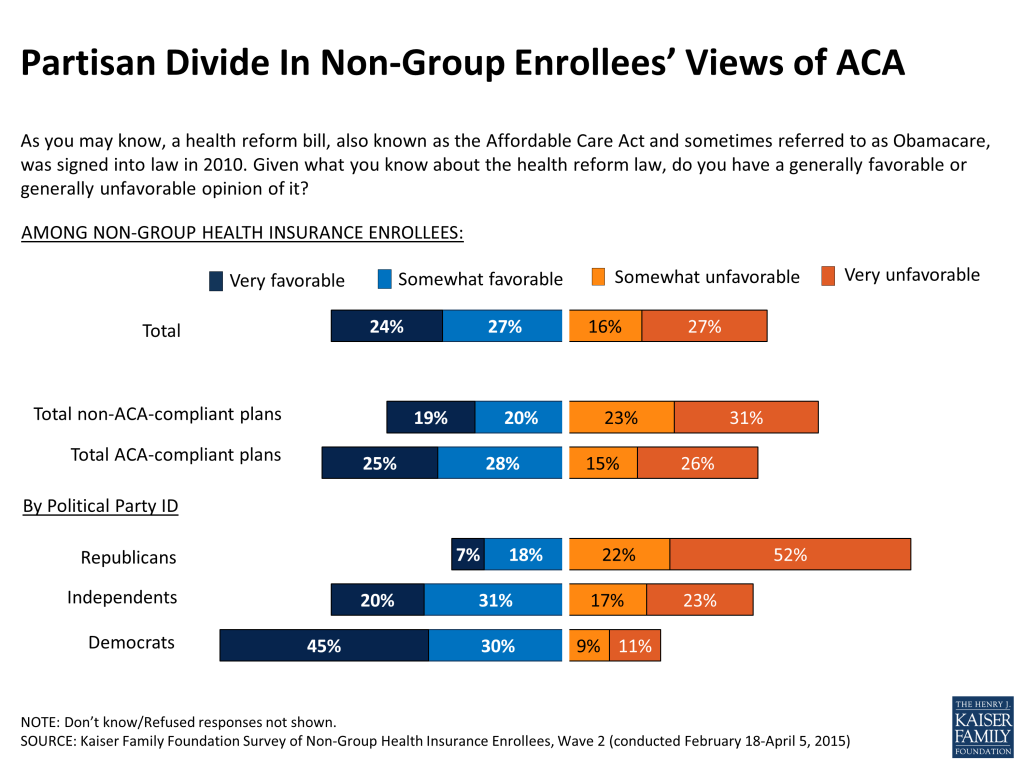
Overall, about half of non-group health insurance enrollees (51 percent) report having a favorable view of the Affordable Care Act, while just over four in ten (43 percent) say they have an unfavorable view. Favorability hasn’t changed much over the past year and is roughly similar to adults nationwide in the same age range (45 percent favorable, 42 percent unfavorable).9
However, there are differences in opinion within the non-group market. Those in ACA-compliant plans are more likely to say they have a favorable view of the law compared to those with non-ACA compliant plans (53 percent versus 39 percent). As is true among the general public, partisanship remains by far the biggest driver of opinion of the ACA among non-group purchasers, with a large majority of Republicans (74 percent) expressing an unfavorable view of the law, while an equally large share of Democrats (75 percent) say they are favorable, and independents are in the middle (51 percent favorable, 40 percent favorable).
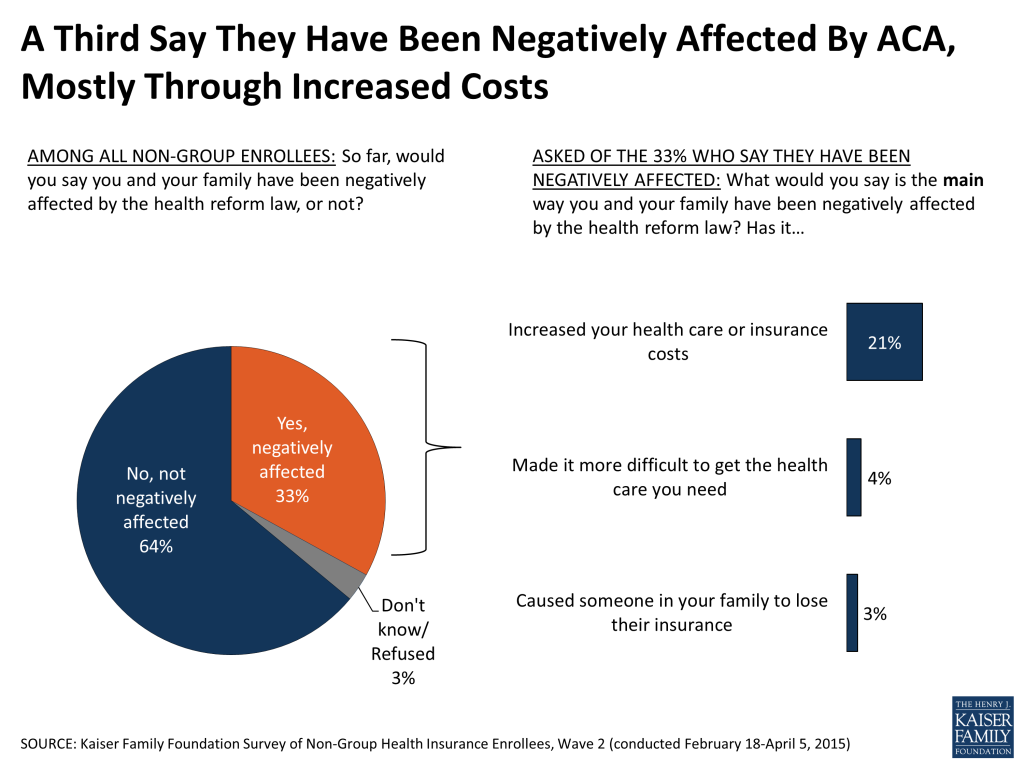
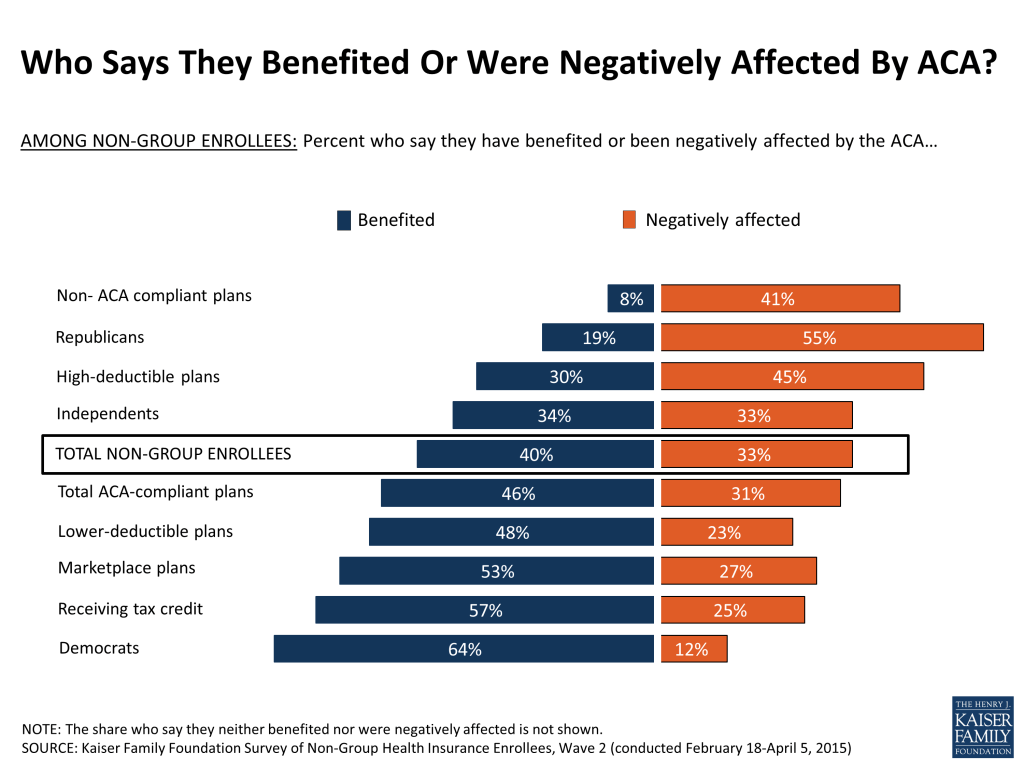
When asked about the impact the law has had on them and their families, four in ten non-group enrollees say they’ve benefited from the ACA, up slightly from 34 percent who said this in 2014. A somewhat smaller share – 33 percent – say they’ve been negatively affected (similar to the 29 percent who said this last year). Those who say they’ve benefited are about evenly divided in saying the main reason was because the law allowed someone in their family to get or keep health coverage, lowered their health care or insurance costs, or made it easier to get needed health care.

Among the 33 percent of non-group enrollees who say they’ve been negatively impacted by the law, most say the law increased their health care or insurance costs, while smaller shares say it made it more difficult to get needed health care or that it caused someone in their family to lose their insurance.
Here again there are important divisions within the non-group market in who feels they’ve benefited or been negatively affected by the ACA. Those most likely to feel their families have benefited include those who are likely receiving government tax credits to help with the cost of insurance (57 percent), those with Marketplace plans (53 percent), and those in plans with lower deductibles (48 percent). On the other side, those with non-compliant pre-ACA plans stand out as a group that is particularly likely to feel negatively affected– four in ten (41 percent) say they have been negatively affected while only 8 percent say they’ve benefited. Non-group purchasers in high deductible plans also tilt negative; 45 percent say they’ve been negatively impacted and three in ten say they have benefited. Partisanship provides a stark comparison here as well. More than half of Republicans say they’ve been negatively affected, while nearly two-thirds of Democrats say the law has been a benefit to their family. Independents sit squarely in the middle: 34 percent feel they’ve benefited from the law and 33 percent say they’ve felt a negative impact.
Survey Of Non-group Health Insurance Enrollees, Wave 2: Methodology
The Kaiser Family Foundation (KFF) Survey of Non-Group Health Insurance Enrollees is the second in a series of surveys examining the views and experiences of people who purchase their own health insurance, including those whose coverage was purchased through a state or federal Health Insurance Marketplace and those who bought coverage outside the Marketplaces. The survey was designed and analyzed by researchers at KFF. Social Science Research Solutions (SSRS) collaborated with KFF researchers on sample design and weighting, and supervised the fieldwork. KFF paid for all costs associated with the survey.
The survey was conducted by telephone from February 18 through April 5, 2015 among a random sample of 804 adult U.S. residents who purchase their own insurance. Computer-assisted telephone interviews conducted by landline (346) and cell phone (458, including 241 who had no landline telephone) were carried out in English and Spanish by SSRS. Respondents were considered eligible for the survey if they met the following criteria:
- Between the ages of 18-64
- Currently covered by health insurance that they purchase themselves or purchased insurance that would begin in the next month
- Not covered by health insurance through an employer, COBRA, Medicare, Medicaid, a parent’s plan, or the U.S. military or VA
- If purchase insurance from a college or university, the insurance covers health services received both within and outside the university setting
- If a small business owner, the health insurance they purchase is only for themselves and/or their family, and does not cover non-related employees of their business
- If purchase from a trade association, respondent pays the entire premium themselves
Because the study targeted a low-incidence population, the sample was designed to increase efficiency in reaching this group, and consisted of three parts: (1) respondents reached through random digit dialing (RDD) landline and cell phone (N=151); (2) respondents reached by re-contacting those who indicated in a previous RDD survey that they either purchased their own insurance or were uninsured (N=247); (3) respondents reached as part of the SSRS Omnibus survey (N=406), a weekly, nationally representative RDD landline and cell phone survey. All RDD landline and cell phone samples were generated by Marketing Systems Group.
A multi-stage weighting process was applied to ensure an accurate representation of the national population of non-group enrollees ages 18-64. The first stage of weighting involved corrections for sample design, including accounting for the likelihood of non-response for the re-contact sample, number of eligible household members for those reached via landline, and a correction to account for the fact that respondents with both a landline and cell phone have a higher probability of selection. In the second weighting stage, demographic adjustments were applied to account for systematic non-response along known population parameters. No reliable administrative data were available for creating demographic weighting parameters for this group, since the most recent Census figures could not account for the changing demographics of non-group insurance enrollees brought about by the ACA. Therefore, demographic benchmarks were derived by compiling a sample of all respondents ages 18-64 interviewed on the SSRS Omnibus survey during the field period (N=6,519) and weighting this sample to match the national 18-64 year-old population based on the 2014 U.S. Census Current Population Survey March Supplement parameters for age, gender, education, race/ethnicity, region, population density, marital status, and phone use. This sample was then filtered to include respondents qualifying for the current survey, and the weighted demographics of this group were used as post-stratification weighting parameters for the standard RDD and omnibus samples (including gender, age, education, race/ethnicity, marital status, income, and population density). A final adjustment was made to the full sample to control for previous insurance status (estimated based on the combined RDD and omnibus samples), to address the possibility that the criteria used in selecting the prescreened sample could affect the estimates for previous insurance status.
Weighting adjustments had a minor impact on the overall demographic distribution of the sample, with the biggest adjustments being made based on age (this is common in all telephone surveys, as younger respondents are the most difficult to reach and convince to participate). Weighted and unweighted demographics of the final sample are shown in the table below.
| Unweighted% of total | Weighted% of total | ||
| Age | 18-25 | 9% | 15% |
| 26-34 | 13 | 18 | |
| 35-44 | 14 | 17 | |
| 45-54 | 25 | 22 | |
| 55-64 | 38 | 26 | |
| Refused | 2 | 2 | |
| Gender | Male | 49 | 48 |
| Female | 51 | 52 | |
| Education | Less than high school graduate | 6 | 7 |
| High school graduate | 26 | 31 | |
| Some college | 27 | 29 | |
| Graduated college | 27 | 21 | |
| Graduate school or more | 13 | 9 | |
| Technical school/other | 2 | 2 | |
| Refused | – | – | |
| Race/Ethnicity | White, non-Hispanic | 73 | 69 |
| Black, non-Hispanic | 10 | 11 | |
| Hispanic | 10 | 12 | |
| Other/Mixed | 6 | 6 | |
| Refused | 1 | 1 | |
| Self-reported health status | Excellent | 24 | 26 |
| Very good | 33 | 33 | |
| Good | 28 | 27 | |
| Fair | 12 | 10 | |
| Poor | 4 | 4 | |
| Don’t know/refused | * | * |
All statistical tests of significance account for the effect of weighting. The margin of sampling error (MOSE) including the design effect is plus or minus 4 percentage points for results based on the total sample. Unweighted Ns and MOSE for key subgroups are shown in the table below. For other subgroups the margin of sampling error may be higher. Kaiser Family Foundation public opinion and survey research is a charter member of the Transparency Initiative of the American Association for Public Opinion Research.
| Group | N (unweighted) | MOSE |
| Total non-group enrollees | 804 | ±4 percentage points |
| ACA-compliant plans | 667 | ±5 percentage points |
| Marketplace plans | 494 | ±6 percentage points |
| Non-ACA-compliant plans | 127 | ±11 percentage points |
Endnotes
- Throughout this report, “ACA-compliant plans” refers to plans purchased after January 1, 2014, while “non-ACA-compliant plans” are those purchased before that date. ↩︎
- Non-group enrollees are able to purchase Marketplace plans through a health insurance broker or directly through an insurance company. In some states, large shares of non-group enrollees used a broker to enroll in a Marketplace plan ↩︎
- Those who say they are employed part time were not asked whether their employer offered a health plan to employees. According to the Bureau of Labor Statistics, less than a quarter of those employed part time in the private sector have access to employer-provided health insurance (http://www.bls.gov/opub/mlr/2014/article/trends-in-employment-based-health-insurance-coverage.htm). ↩︎
- Previous insurance status refers to coverage immediately prior to purchasing current plan. ↩︎
- Source: Kaiser Health Tracking Poll, March 2015 (https://modern.kff.org/health-costs/poll-finding/kaiser-health-tracking-poll-march-2015/) ↩︎
- Kaiser Health Tracking Poll, March 2015 (https://modern.kff.org/health-costs/poll-finding/kaiser-health-tracking-poll-march-2015/ ↩︎
- Those who’ve had their plans for fewer than 12 months were excluded from this analysis, since problems reported by these individuals may have occurred when they were uninsured or covered by a different plan. ↩︎
- Those who likely received a tax credit includes anyone with Marketplace coverage who says they received financial help from the government to pay their health insurance premium, as well as anyone who says their premium is based on their income. ↩︎
- Kaiser Health Tracking Poll: April 2015. https://modern.kff.org/health-costs/poll-finding/kaiser-health-tracking-poll-april-2015/ ↩︎