Medicare Part D at Ten Years: The 2015 Marketplace and Key Trends, 2006-2015
Section 4: The Low-Income Subsidy Program
Low-Income Subsidy Plan Availability
In 2015, 11.7 million Part D enrollees (30 percent of all Part D enrollees) were receiving the Low-Income Subsidy (LIS).1 To qualify for the subsidy, individuals must have incomes below 150 percent of the federal poverty level and modest assets or must qualify for Medicaid, Supplemental Security Income, or the Medicare Savings Programs. At the end of 2013, 88 percent of LIS beneficiaries were deemed automatically eligible for the LIS based on being enrolled in both Medicare and Medicaid or receiving benefits from Supplemental Security Income as well as Medicare.2 This share deemed eligible has been relatively constant since 2006. The other LIS beneficiaries qualified through applying and meeting the program’s income and asset standards.
The overall share of Part D enrollees who receive the LIS is down from 41 percent in 2006. In part this reflects the shift into Part D by those who previously obtained drug coverage from former employers; few with retiree coverage qualify for the LIS. But in 2015 LIS enrollees represent 36 percent of Part D enrollees who are not in employer-only plans, and that share is down from 44 percent in 2015.
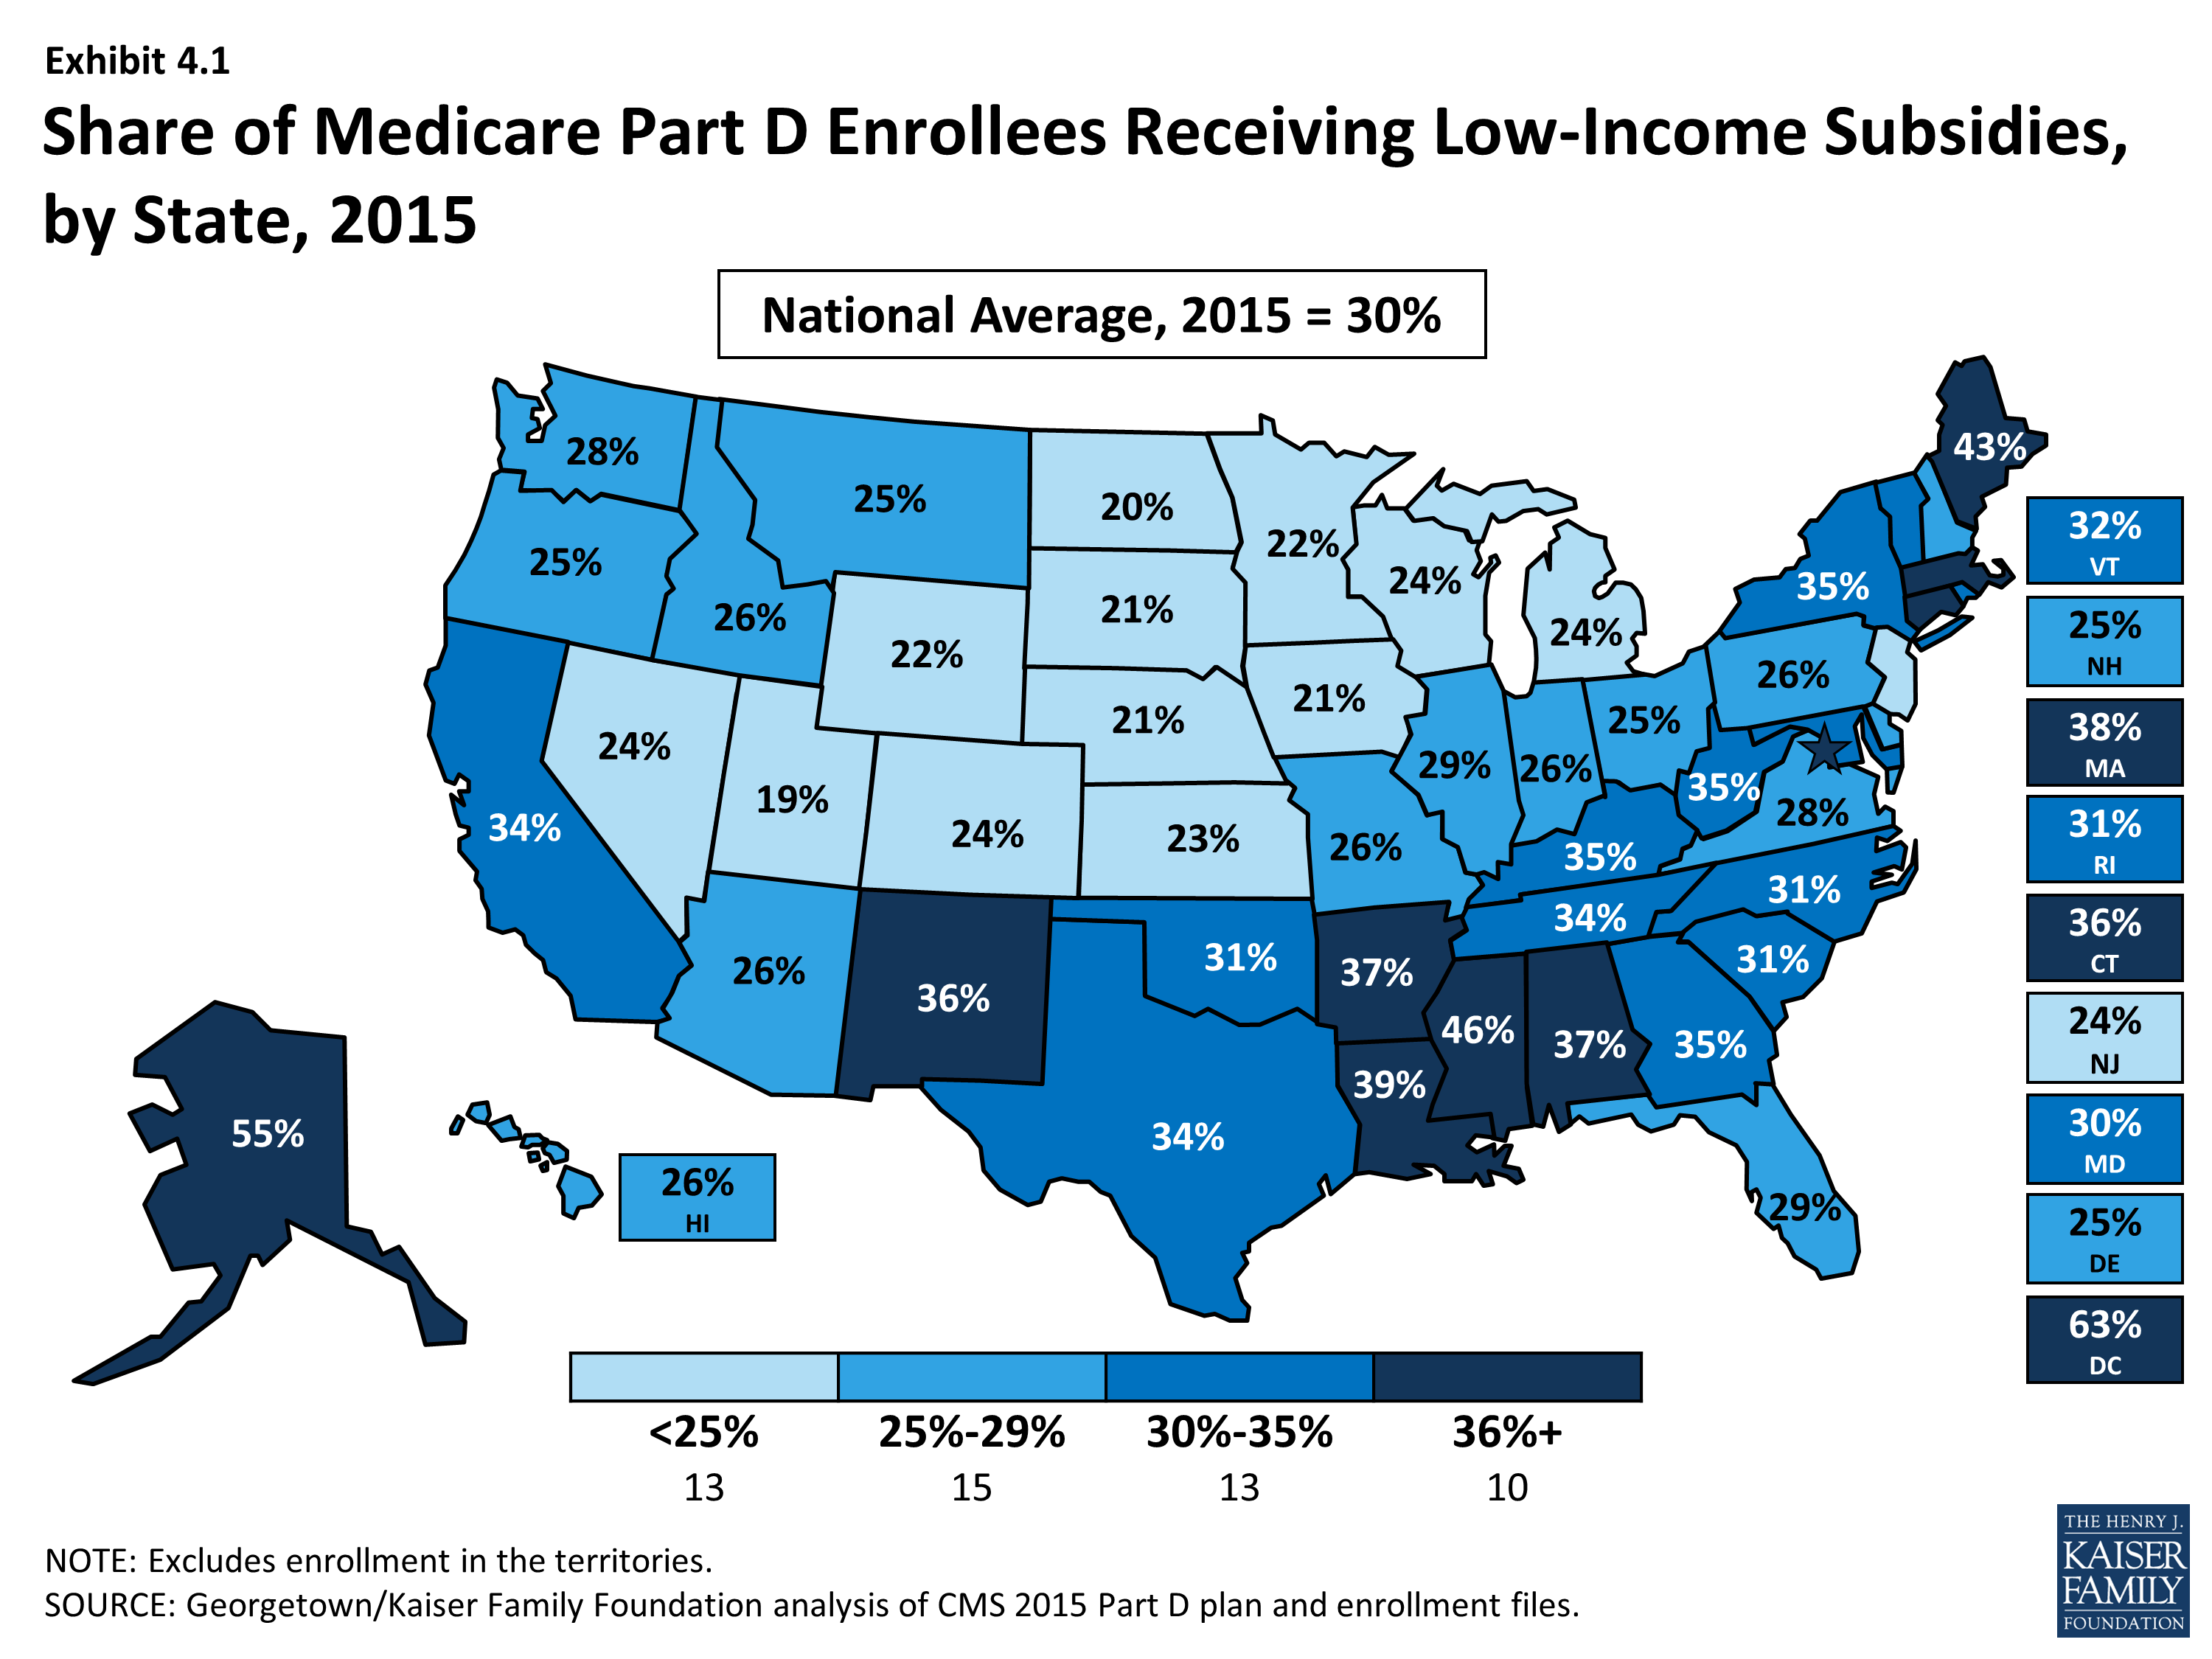
The share of LIS enrollees out of all Part D varies considerably by state (Exhibit 4.1). In several of the more rural western and midwestern states, fewer than 25 percent of Part D enrollees receive LIS subsidies. By contrast, over 40 percent of Part D enrollees are receiving the LIS in Alaska, the District of Columbia, Maine, and Mississippi. There is concern that many low-income beneficiaries are not receiving LIS, either because their assets exceed the limit, they are unaware of this benefit, or they had difficulty with the application.3
About two-thirds of LIS enrollees are enrolled in PDPs, and the remainder are in MA-PD plans. Of the 11.7 million LIS beneficiaries, 8.0 million are enrolled in PDPs and 3.7 million are in MA-PD plans. About half of the latter group (48 percent) are in traditional MA-PD plans, a small number (8 percent) are in Medicare-Medicaid plans (MMPs) participating in the financial alignment initiative (known as dual demo plans) or national PACE plans (1 percent) and the rest (43 percent) are in special needs plans (SNPs), a type of Medicare Advantage plan that limits membership to beneficiaries with specific diseases or characteristics. The most common type of SNP is restricted to dual eligibles.
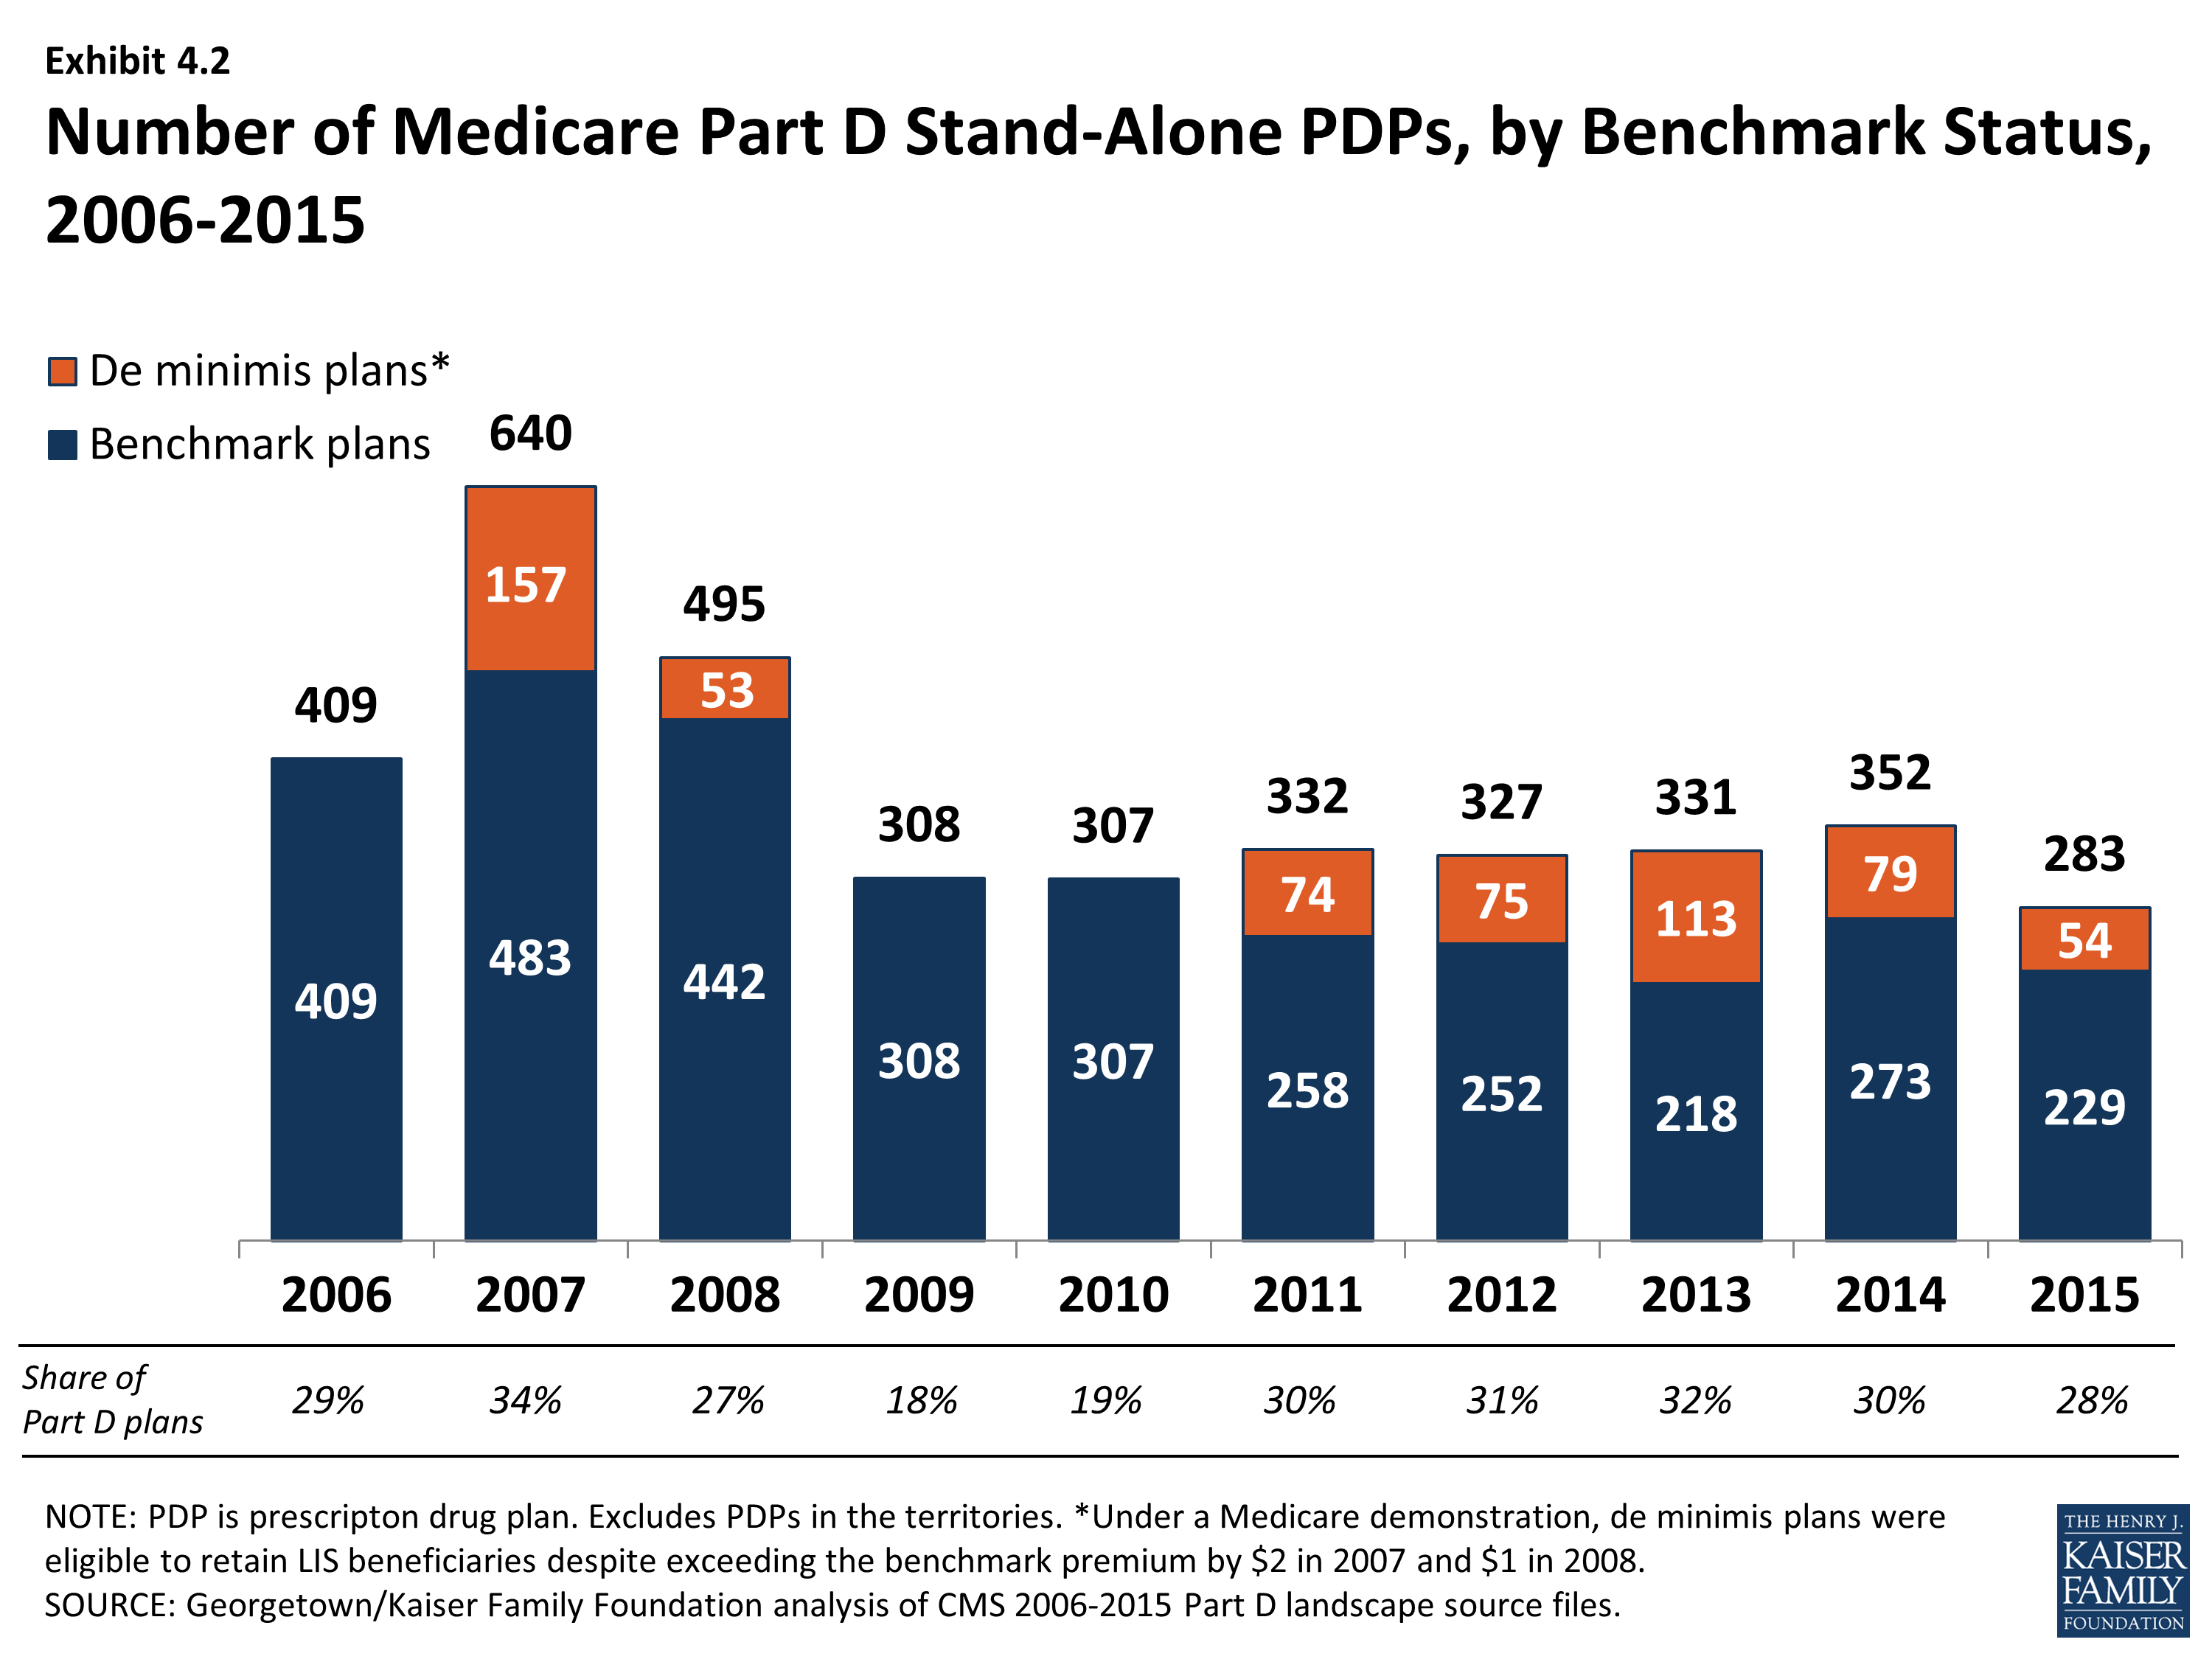
Fewer “benchmark” plans—those available to beneficiaries receiving Part D Low-Income Subsidies for no monthly premium—are available in 2015 than in any previous year, although they represent a somewhat higher percentage of all PDPs than in 2008 to 2010. The total number of benchmark plans for LIS enrollees nationwide is 283 in 2015, a decrease of 69 PDPs (20 percent) from the number of plans in 2014 (Exhibit 4.2). Several policies in place since 2011, including the “de minimis” policy that allows plans to waive a premium amount of up to $2 in order to retain their LIS enrollees, has kept the share of benchmark plans above the share of PDPs in 2009 and 2010, when that policy was not in effect. The number of LIS benchmark plans varies by region, ranging from 4 in Florida and Nevada to 12 in the Alabama/Tennessee, Arizona, and Idaho/Utah regions.
The benchmark plan market remains volatile, however. The benchmark plan market has changed considerably over the program’s eight years, which has generated significant instability for low-income enrollees. Of the 409 benchmark plans offered in 2006, only 9 plans have qualified as benchmark plans in every year since then. For a number of other plans, mergers interrupted continuous benchmark status, but the acquiring plan sponsor had a benchmark plan into which enrollees were transferred.4 Of the 352 benchmark plans available to LIS recipients for zero premium at the start of 2014, 78 lost benchmark status or exited the program in 2015, considerably more than the 46 that lost benchmark status between 2013 and 2014.5
Compared to recent years, benchmark plans are less dominated by LIS beneficiaries. In 2015, 70 percent of the enrollees in benchmark plans were LIS beneficiaries. In 2014, LIS enrollees represented 74 percent of all enrollees in benchmark plans, down from the peak of 84 percent in 2009 and 2010. By contrast, LIS beneficiaries represented only 25 percent of enrollees in basic-benefit plans that did not qualify as benchmark plans and 11 percent of enrollees in enhanced plans in 2015.
As of the open enrollment period for the 2015 plan year (October 15 to December 7, 2014), one of every five LIS beneficiaries (1.8 million) were enrolled in benchmark PDPs in 2014 that failed to qualify as benchmark plans in 2015. To address this issue in part, CMS randomly reassigned about 386,000 PDP beneficiaries to PDPs operated by different sponsors for the 2015 benefit year (another 39,000 shifted to other PDPs operated by the same sponsors).6
Most of the other LIS enrollees were not eligible for automatic reassignment by CMS because at some point they had switched plans on their own. The vast majority of LIS beneficiaries in this situation do not select new plans. Our analysis of plan switching by LIS beneficiaries found that only 14 percent of those in a non-benchmark plan and not eligible for reassignment by CMS elected to switch plans for 2010 (22 percent for 2009).7 Those who do switch nearly always elect a zero-premium plan, but most stay with their plan, despite the need to pay a premium.
Premiums for Low-Income Subsidy Enrollees
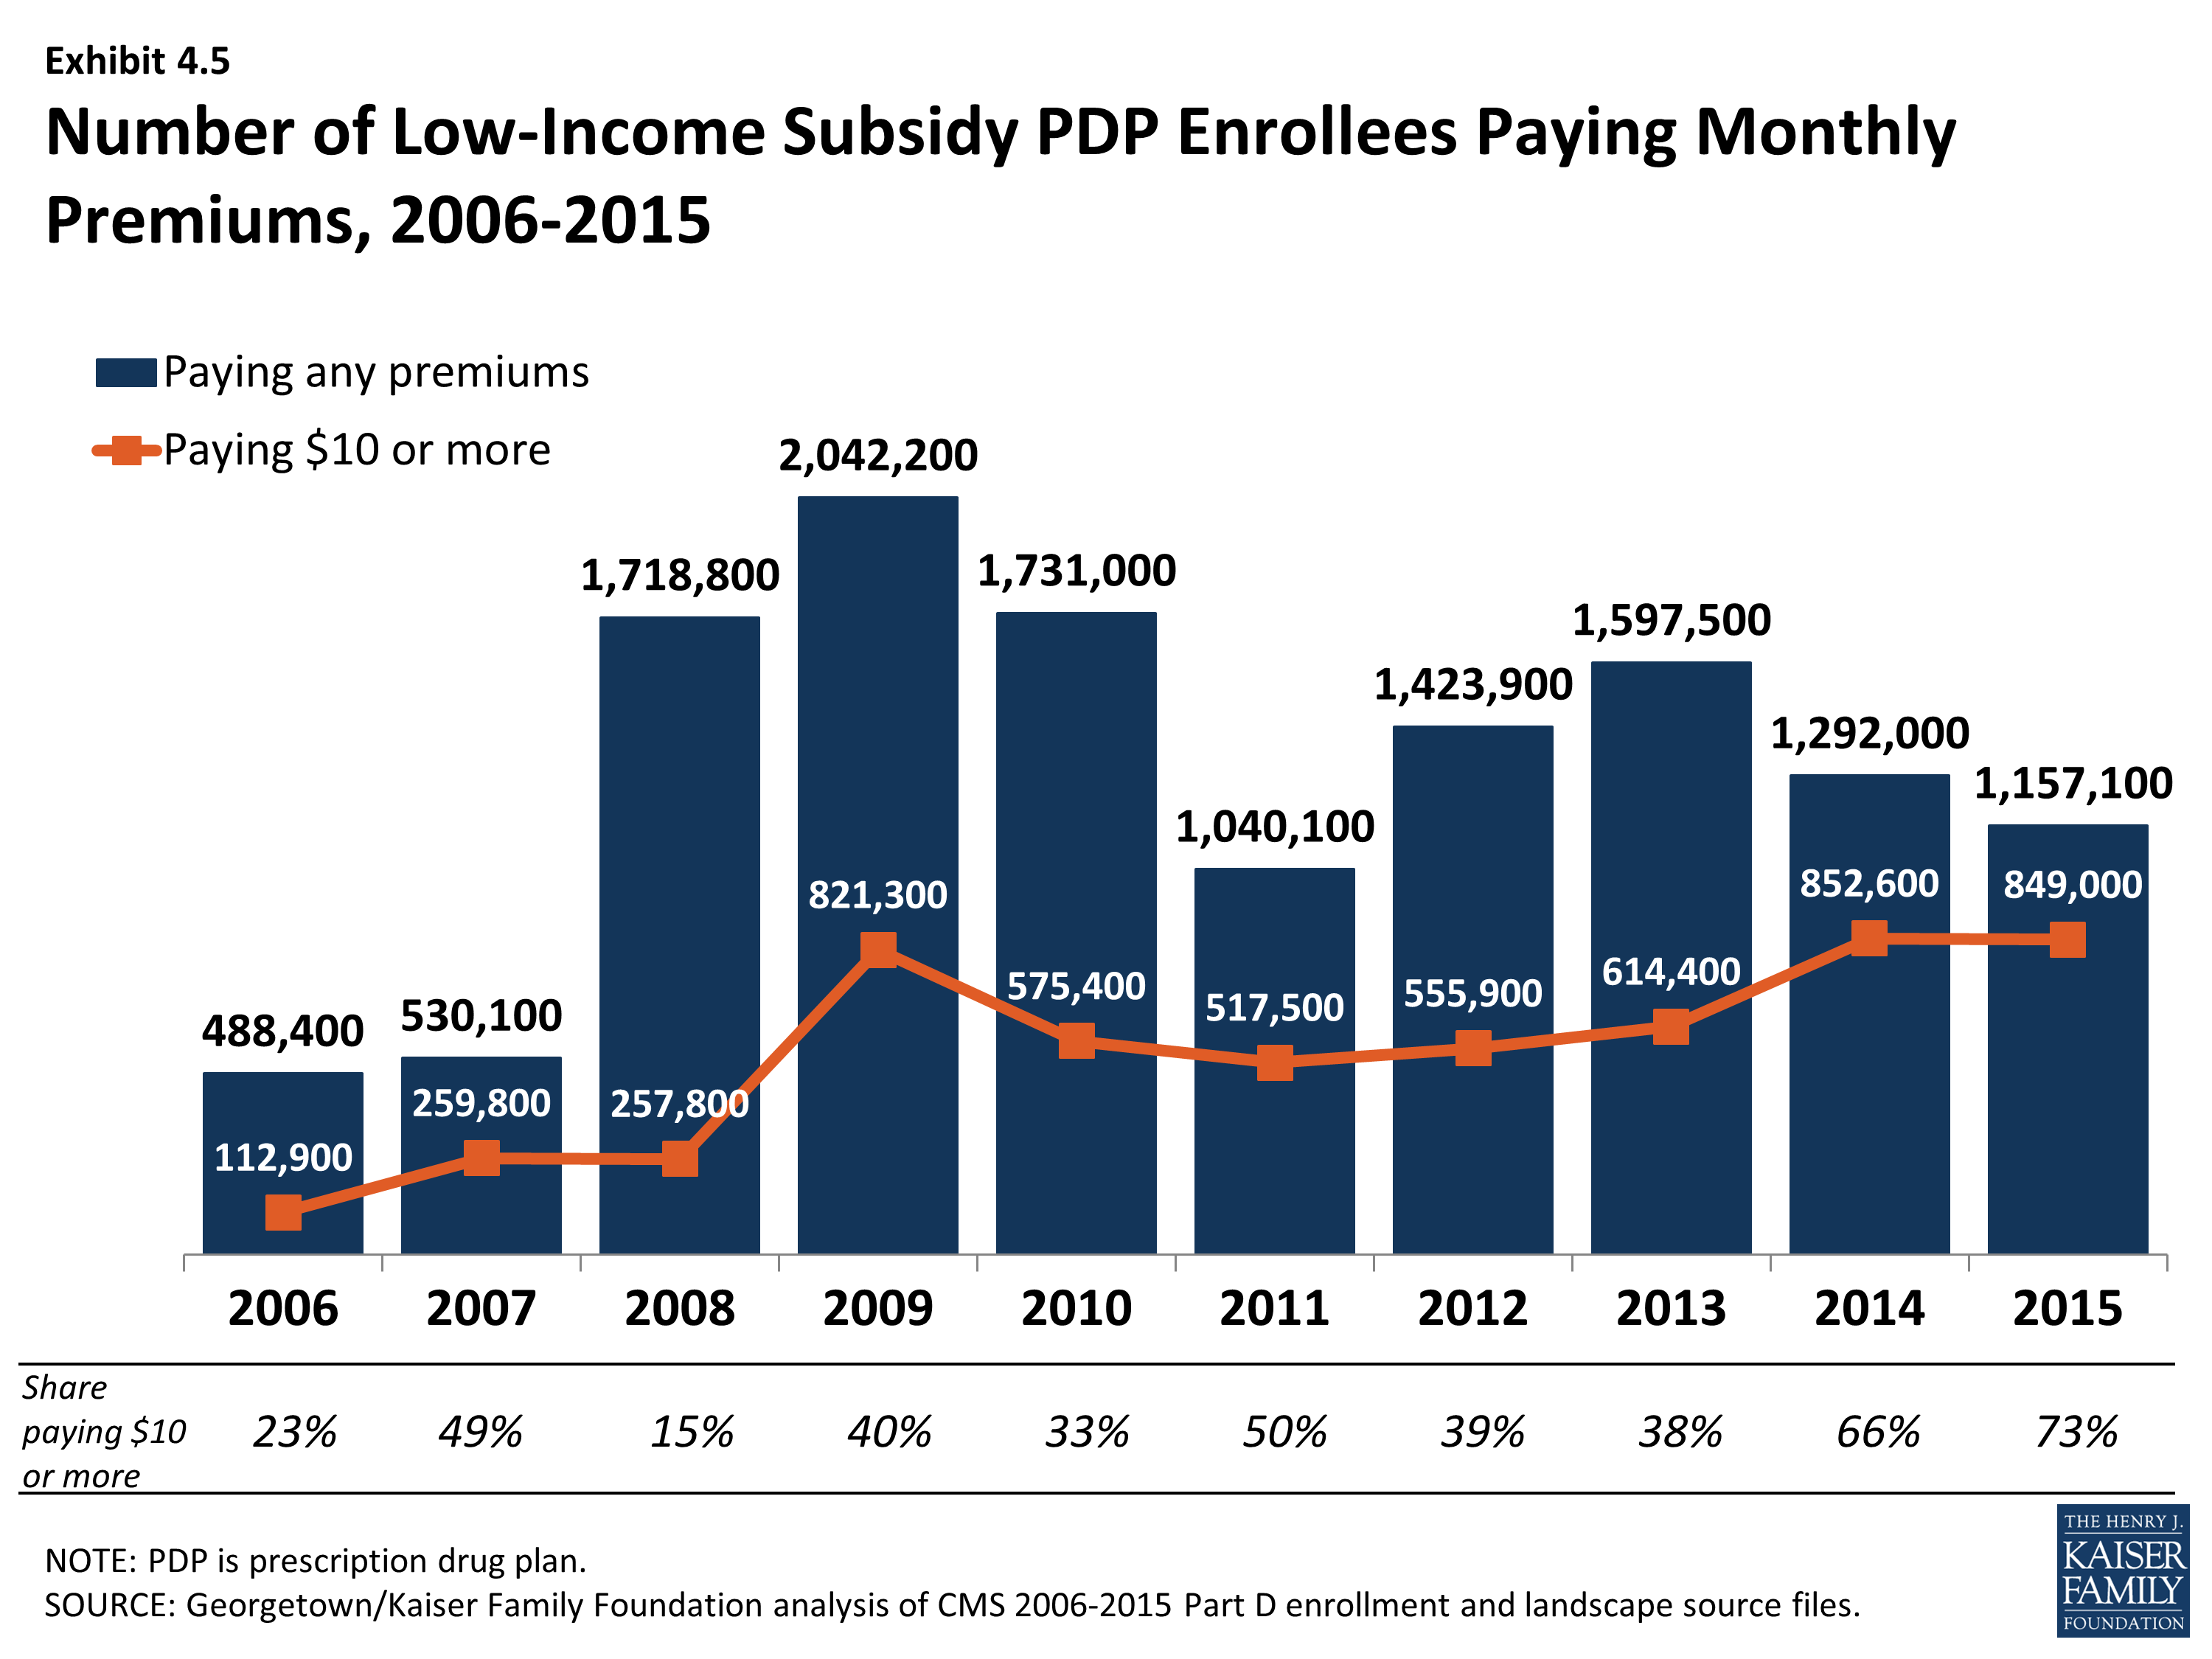
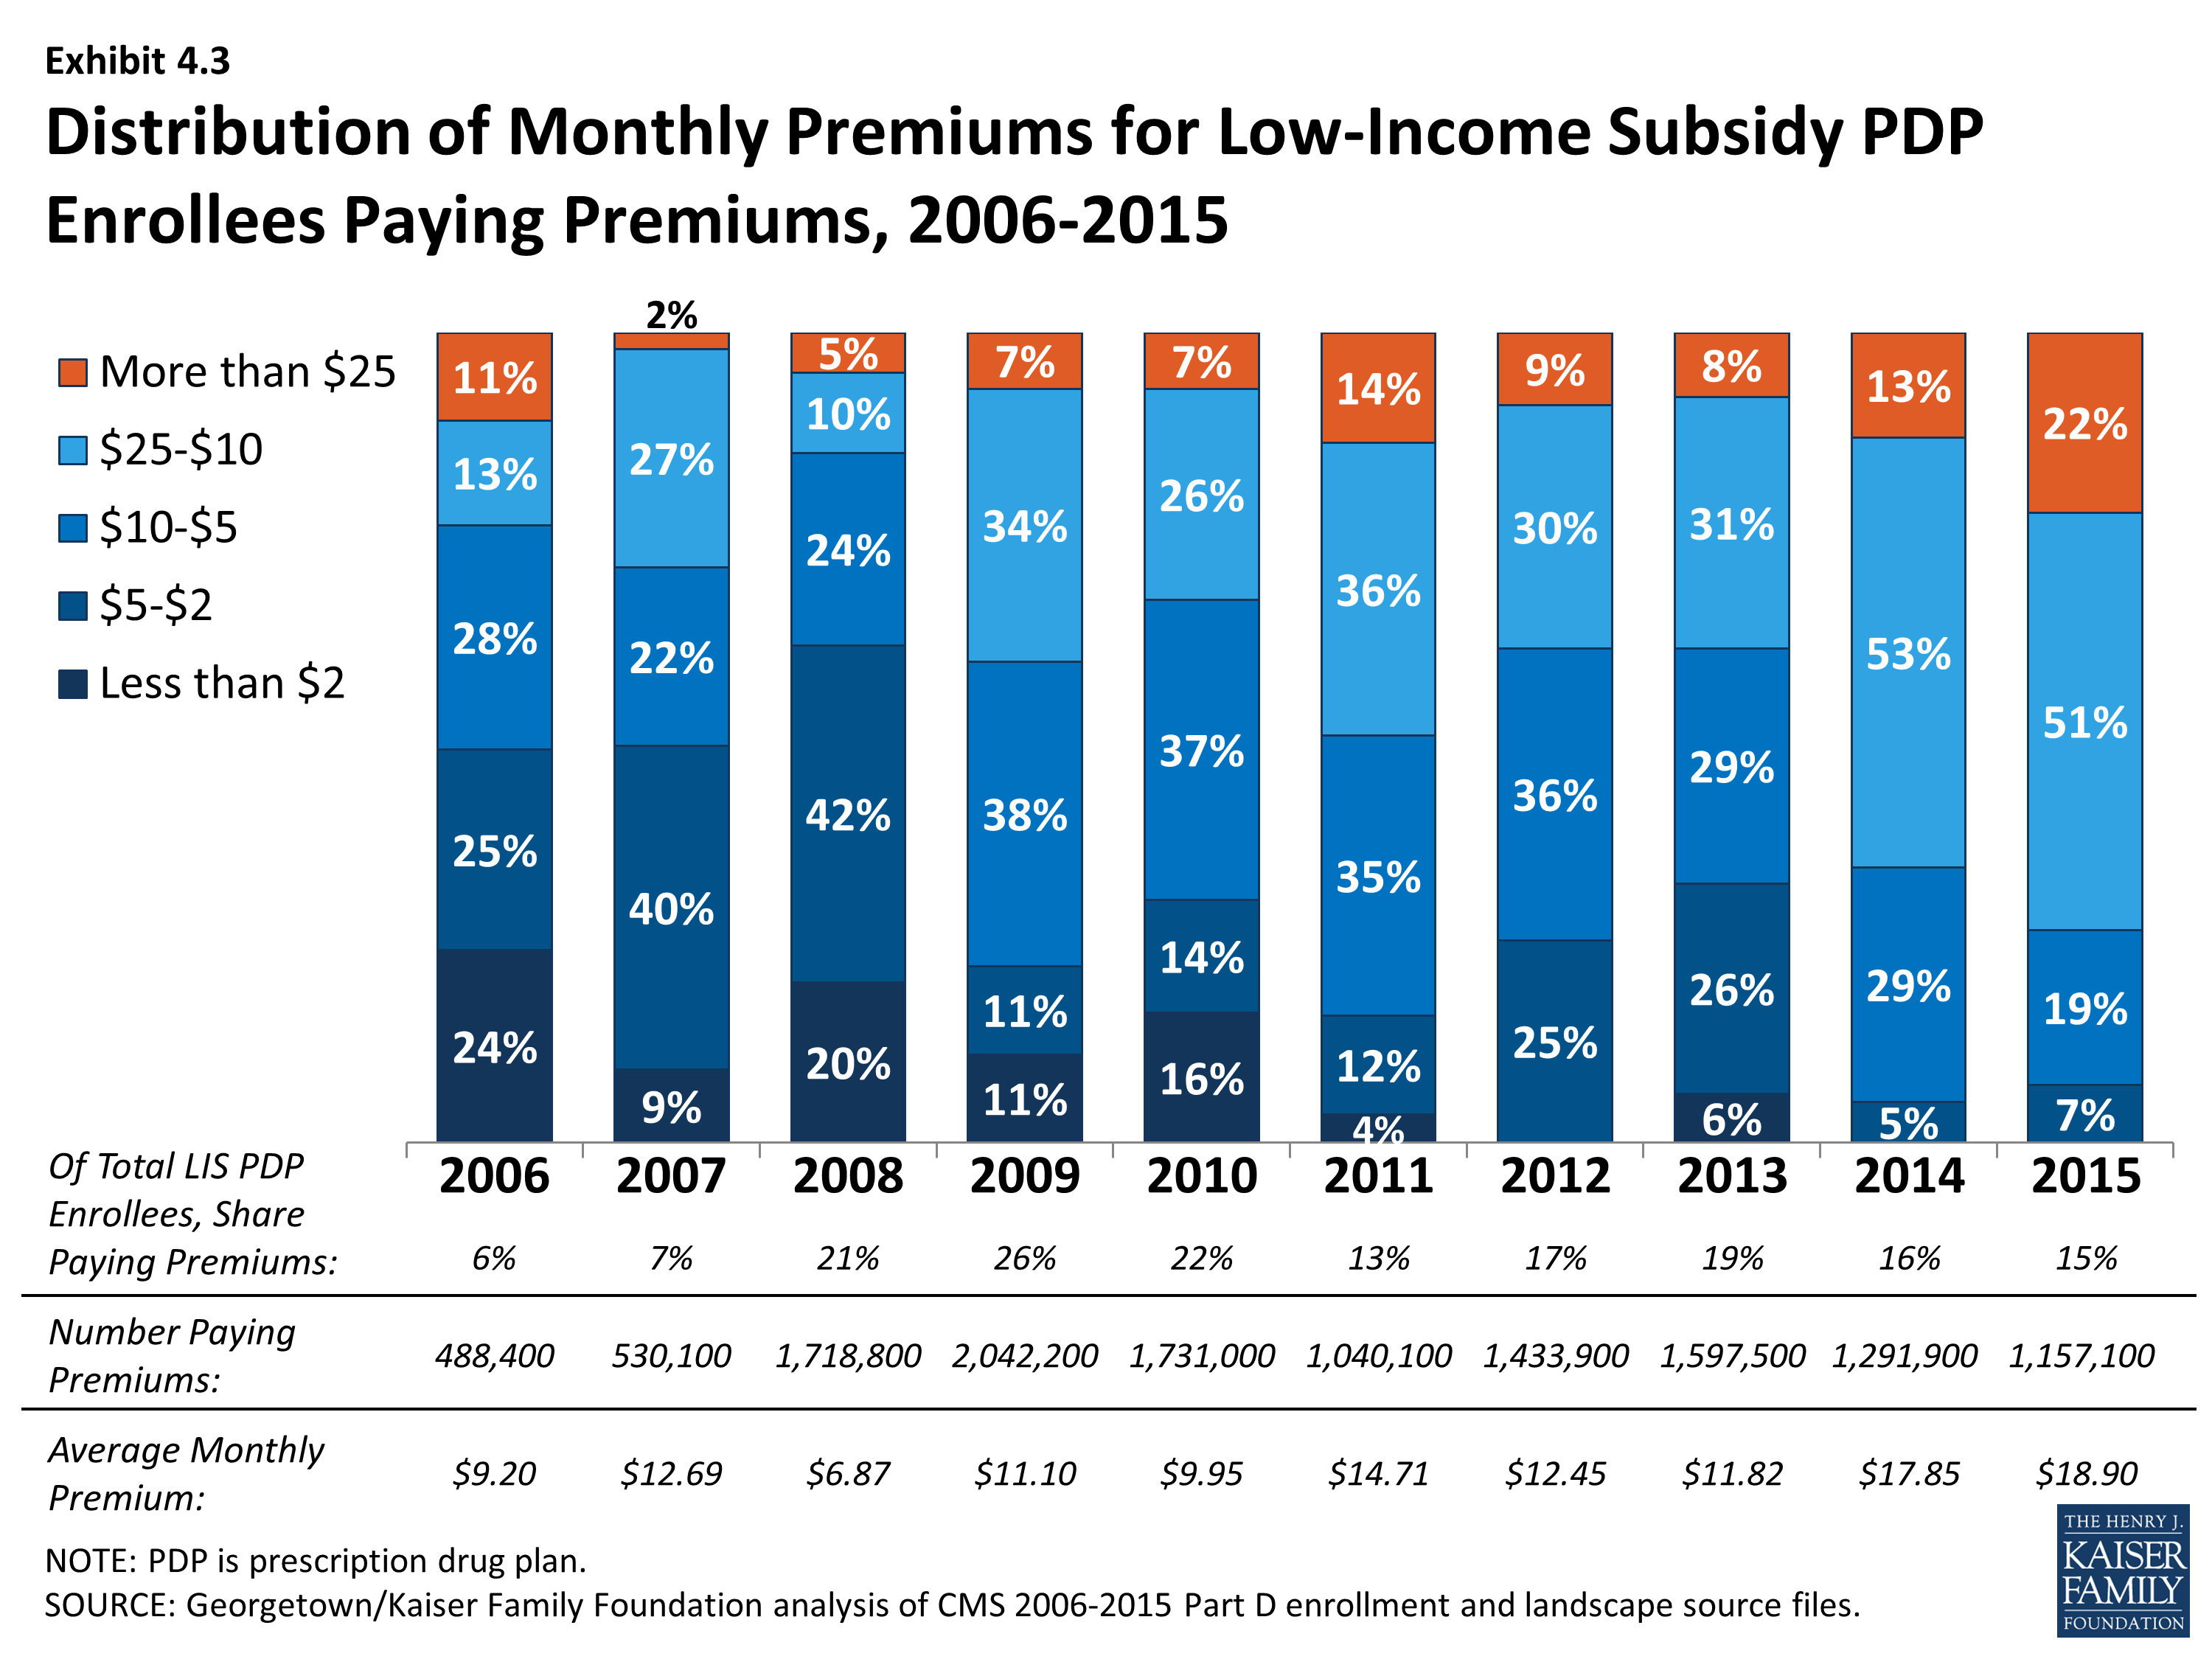
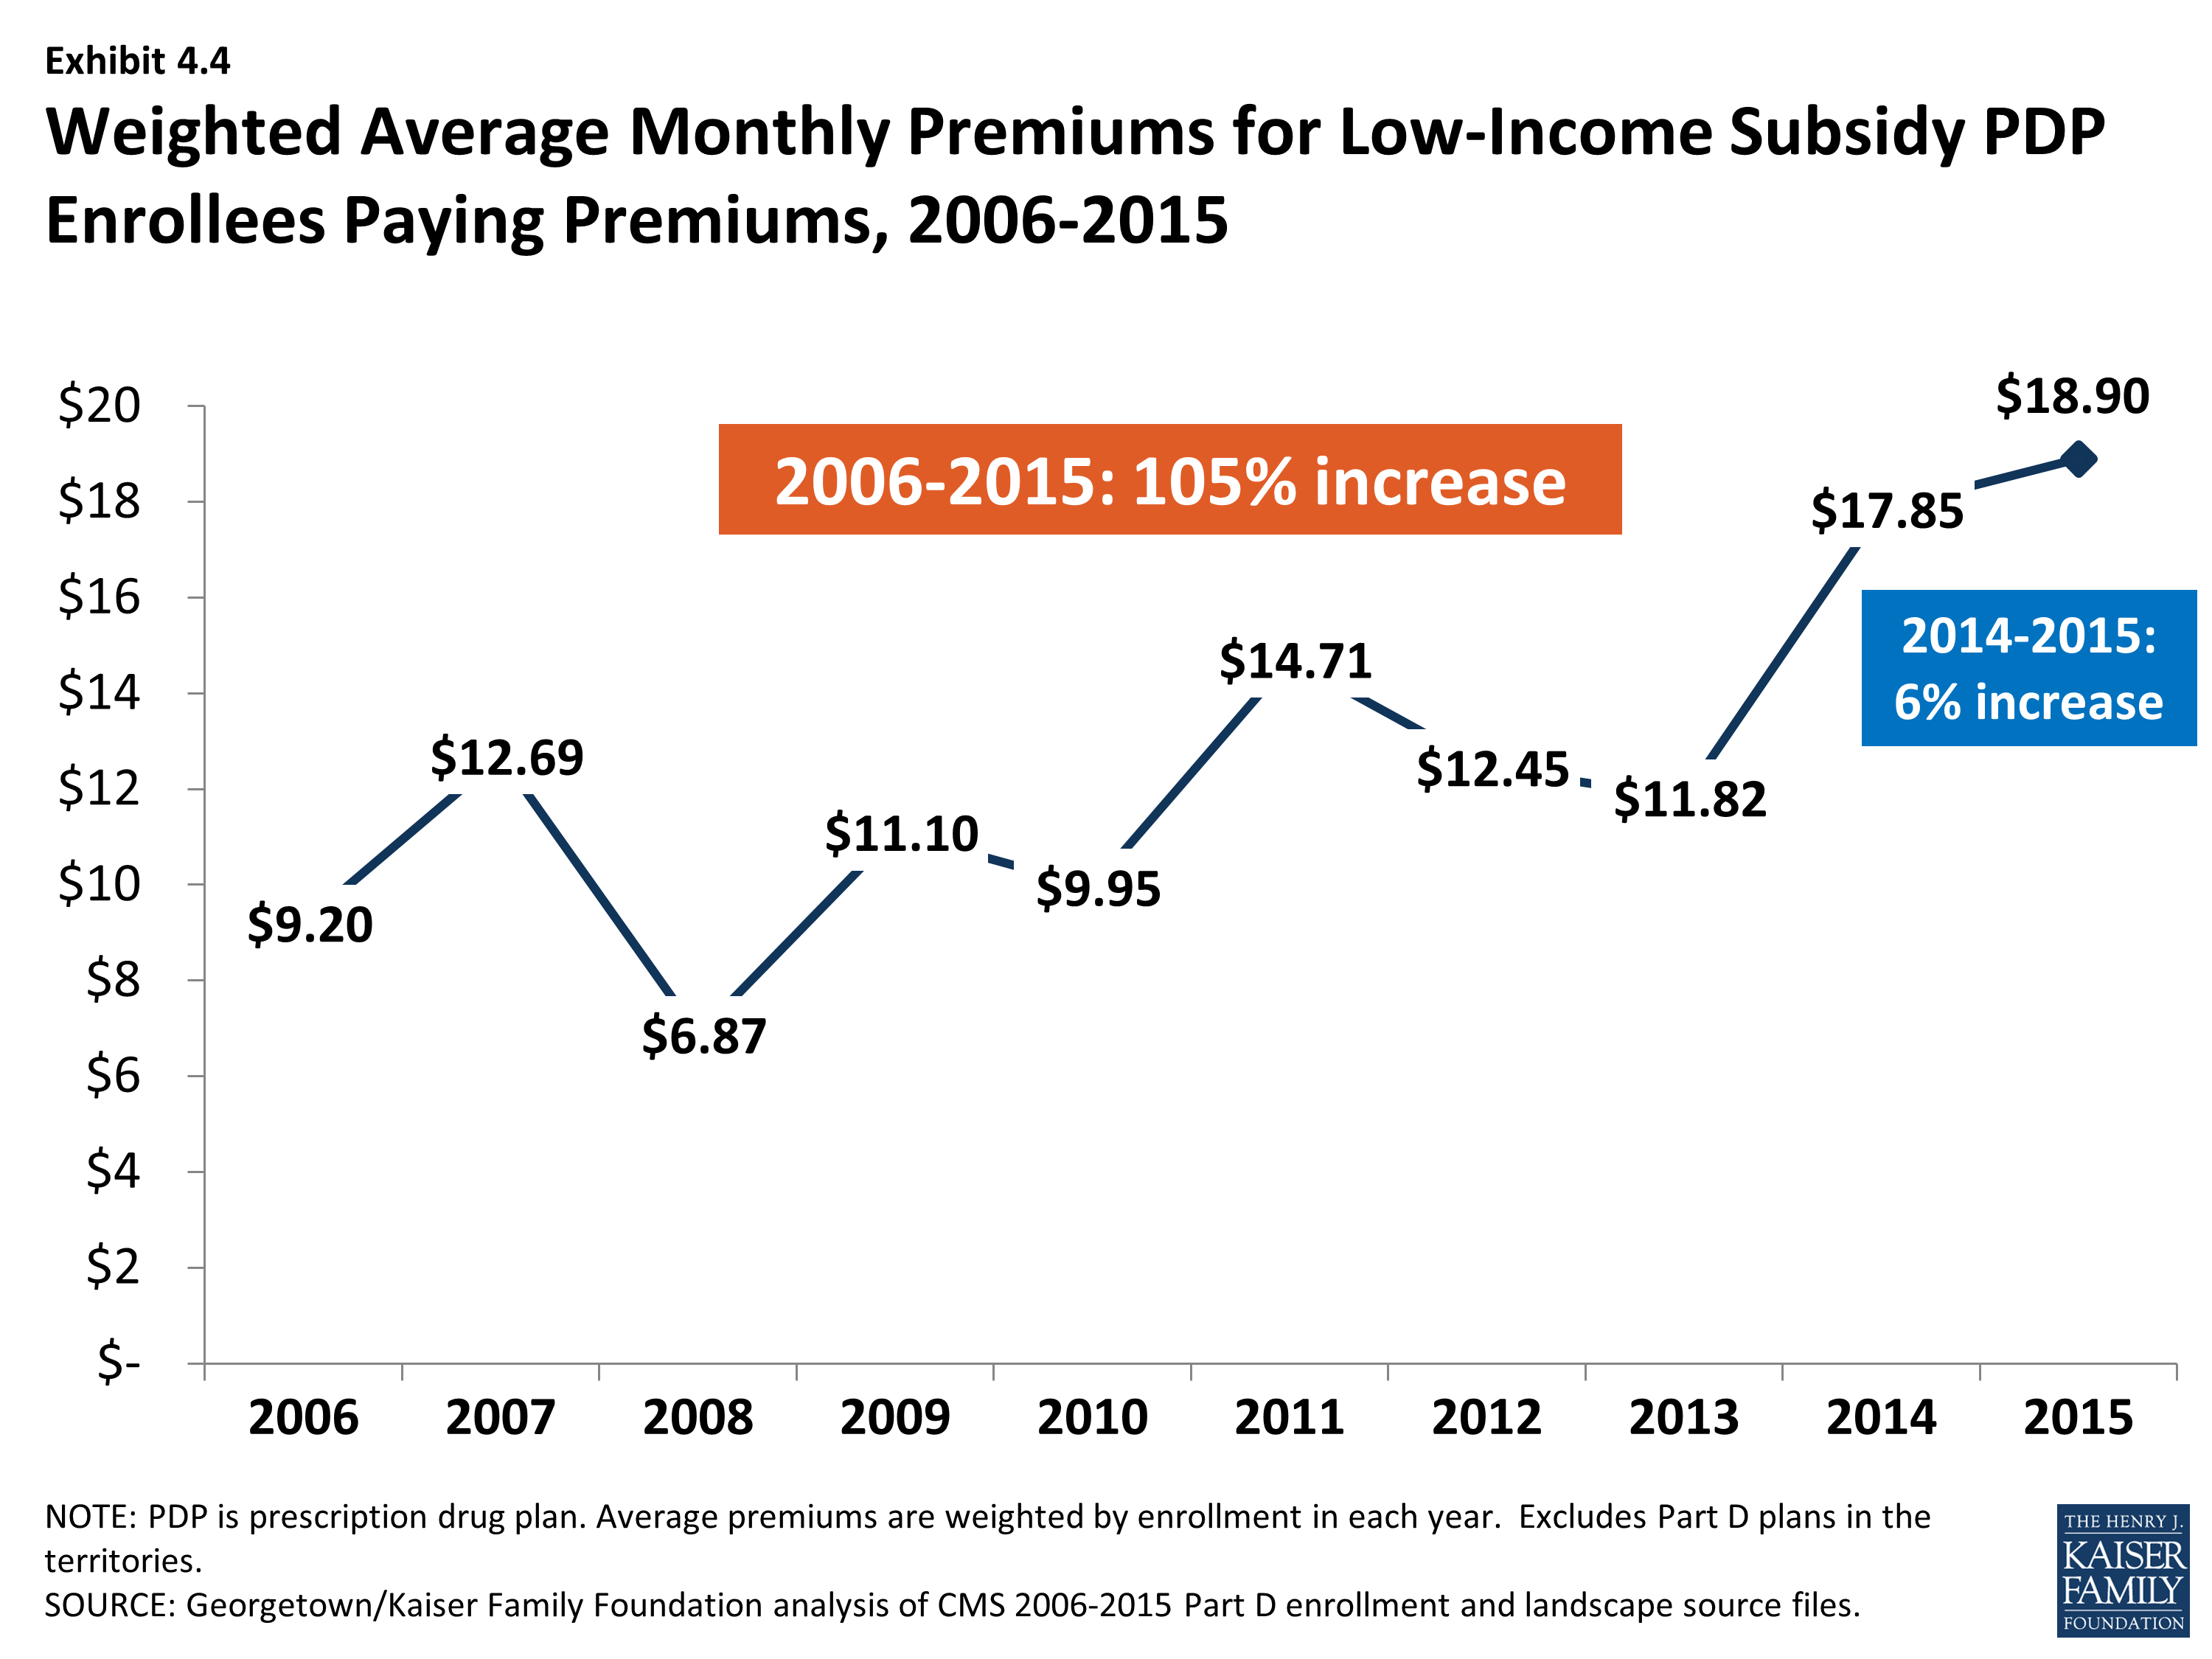
About 1.2 million LIS beneficiaries (15 percent of all LIS enrollees in PDPs) remain in non-benchmark PDPs in 2015 and are paying premiums for Part D coverage this year, a modest decrease from 2014 (Exhibit 4.3). The average monthly premium paid by these enrollees is $18.90—a 6 percent increase from 2014 but a 60 percent increase from 2013 (Exhibit 4.4). This amounts to over $225 annually in premium payments for beneficiaries whose incomes generally cannot exceed 135 percent of the federal poverty level. For beneficiaries not in benchmark plans, the federal government still pays the maximum subsidy amount for the beneficiary’s region of residence, as well as subsidies that lower cost sharing. But the government does not pay any amount above the benchmark, nor does it pay any portion of the premium that corresponds to enhanced benefits—even if the total Part D premium is below the benchmark.
The proportion of LIS beneficiaries in PDPs paying premiums rose from 6 percent in 2006 to 26 percent in 2009, declined to 13 percent in 2011, and was up to 15 percent in 2015 (Exhibit 4.3). Nearly half of the LIS beneficiaries paying premiums in 2015 are enrolled in the MedicareRx Preferred PDP offered by UnitedHealth, which lost benchmark status in all regions several years ago. Depending on the region, these 512,000 UnitedHealth enrollees are paying from $7.20 to $32.20 per month.
In addition to the LIS enrollees who pay premiums for their PDPs, another 381,000 LIS beneficiaries enrolled in MA-PD plans or SNPs pay a Part D premium. They represent 10 percent of all LIS beneficiaries enrolled in any type of MA-PD plan (21 percent of those in regular MA-PD plans). Altogether, 1.5 million beneficiaries or 13 percent of LIS beneficiaries in PDPs or MA-PD plans are paying a premium in 2015.
The de minimis premium waiver policy that allows 54 additional plans to qualify as benchmark PDPs in 2015 helps many LIS enrollees avoid disruption. Without the de minimis premium waiver, about 0.7 million LIS beneficiaries in these PDPs would either pay a small premium or would have been reassigned to different PDPs to avoid a premium.
About 849,000 LIS beneficiaries in PDPs are paying monthly premiums of $10 or more in 2015, representing nearly three-fourths of the 1.2 million LIS beneficiaries enrolled in PDPs who pay any premium (Exhibit 4.5). Another 159,000 LIS beneficiaries in MA-PD plans or SNPs also pay premiums of $10 or more in 2015. Thus, a total of 1.0 million LIS beneficiaries are paying at least $10 monthly. It is possible that the LIS enrollees who pay a premium to enroll in these plans do so because of formulary or other individual considerations; another possibility, however, is that these enrollees are not reevaluating their plan options each year, even when it could save them money. It may be that they do not know that there are zero-premium plans available to them or have been unable to navigate the process of switching plans to avoid paying a premium.
Share of Medicare Part D Enrollees Receiving Low-Income Subsidies, by State, 2015
Number of Medicare Part D Stand-Alone PDPs, by Benchmark Status, 2006-2015
Distribution of Monthly Premiums for Low-Income Subsidy PDP Enrollees Paying Premiums, 2006-2015
Weighted Average Monthly Premiums for Low-Income Subsidy PDP Enrollees Paying Premiums, 2006-2015