Kaiser Health Tracking Poll - May 2017: The AHCA's Proposed Changes to Health Care
Findings
KEY FINDINGS:
- With Congress currently discussing the American Health Care Act (AHCA), a plan that would repeal and replace the 2010 health care law, this month’s Kaiser Health Tracking Poll finds that more Americans have an unfavorable view of the plan than a favorable one (55 percent vs. 31 percent, respectively). The share with favorable views of the AHCA is about 20 percentage points lower than the share with favorable views (49 percent) of the 2010 Affordable Care Act (ACA). The majority of Republicans (67 percent) have a favorable view of the AHCA.
- This month’s survey finds the public has increasingly negative views of how their health care will be affected by proposed changes. In December 2016, after the presidential election but before the release of the Republican plan, less than one-third of the public thought their health care would get worse if the 2010 health care law was repealed. This month’s survey, fielded after House Republicans passed the AHCA, finds larger shares say the cost of health care for them and their family (45 percent), their ability to get and keep health insurance (34 percent), and the quality of their own health care will get worse if Congress passes the AHCA (34 percent).
- About one in ten (8 percent) think the Senate should pass the AHCA as is, without making any changes to the plan passed by the House. Similar shares – about one-fourth of the public – think the Senate should make either major changes to the legislation (26 percent) or minor changes to it (24 percent), while about three in ten (29 percent) say they do not think the Senate should pass this bill.
The American Health Care Act
On May 4, 2017, the U.S. House of Representatives passed the American Health Care Act (AHCA), the House Republicans’ plan to repeal and replace the Affordable Care Act (ACA).1 With the Senate currently debating the plan and discussing their own approach, the most recent Kaiser Health Tracking Poll finds more Americans have an unfavorable view of the AHCA than a favorable one (55 percent vs. 31 percent, respectively). There is also a considerable enthusiasm gap with a larger share saying that they have a “very unfavorable” view (40 percent) than saying they have a “very favorable” view (12 percent).
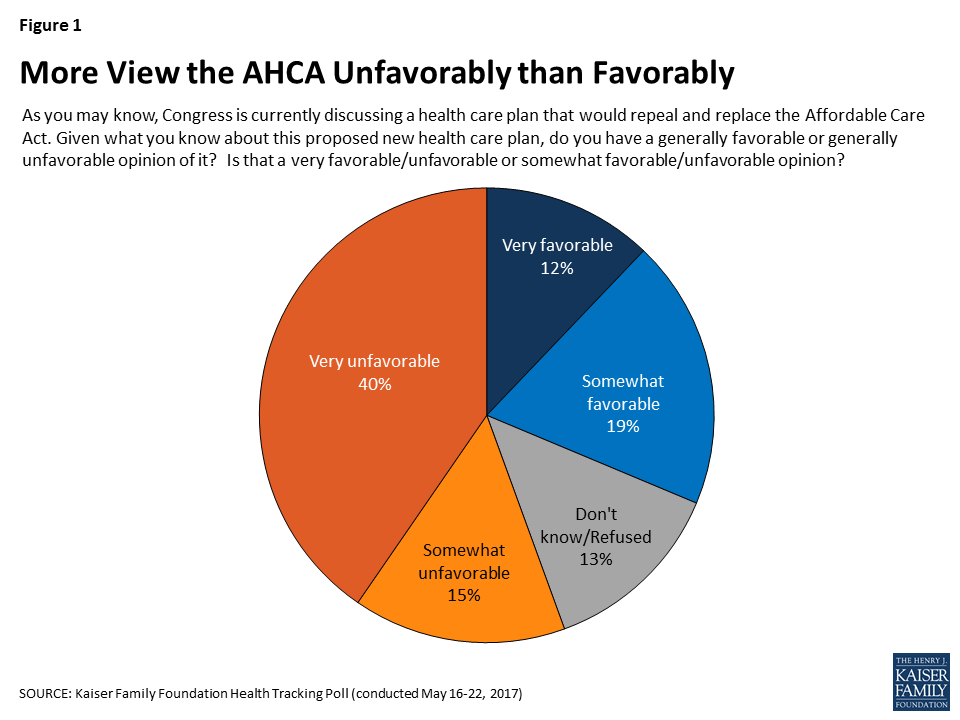
Figure 1: More View the AHCA Unfavorably than Favorably
Majority of Republicans Hold A Favorable View of the AHCA
The AHCA has solid support among the Republican base. Two-thirds of Republicans say they have a favorable view of the plan including three in ten (29 percent) who say they have a “very favorable” view.
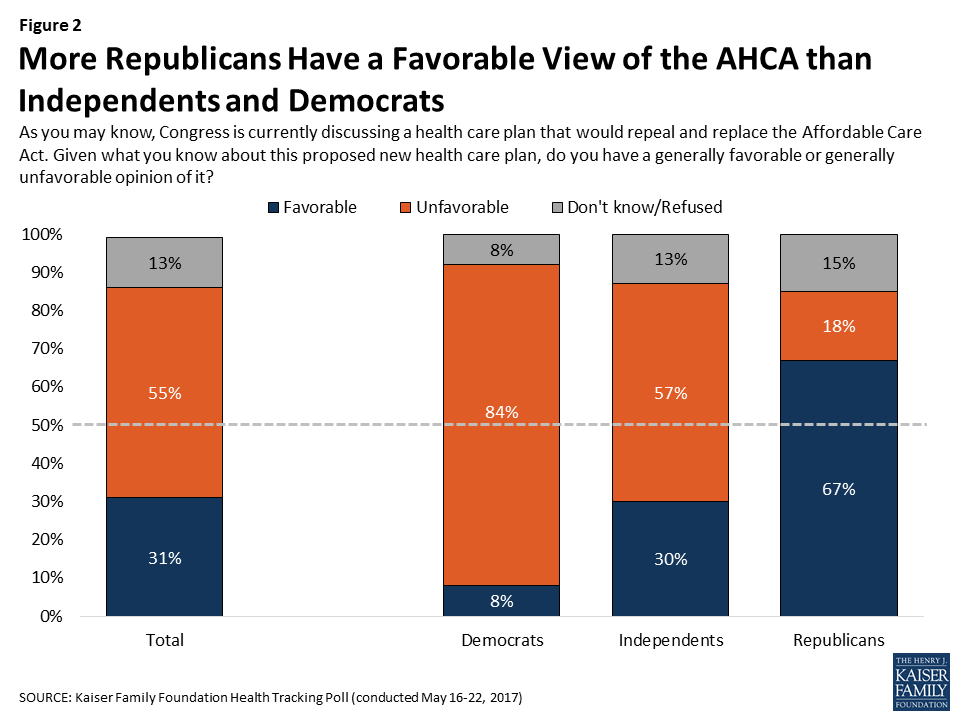
Figure 2: More Republicans Have a Favorable View of the AHCA than Independents and Democrats
Few See AHCA As Fulfilling President Trump’s Promises About Health Care
Three-fourths (76 percent) of the public thinks the health care plan recently passed by the House does not fulfill most of the promises President Trump has made about health care while 14 percent say it fulfills most or all of his promises.
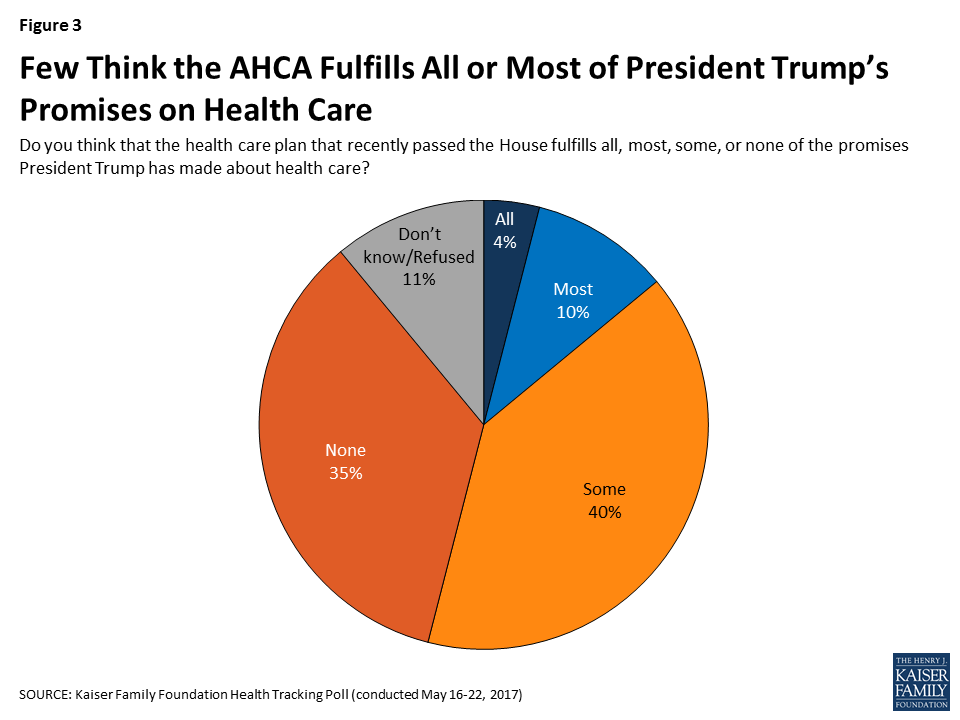
Figure 3: Few Think the AHCA Fulfills All or Most of President Trump’s Promises on Health Care
This viewpoint is shared regardless of party identification with majorities of Democrats (86 percent), independents (79 percent), and Republicans (59 percent) saying the AHCA fulfills some or none of the promises President Trump has made about health care.
|
Table 1: Majorities of Democrats, Independents, and Republicans
Do Not Think the AHCA Fulfills Most of President Trump’s Health Care Promises
|
||||
| Do you think that the health care plan that recently passed the House fulfills all, most, some, or none of the promises President Trump has made about health care? | Total | Democrats | Independents | Republicans |
| All/Most (NET) | 14% | 8% | 11% | 30% |
| All | 4 | 3 | 4 | 6 |
| Most | 10 | 4 | 7 | 24 |
| Some/None (NET) | 76 | 86 | 79 | 59 |
| Some | 40 | 27 | 46 | 51 |
| None | 35 | 59 | 33 | 8 |
| Don’t know/Refused | 11 | 7 | 10 | 12 |
More Americans View The ACA Favorably Than The AHCA
The Kaiser Family Foundation has been tracking public opinion on the ACA since its passage in 2010. This month’s survey continues to find the public leans more favorable than unfavorable in their views of the 2010 health care law, with 49 percent expressing a favorable view of the ACA compared to 42 perecent expressing an unfavorable view.

Figure 4: Public Continues to Lean Favorable in Views of ACA
In fact, more of the public is favorable in their overall views of the ACA than in their views of the Republican plan to replace the 2010 health care law. About half of Americans have a favorable view of the ACA compared to about three in ten who have a favorable view of the new Republican plan.
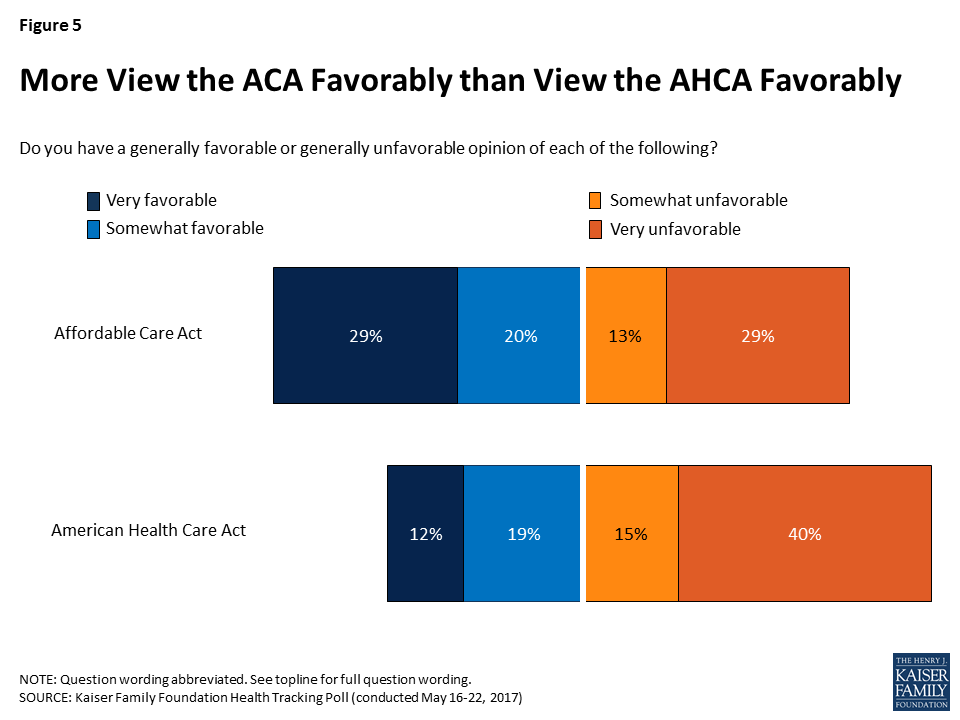
Figure 5: More View the ACA Favorably than View the AHCA Favorably
Partisanship is the main driver behind support for either the ACA or the AHCA, with a majority of Republicans viewing the AHCA favorably (67 percent), while a majority of Democrats view the ACA favorably (78 percent). More independents view the ACA favorably (48 percent) than view the AHCA favorably (30 percent).
Despite the lack of support for the House Republican plan, a majority of the public (74 percent) say they think it is either “very likely” (37 percent) or “somewhat likely” (36 percent) that the president and Congress will repeal and replace the ACA. About one-fourth of the public say it is either “not too likely” (15 percent) or “not likely at all” (9 percent).

Figure 6: Three-Fourths of the Public Say They Think It’s Likely that the President and Congress Will Repeal and Replace the ACA
Most Americans Want Changes to the AHCA Before Senate Passes the Bill
About one in ten (8 percent) think the Senate should pass the AHCA as is, without making any changes to the plan passed by the House. Similar shares – about one-fourth of the public – think the Senate should make either major changes to the legislation (26 percent) or minor changes to it (24 percent), while about three in ten say they do not think the Senate should pass this bill.
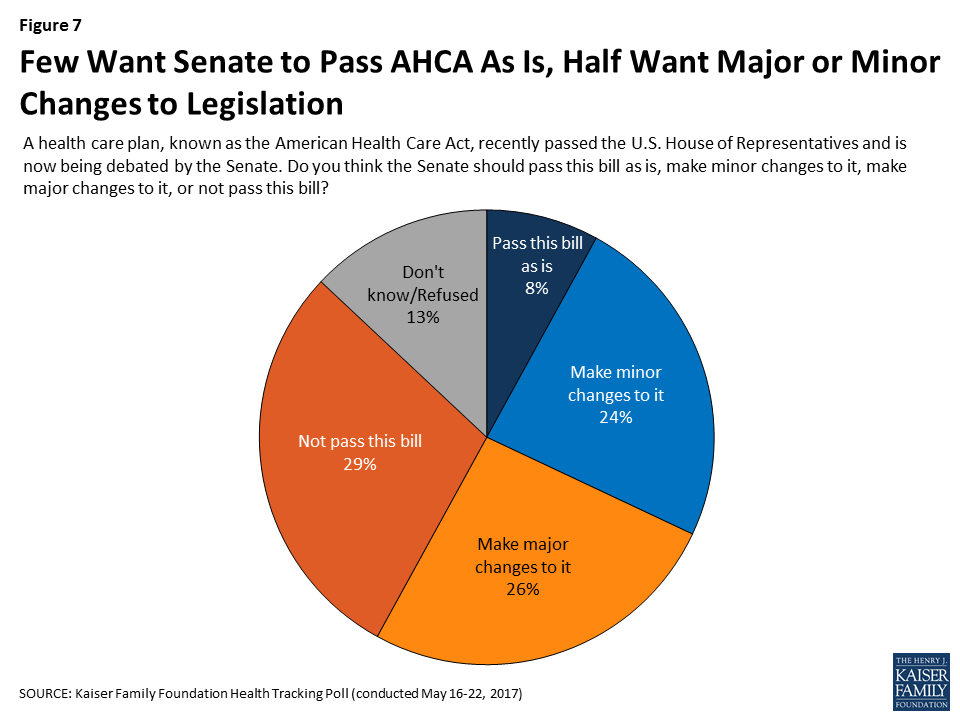
Figure 7: Few Want Senate to Pass AHCA As Is, Half Want Major or Minor Changes to Legislation
Attitudes toward what the Senate should do when it comes to the AHCA are largely driven by partisanship with most Republicans (60 percent) saying they think it should pass as is (15 percent) or with minor changes (45 percent) while half of Democrats (51 percent) say the Senate should not pass this bill. Independents are more divided but one-third (34 percent) say the Senate should make major changes to the bill.
| Table 2: Most Republicans Want the Senate to Pass Bill As Is or Make Minor Changes to It, While Democrats Do Not Want the Senate to Pass It | ||||
| A health care plan, known as the American Health Care Act, recently passed the U.S. House of Representatives and is now being debated by the Senate. Do you think the Senate should pass this bill as is, make minor changes to it, make major changes to it, or not pass this bill? | Total | Democrats | Independents | Republicans |
| Pass this bill as is | 8% | 6% | 5% | 15% |
| Make minor changes to it | 24 | 15 | 22 | 45 |
| Make major changes to it | 26 | 22 | 34 | 17 |
| Not pass this bill | 29 | 51 | 25 | 5 |
| Don’t know/Refused | 13 | 7 | 14 | 17 |
Attitudes Towards AHCA Provisions
The AHCA – like other health care plans – includes complex policies that the public may not fully understand or pay attention to. In an effort to examine general attitudes towards several of the more well-known provisions, we ask respondents whether after hearing about the specific provision they are “more likely” or “less likely” to support the plan. Much like overall attitudes towards the AHCA, various provisions of the law asked about in this survey do not garner large levels of support from the public. When asked whether individual elements of the Republican replacement plan would make them “more likely” or “less likely” to support the plan, none of the elements receive a majority of the public saying it would make them “more likely” to support it. The only provision that has a larger share of the public saying it makes them “more likely” than say it makes them “less likely” to support the law is allowing states to implement a Medicaid work requirement (42 percent compared to 28 percent).
There are several provisions currently included in the plan that a majority of the public say makes them “less likely” to support the legislation. These include allowing states to decide if health insurance companies can charge sick people more than healthy people if they haven’t had continuous coverage (65 percent), eliminating the individual mandate and instead allowing insurance companies to charge people 30% higher premiums for a year if they haven’t had continuous coverage (62 percent), allowing states to eliminate the essential health benefit requirement (60 percent), and making changes that would generally decrease what younger people pay for insurance and increase what older people pay (58 percent).
| Table 3: Individual Elements of AHCA Affect Likelihood of Support for Plan | |||
| I’m going to read you several specific elements included in the health care plan that passed the House. Please tell me if each makes you more or less likely to support the plan, or does not make much difference. | More likely to support | Less likely to support | Does not make much difference |
| Allows states to require adults without disabilities to be working or looking for work in order to get health insurance through Medicaid | 42% | 28% | 27% |
| Provides federal funding for states to cover people with pre-existing conditions through separate high-risk pools | 36 | 32 | 31 |
| Cuts federal funding that was included in the 2010 health care law for states that expanded Medicaid to cover more lower-income people | 23 | 43 | 34 |
| Changes Medicaid so that instead of matching state spending, the federal government reduces what it pays states and gives states more flexibility to decide who and what services to cover | 23 | 42 | 32 |
| Stops federal payments to Planned Parenthood clinics for health care services provided to people on Medicaid for one year | 22 | 48 | 30 |
| Allows states to let health insurance companies cut back on the benefits they cover so they could sell cheaper plans that do not cover benefits like hospitalization, prescription drugs, maternity care, and mental health services | 20 | 60 | 20 |
| Eliminates the taxes and tax increases on higher-income people imposed by the Affordable Care Act | 18 | 49 | 30 |
| Decreases the financial help available to lower-income people who buy their own insurance and increases the financial help available to middle- and upper-income people | 15 | 51 | 32 |
| Makes changes that would generally decrease what younger people pay for insurance and increase what older people pay | 14 | 58 | 28 |
| Allows states to decide if health insurance companies can charge sick people more than healthy people if they haven’t had continuous coverage | 12 | 65 | 22 |
| Eliminates the requirement for nearly all Americans to have health insurance but allows insurance companies to charge people 30% higher premiums for a year if they haven’t had continuous coverage | 12 | 62 | 24 |
| NOTE: Items asked of half samples. Don’t know/Refused responses not shown. | |||
Republican Support for Some Aspects of the AHCA
There is some support for aspects of the AHCA among Republicans. For example, a majority of Republicans say that the Medicaid work requirement (75 percent) and federal funding for states to set up high-risk pools (59 percent) makes them more likely to support the plan. In addition, about four in ten Republicans say the same about the provisions which stop federal Medicaid payments to Planned Parenthood (45 percent), change Medicaid funding to a per capita cap or block grant system (45 percent), allow states to change the essential health benefits (42 percent), and end the funding for Medicaid expansion (40 percent).

Figure 8: Some AHCA Provisions Popular Among Republicans
Perceived Effects of the AHCA
Overall, about half of Americans say the quality of their own health care (48 percent) and their own ability to get and keep health insurance (47 percent) will stay about the same if the president and Congress pass the health care plan currently being discussed. When it comes to the cost of health care for them and their family, almost half say it will get worse (45 percent) while about one-third say it will stay about the same (36 percent) and 16 percent say it will get better.
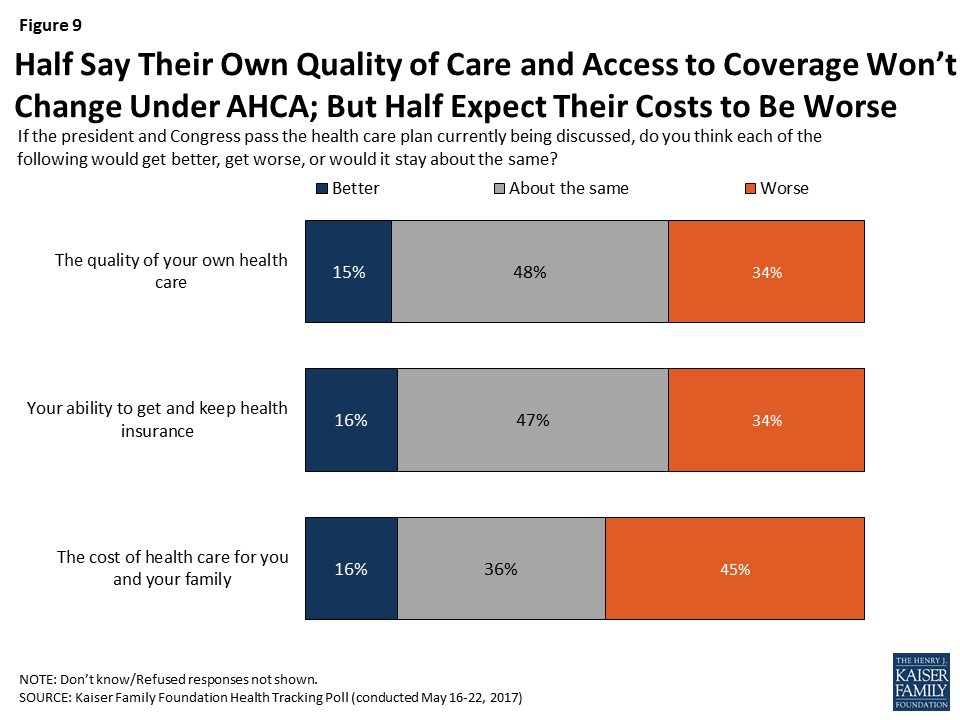
Figure 9: Half Say Their Own Quality of Care and Access to Coverage Won’t Change Under AHCA; But Half Expect Their Costs to Be Worse
Immediately following the 2016 presidential election and prior to the release of the Republican plan, most Americans thought that their health care would stay about the same if the 2010 health care law was repealed. Yet, in this month’s survey which was fielded after House Republicans passed the AHCA, larger shares say the cost of health care for them and their family, their ability to get and keep health insurance, and the quality of their own health care will get worse if Congress passes the AHCA.
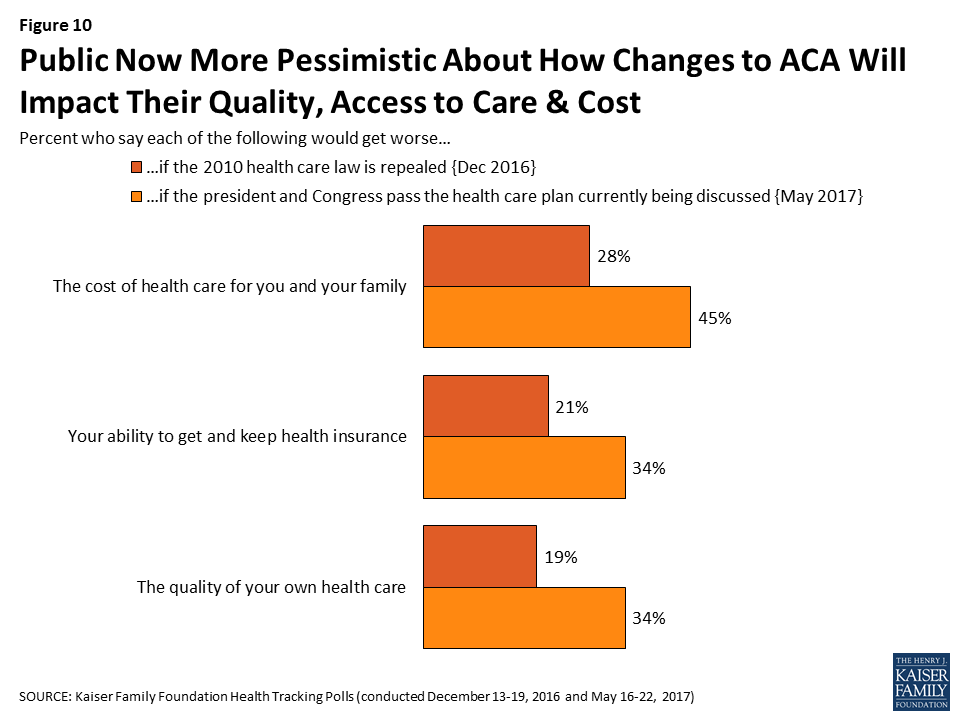
Figure 10: Public Now More Pessimistic About How Changes to ACA Will Impact Their Quality, Access to Care & Cost
Medicaid
KEY FINDINGS:
- The American Health Care Act (AHCA) includes substantial changes to Medicaid – the program that provides coverage for medical care and long-term care services to low-income people. Overall, six in ten Americans (58 percent) say Medicaid is either “very” or “somewhat” important for them and their family – including a majority of Democrats (64 percent) and independents (57 percent) and nearly half (46 percent) of Republicans.
- The AHCA reduces federal funding for Medicaid expansion in states. The vast majority of the public – including a majority of Democrats (93 percent), independents (83 percent), and Republicans (71 percent) – say it is important that states that received federal funds to expand Medicaid continue to receive those funds.
- Currently, Medicaid is jointly financed by federal and state governments, with each state deciding how to structure benefits, eligibility, and care delivery within guidelines set by the federal government. Seven in ten (71 percent) Americans prefer keeping Medicaid largely as it is today while fewer (26 percent) support changing Medicaid to allow states more flexibility in determining which groups of people and what services are covered under the program.
Proposed Changes to Medicaid
This month’s Kaiser Health Tracking Poll examines attitudes towards the AHCA’s changes to Medicaid1 – the program that provides coverage for medical care and long-term care services to low-income people. Overall, six in ten Americans (58 percent) say Medicaid is either “very” or “somewhat” important for them and their family – including a majority of Democrats (64 percent) and independents (57 percent) and 46 percent of Republicans.
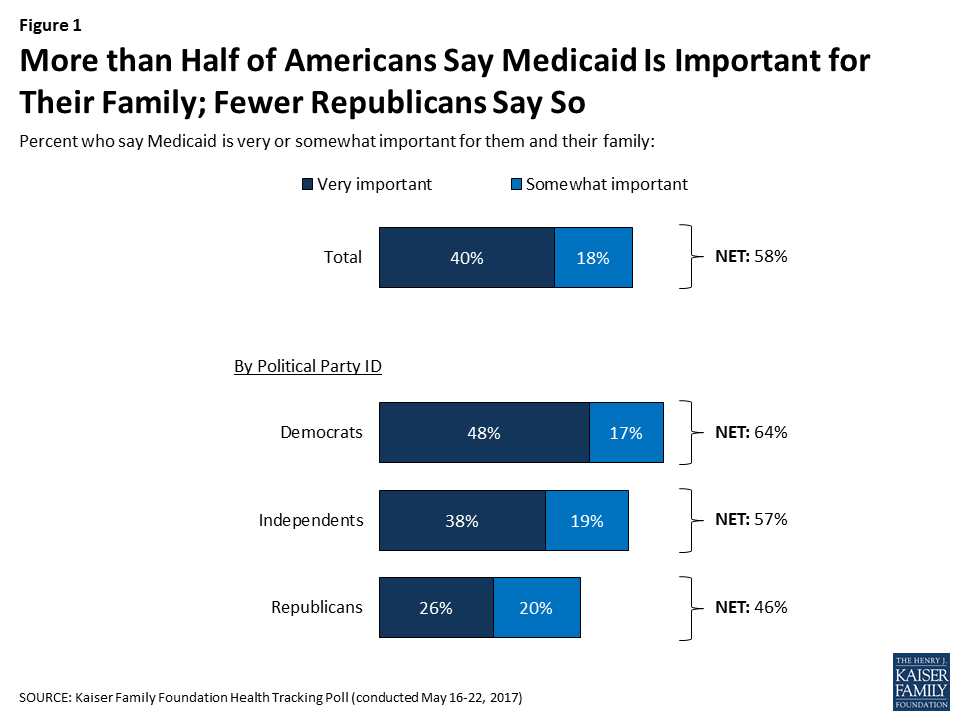
Figure 1: More than Half of Americans Say Medicaid Is Important for Their Family; Fewer Republicans Say So
Those who say Medicaid is either “very” or “somewhat” important for them and their family are more pessimistic about how their own health care will be affected if the president and Congress pass the health care plan currently being discussed. About half (53 percent) of those who say Medicaid is important for them and their family say their cost of health care will get worse compared to one-third of those who say Medicaid is not important for them. The shares who say their ability to get and keep health insurance and the overall quality of their own health care would get worse are also larger among those who say Medicaid is important compared to those who say it is not important for them (42 percent vs. 23 percent, 41 percent vs. 25 percent, respectively).
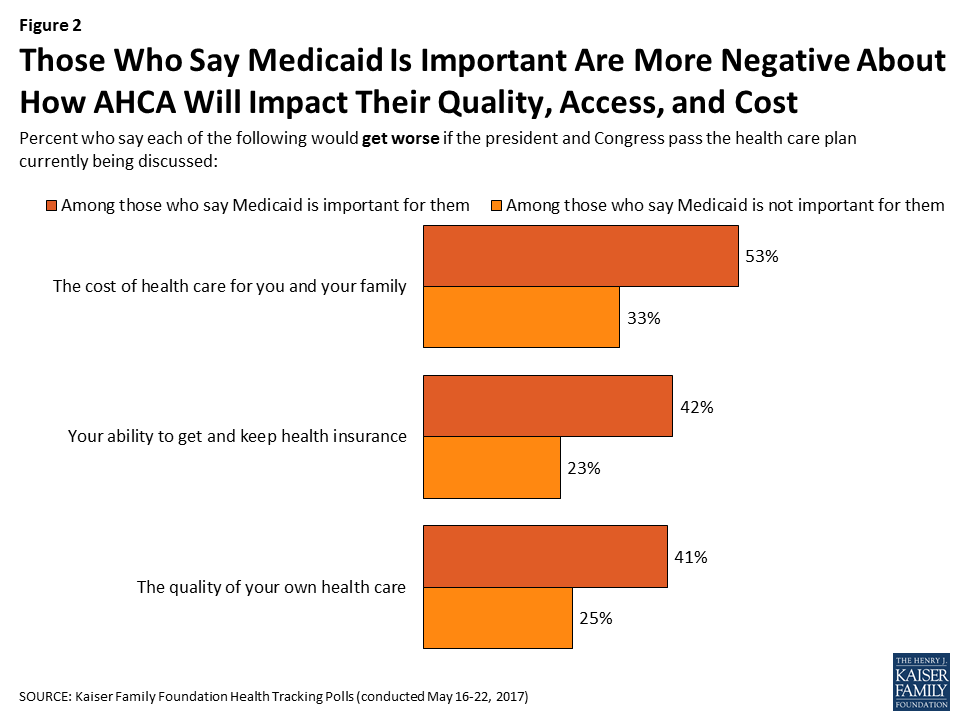
Figure 2: Those Who Say Medicaid Is Important Are More Negative About How AHCA Will Impact Their Quality, Access, and Cost
Public Supports Continued Funding for Medicaid Expansion
The 2010 Affordable Care Act expanded Medicaid coverage to over 11 million low-income, uninsured adults.2 The AHCA reduces federal funding for Medicaid expansion by 2020. The vast majority of the public – including a majority of Democrats, independents, and Republicans – say it is important that states that received federal funds to expand Medicaid continue to receive those funds.
| Table 1: Majorities of Democrats, Independents, and Republicans Say Continued Federal Funding for Medicaid Expansion Is Important | ||||
|
If lawmakers decide to repeal and replace the 2010 health care law, how important is it to you that a replacement plan makes sure states that received federal funds to expand Medicaid continue to receive those funds?
|
Total | Democrats | Independents | Republicans |
| Important (NET) | 84% | 93% | 83% | 71% |
| Very important | 58 | 78 | 56 | 35 |
| Somewhat important | 26 | 16 | 27 | 36 |
| Not important (NET) | 14 | 6 | 15 | 28 |
| Not too important | 7 | 3 | 7 | 15 |
| Not at all important | 7 | 3 | 8 | 13 |
| Don’t know/Refused | 1 | 1 | 2 | 1 |
Support for continued funding for Medicaid expansion is even popular among individuals living in states that have not expanded their Medicaid program.
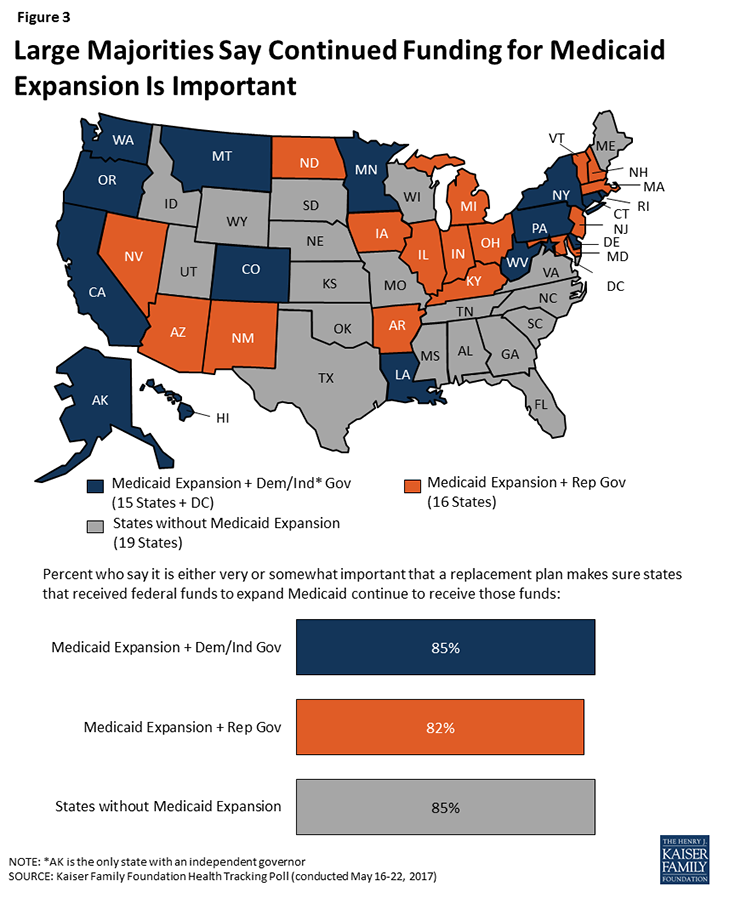
Figure 3: Large Majorities Say Continued Funding for Medicaid Expansion Is Important
Changes to Federal Funding for Medicaid
Currently, Medicaid is jointly financed by federal and state governments, with each state deciding how to structure benefits, eligibility, and care delivery within guidelines set by the federal government. The federal government matches state spending on an open-ended basis but the AHCA proposes changing this system so that instead of matching state Medicaid spending, the federal government would limit the amount it gives states to help pay for Medicaid coverage but could allow states more flexibility in determining which groups of people and what services are covered under the program.
When asked about a change to the financing structure, 71 percent say they think Medicaid should largely continue as it is today with the federal government guaranteeing coverage, setting standards and benefits, and matching state spending while fewer (26 percent) say Medicaid should be changed. Democrats and independents largely favor the status quo (90 percent and 70 percent, respectively) while Republicans are more divided, with a similar share supporting the status quo (47 percent) as do the proposal to change the funding structure (48 percent).
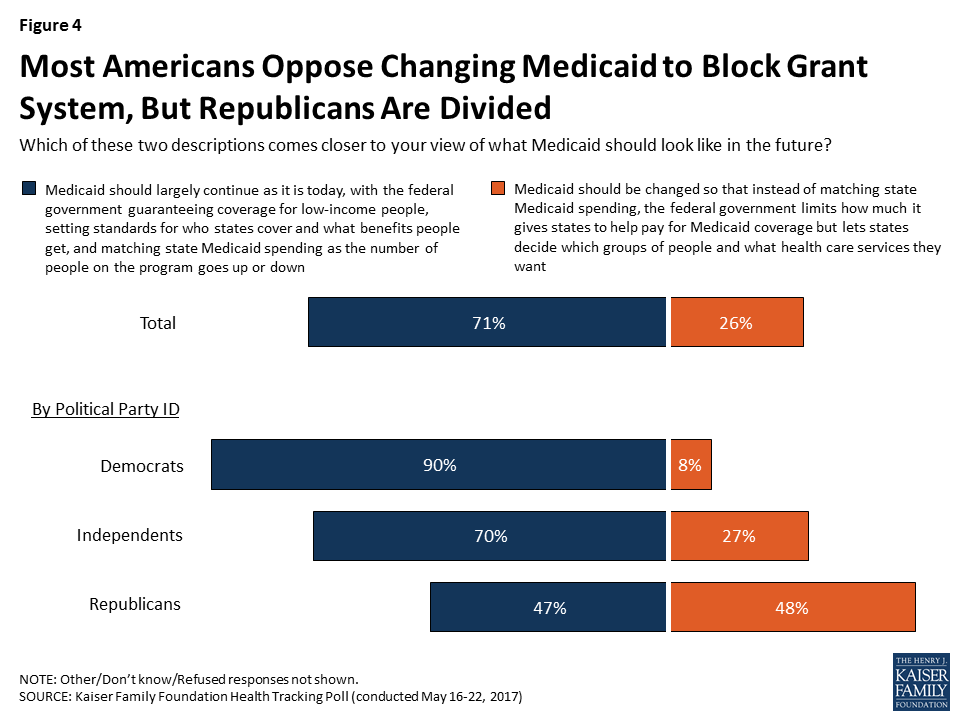
Figure 4: Most Americans Oppose Changing Medicaid to Block Grant System, But Republicans Are Divided
Partisanship Affects Basic Perceptions of Medicaid
Partisanship contributes to the public’s general perceptions of the Medicaid program. When asked whether Medicaid is more similar to other health insurance programs or to welfare programs, more Americans view Medicaid like other health insurance programs (60 percent) that help people pay for health care than view it as a welfare program (37 percent). Yet, these perceptions are largely driven by partisanship with Democrats and independents more likely to view Medicaid as a health insurance program and Republicans more likely to view it as a welfare program.
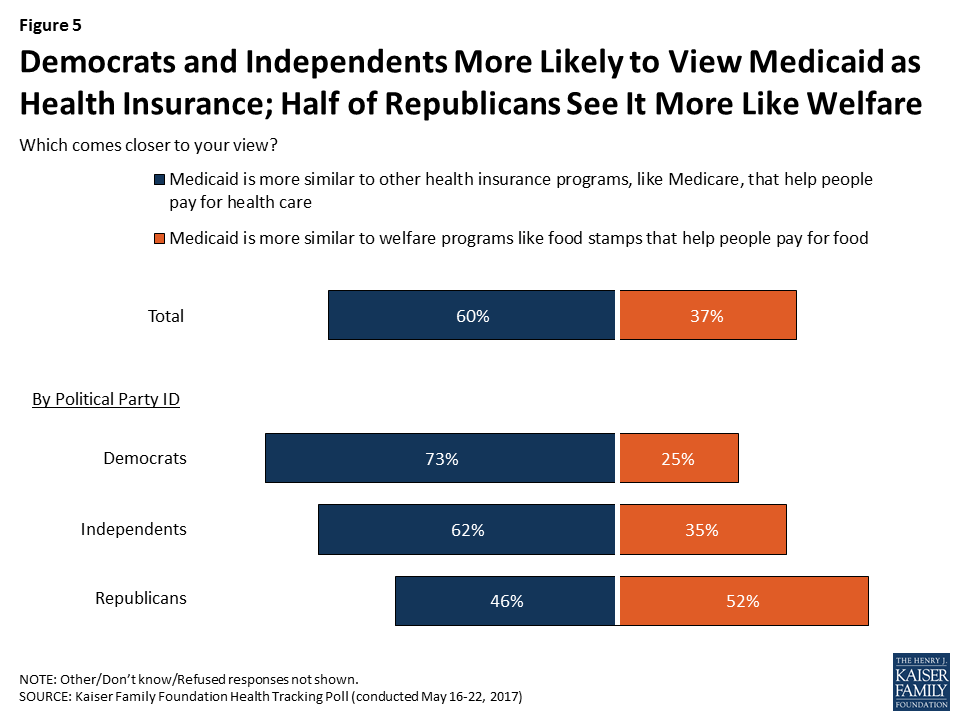
Figure 5: Democrats and Independents More Likely to View Medicaid as Health Insurance; Half of Republicans See It More Like Welfare
Methodology
This Kaiser Health Tracking Poll was designed and analyzed by public opinion researchers at the Kaiser Family Foundation (KFF). The survey was conducted May 16-22, 2017, among a nationally representative random digit dial telephone sample of 1,205 adults ages 18 and older, living in the United States, including Alaska and Hawaii (note: persons without a telephone could not be included in the random selection process). Computer-assisted telephone interviews conducted by landline (421) and cell phone (784, including 470 who had no landline telephone) were carried out in English and Spanish by Princeton Data Source under the direction of Princeton Survey Research Associates International (PSRAI). Both the random digit dial landline and cell phone samples were provided by Survey Sampling International, LLC. For the landline sample, respondents were selected by asking for the youngest adult male or female currently at home based on a random rotation. If no one of that gender was available, interviewers asked to speak with the youngest adult of the opposite gender. For the cell phone sample, interviews were conducted with the adult who answered the phone. KFF paid for all costs associated with the survey.
The combined landline and cell phone sample was weighted to balance the sample demographics to match estimates for the national population using data from the Census Bureau’s 2015 American Community Survey (ACS) on sex, age, education, race, Hispanic origin, and region along with data from the 2010 Census on population density. The sample was also weighted to match current patterns of telephone use using data from the January-June 2016 National Health Interview Survey. The weight takes into account the fact that respondents with both a landline and cell phone have a higher probability of selection in the combined sample and adjusts for the household size for the landline sample. All statistical tests of significance account for the effect of weighting.
The margin of sampling error including the design effect for the full sample is plus or minus 3 percentage points. Numbers of respondents and margins of sampling error for key subgroups are shown in the table below. For results based on other subgroups, the margin of sampling error may be higher. Sample sizes and margins of sampling error for other subgroups are available by request. Note that sampling error is only one of many potential sources of error in this or any other public opinion poll. Kaiser Family Foundation public opinion and survey research is a charter member of the Transparency Initiative of the American Association for Public Opinion Research.
| Group | N (unweighted) | M.O.S.E. |
| Total | 1205 | ±3 percentage points |
| Party Identification | ||
| Democrats | 404 | ±6 percentage points |
| Republicans | 279 | ±7 percentage points |
| Independents | 398 | ±6 percentage points |
| Trump Approval | ||
| Approve of President Trump | 446 | ±5 percentage points |
| Disapprove of President Trump | 697 | ±4 percentage points |
Endnotes
Findings
H.R. 1628 – American Health Care Act of 2017, 115th Congress https://www.congress.gov/bill/115th-congress/house-bill/1628
Medicaid
Kaiser Family Foundation, Compare Proposals to Replace the Affordable Care Act. https://www.kff.org/interactive/proposals-to-replace-the-affordable-care-act/
Kaiser Family Foundation, Key Facts About the Uninsured Population. https://www.kff.org/uninsured/fact-sheet/key-facts-about-the-uninsured-population/