
Health Coverage and Care in the South: A Chartbook
Introduction
Over 115 million individuals live in the American South today, and together, they account for over one-third (37%) of the total U.S. population. The South is racially and ethnically diverse and home to a large share of the nation’s people of color. As such, efforts to improve health in the South have significant implications for the advancement of health and health equity nationwide.
The South has faced longstanding disparities in health and health care, although significant variation exists between southern states. As a group, compared to those in other regions, Southerners are more likely to be uninsured, less likely to have access to needed health services, and more likely to experience a number of chronic health conditions. Yet, many southern states have also adopted innovative approaches to improve their health systems, particularly in the delivery of care, that provide key lessons for improving access to health coverage in the South more broadly.
Health Coverage and Care in the South: A Chartbook provides key data on the demographic and economic characteristics of the southern population as well as their health status, health insurance coverage, and access to care today.
Together, these data offer a snapshot of health care in the South, highlighting both opportunities for advancement and challenges relating to improving health care and health equity looking forward.
Section 2: The Southern Economy
Section 4: Health Insurance Coverage
Section 5: Access to Care, Delivery Systems, and the Safety Net
Section 6: Medicaid’s Broader Role
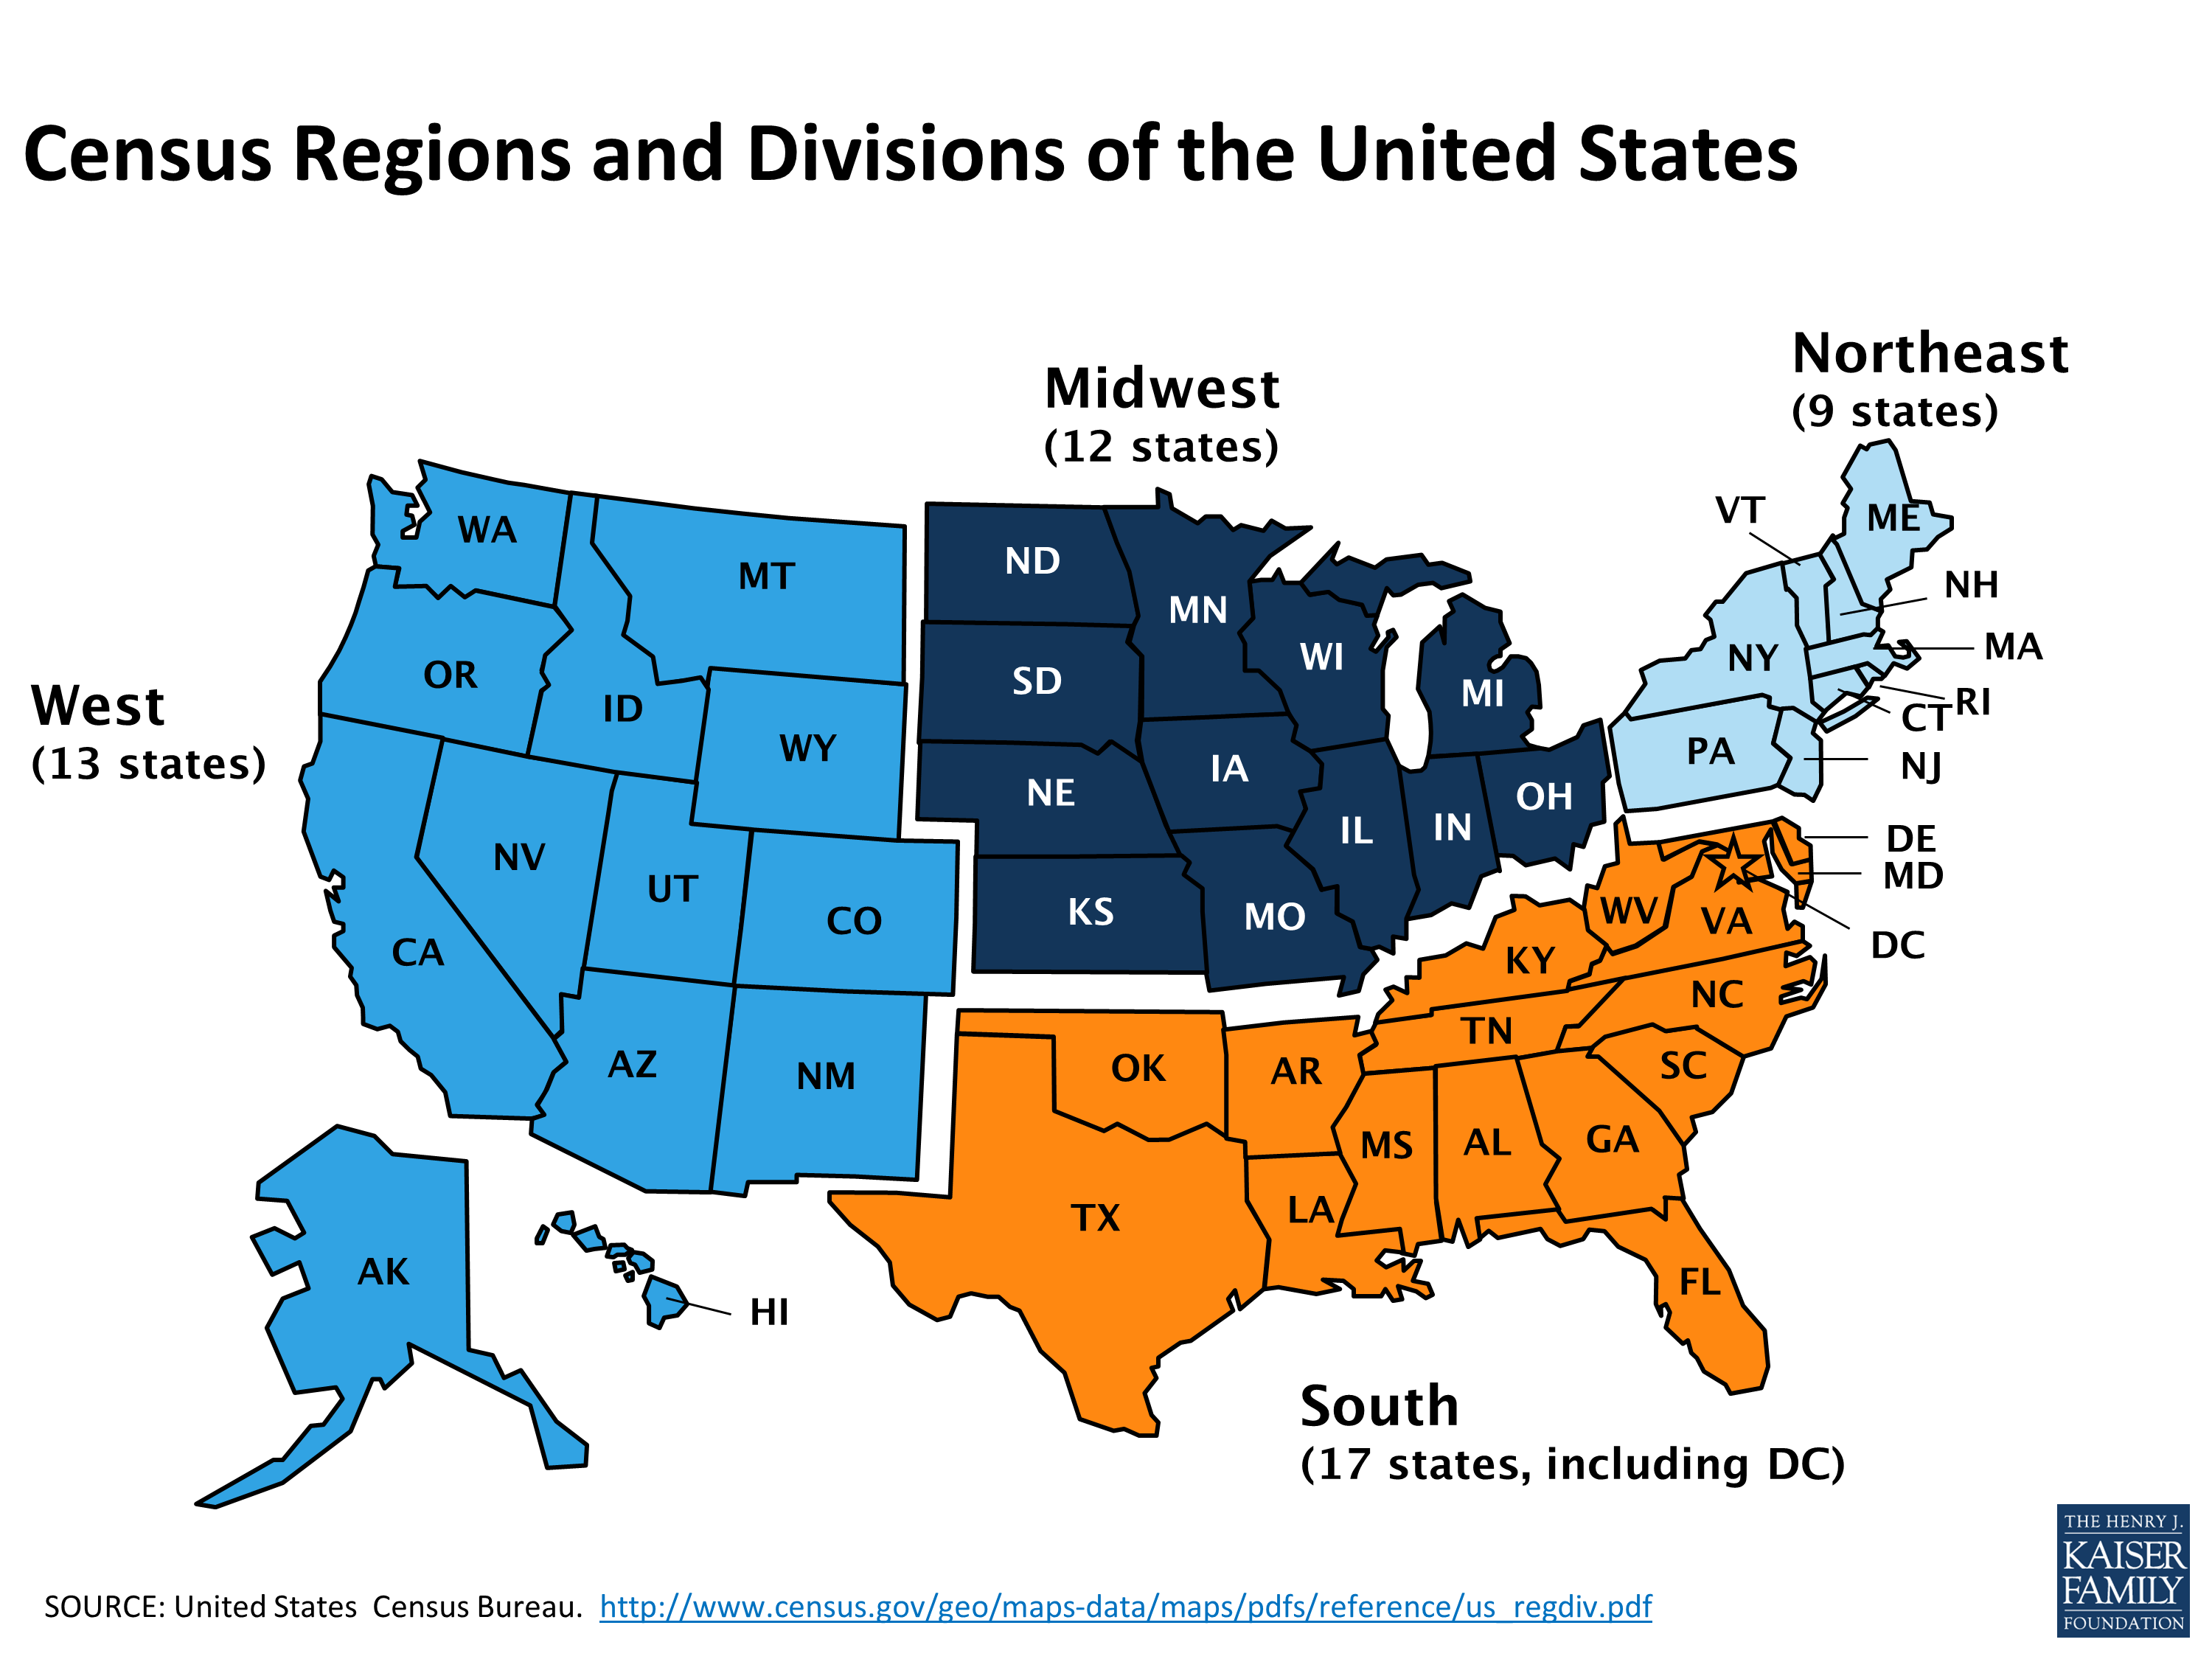
Census Regions and Divisions of the United States
Report
Section 1: Demographics
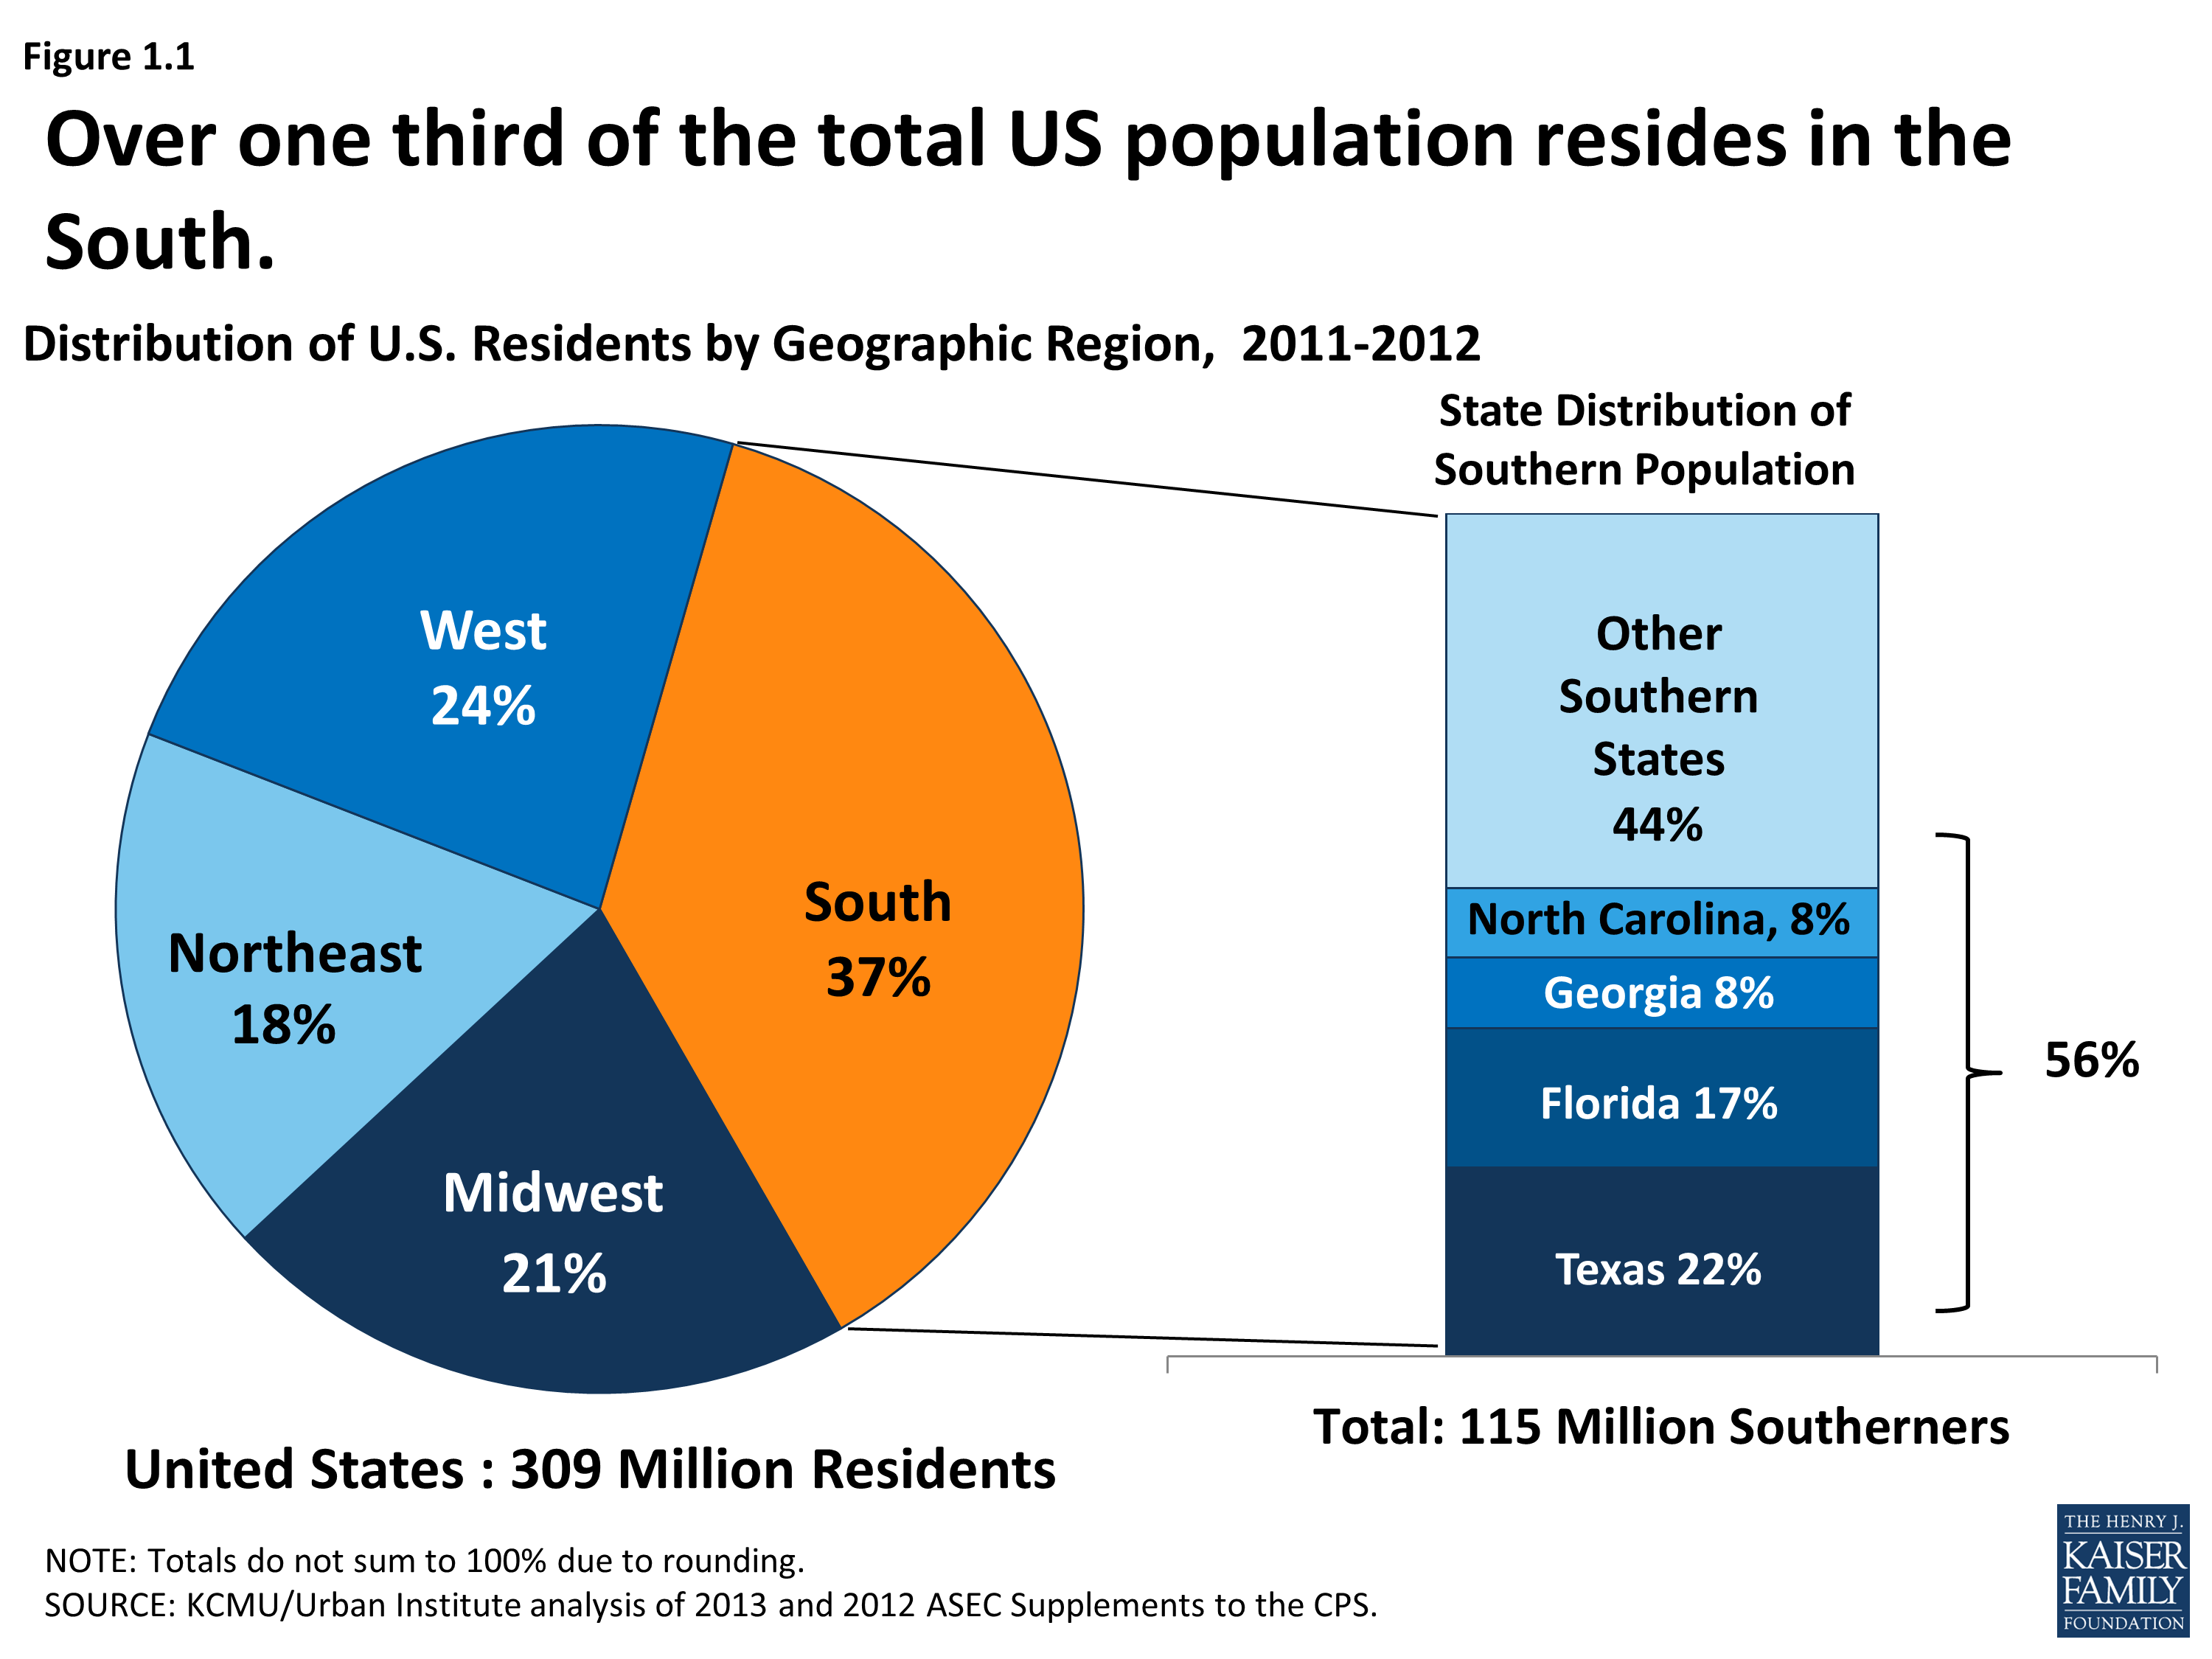
Distribution of U.S. Residents, by Geographic Region, 2011-2012
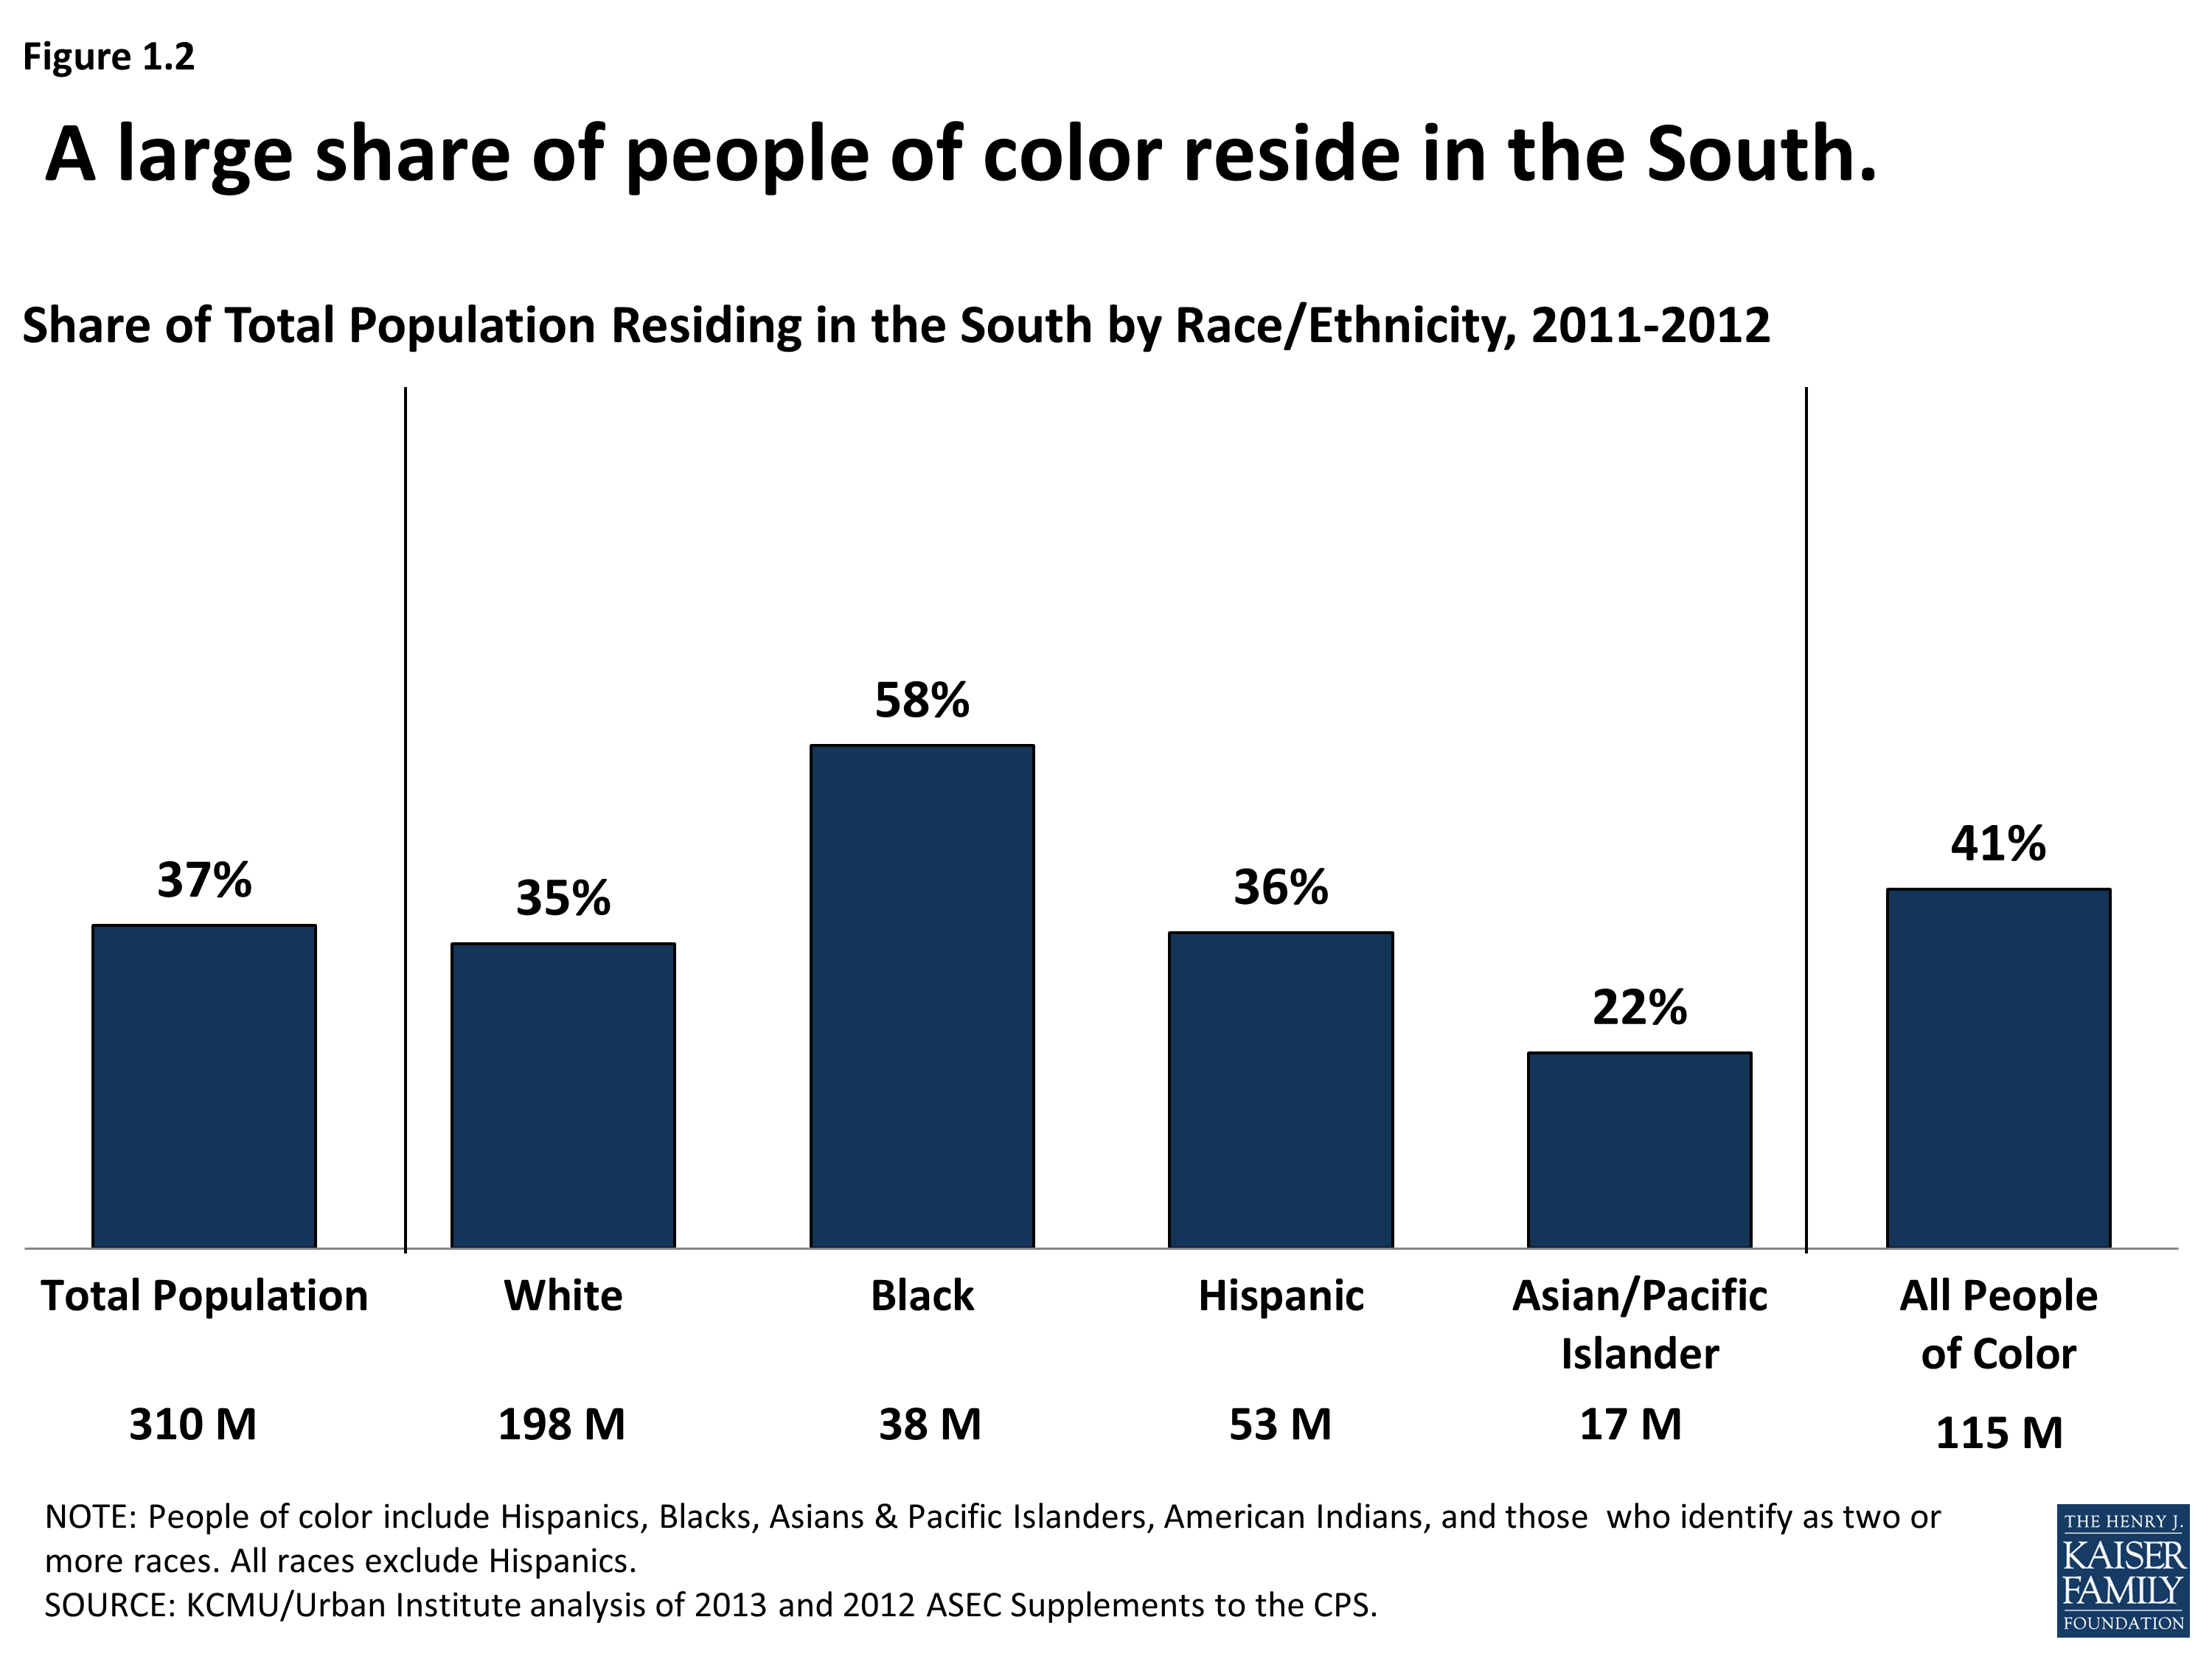
Share of Total Population Residing in the South, by Race/Ethnicity, 2011-2012
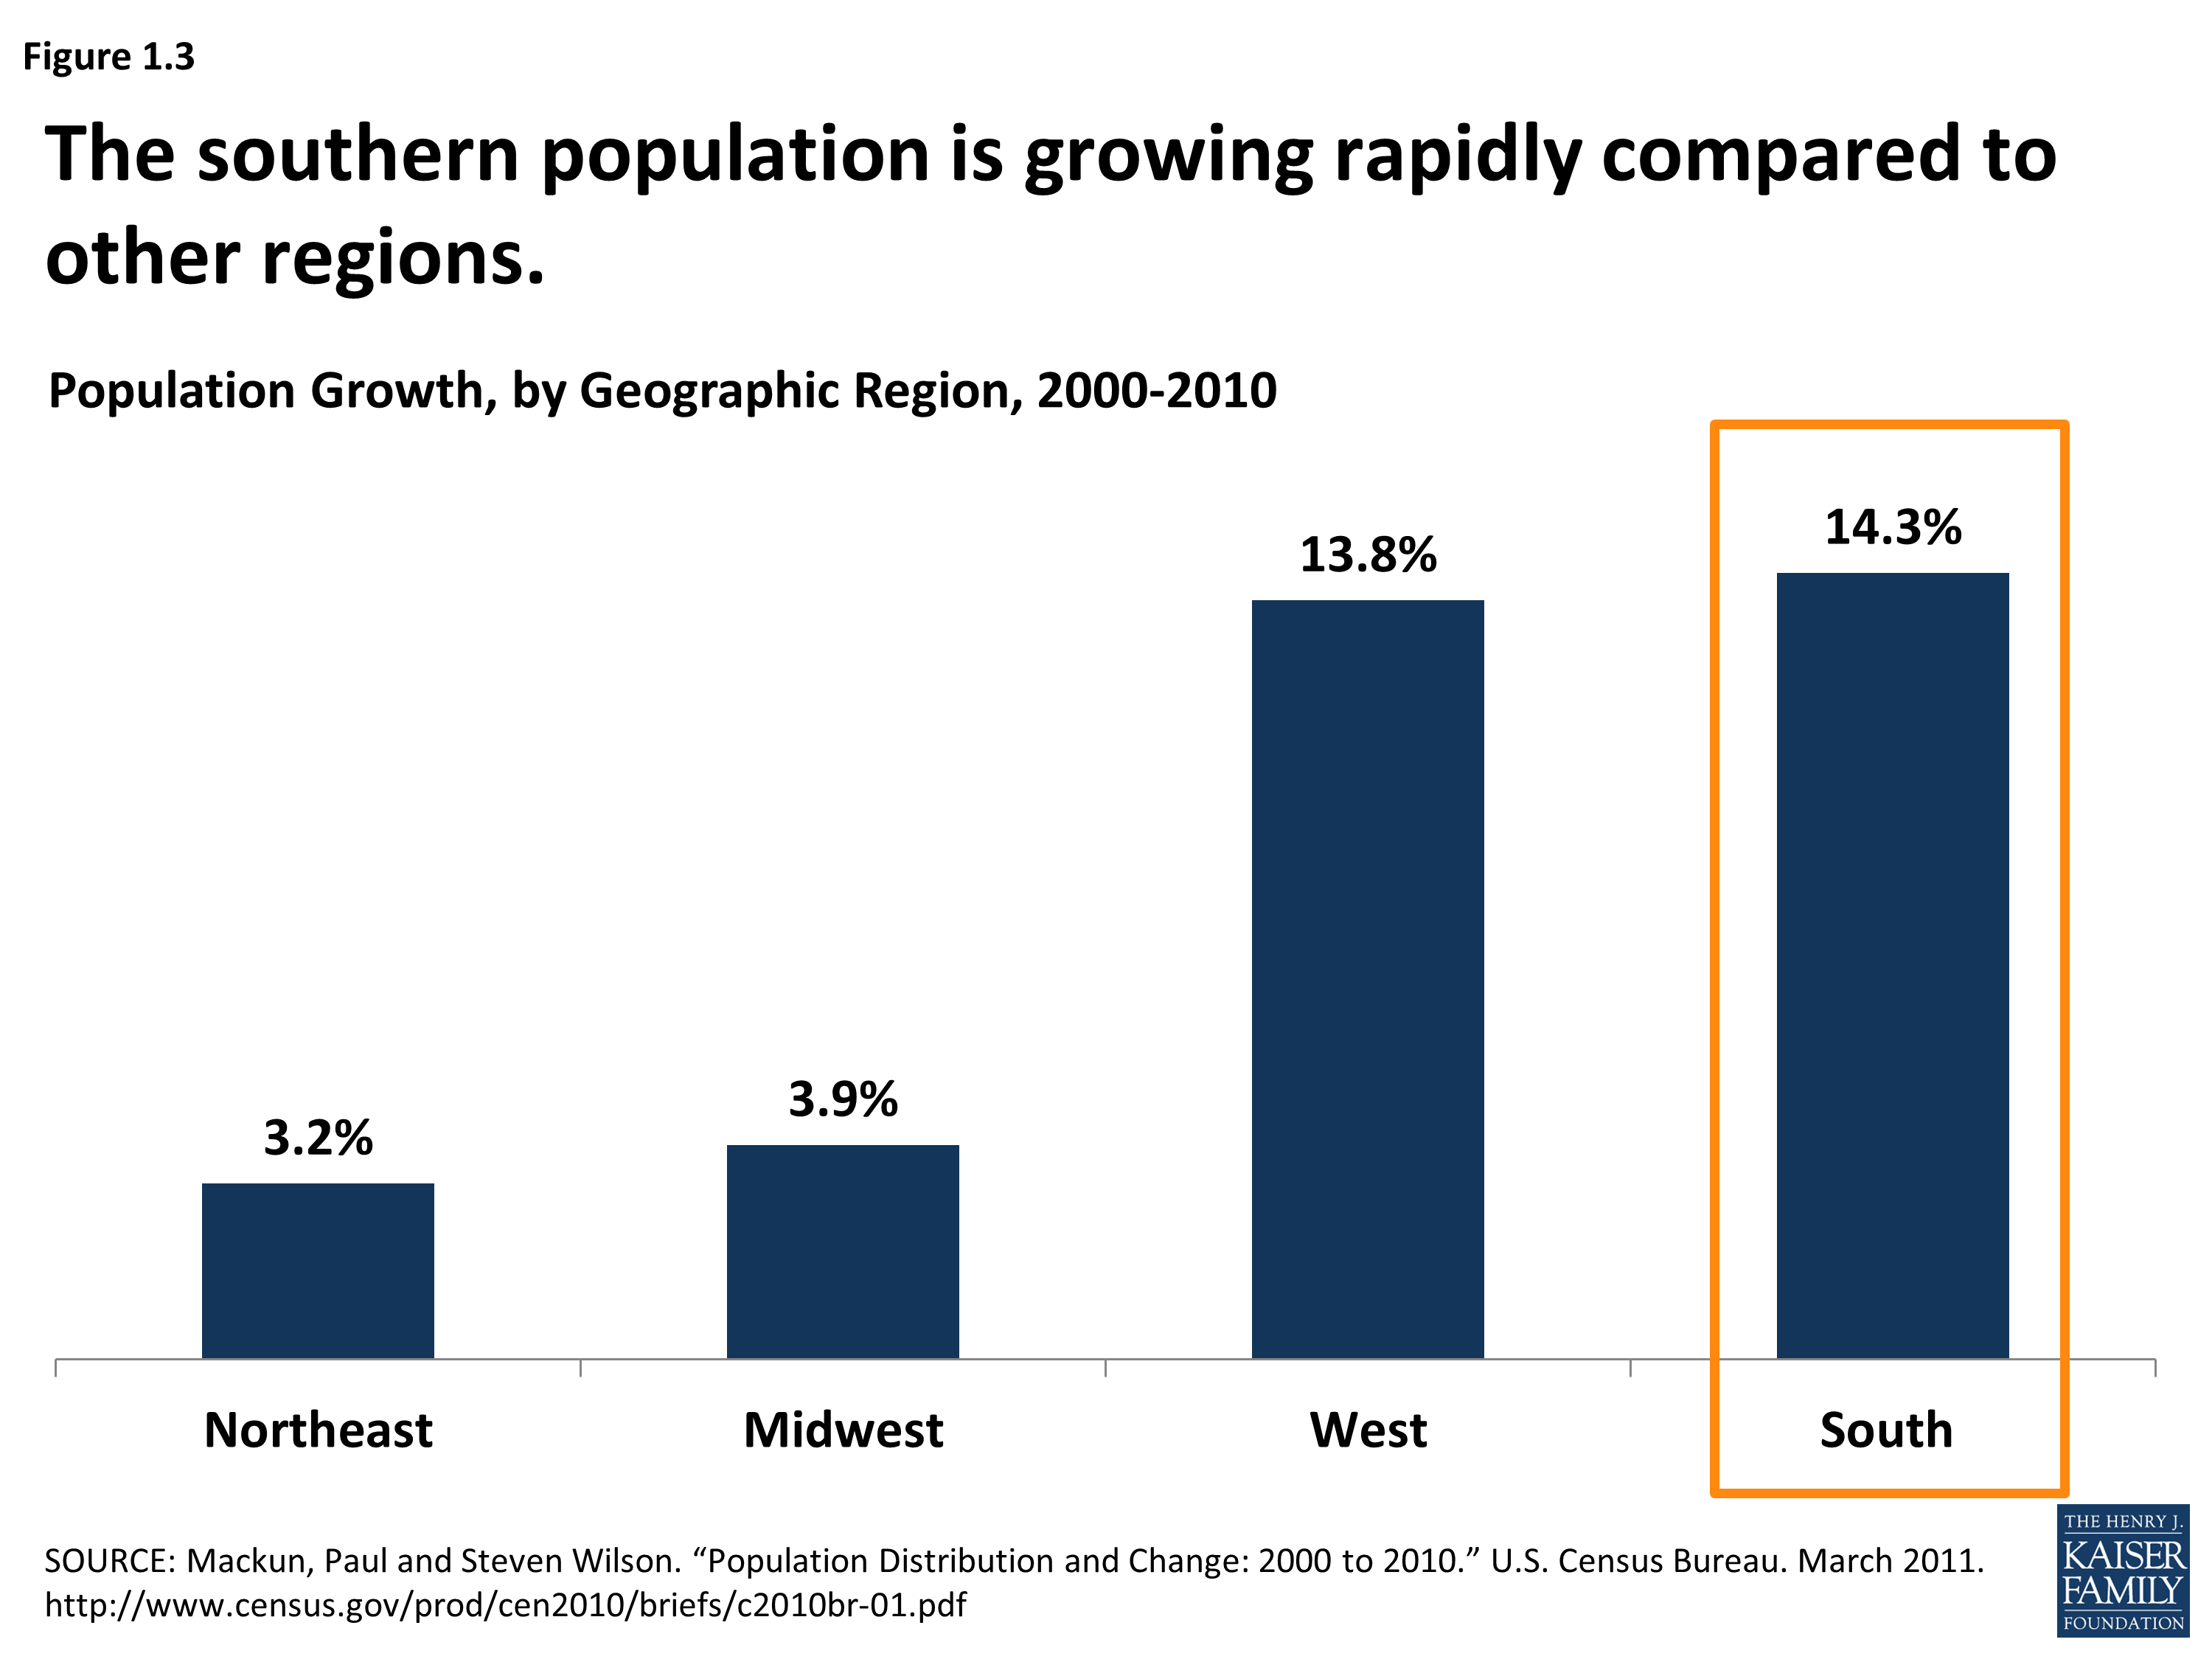
Population Growth, by Geographic Region, 2000-2010
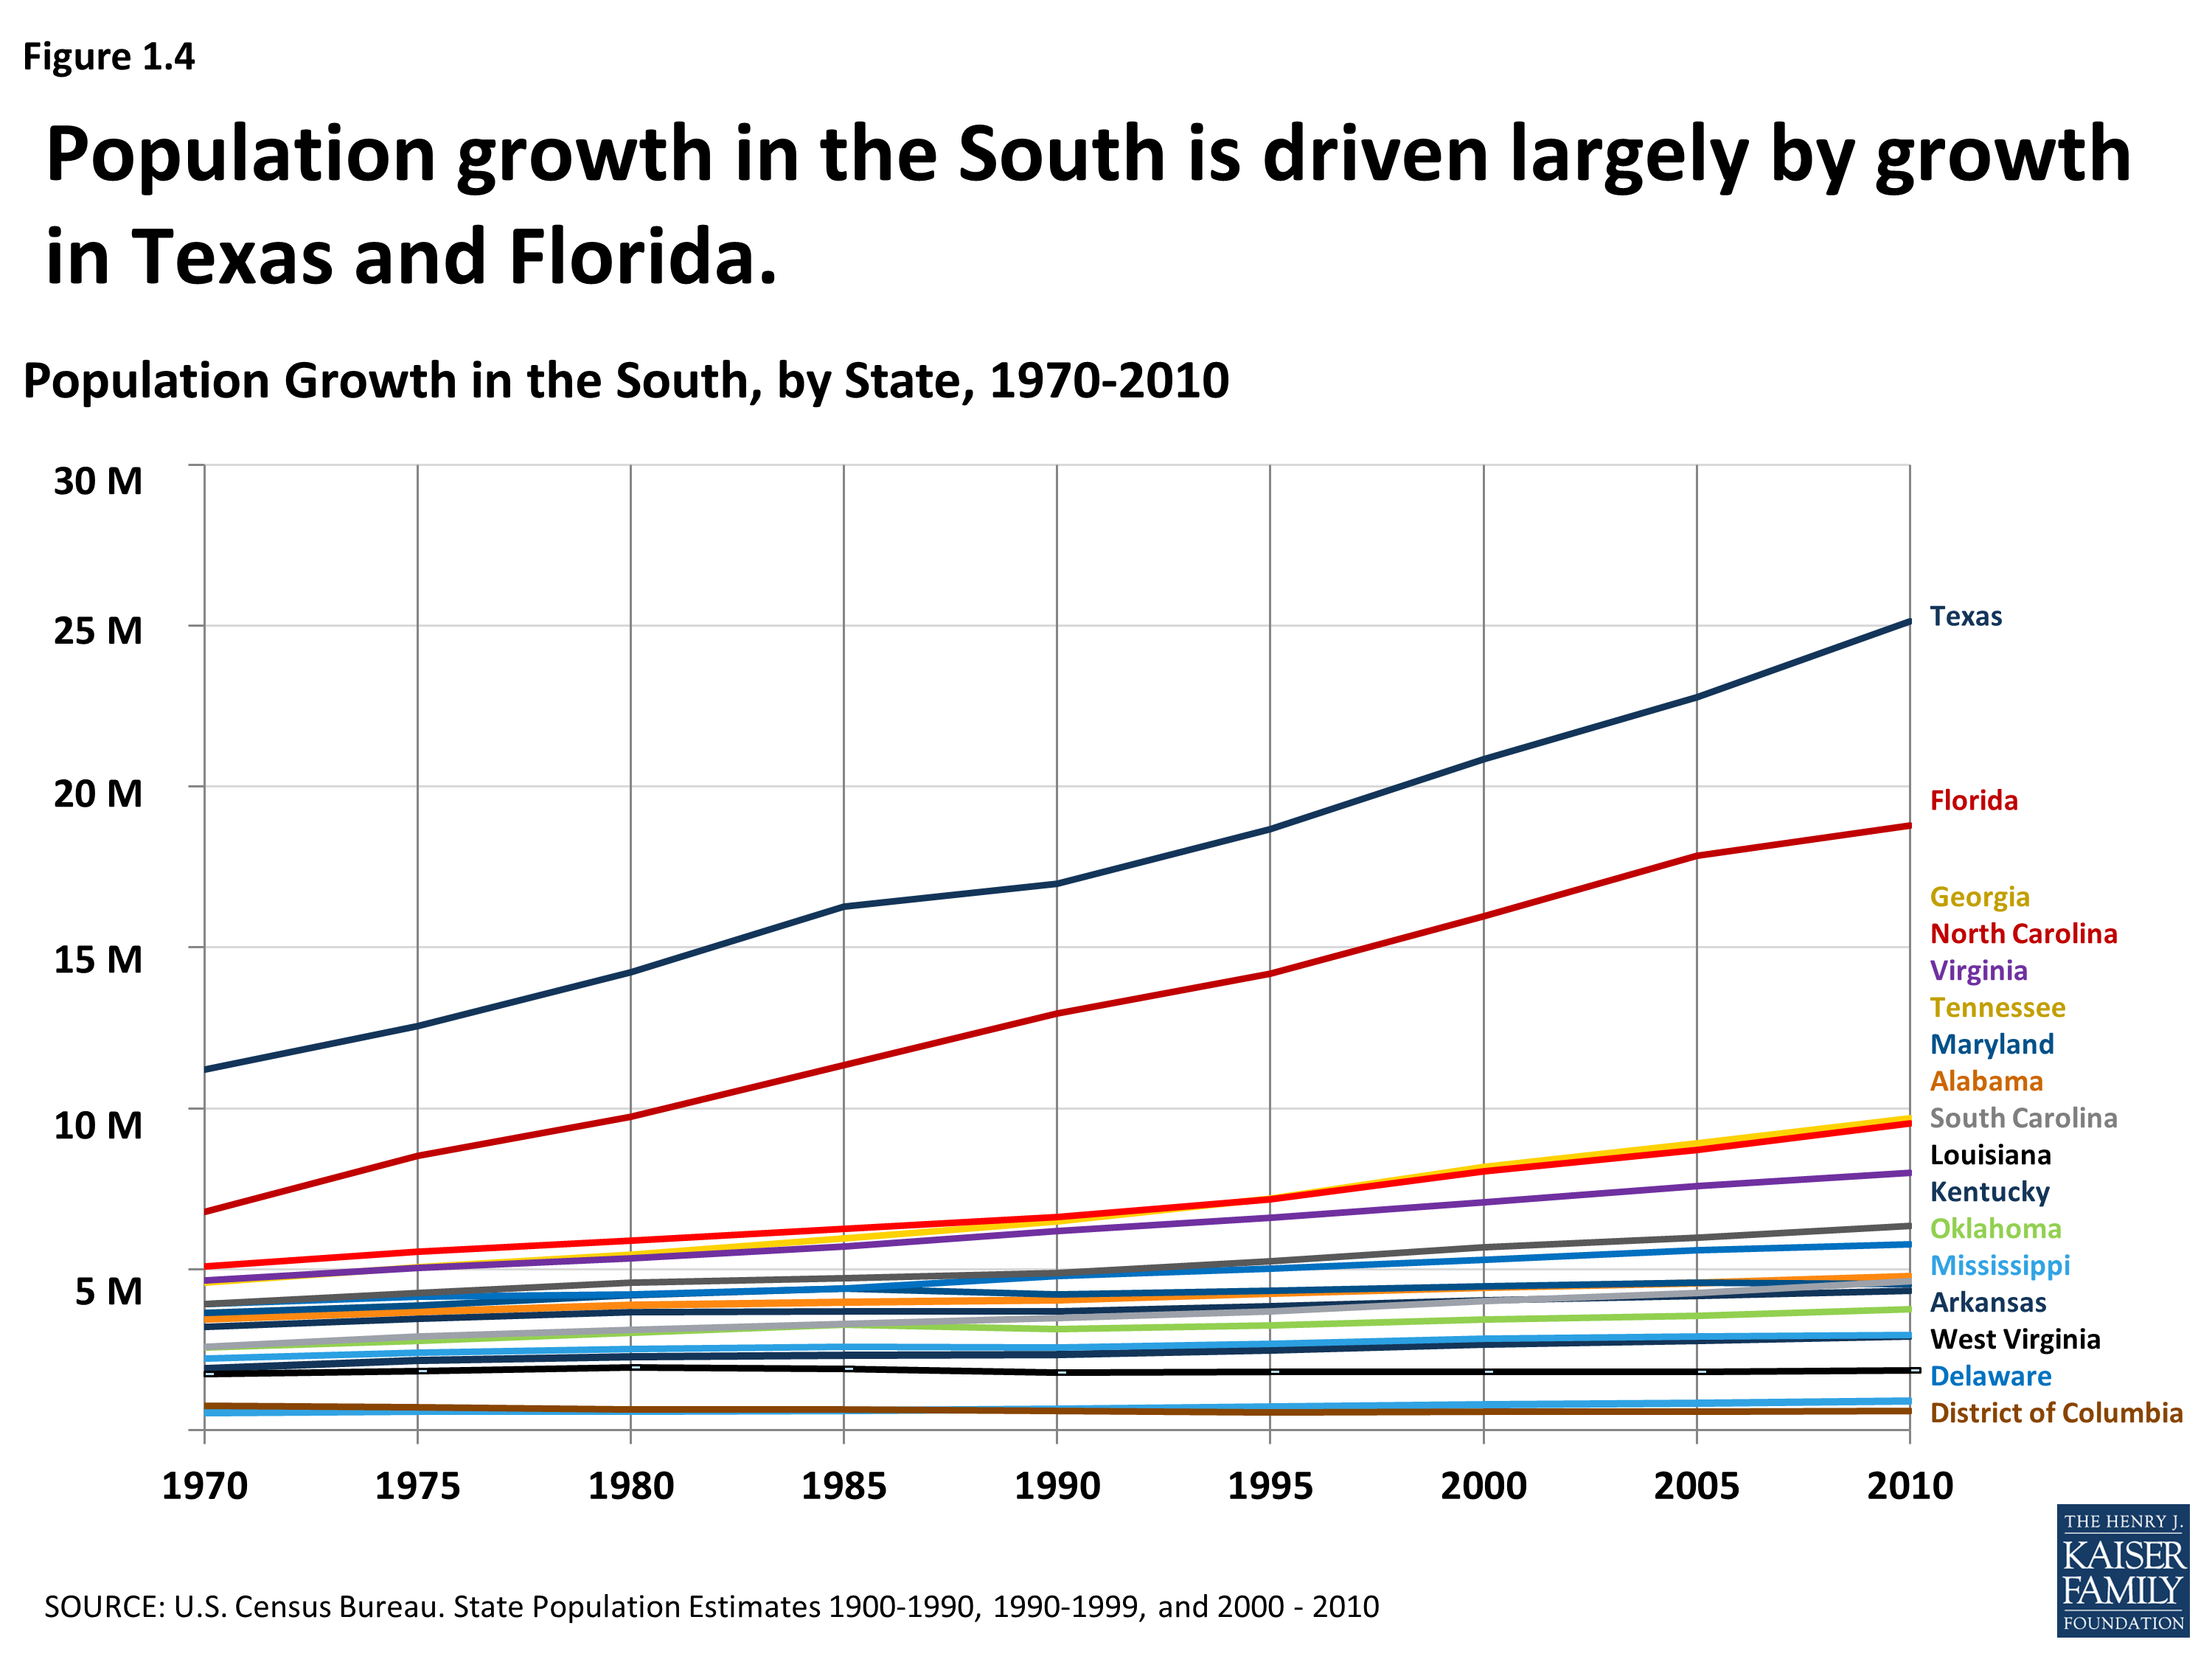
Population Growth in the South, by State, 1970-2010
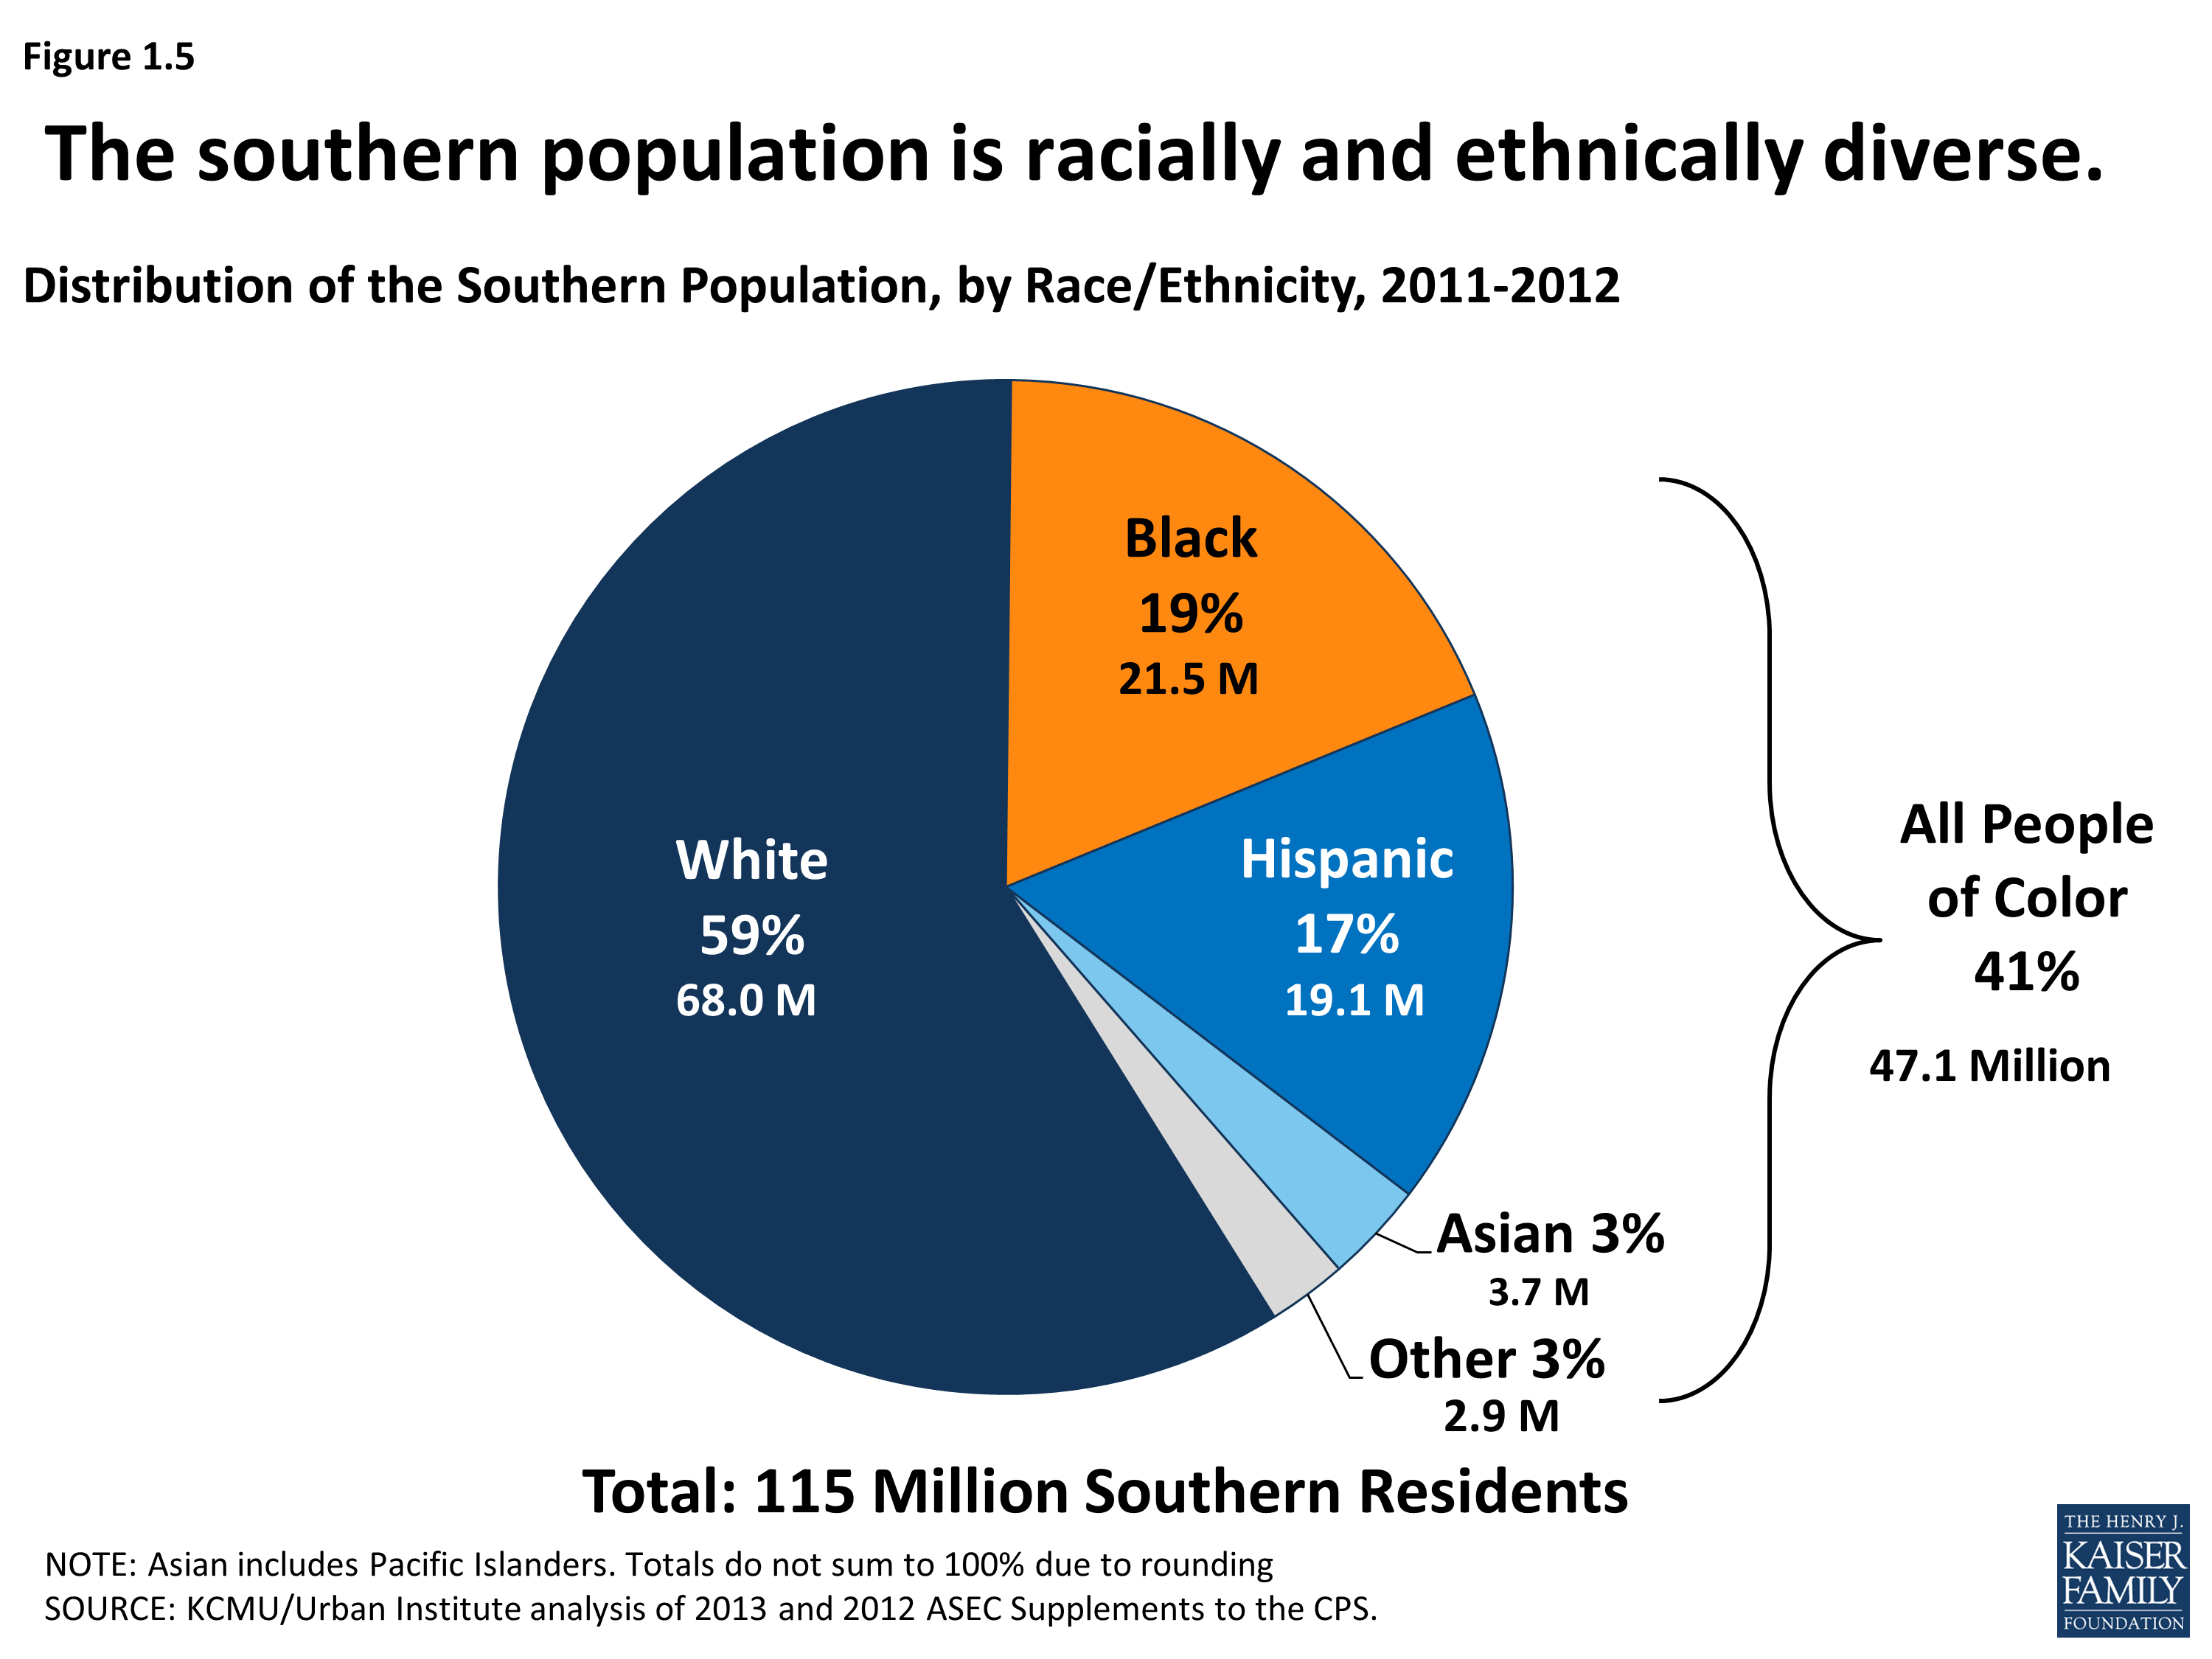
Distribution of the Southern Population, by Race/Ethnicity, 2011-2012
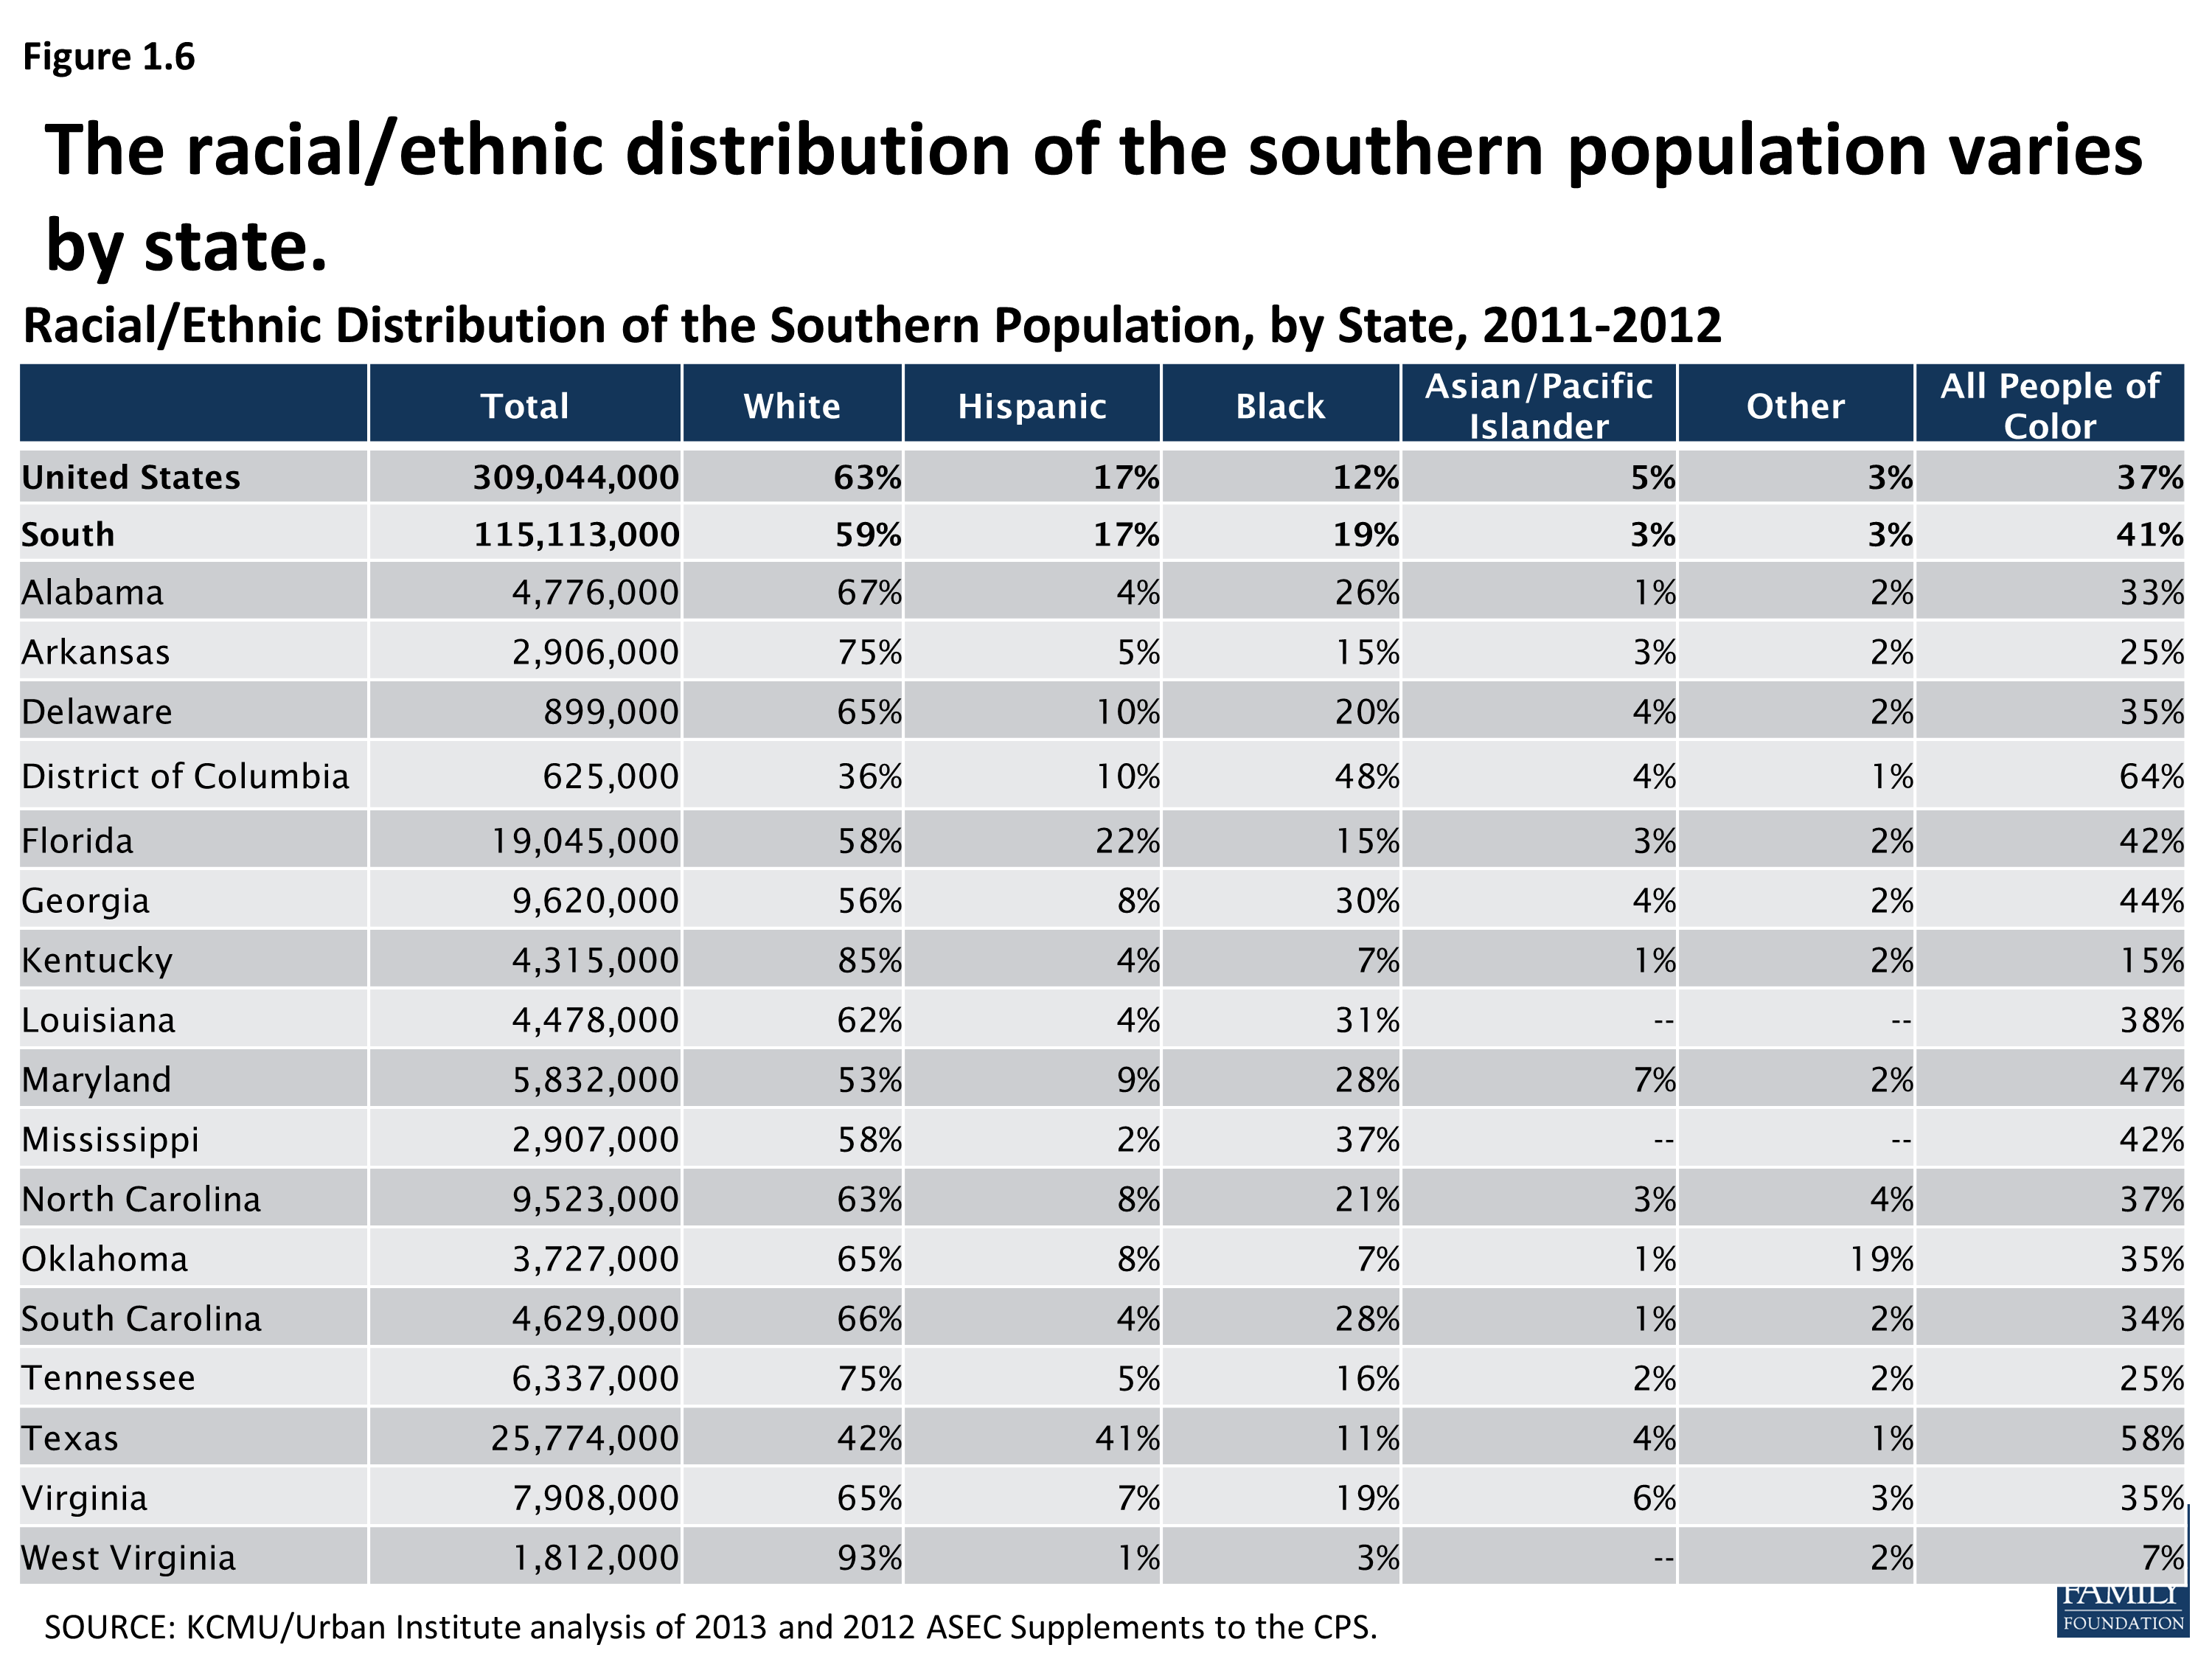
Racial/Ethnic Distribution of the Southern Population, by State, 2011-2012
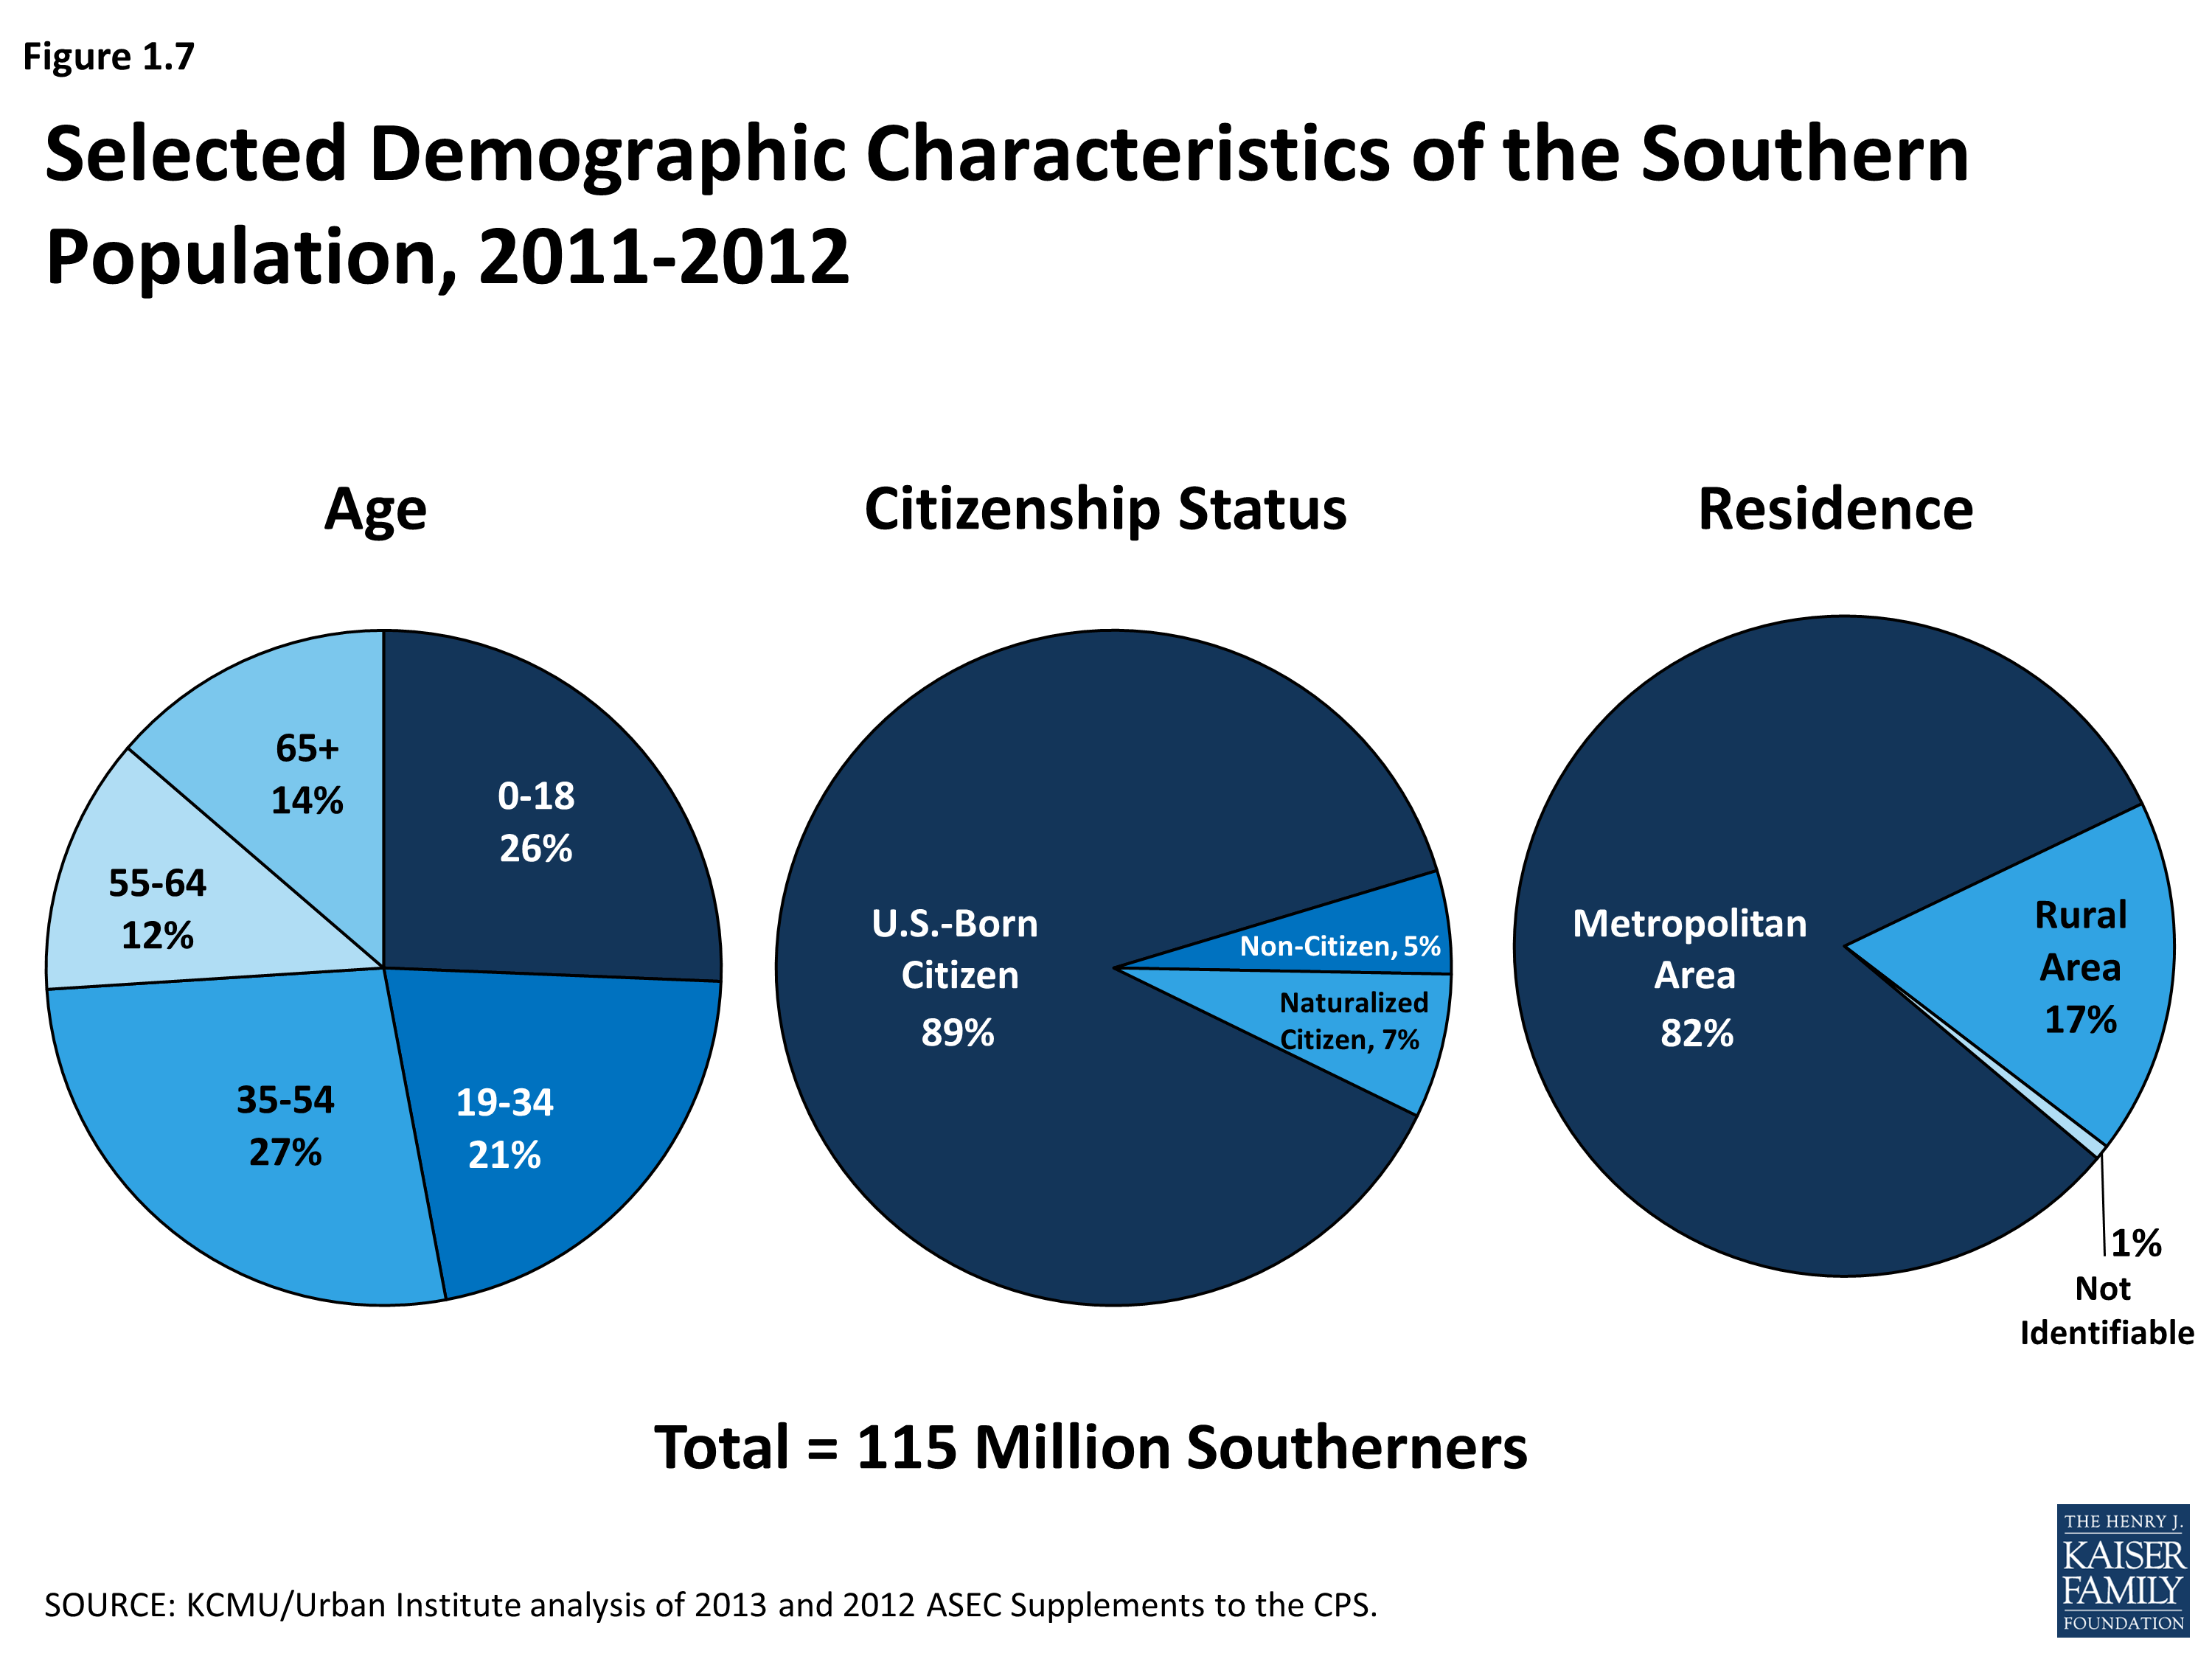
Selected Demographic Characteristics of the Southern Population, 2011-2012
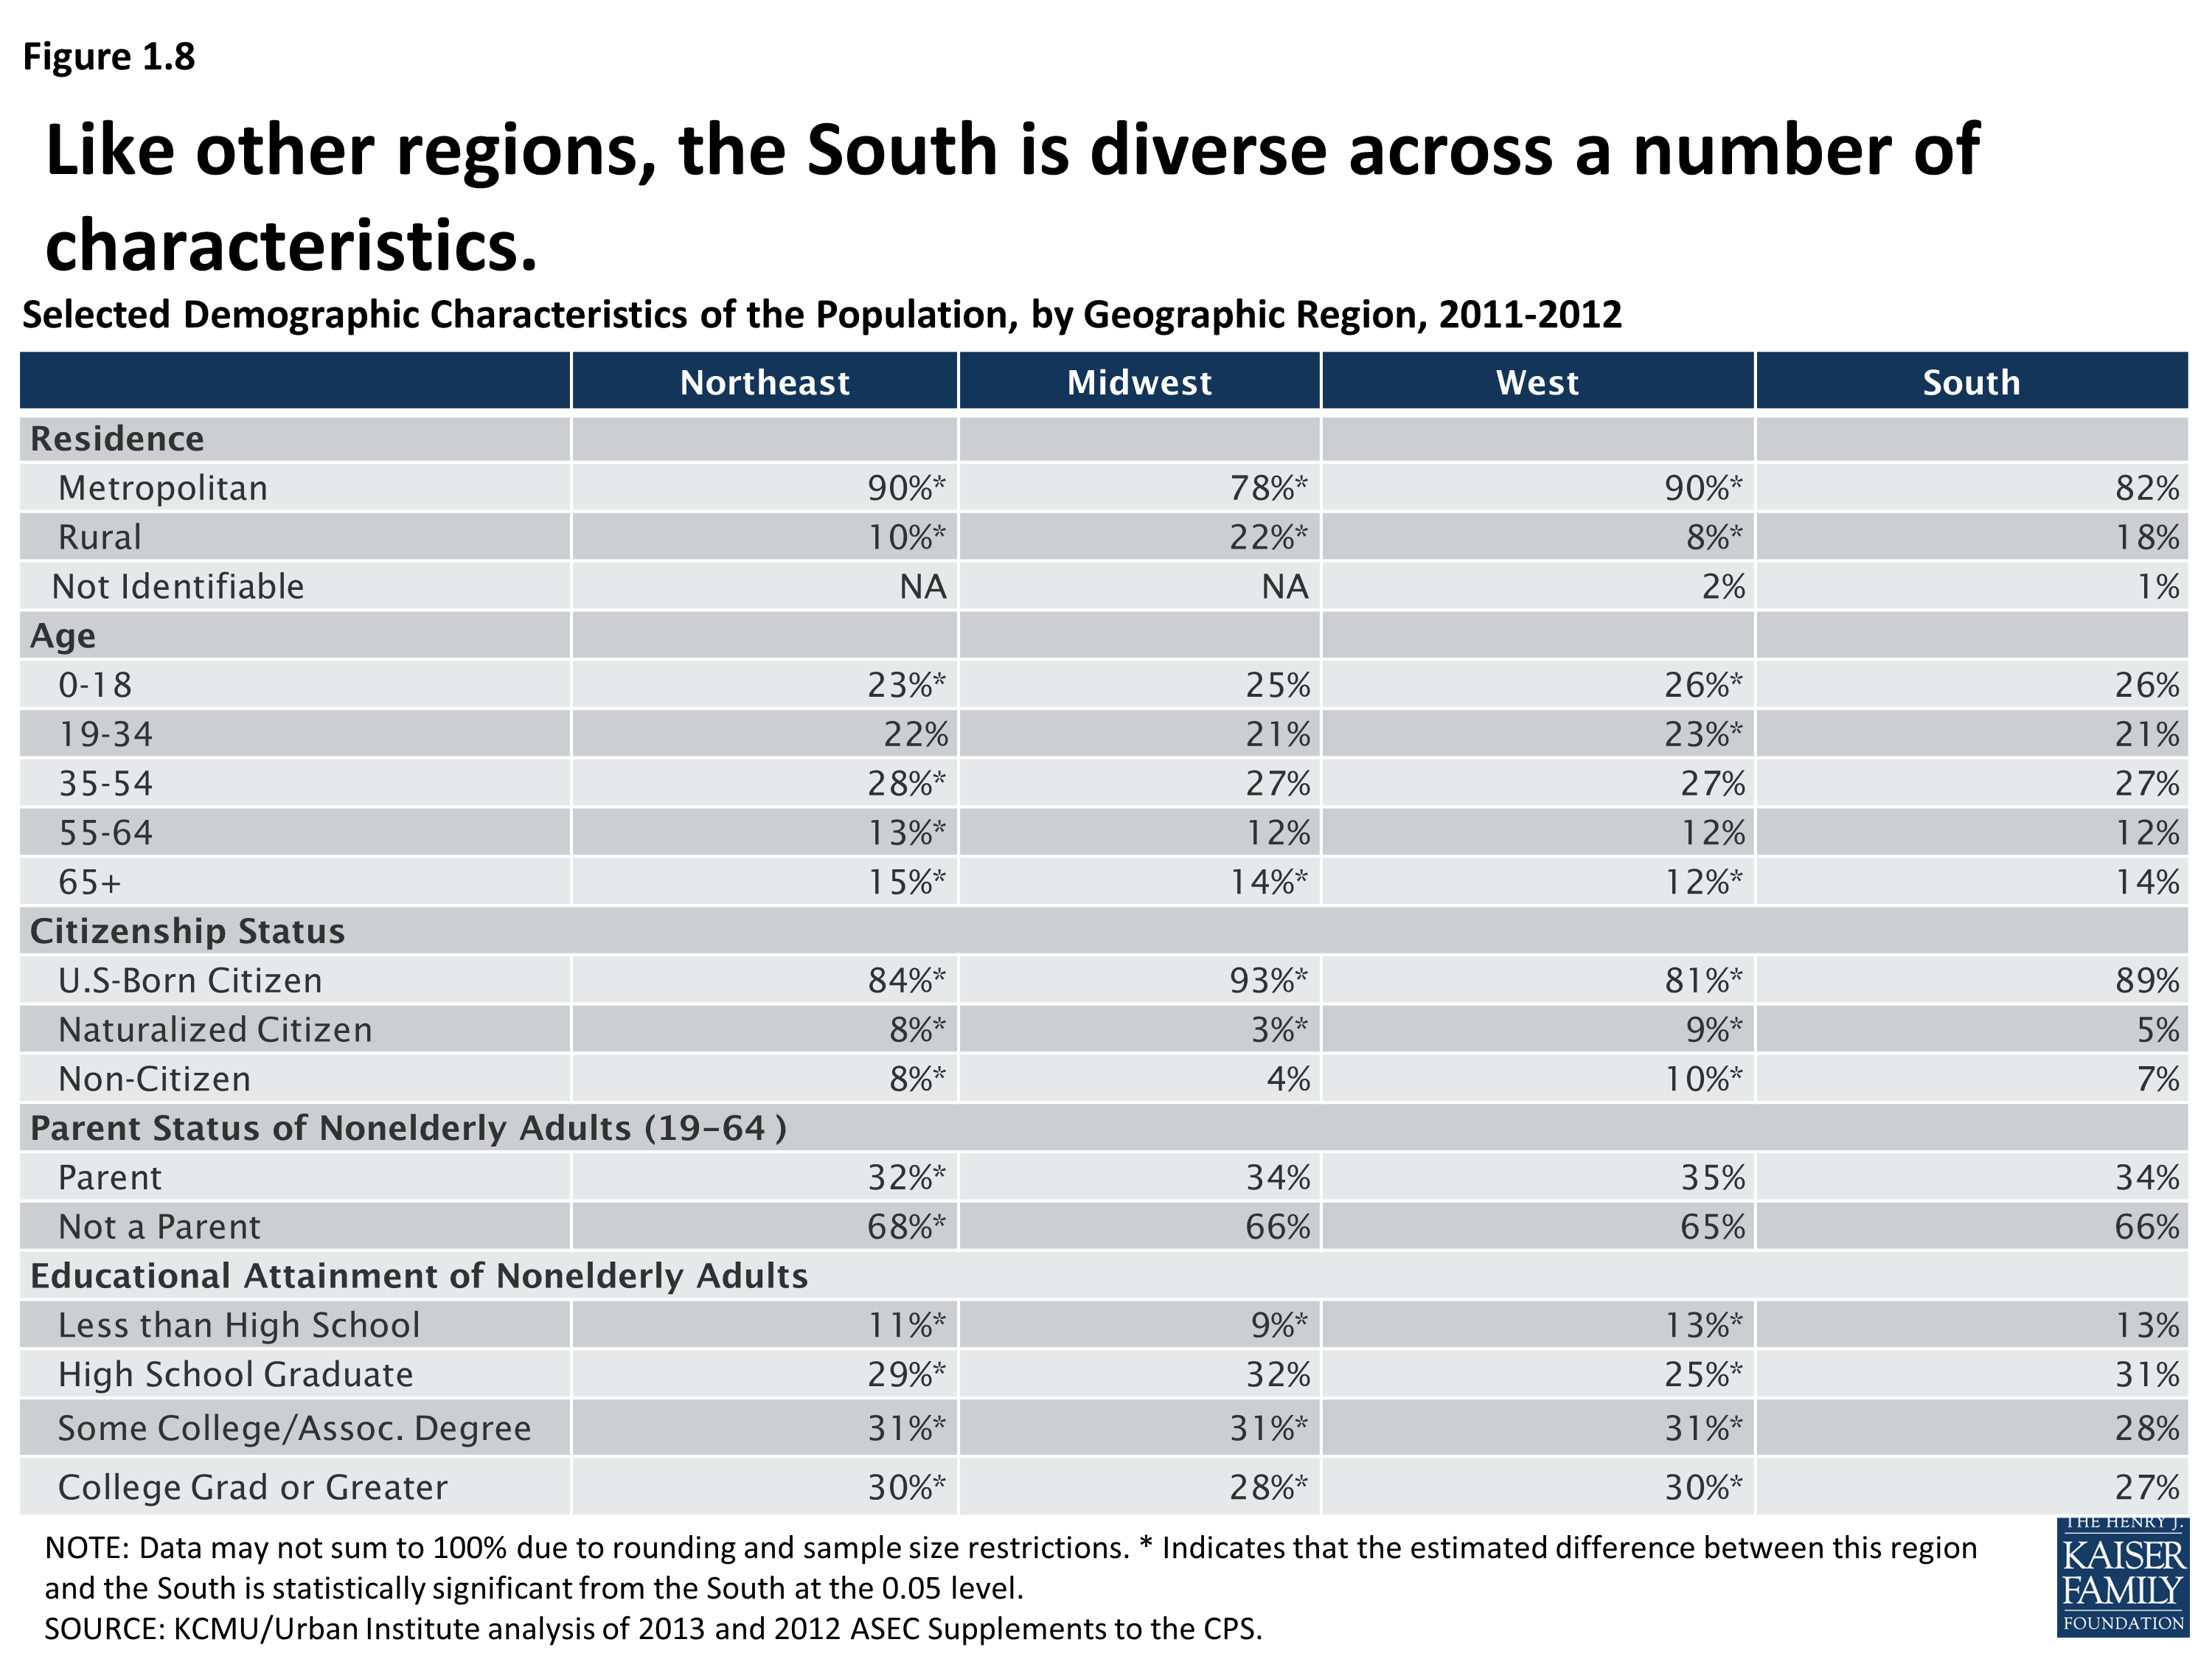
Selected Demographic Characteristics of the Population, by Geographic Region, 2011-2012
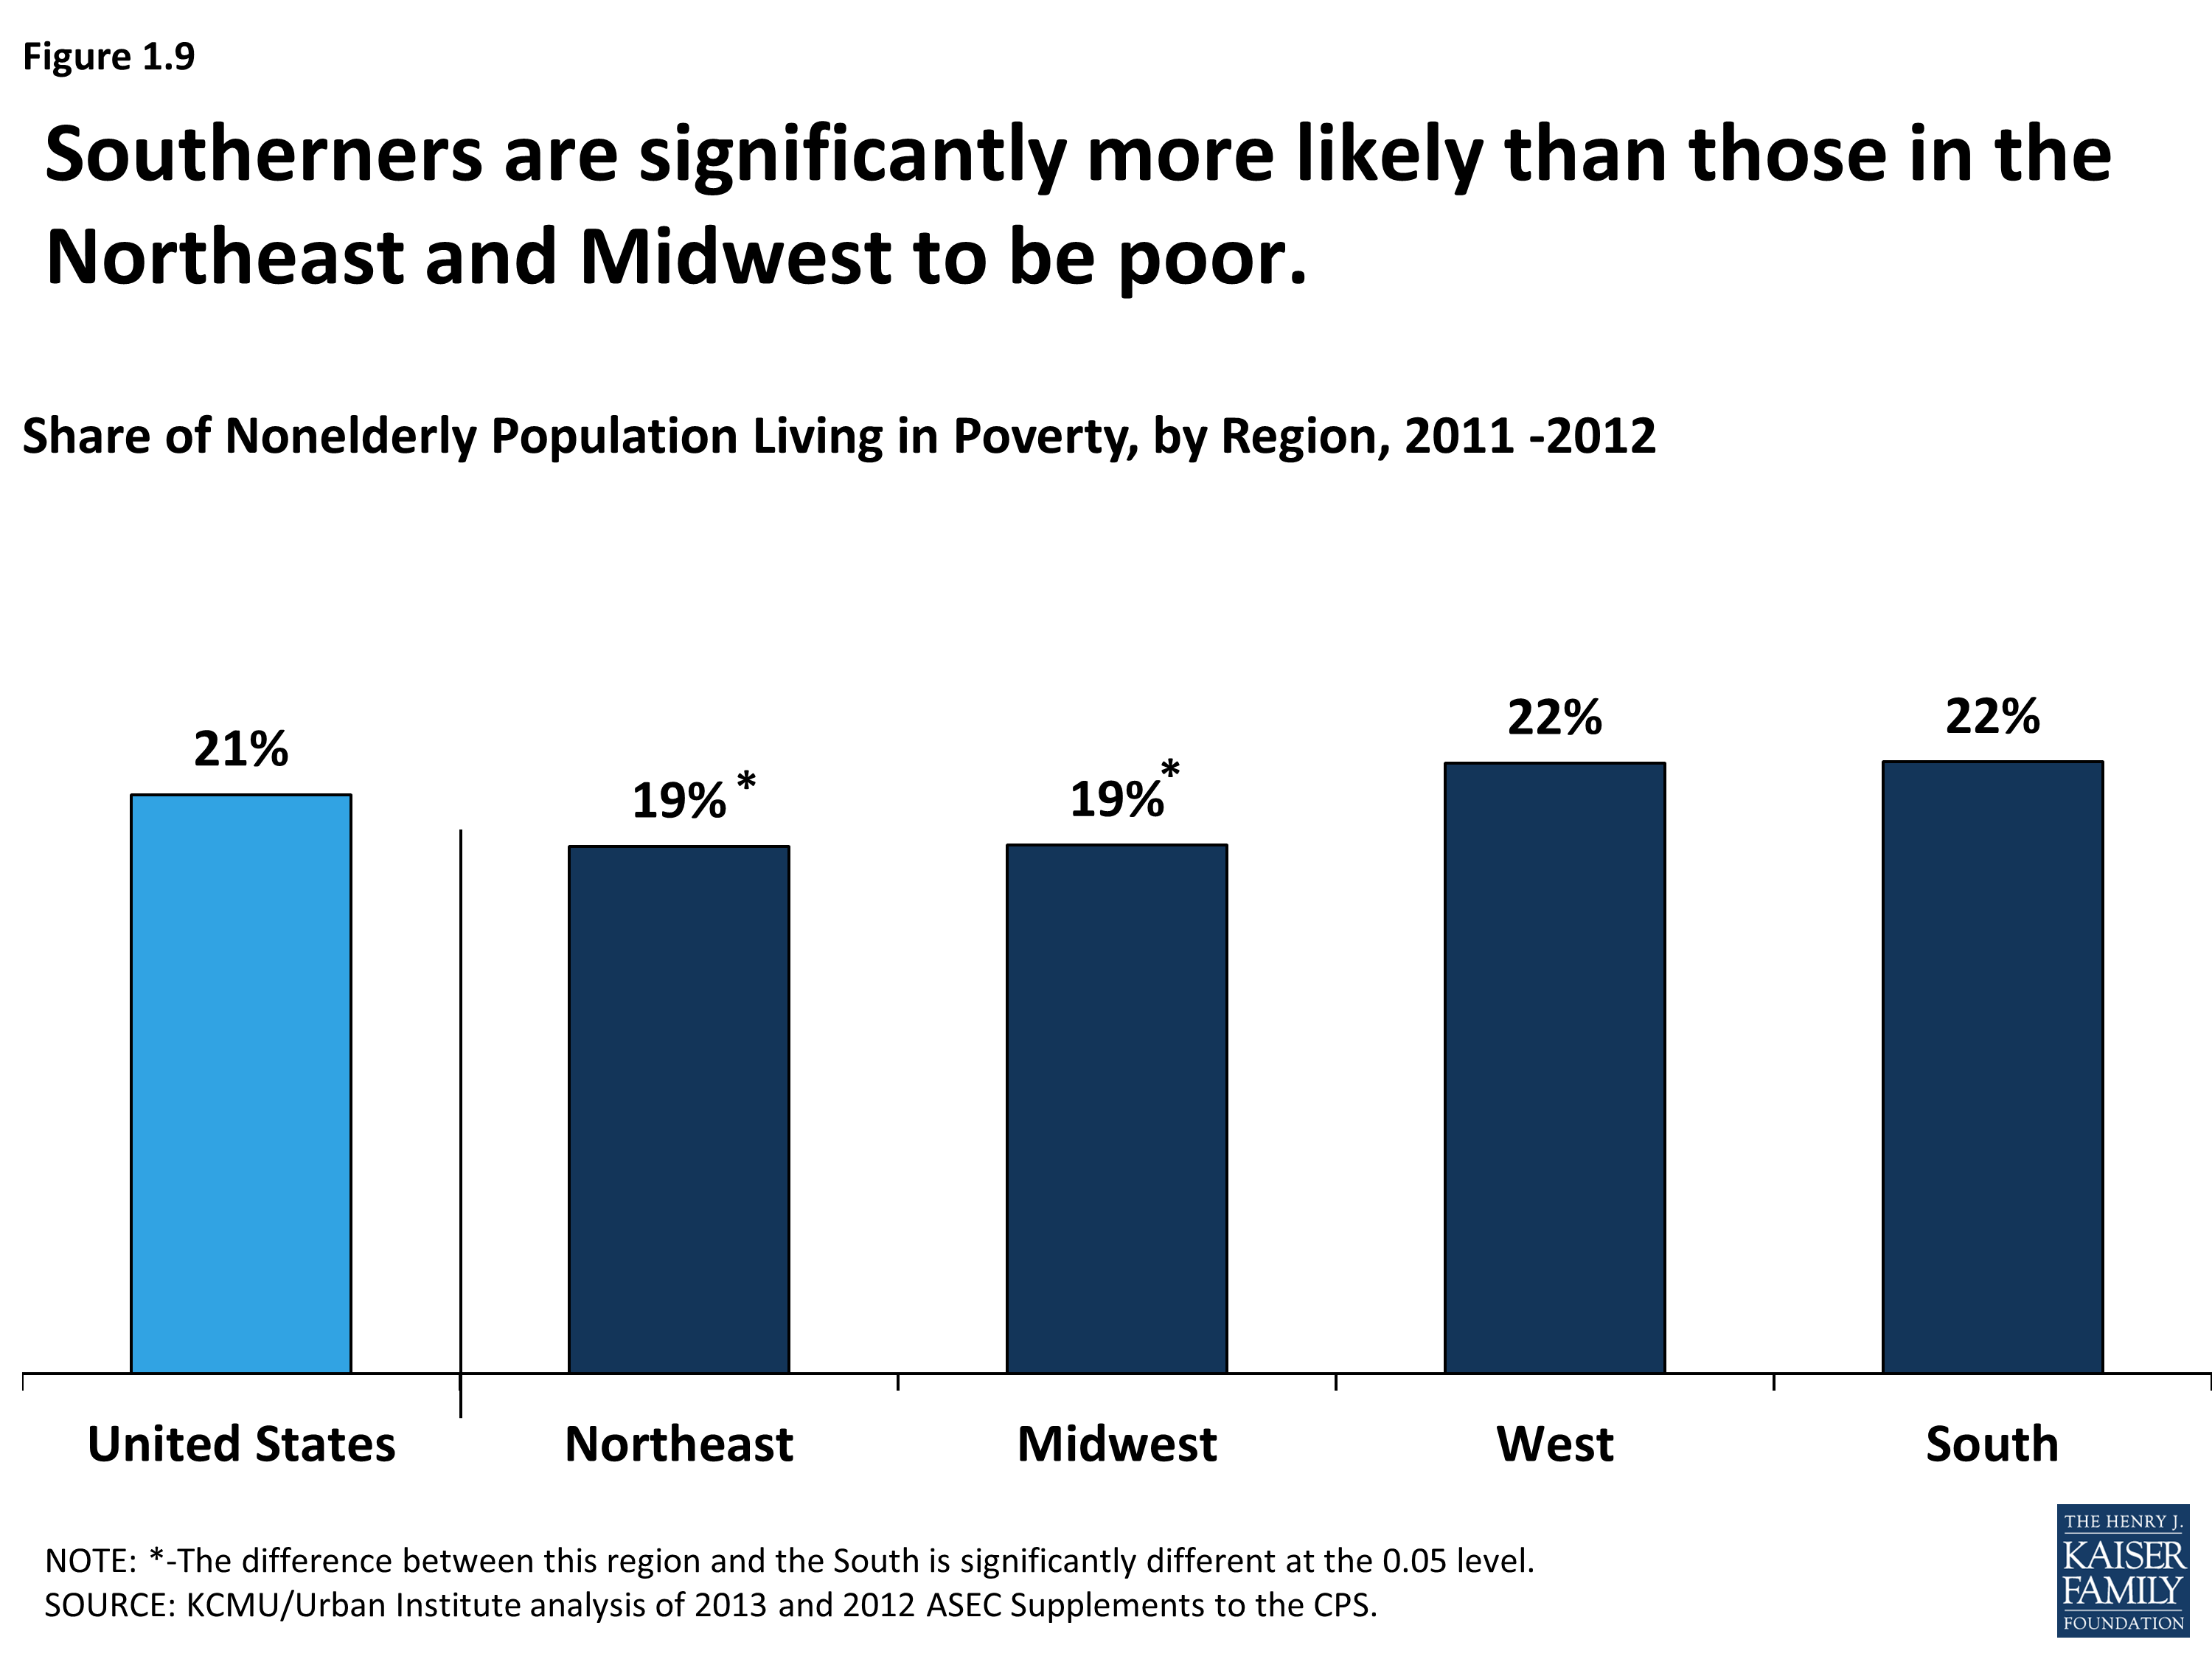
Share of Nonelderly Population Living in Poverty, by Region, 2011-2012
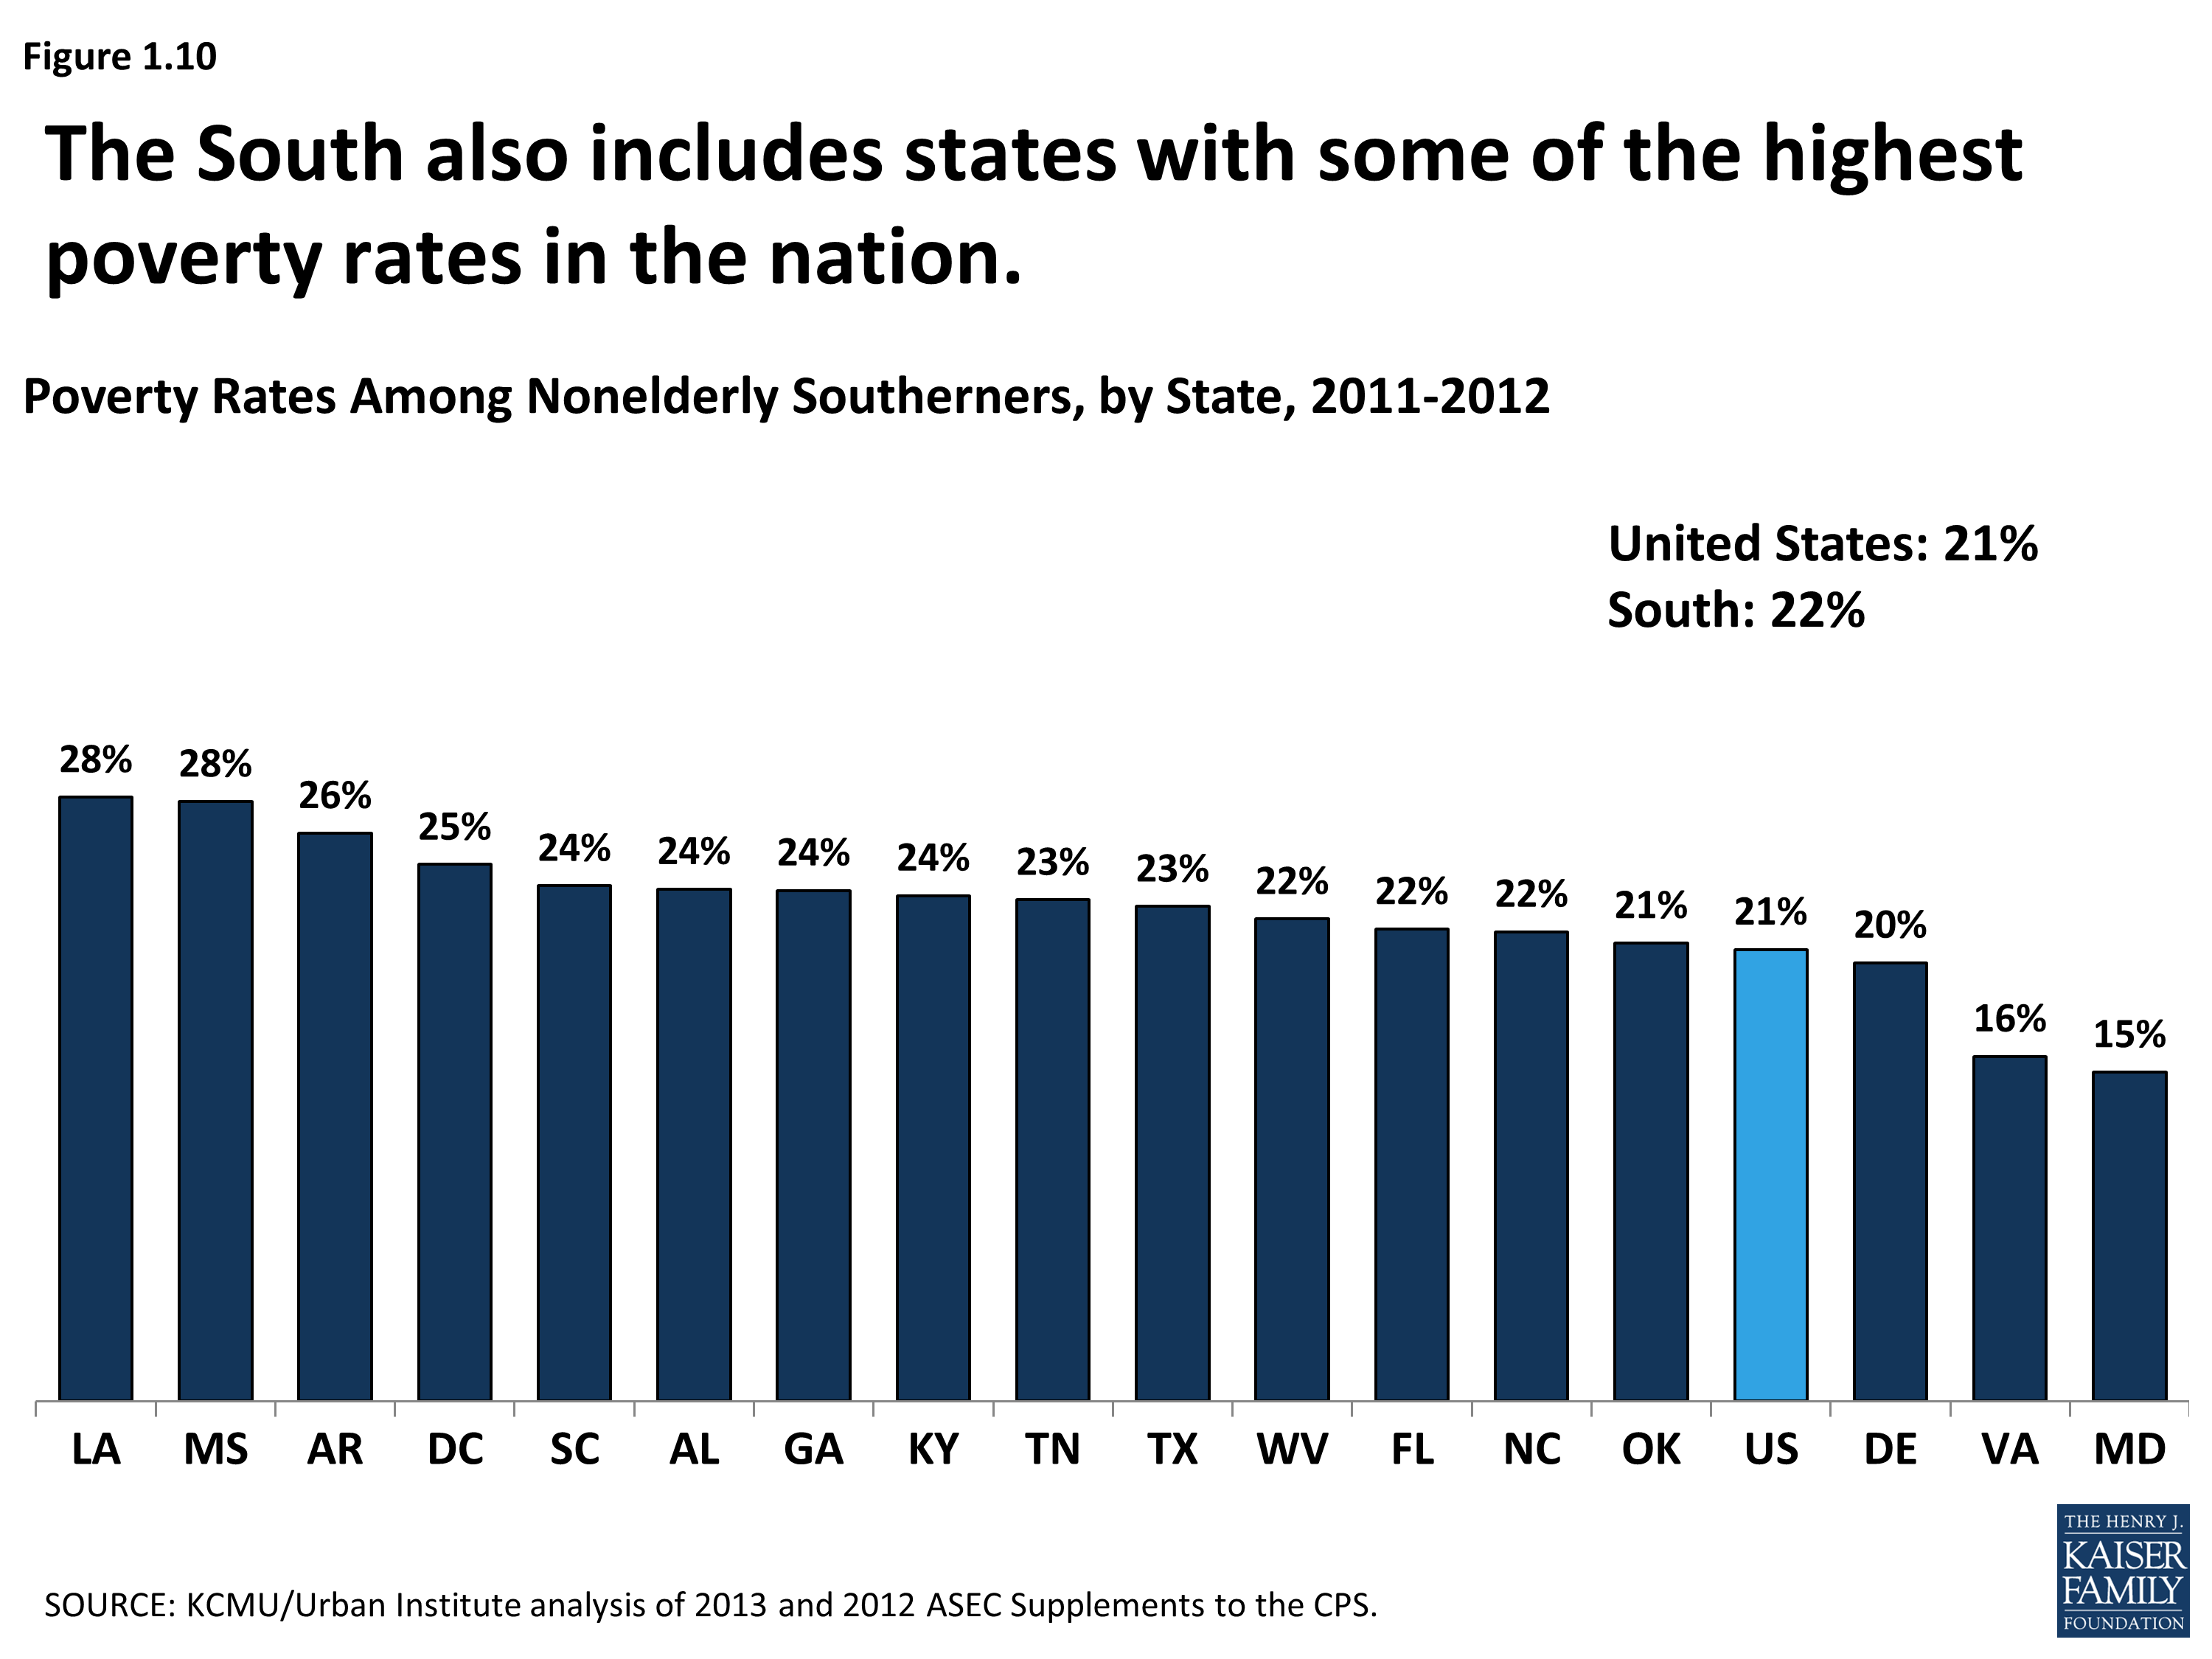
Poverty Rates Among Nonelderly Southerners, by State, 2011-2012
Section 2: The Southern Economy
The southern states play an important role in the national economy, contributing 35 percent of the total U.S. gross domestic product. Work patterns in the South are similar to those in other regions, although Southerners are less likely than those in other regions to be unemployed. Overall, Southerners earn less per capita than individuals in other regions of the U.S. However, income varies significantly by state, and, in four states, per capita earnings are higher than the national average. Earnings also vary widely within states, and several southern states have among the highest levels of income inequality in the country.
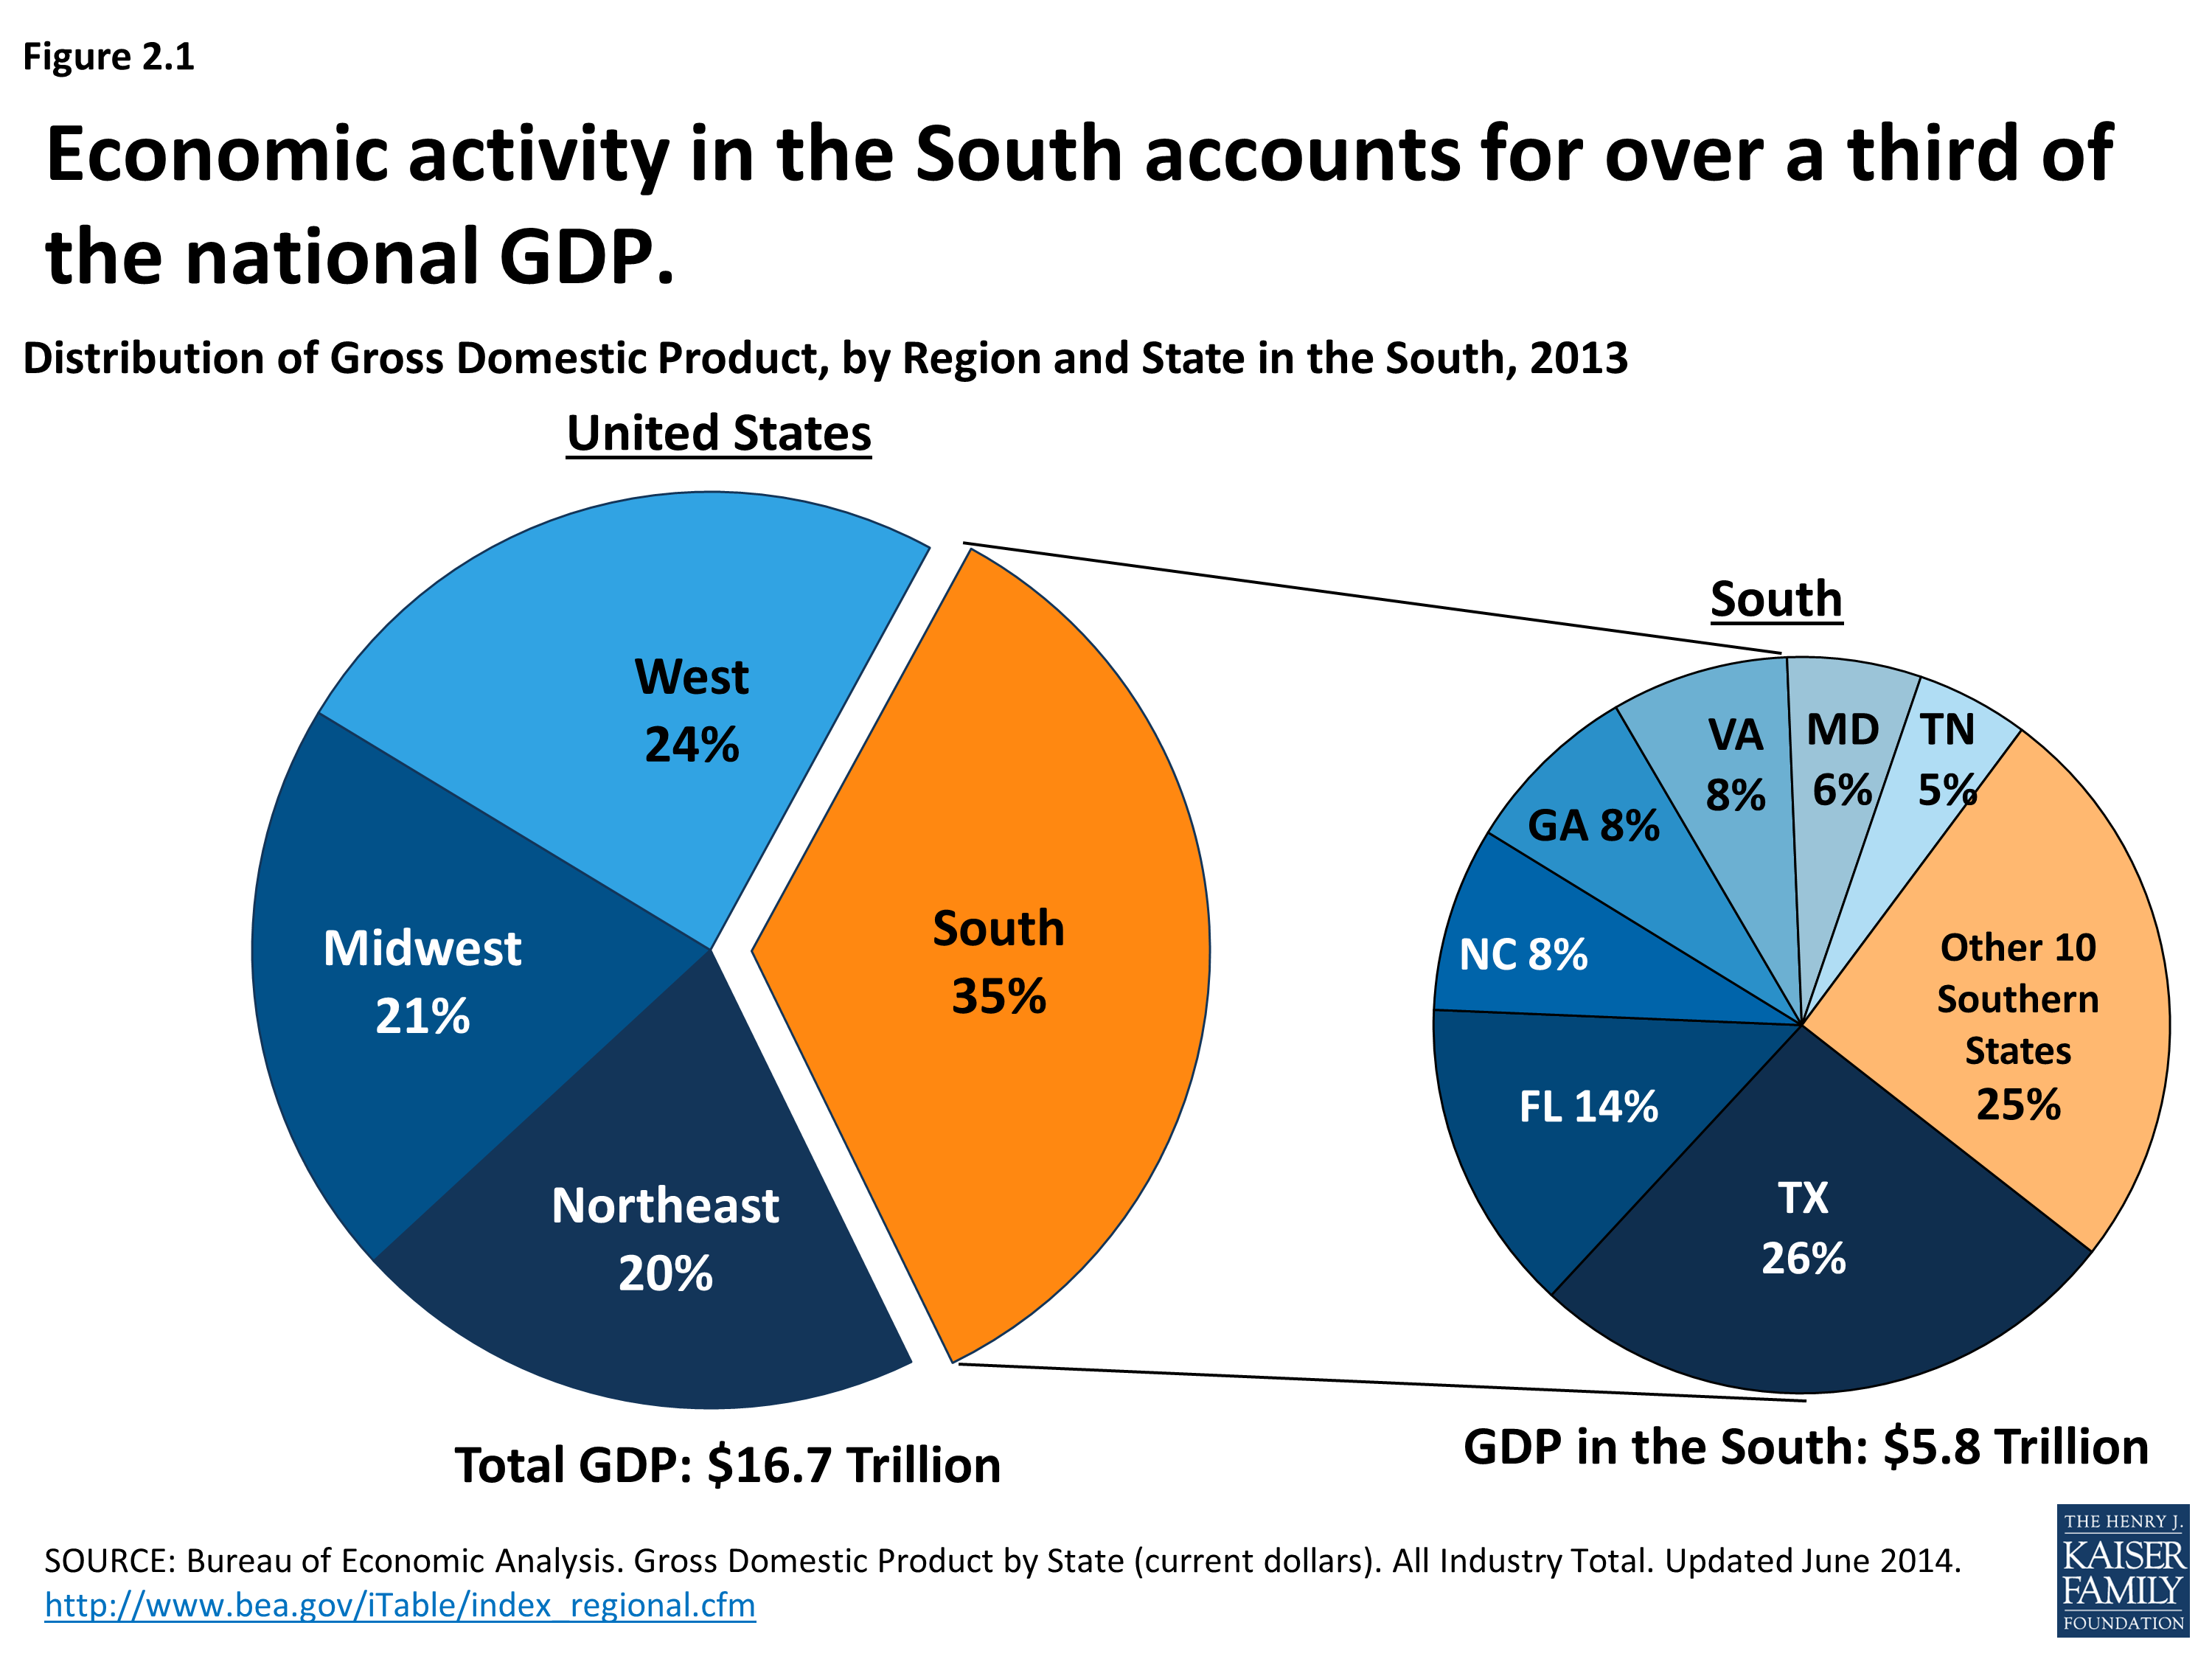
Distribution of Gross Domestic Product, by Region and State in the South, 2013
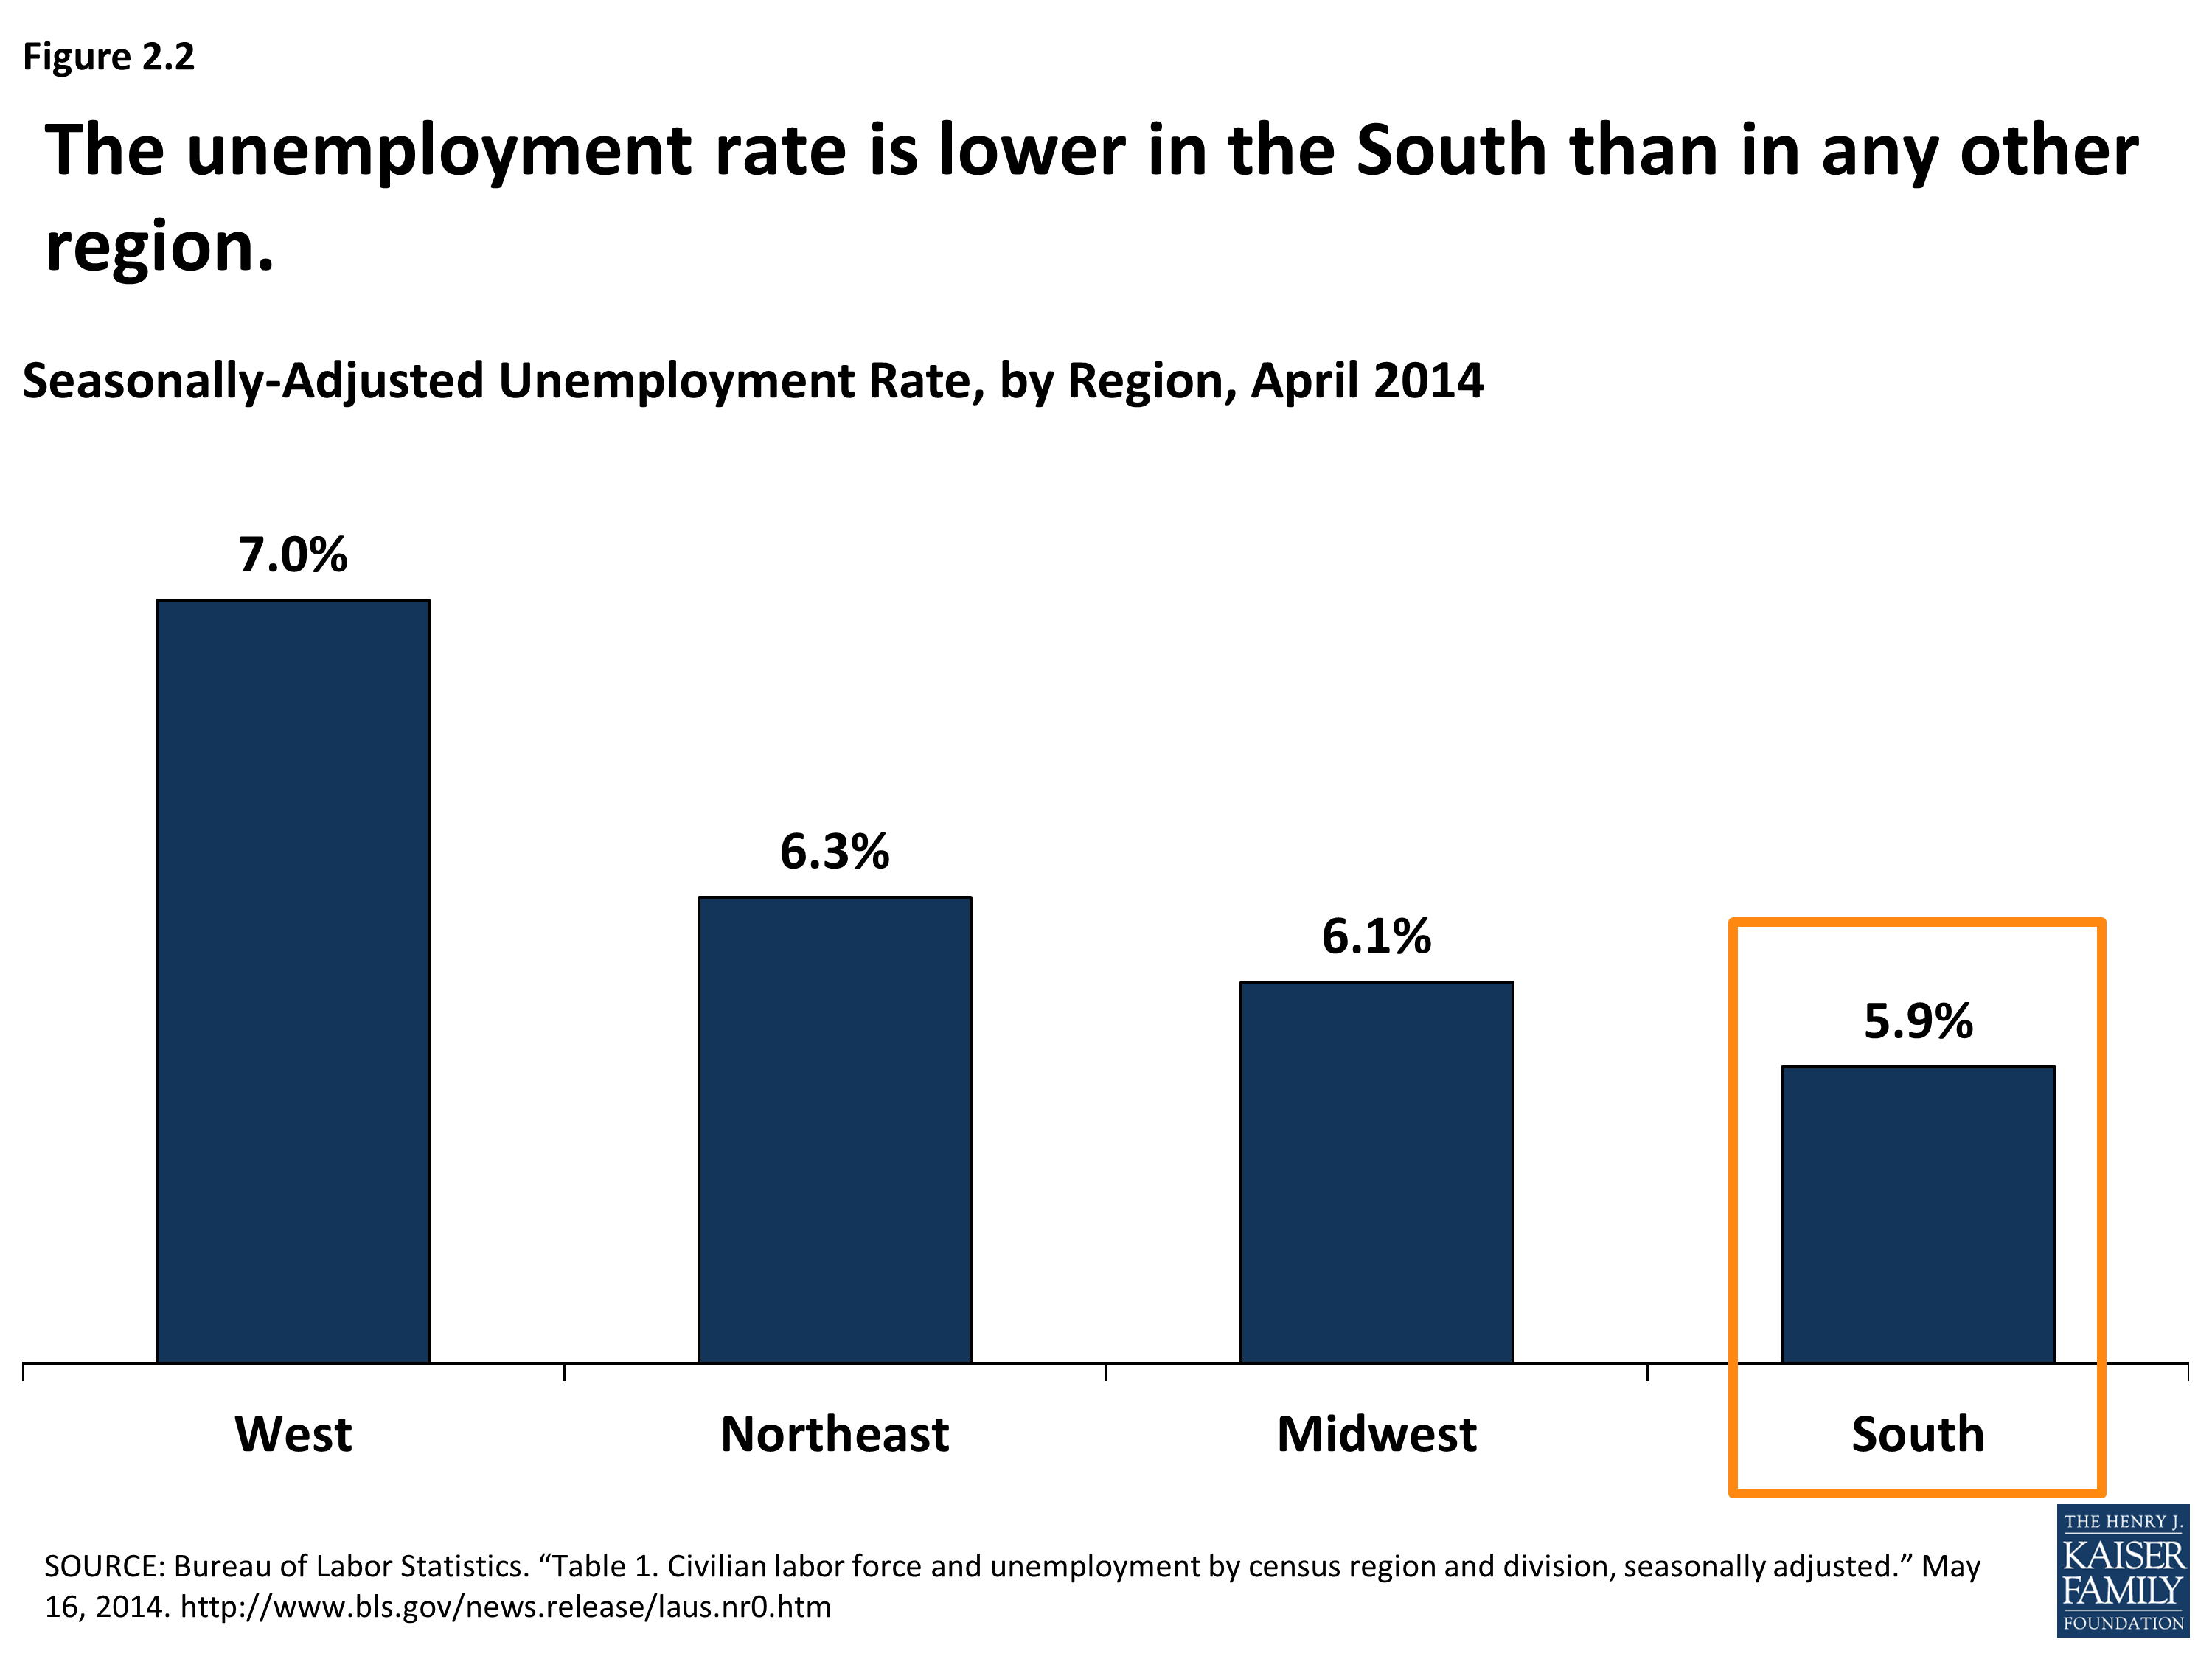
Seasonally-Adjusted Unemployment Rate, by Region, April 2014
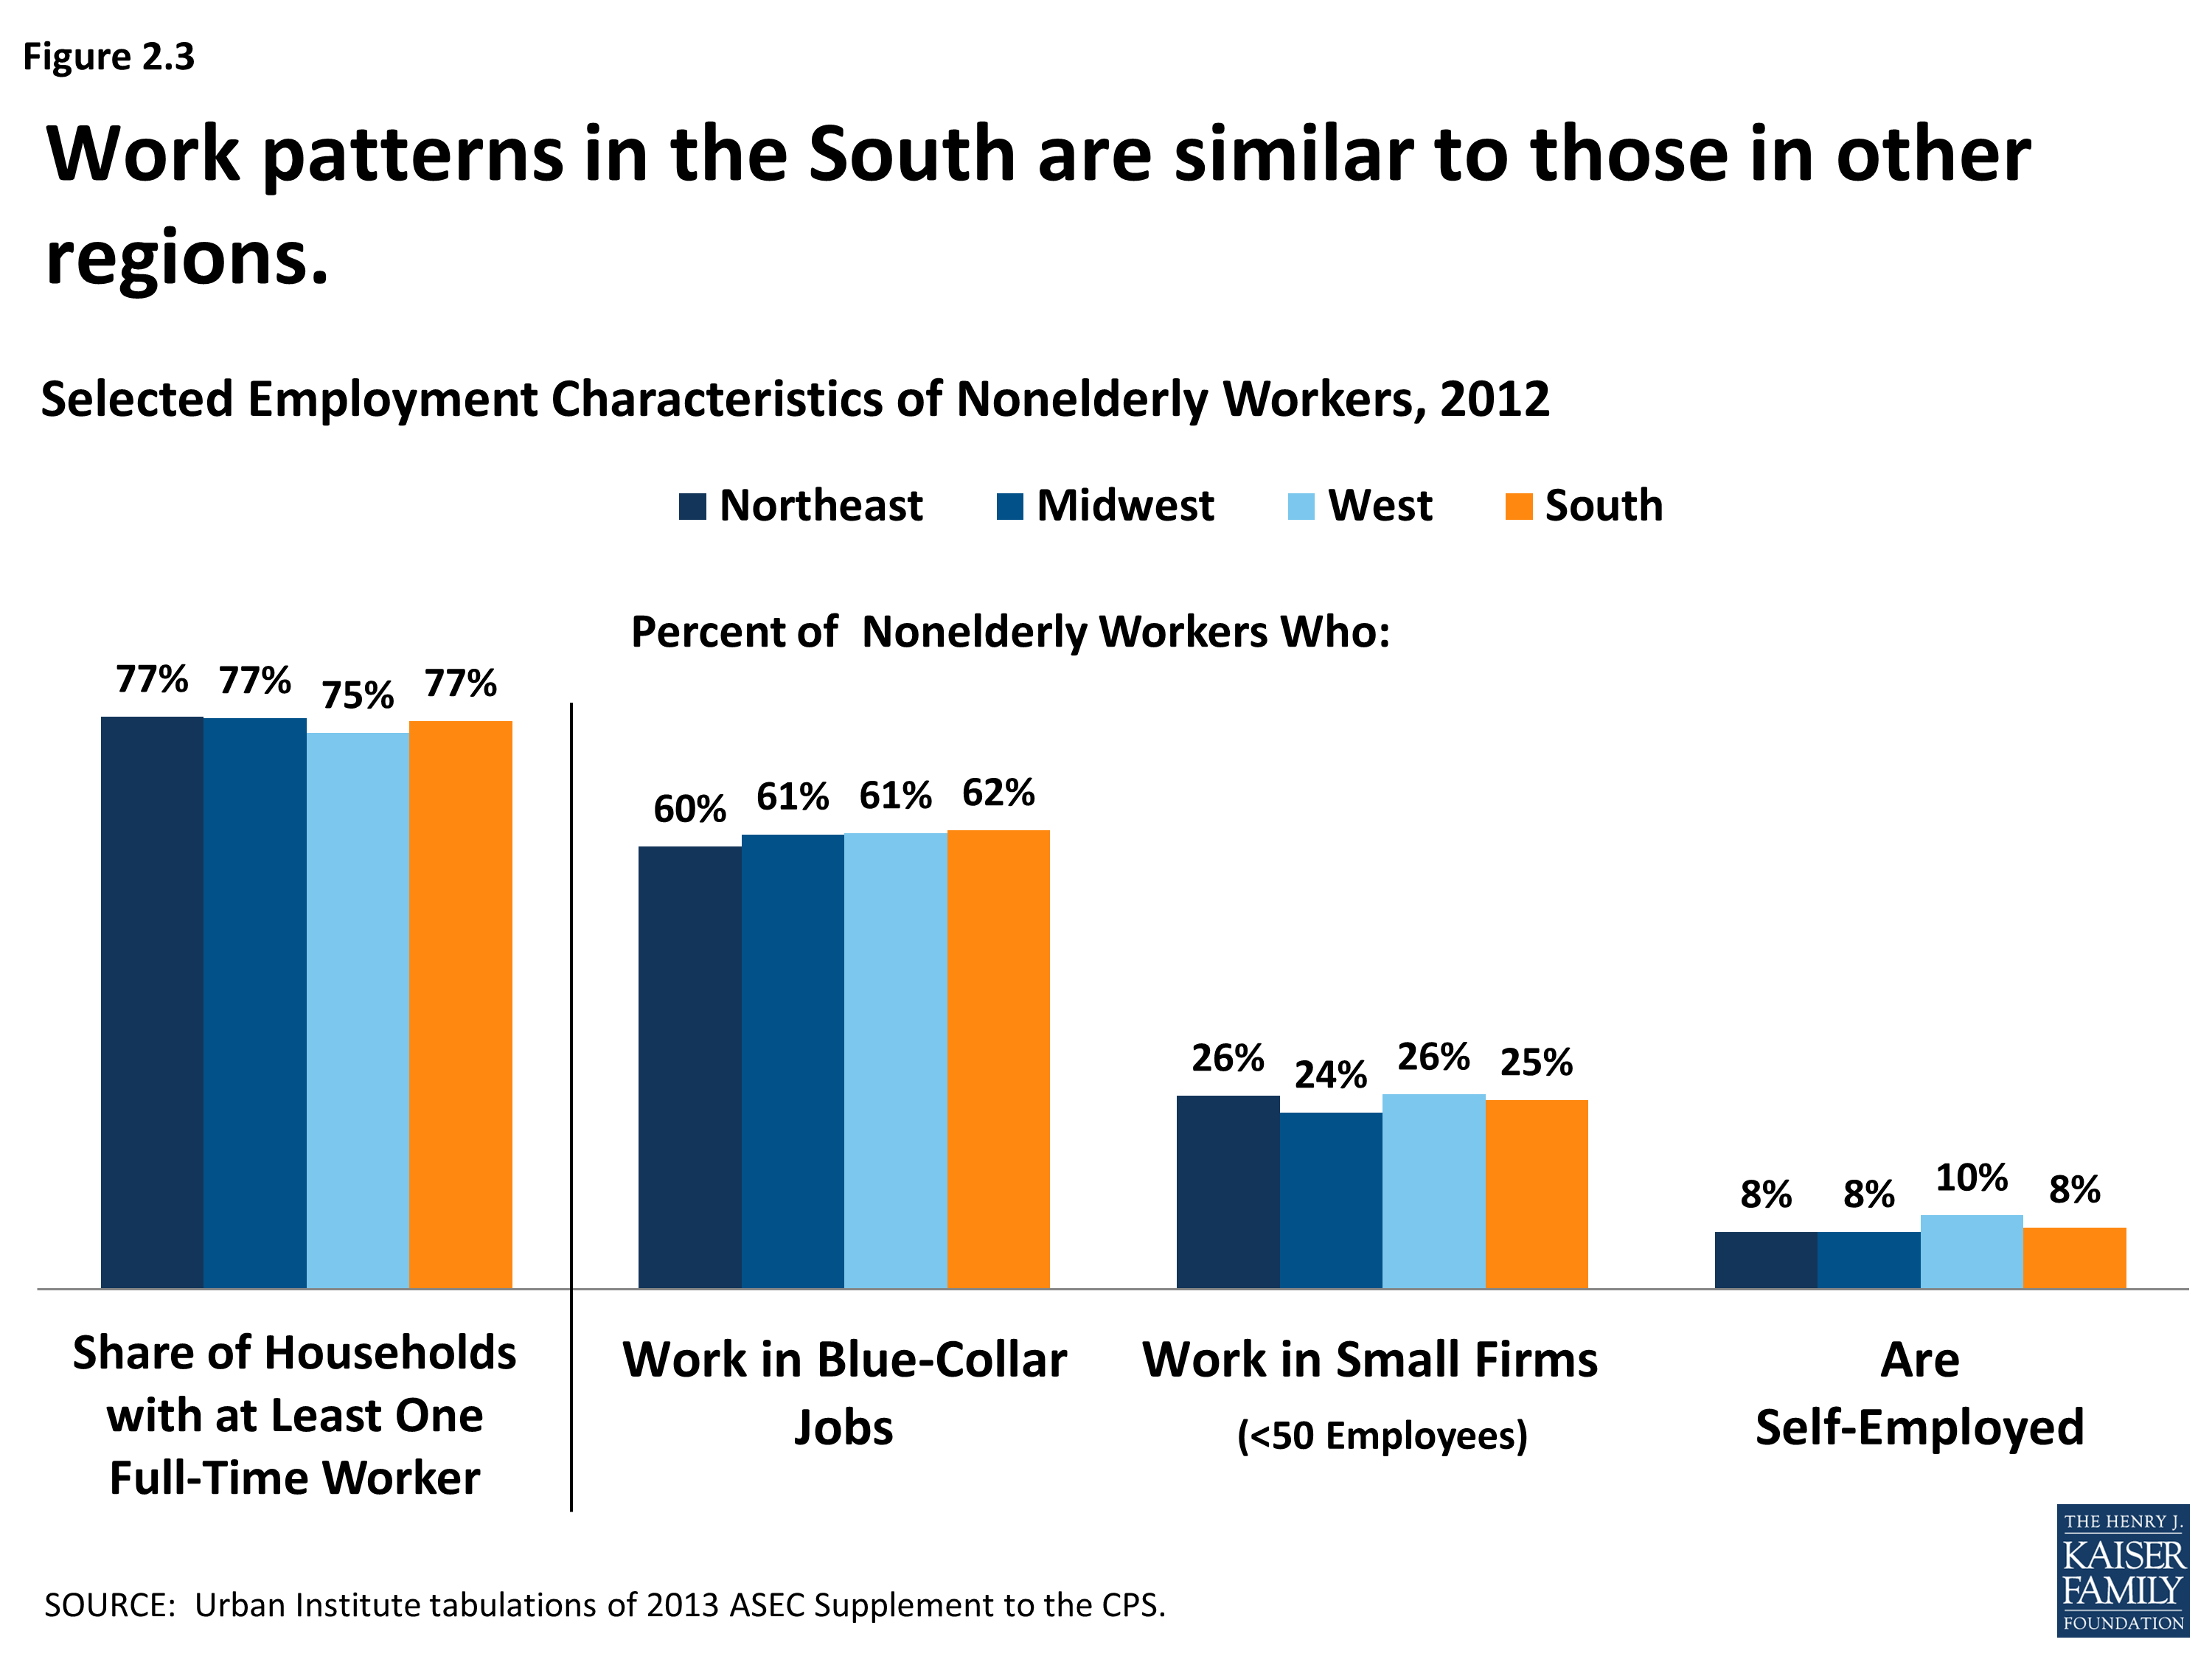
Selected Employment Characteristics of Nonelderly Workers, 2012
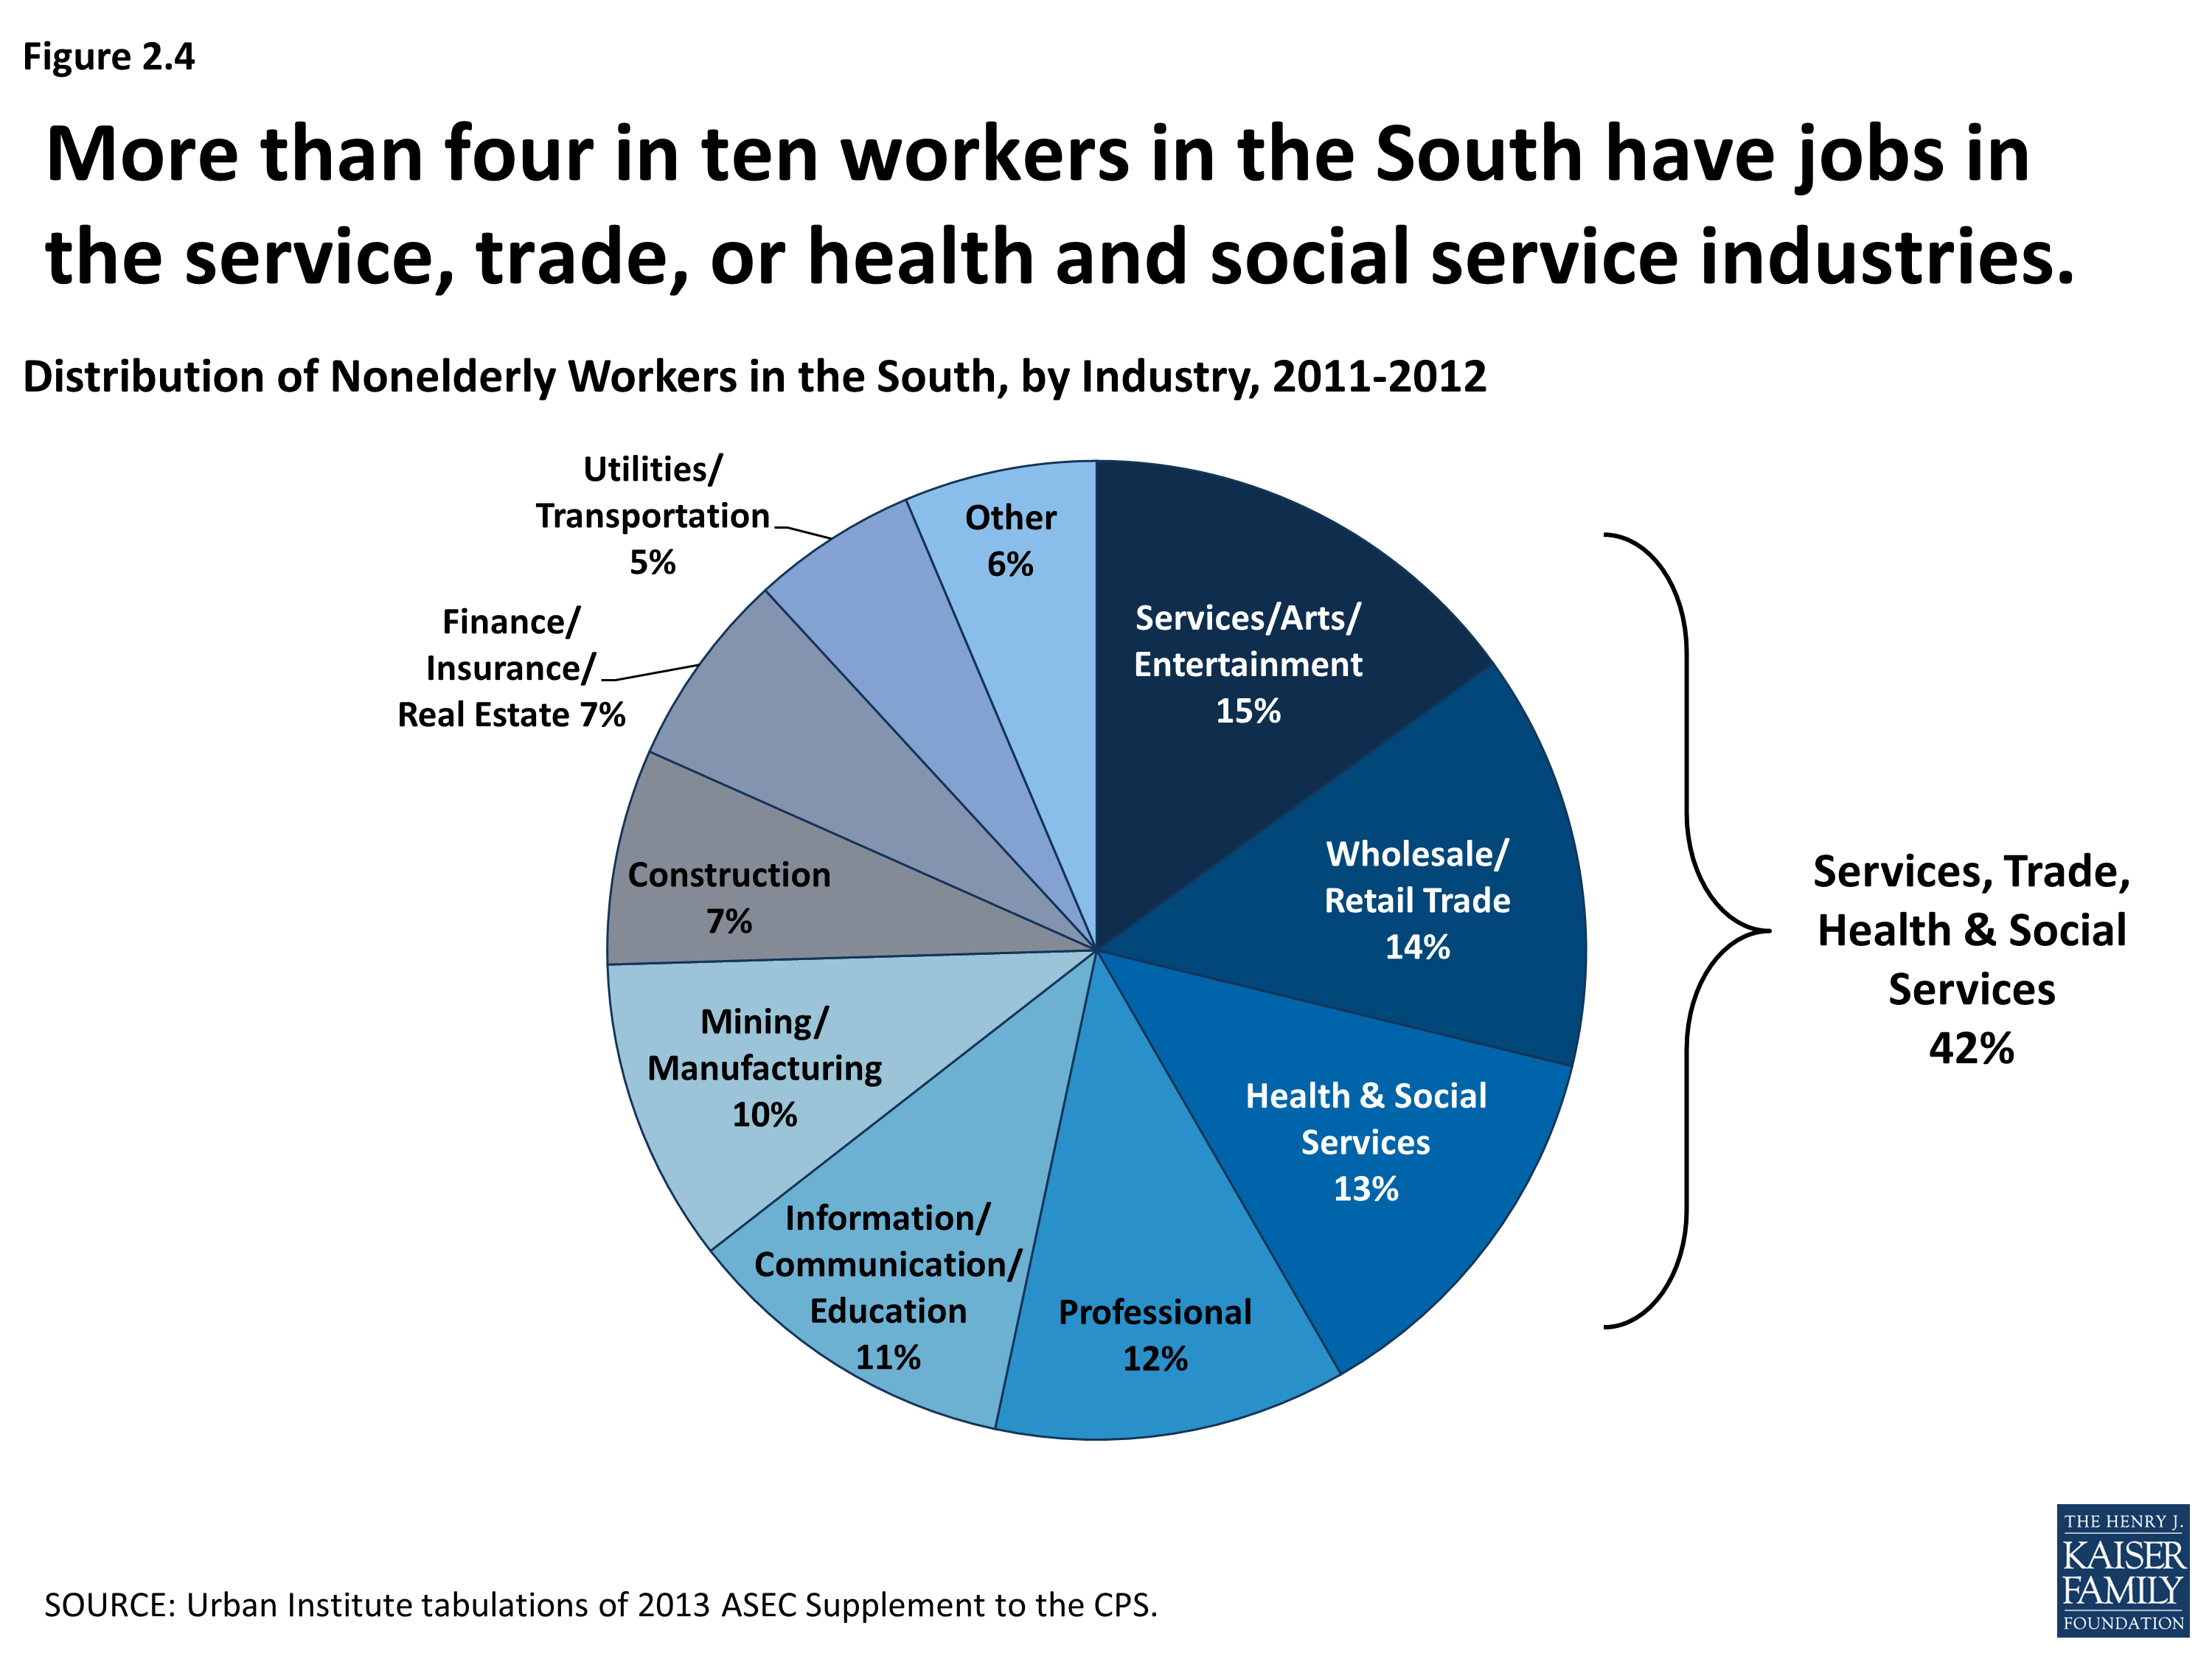
Distribution of Nonelderly Workers in the South, by Industry, 2011-2012
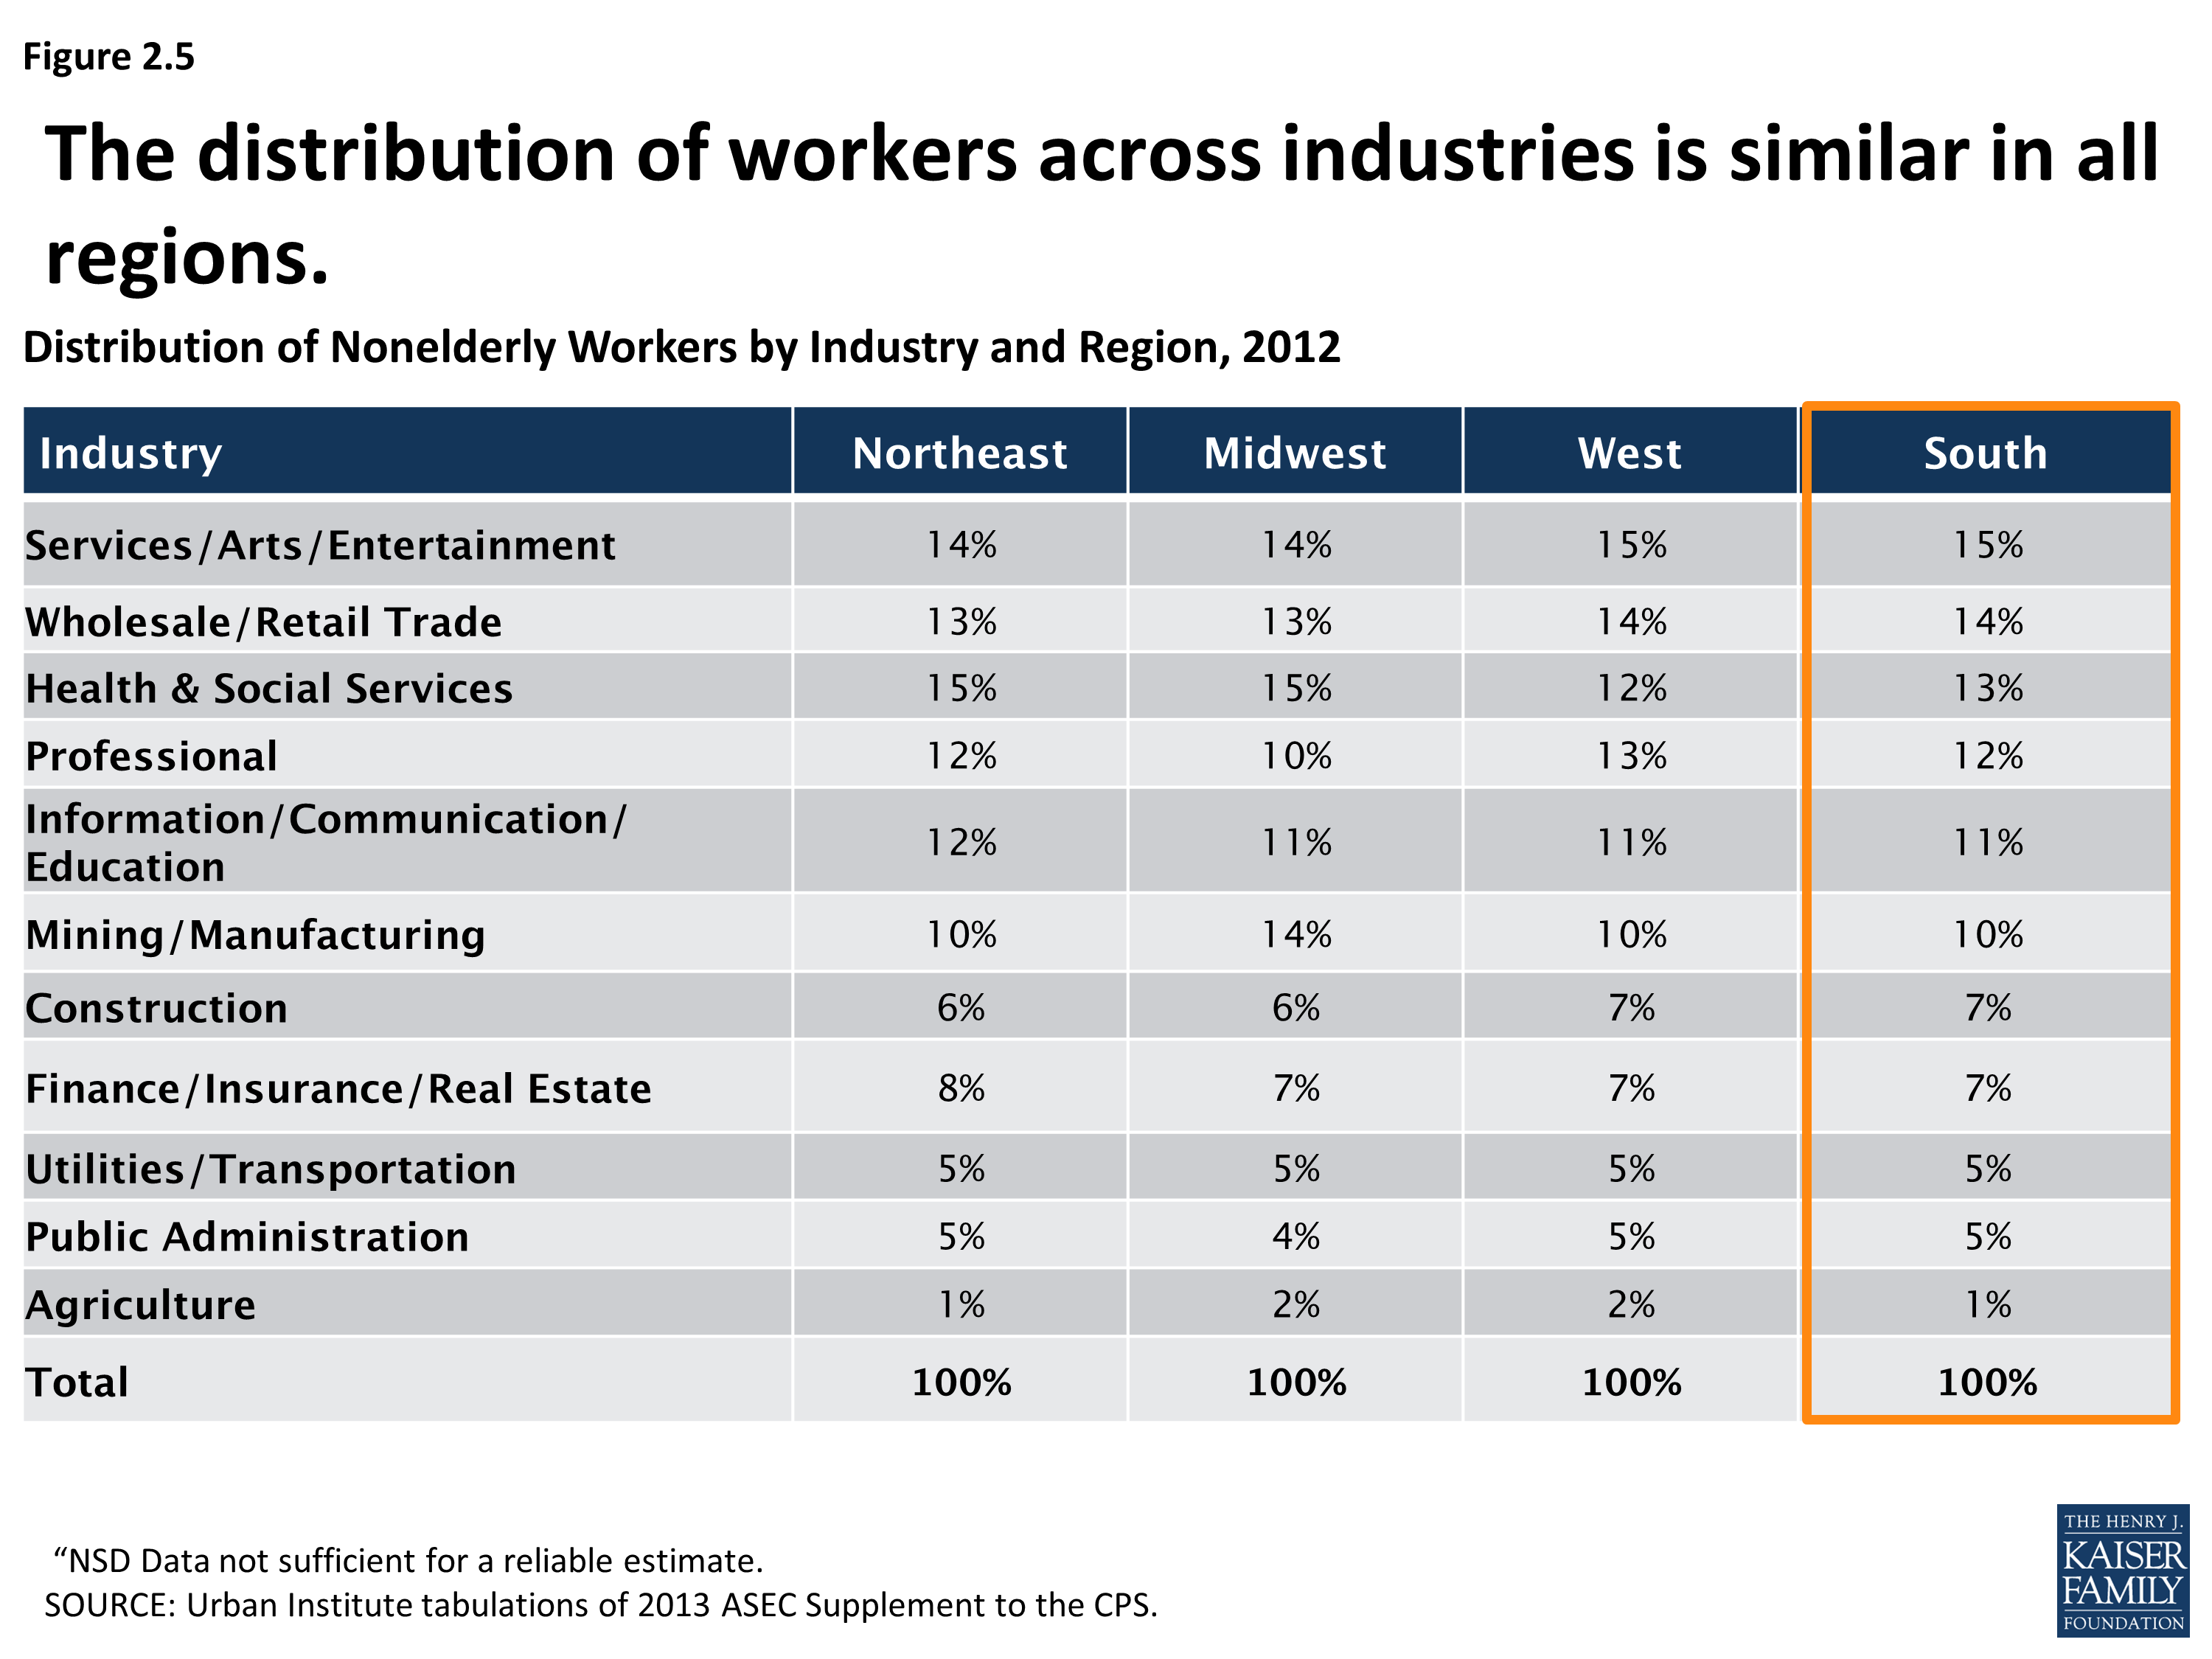
Distribution of Nonelderly Workers by Industry and Region, 2012
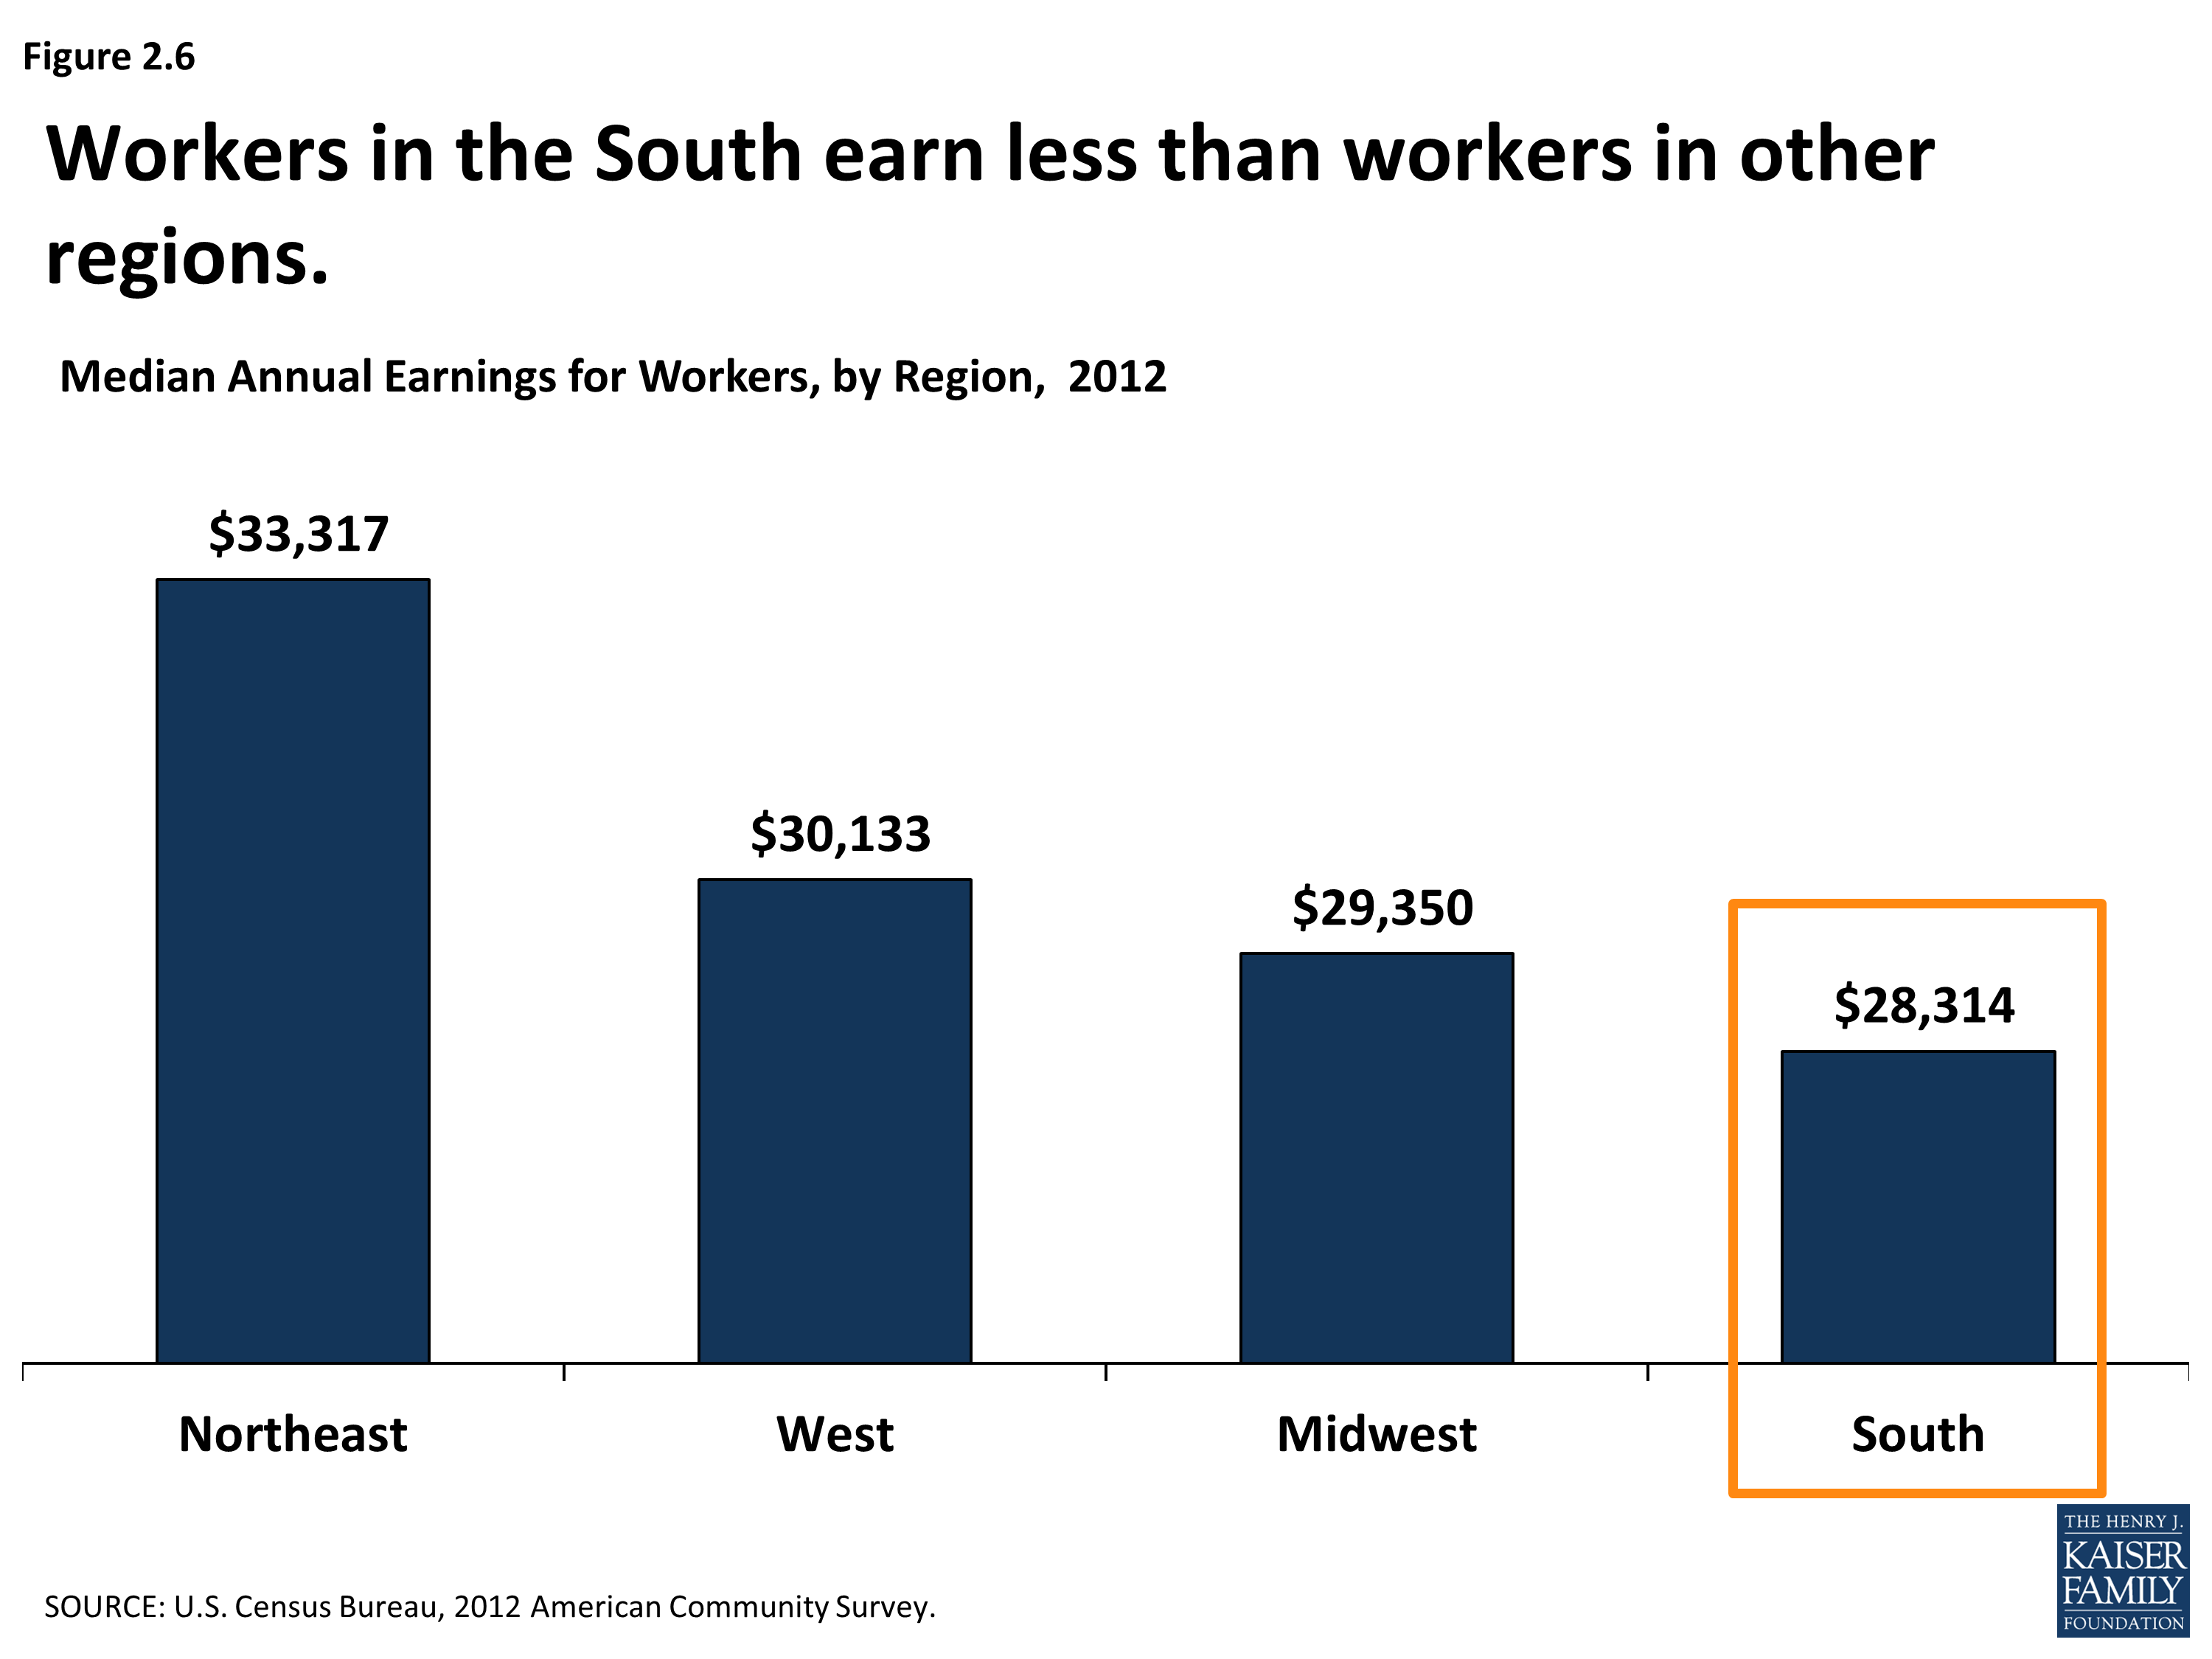
Median Annual Earnings for Workers, by Region, 2012
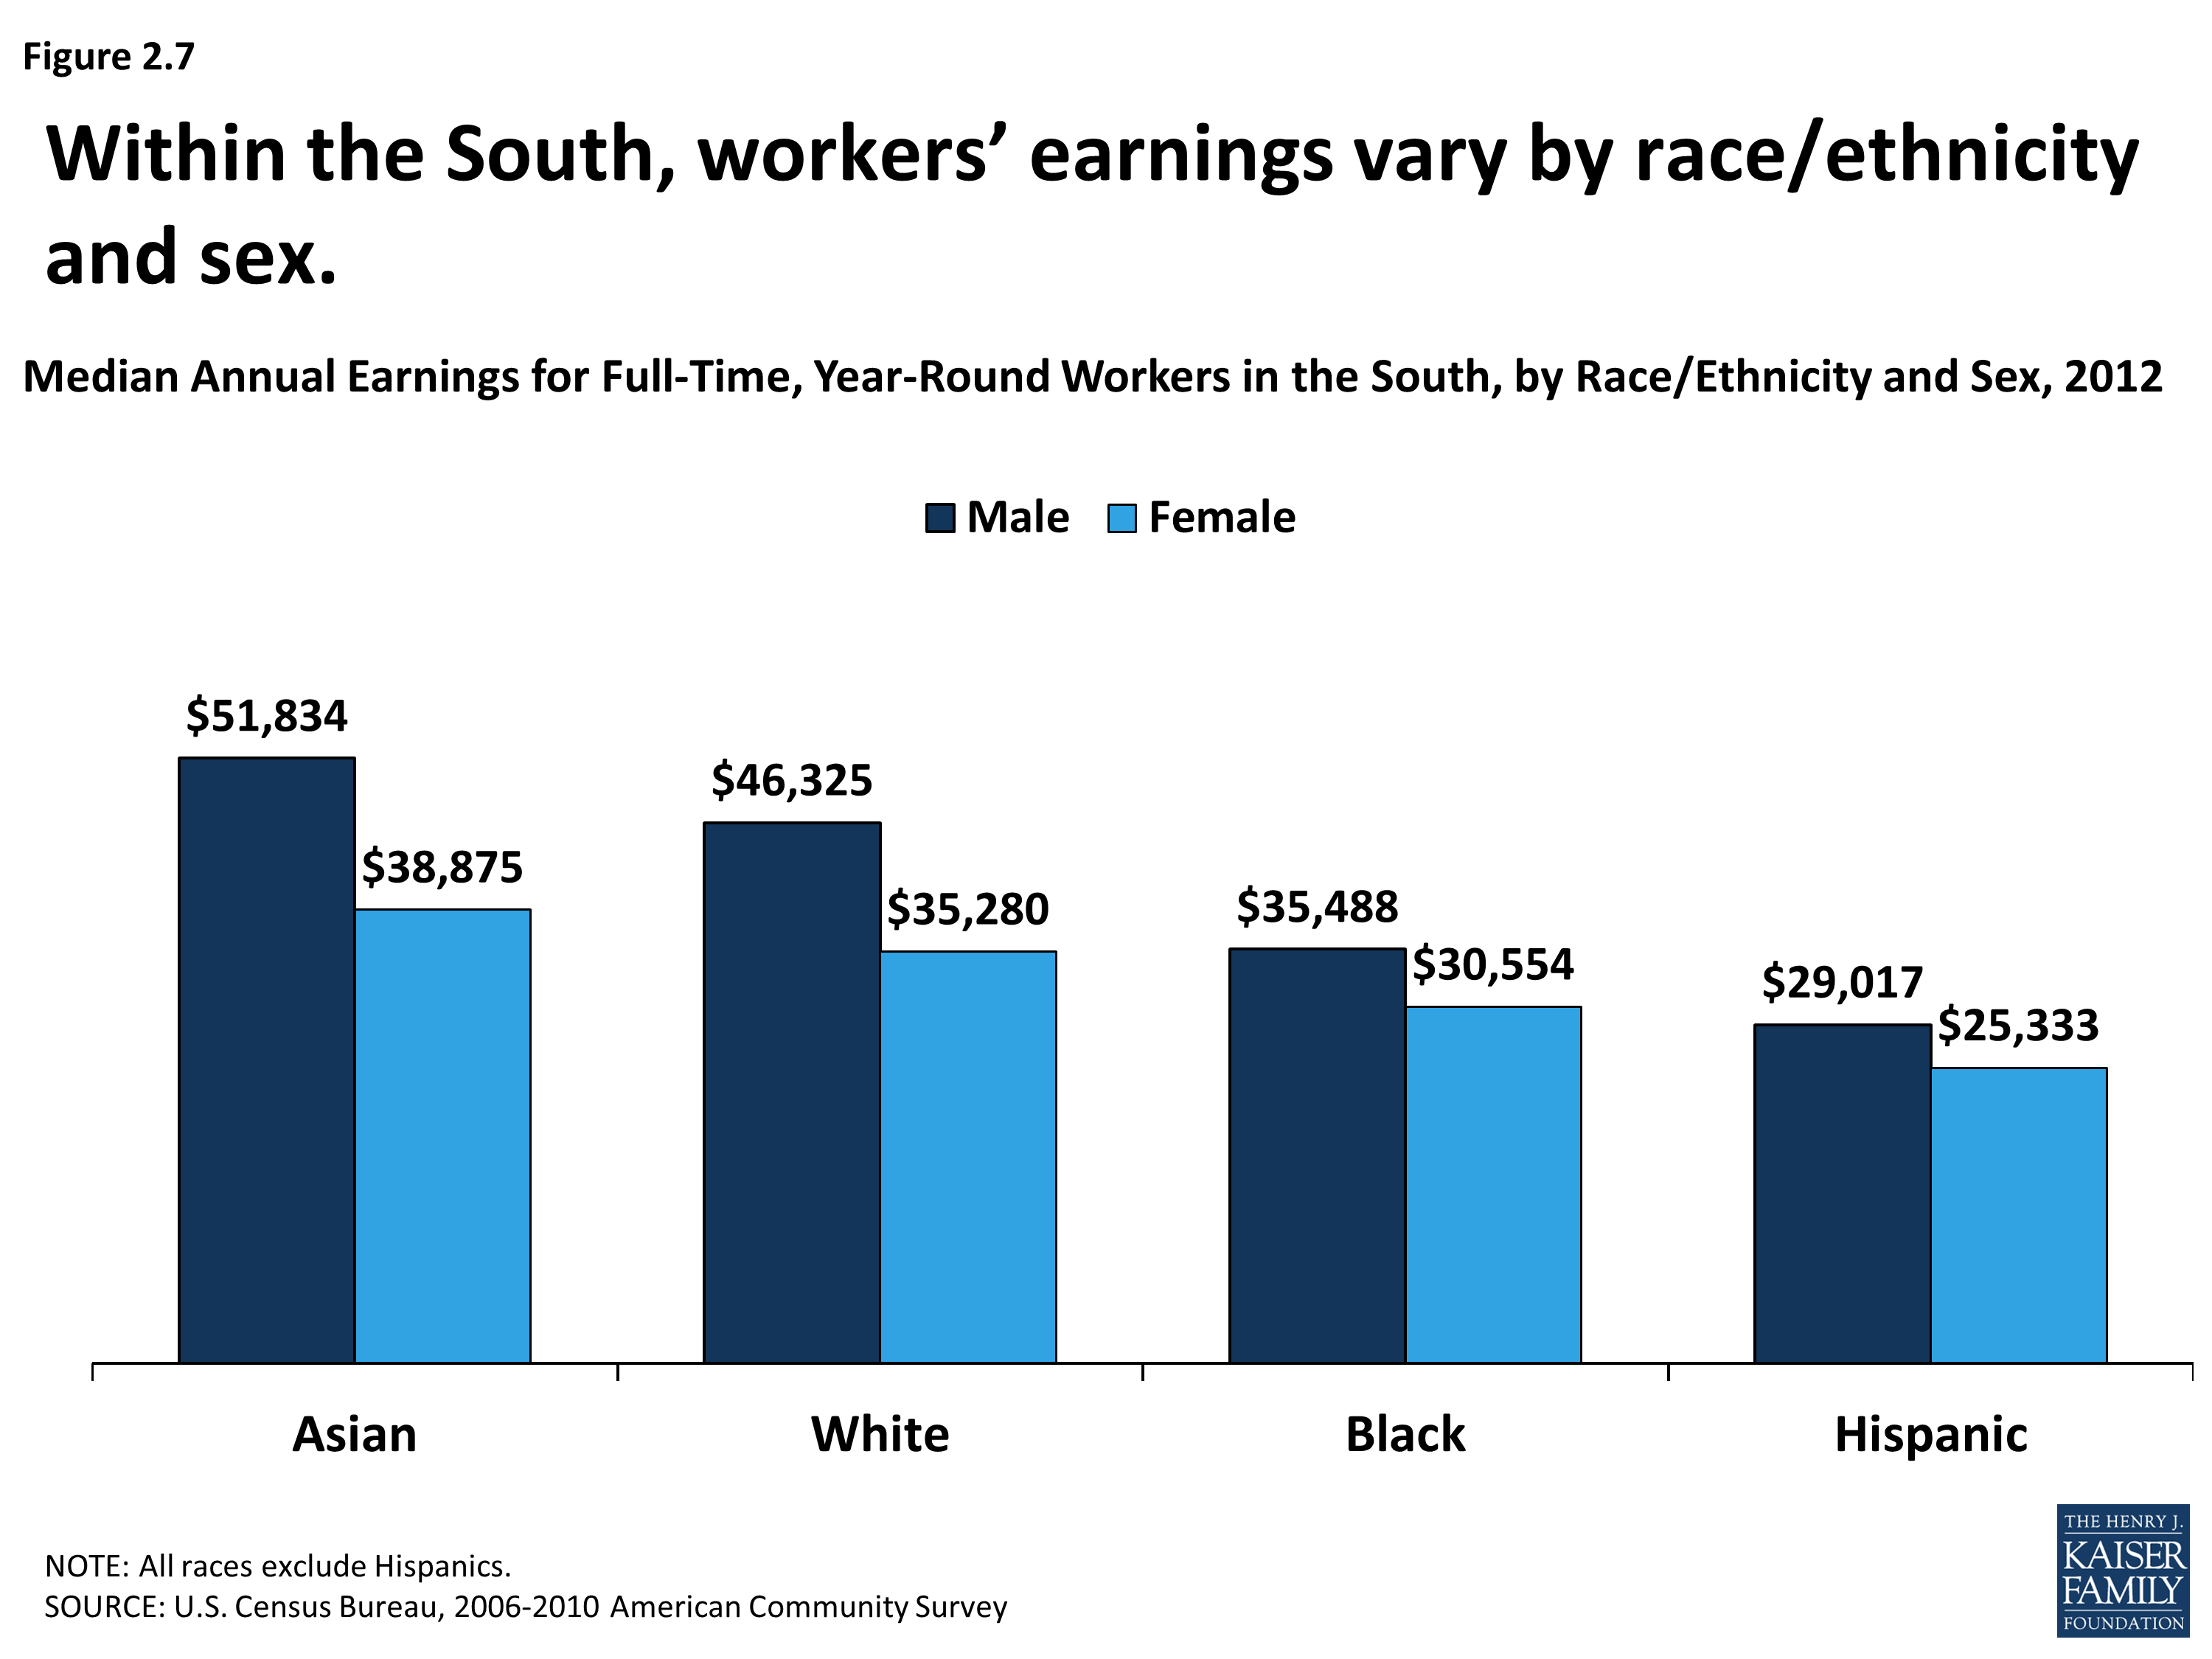
Median Annual Earnings for Full-Time, Year-Round Workers in the South by Race/Ethnicity and Sex, 2012
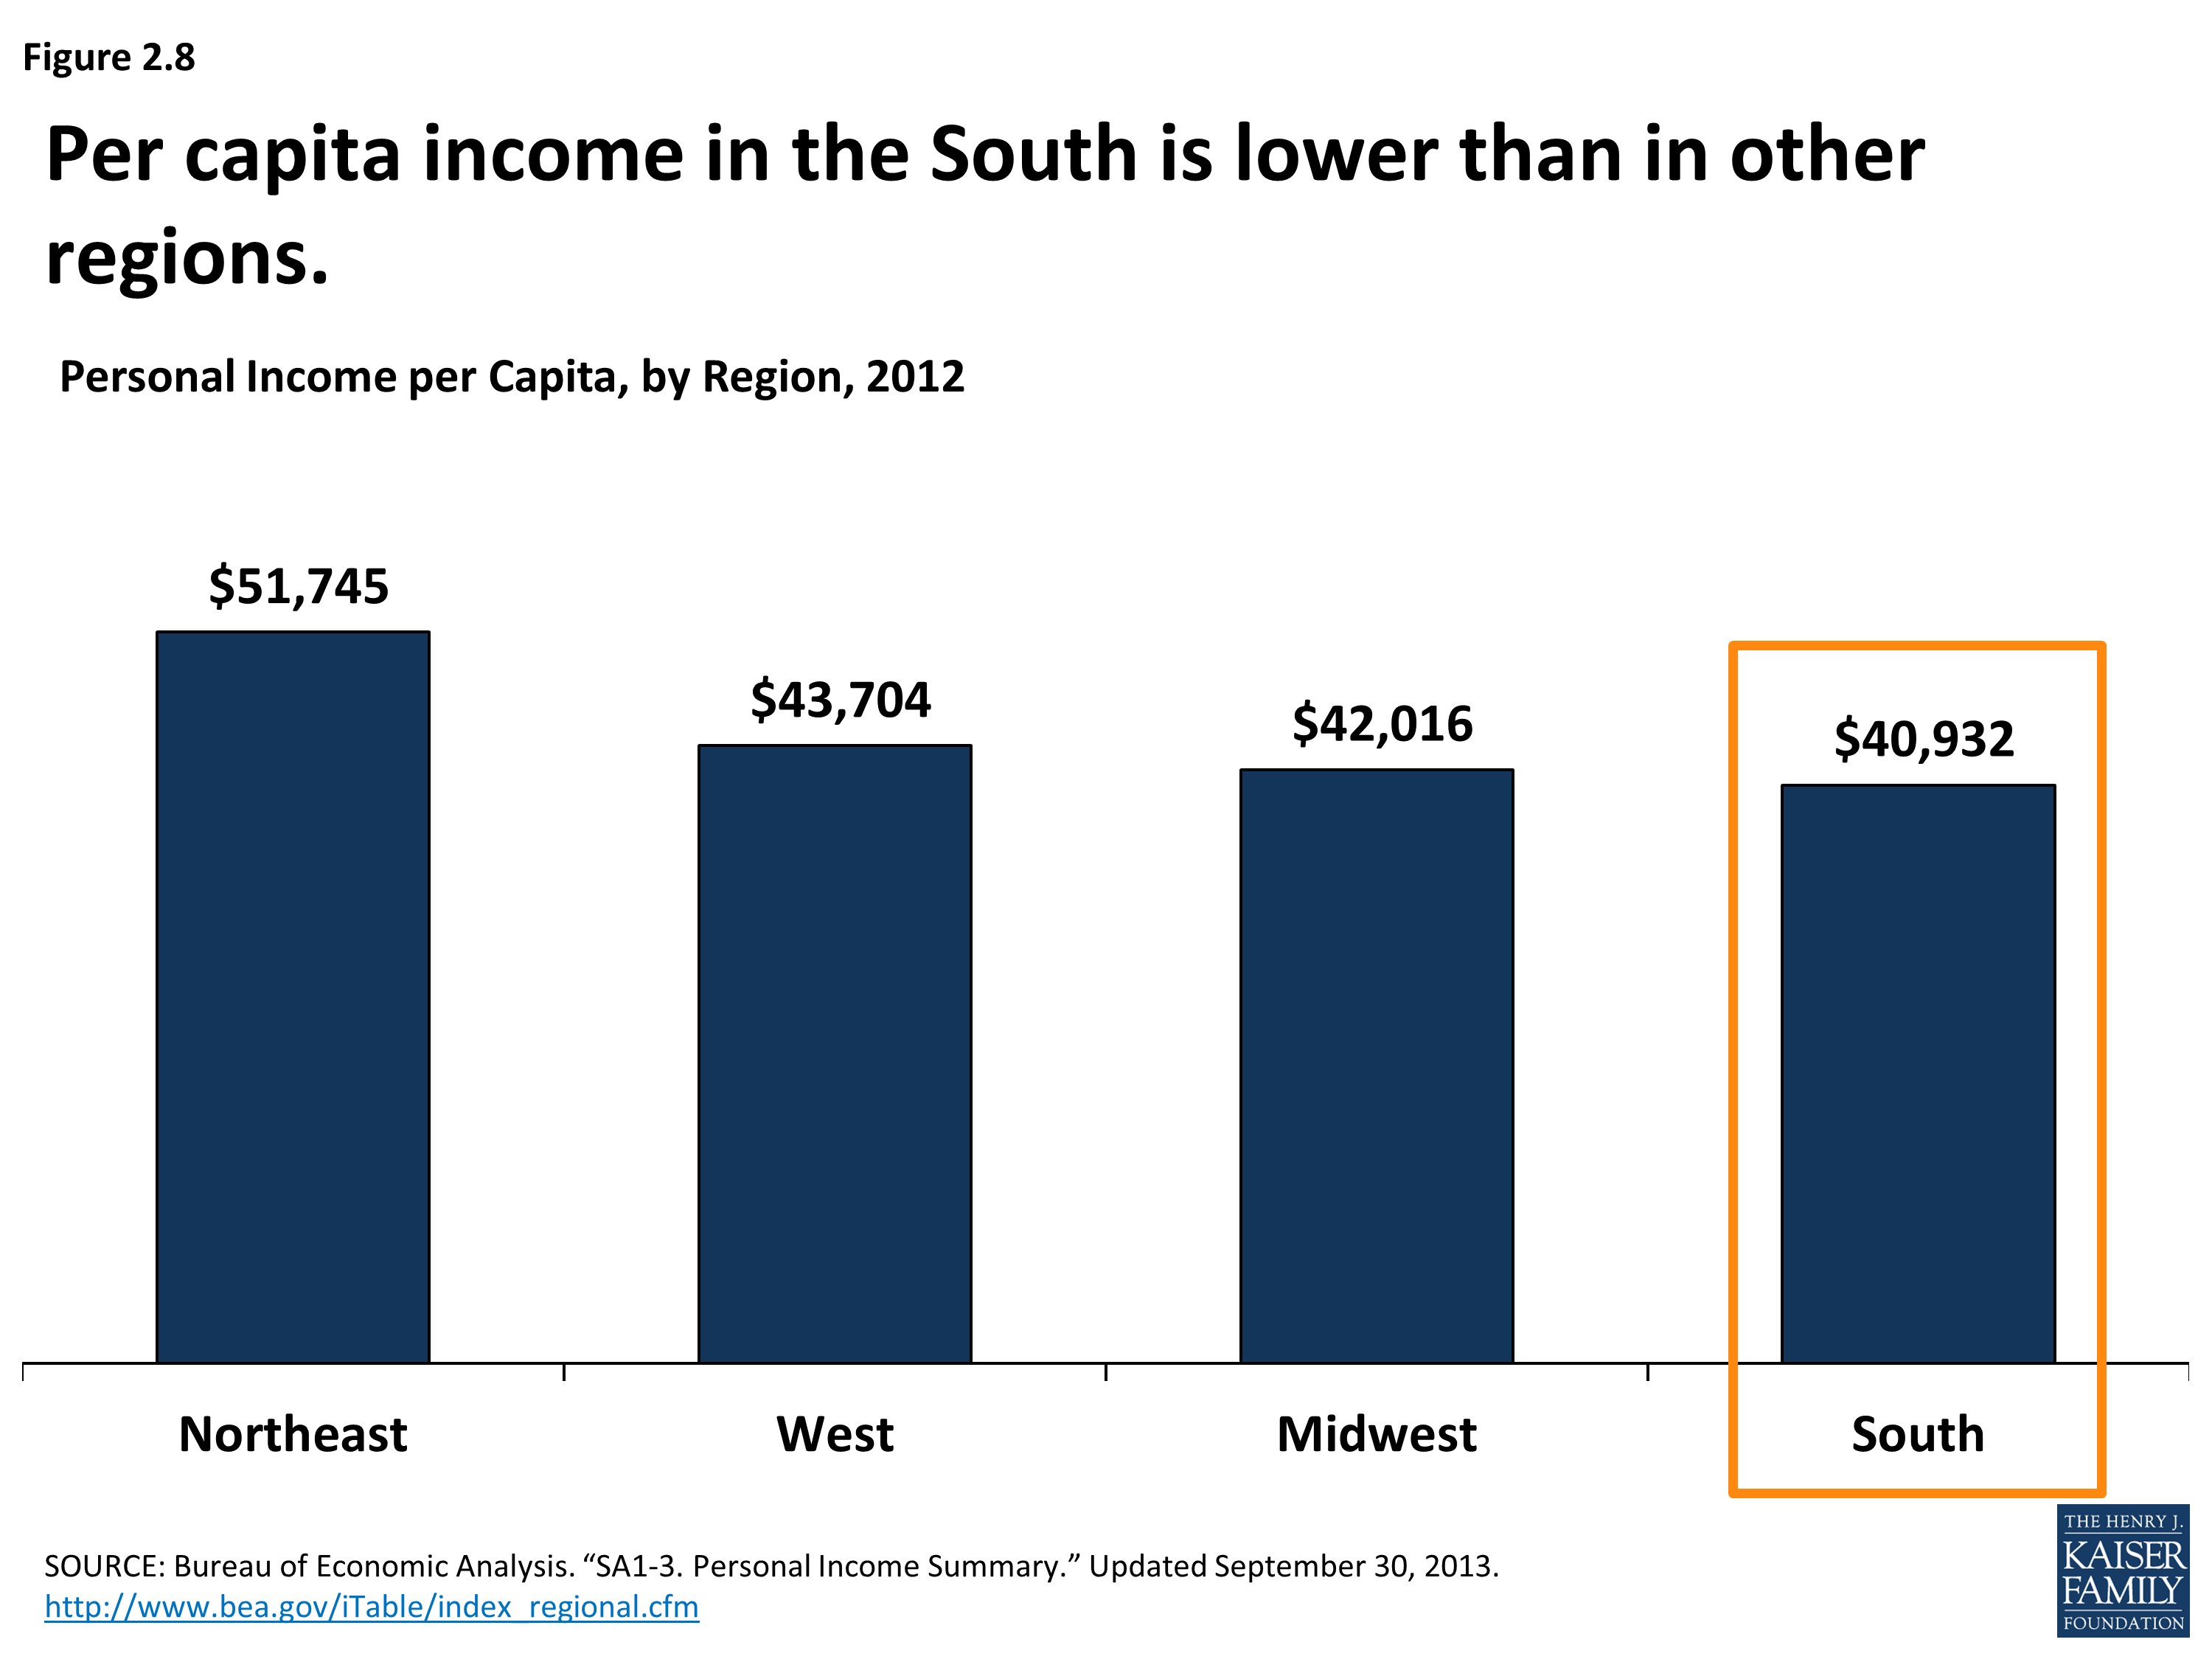
Personal Income Per Capita, by Region, 2012
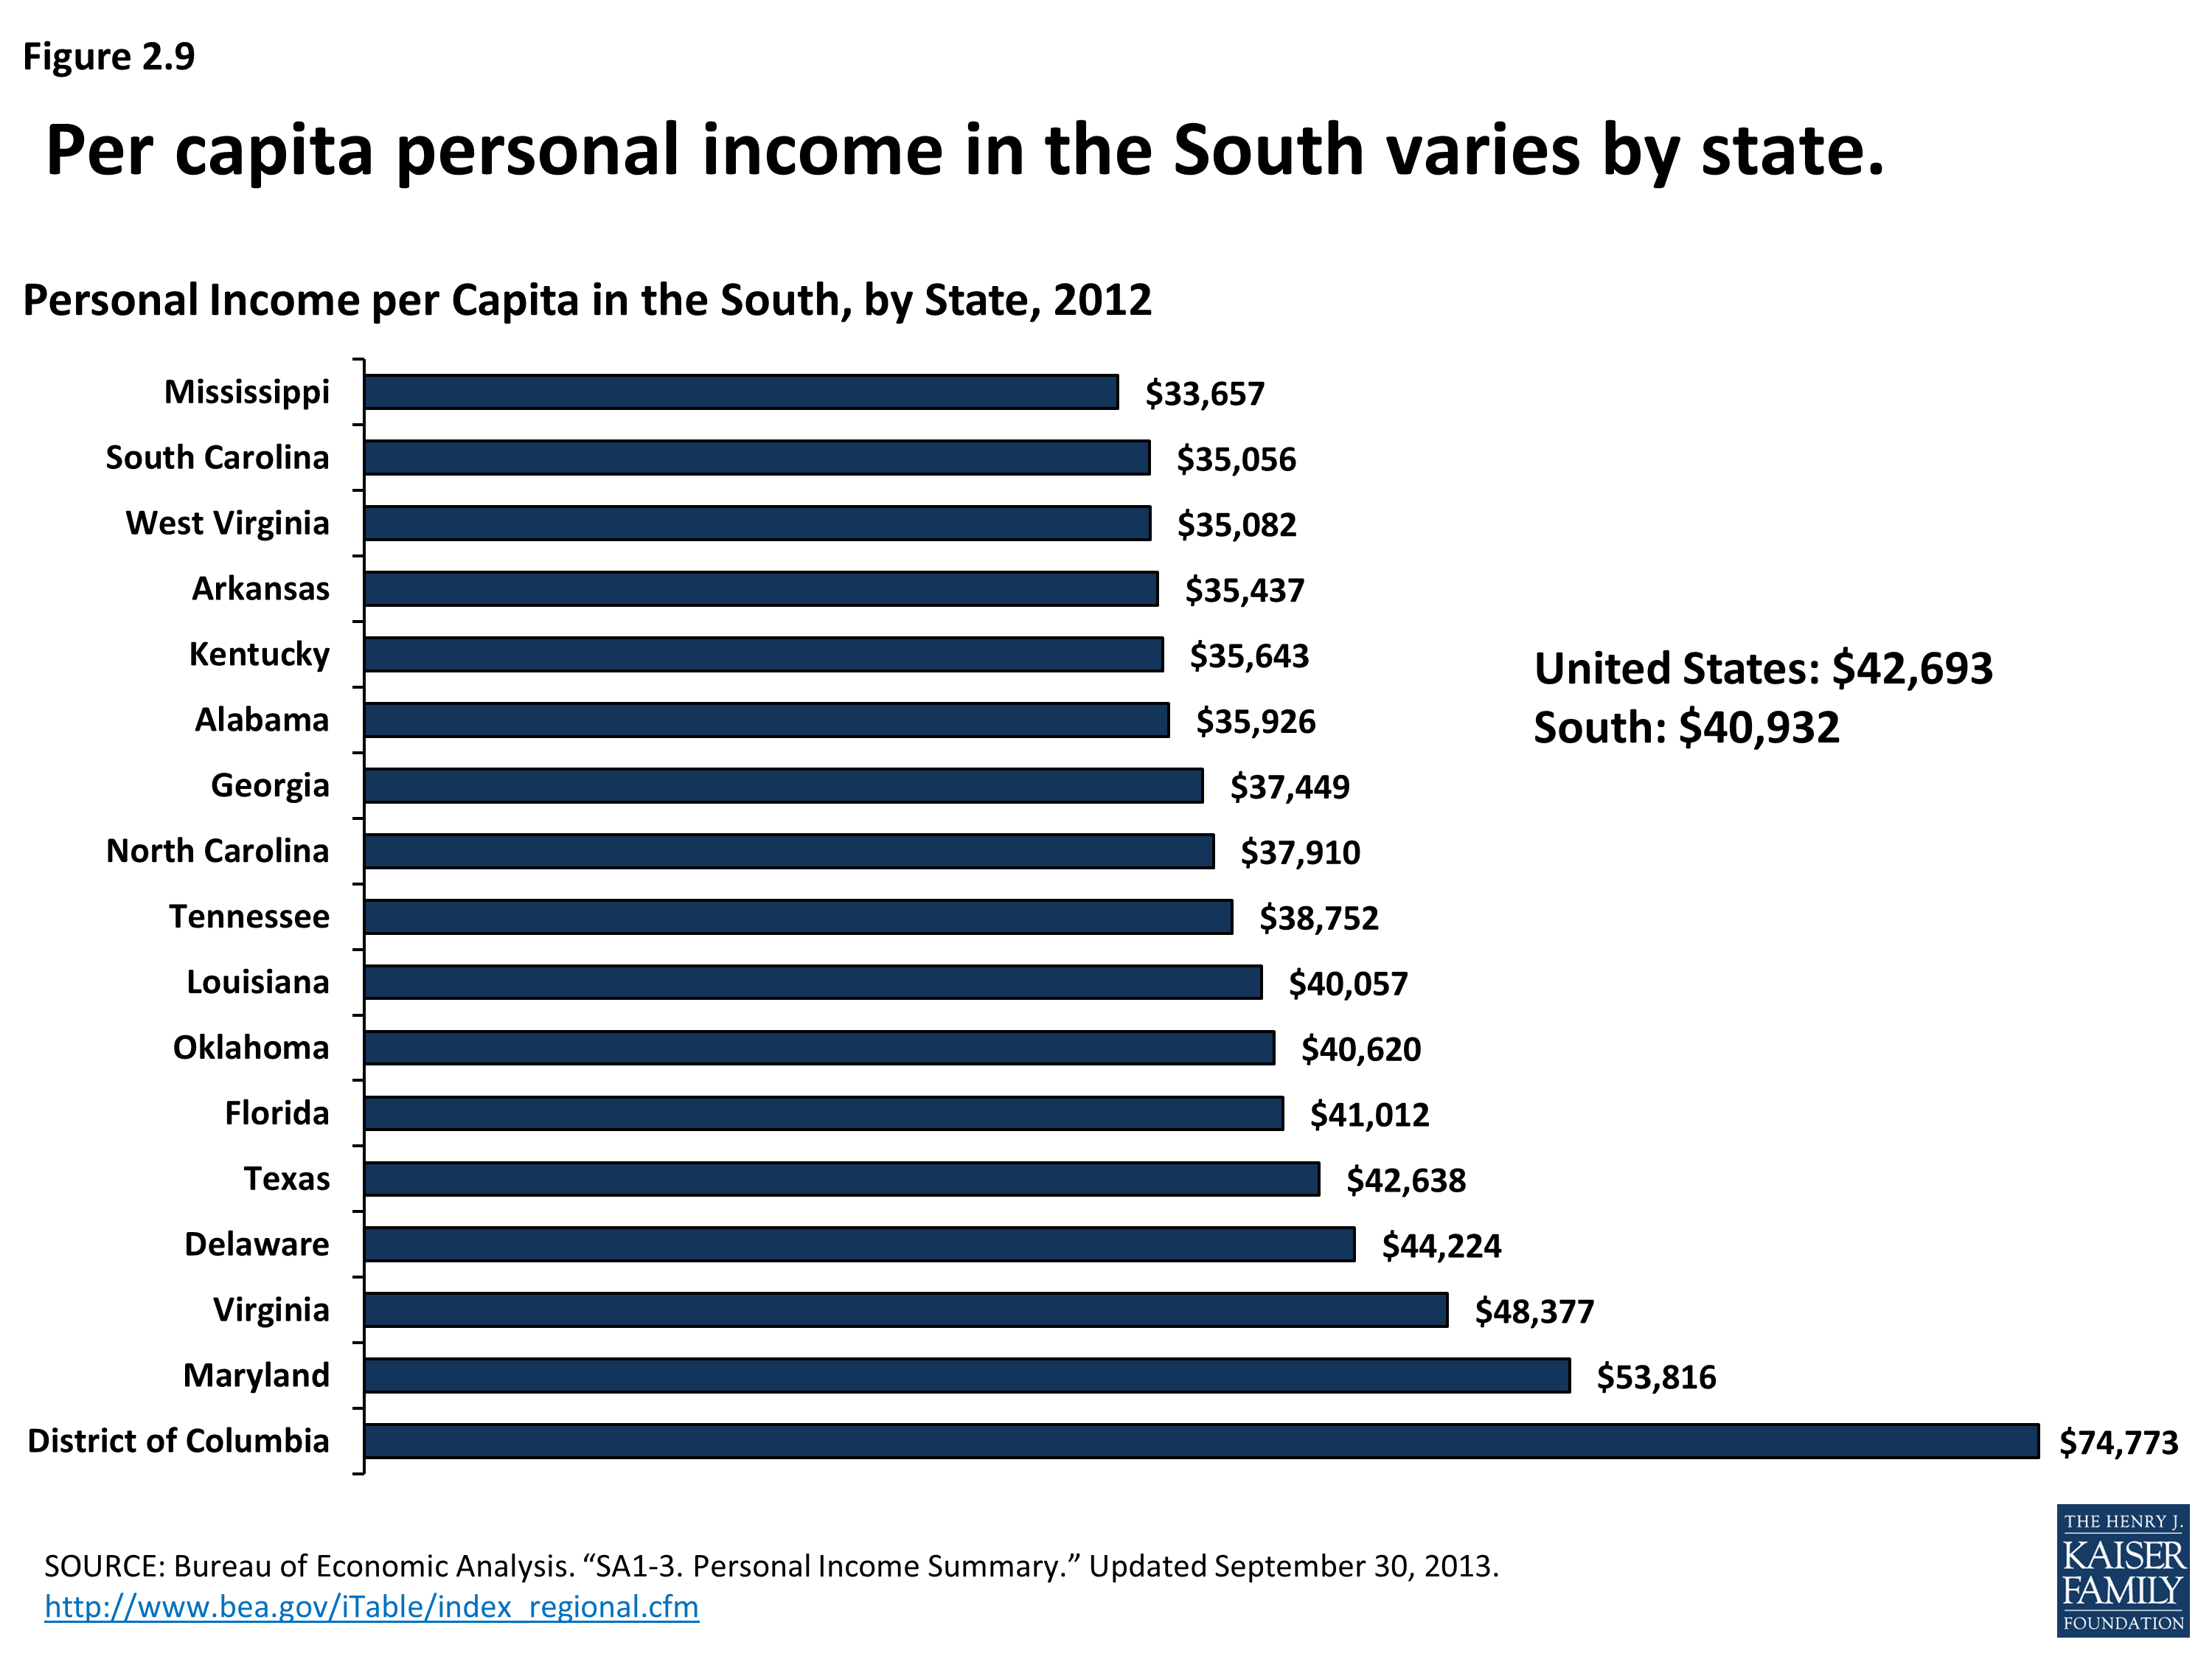
Personal Income Per Capita in the South, by State, 2012
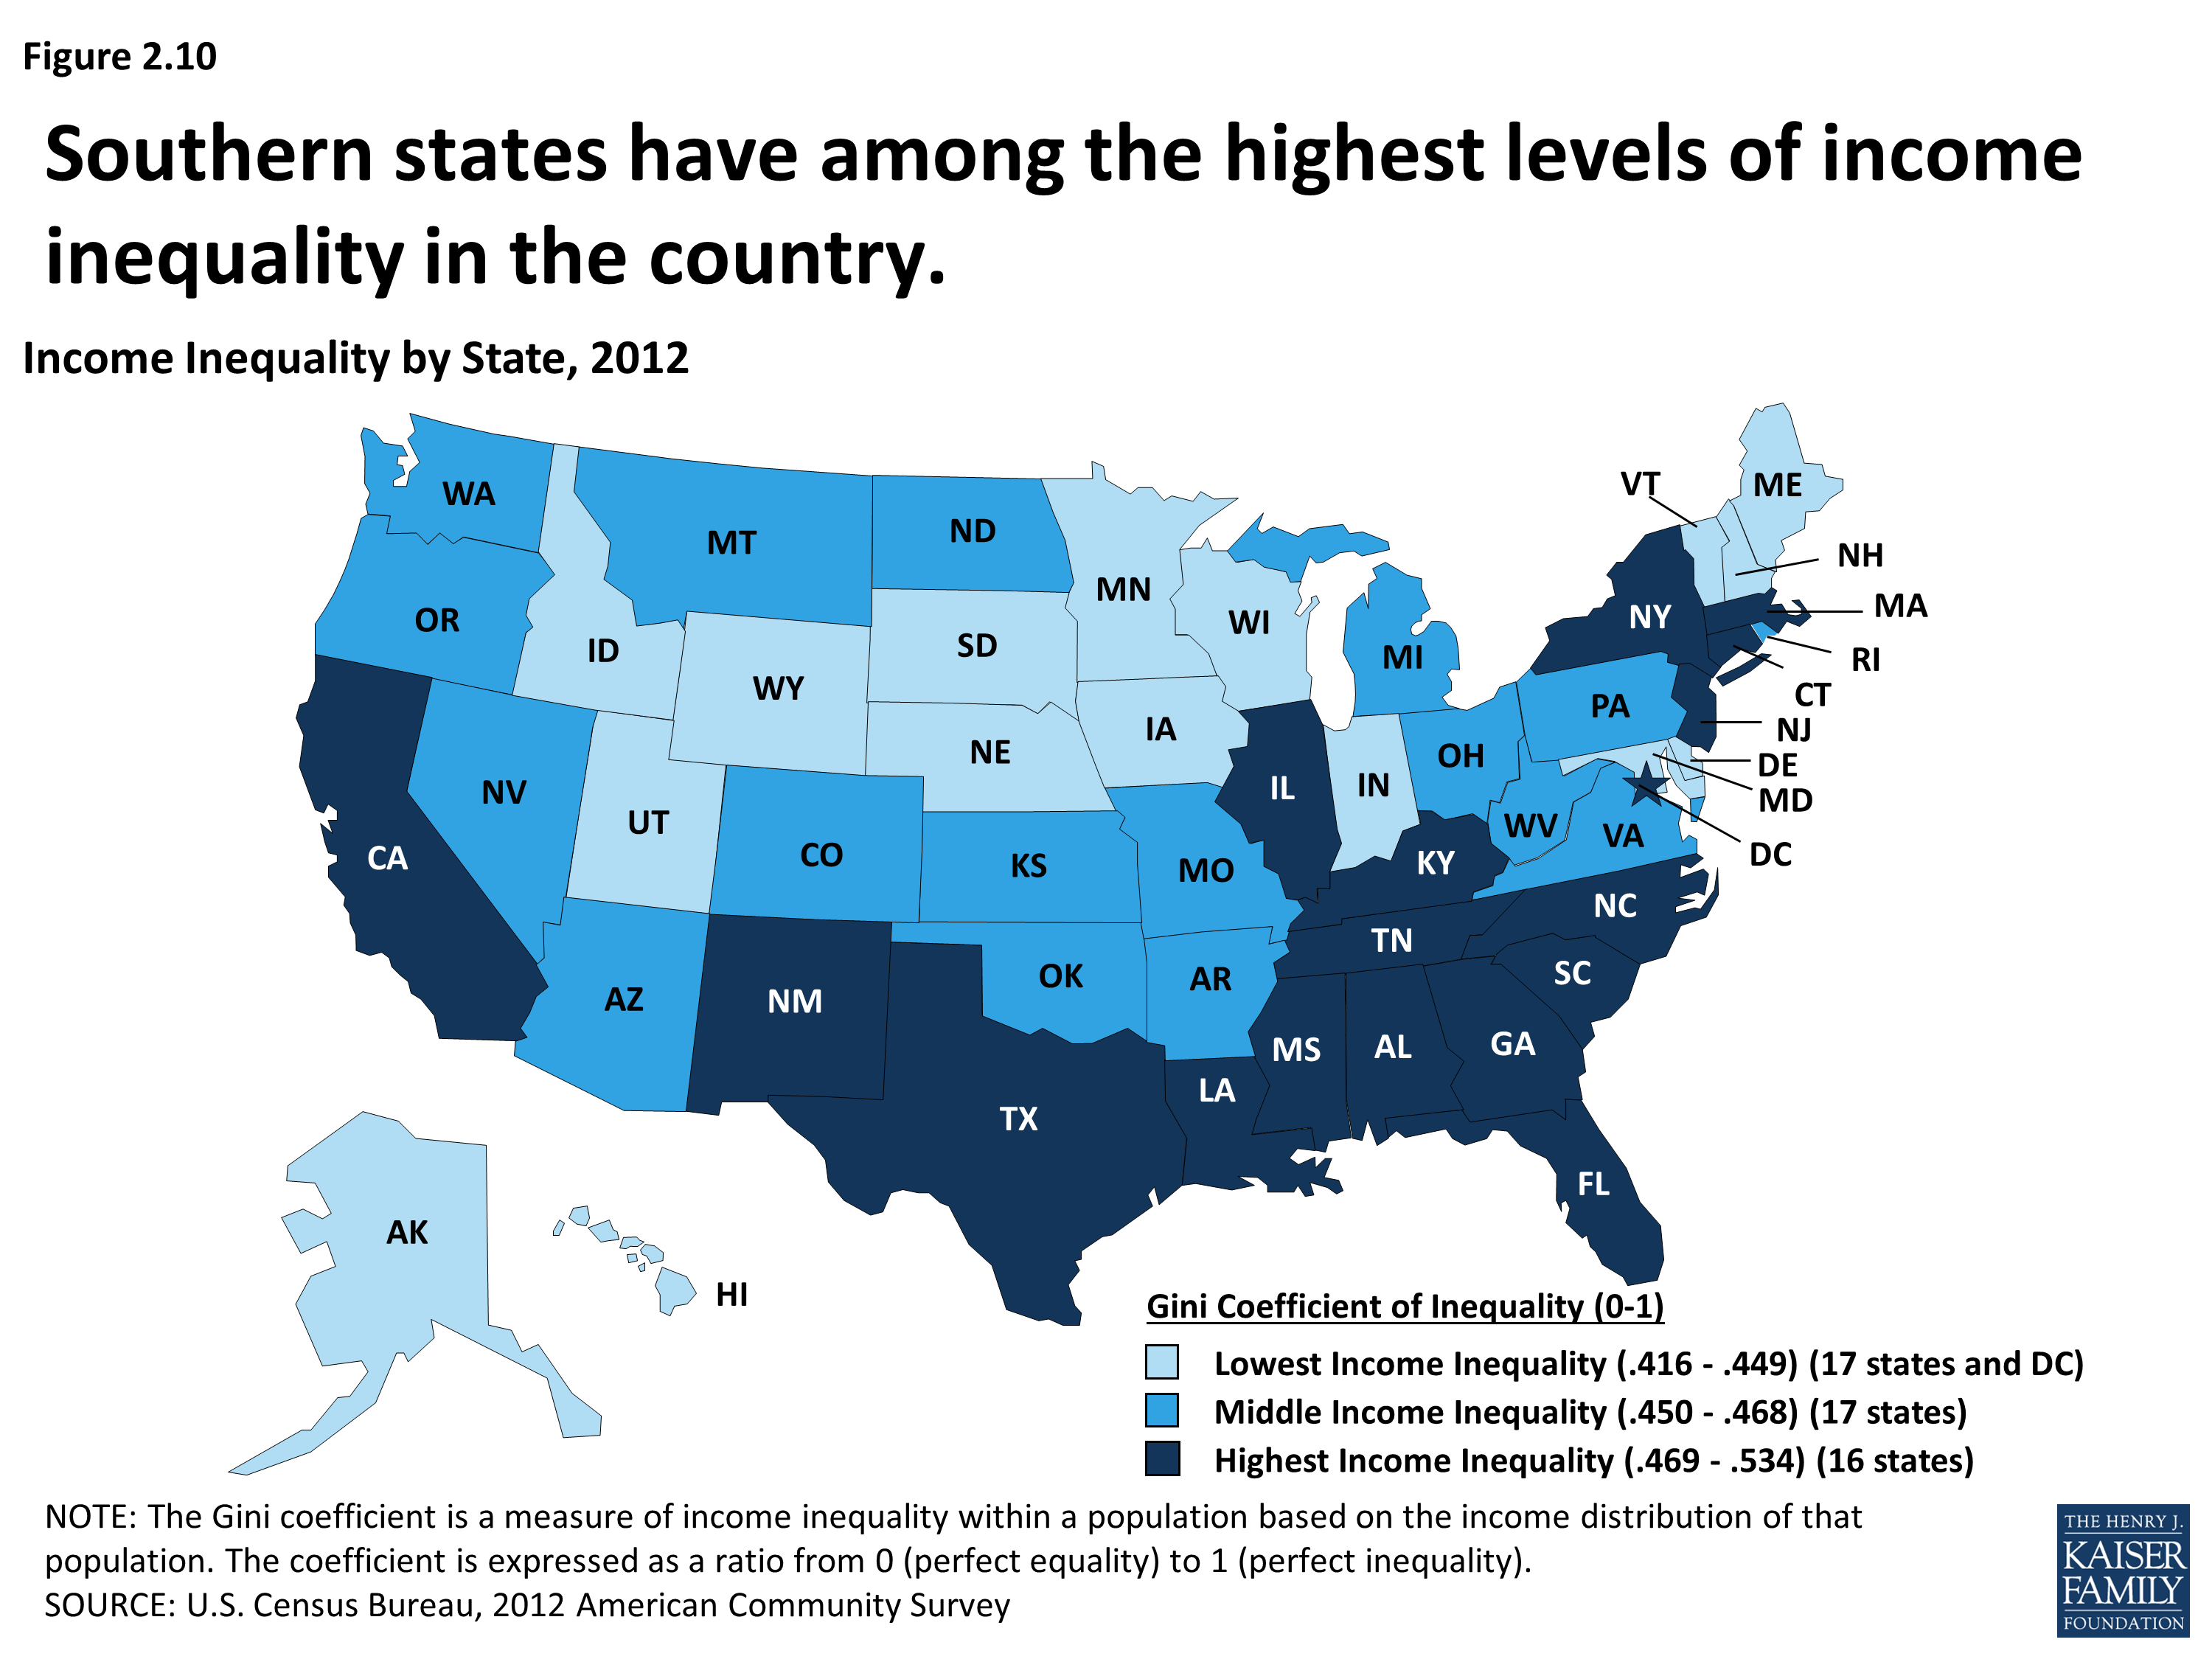
Income Inequality by State, 2012
Section 3: Health Status
While measures of health status vary by state, Southerners as a group are generally more likely than those in other regions to have a number of chronic illnesses and experience worse health outcomes. For example, most of the states with the highest rates of obesity and diabetes are in the South, and many southern states are among those with the highest infant mortality rates and cancer death rates in the country. As in other regions, health status within the South also varies by race and ethnicity, and Blacks in particular, are more likely than Whites to report having fair or poor health.
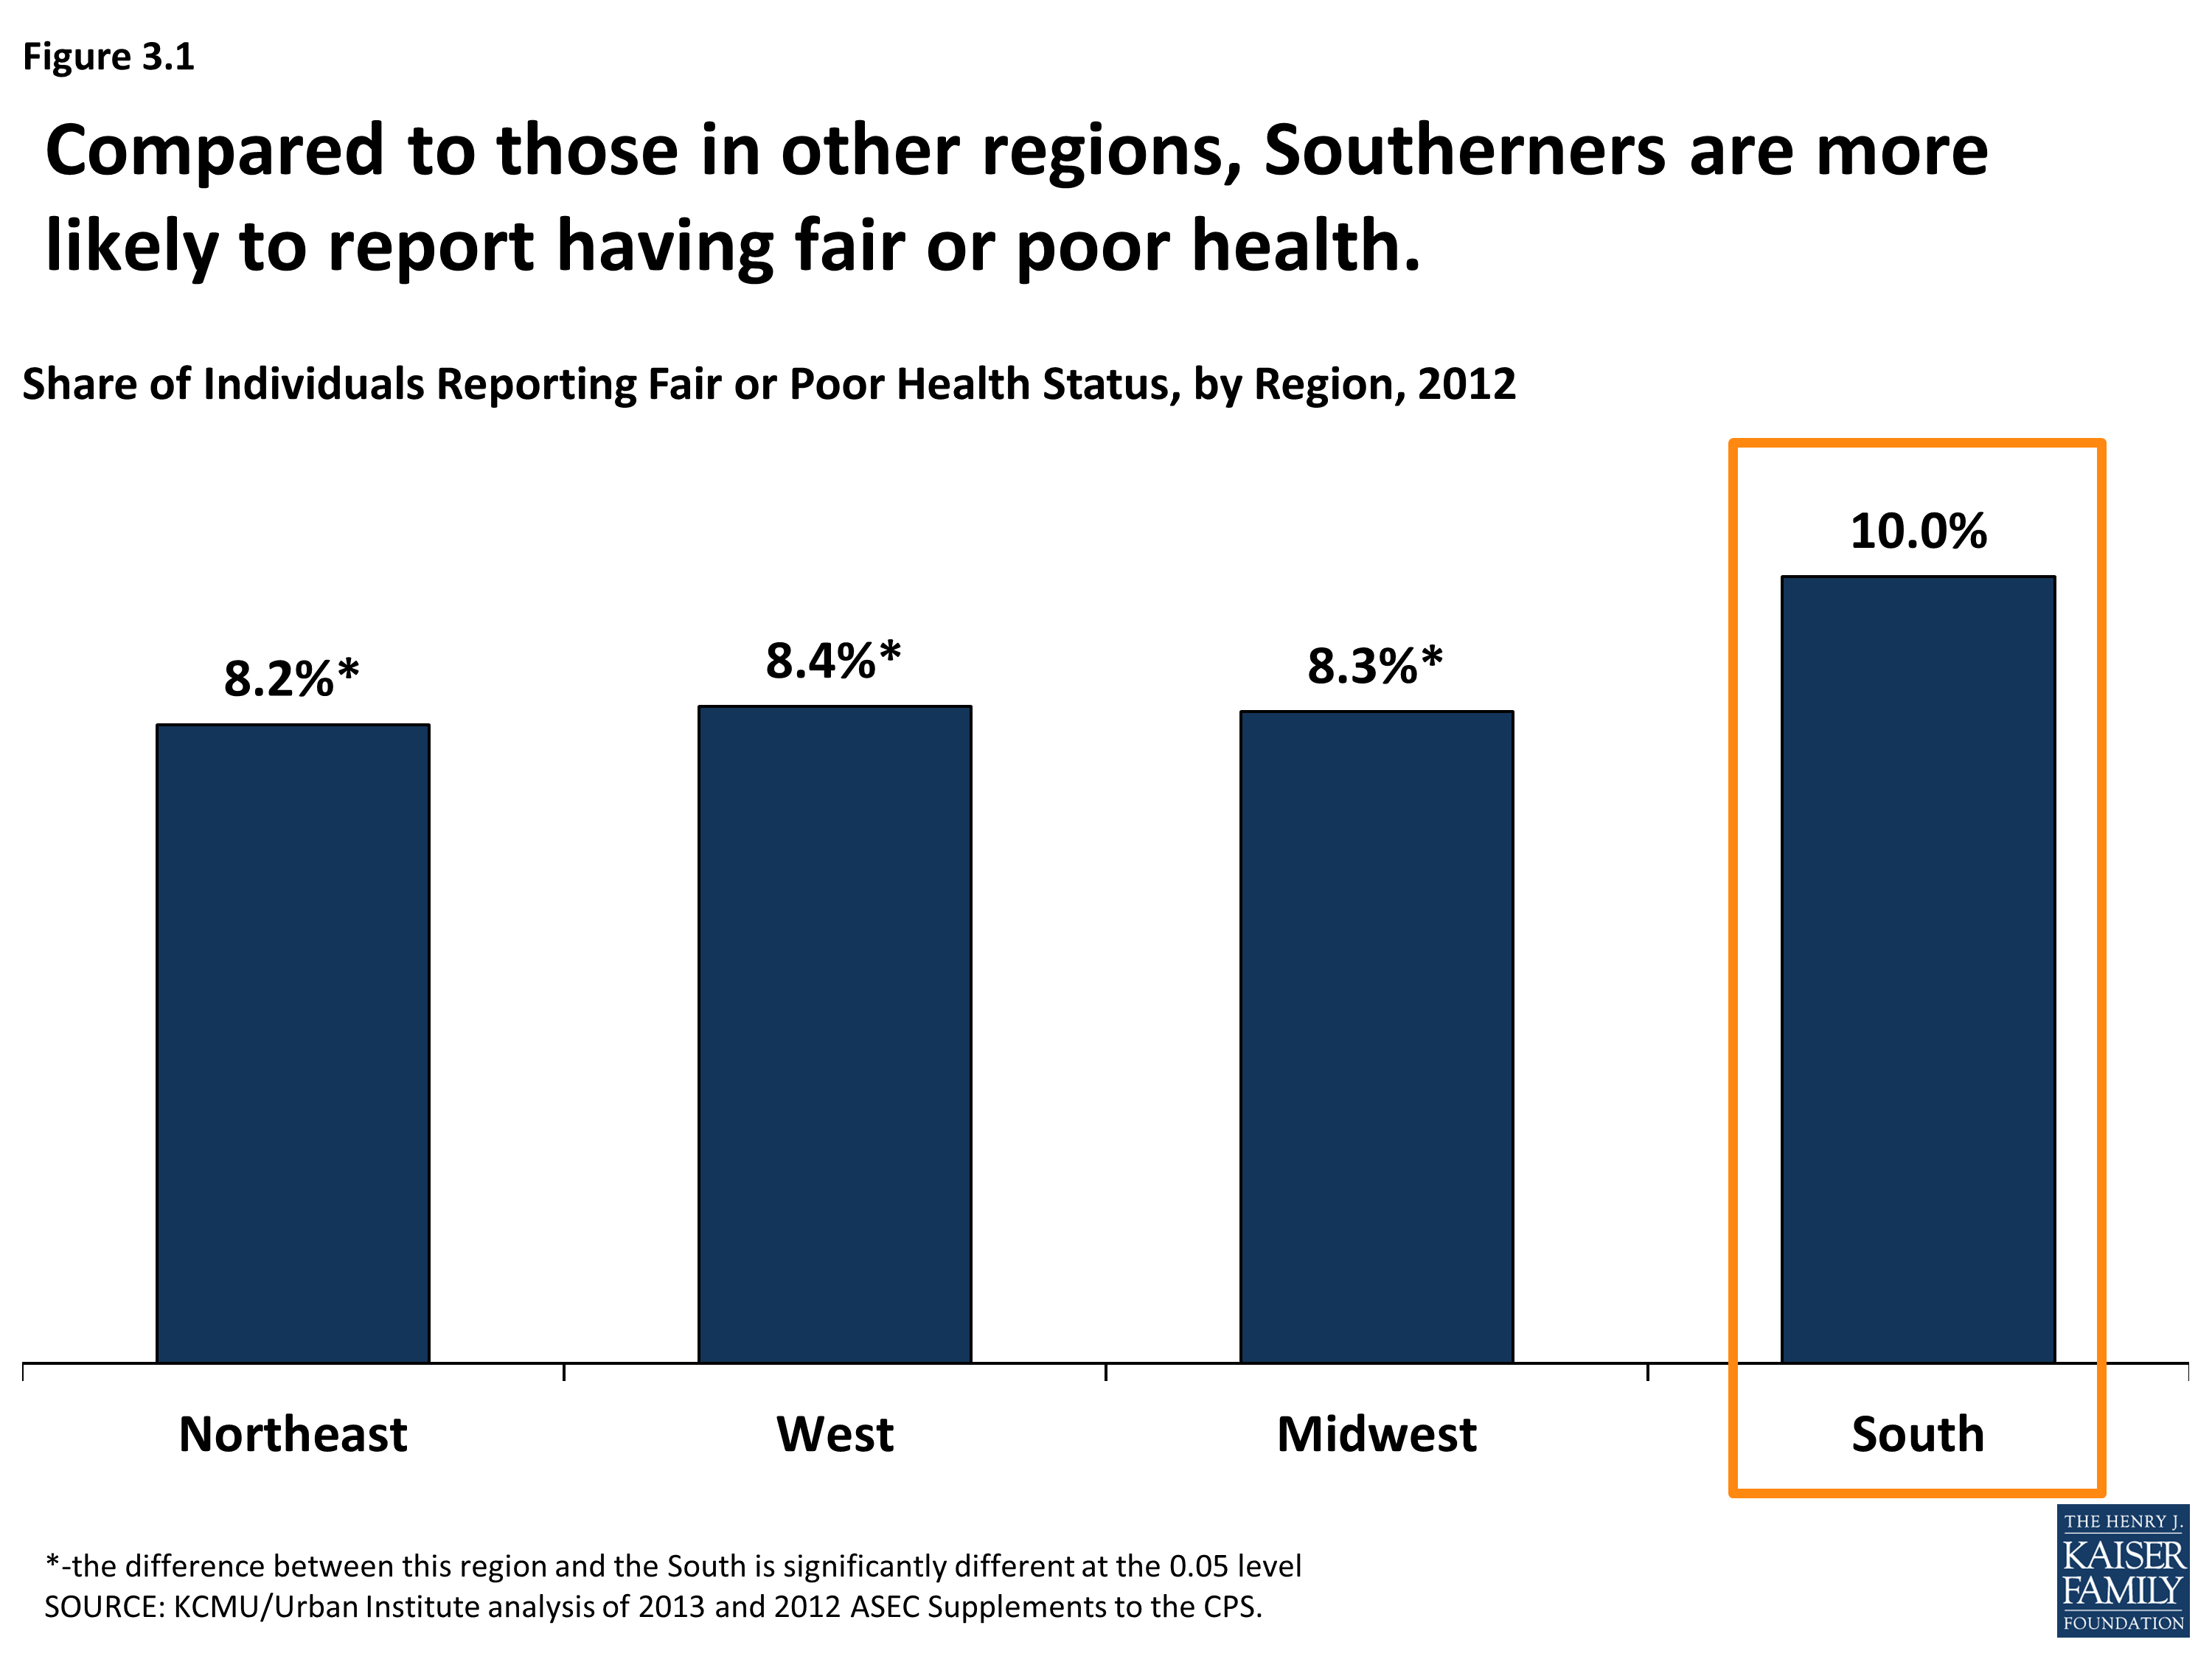
Share of individuals Reporting Fair or Poor Health Status, by Region, 2012
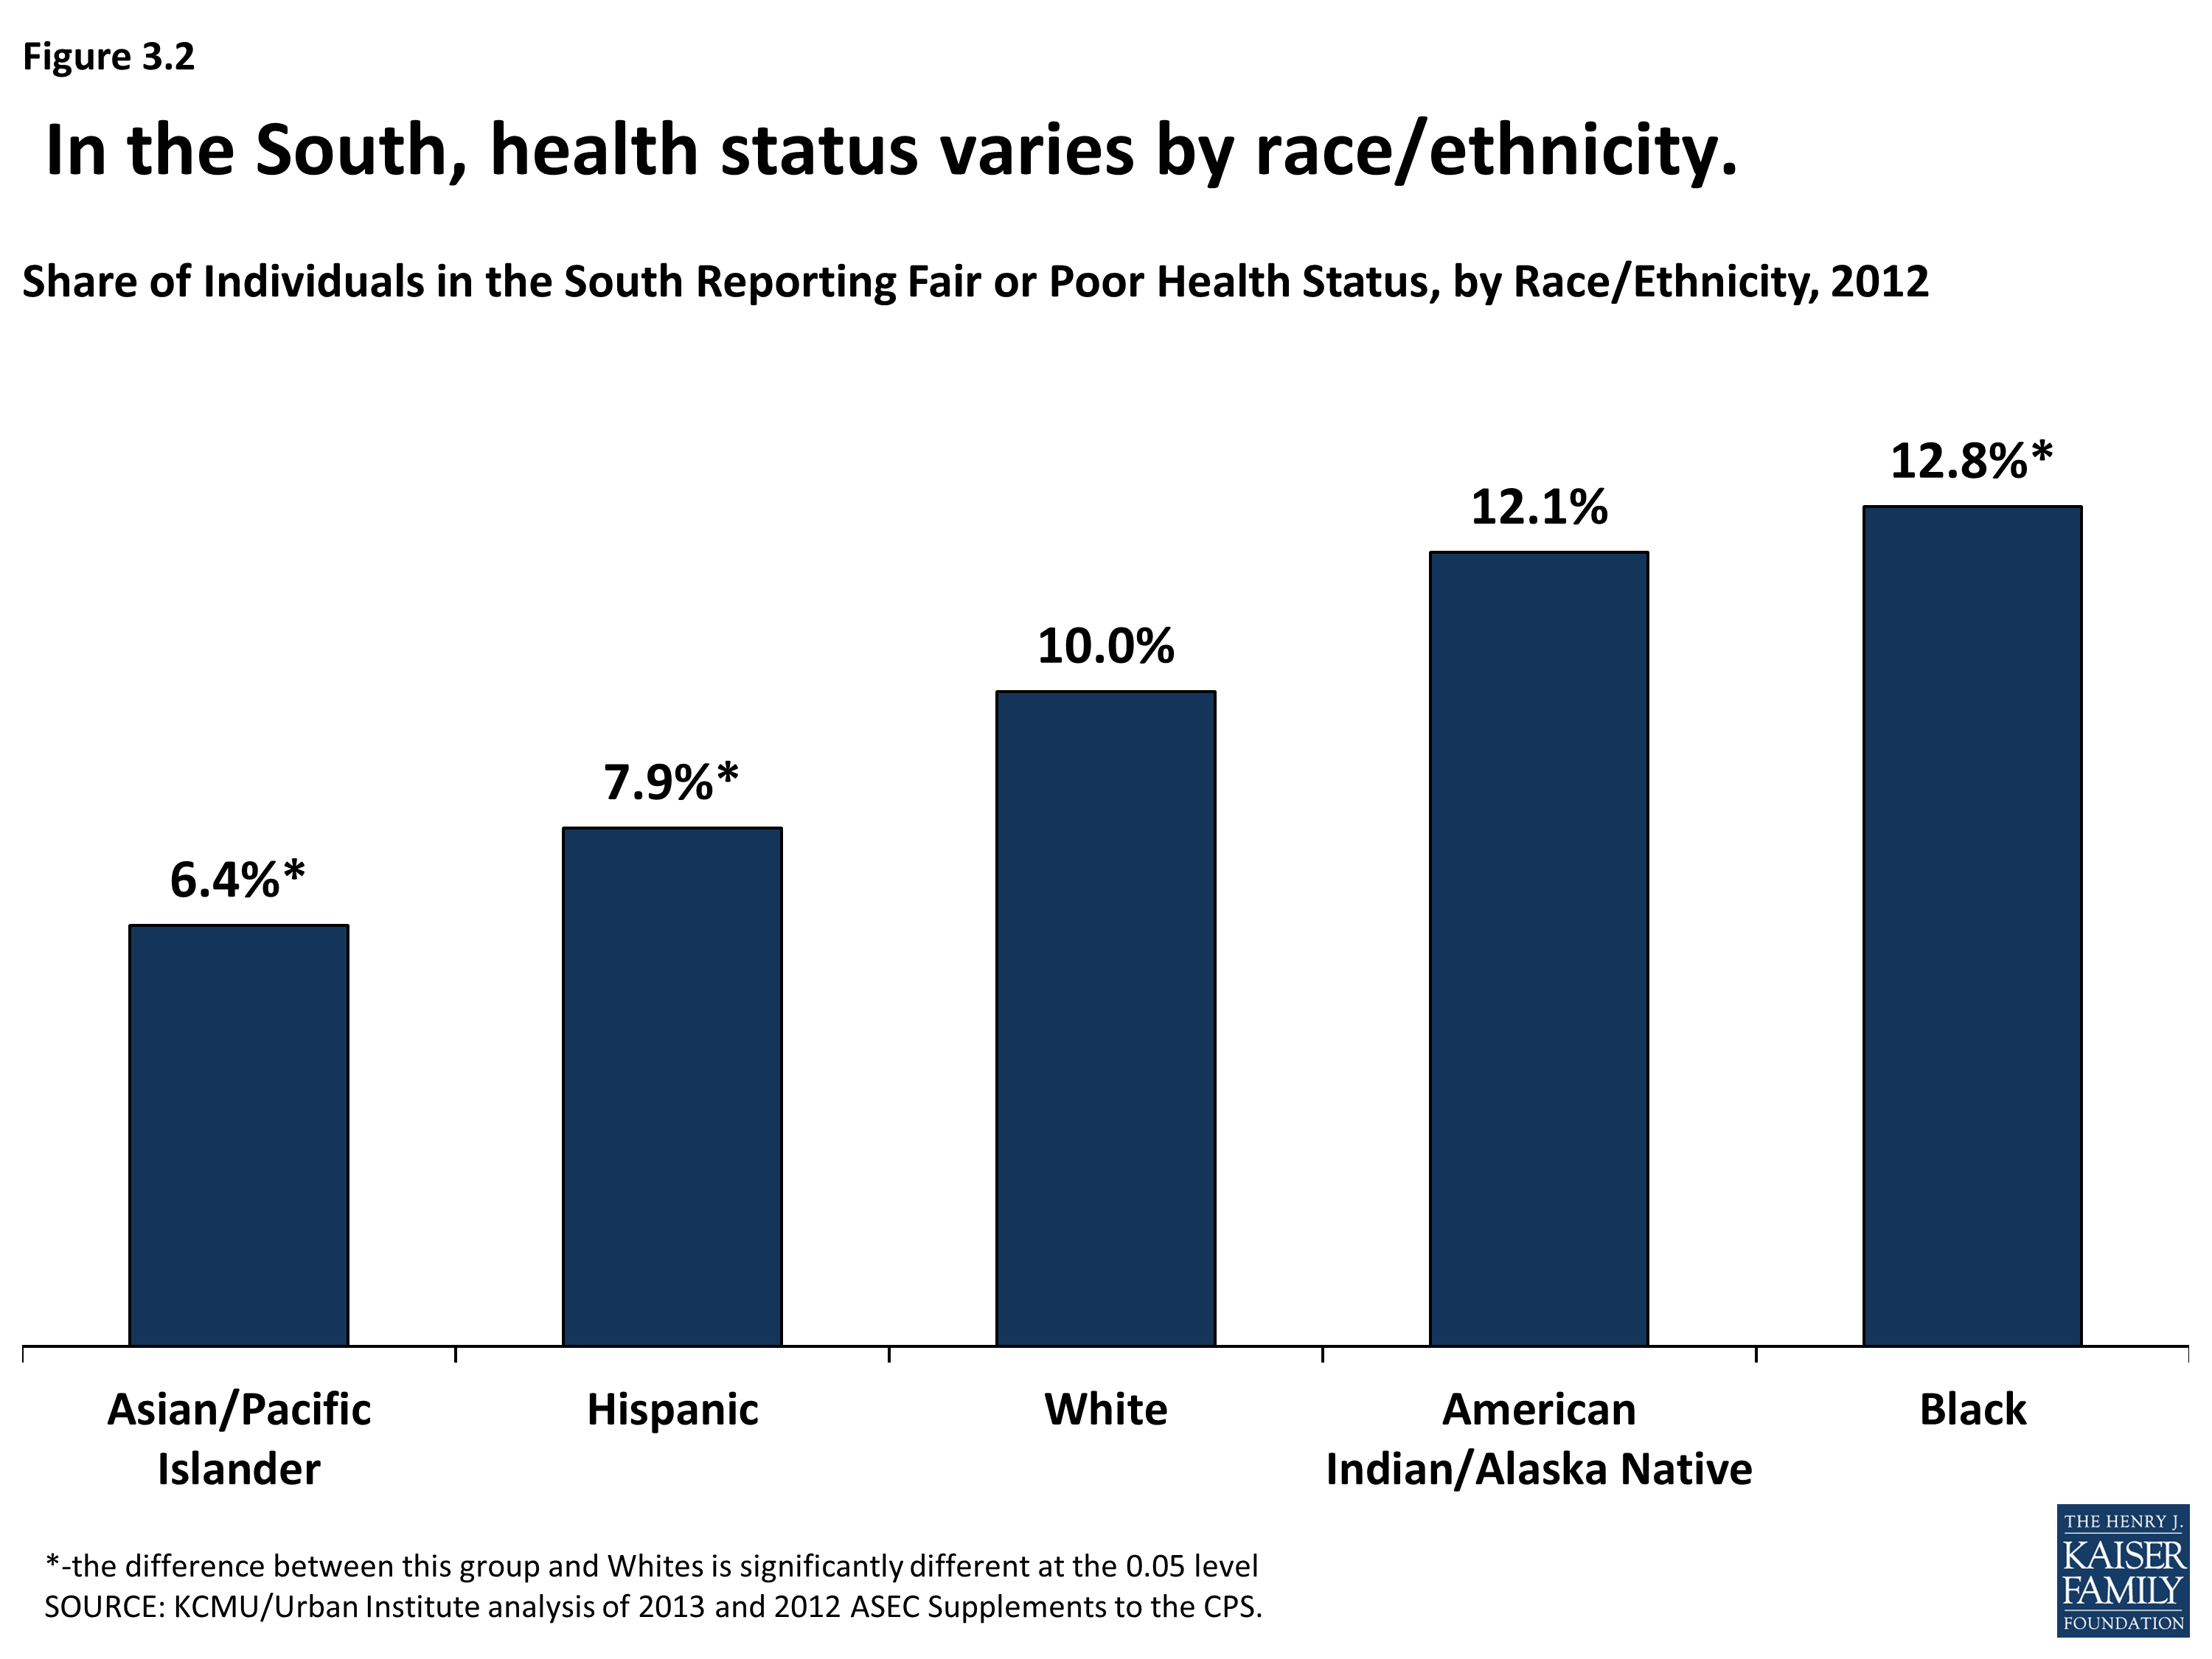
Share of Individuals in the South Reporting Fair or Poor Health Status, by Race/Ethnicity, 2012
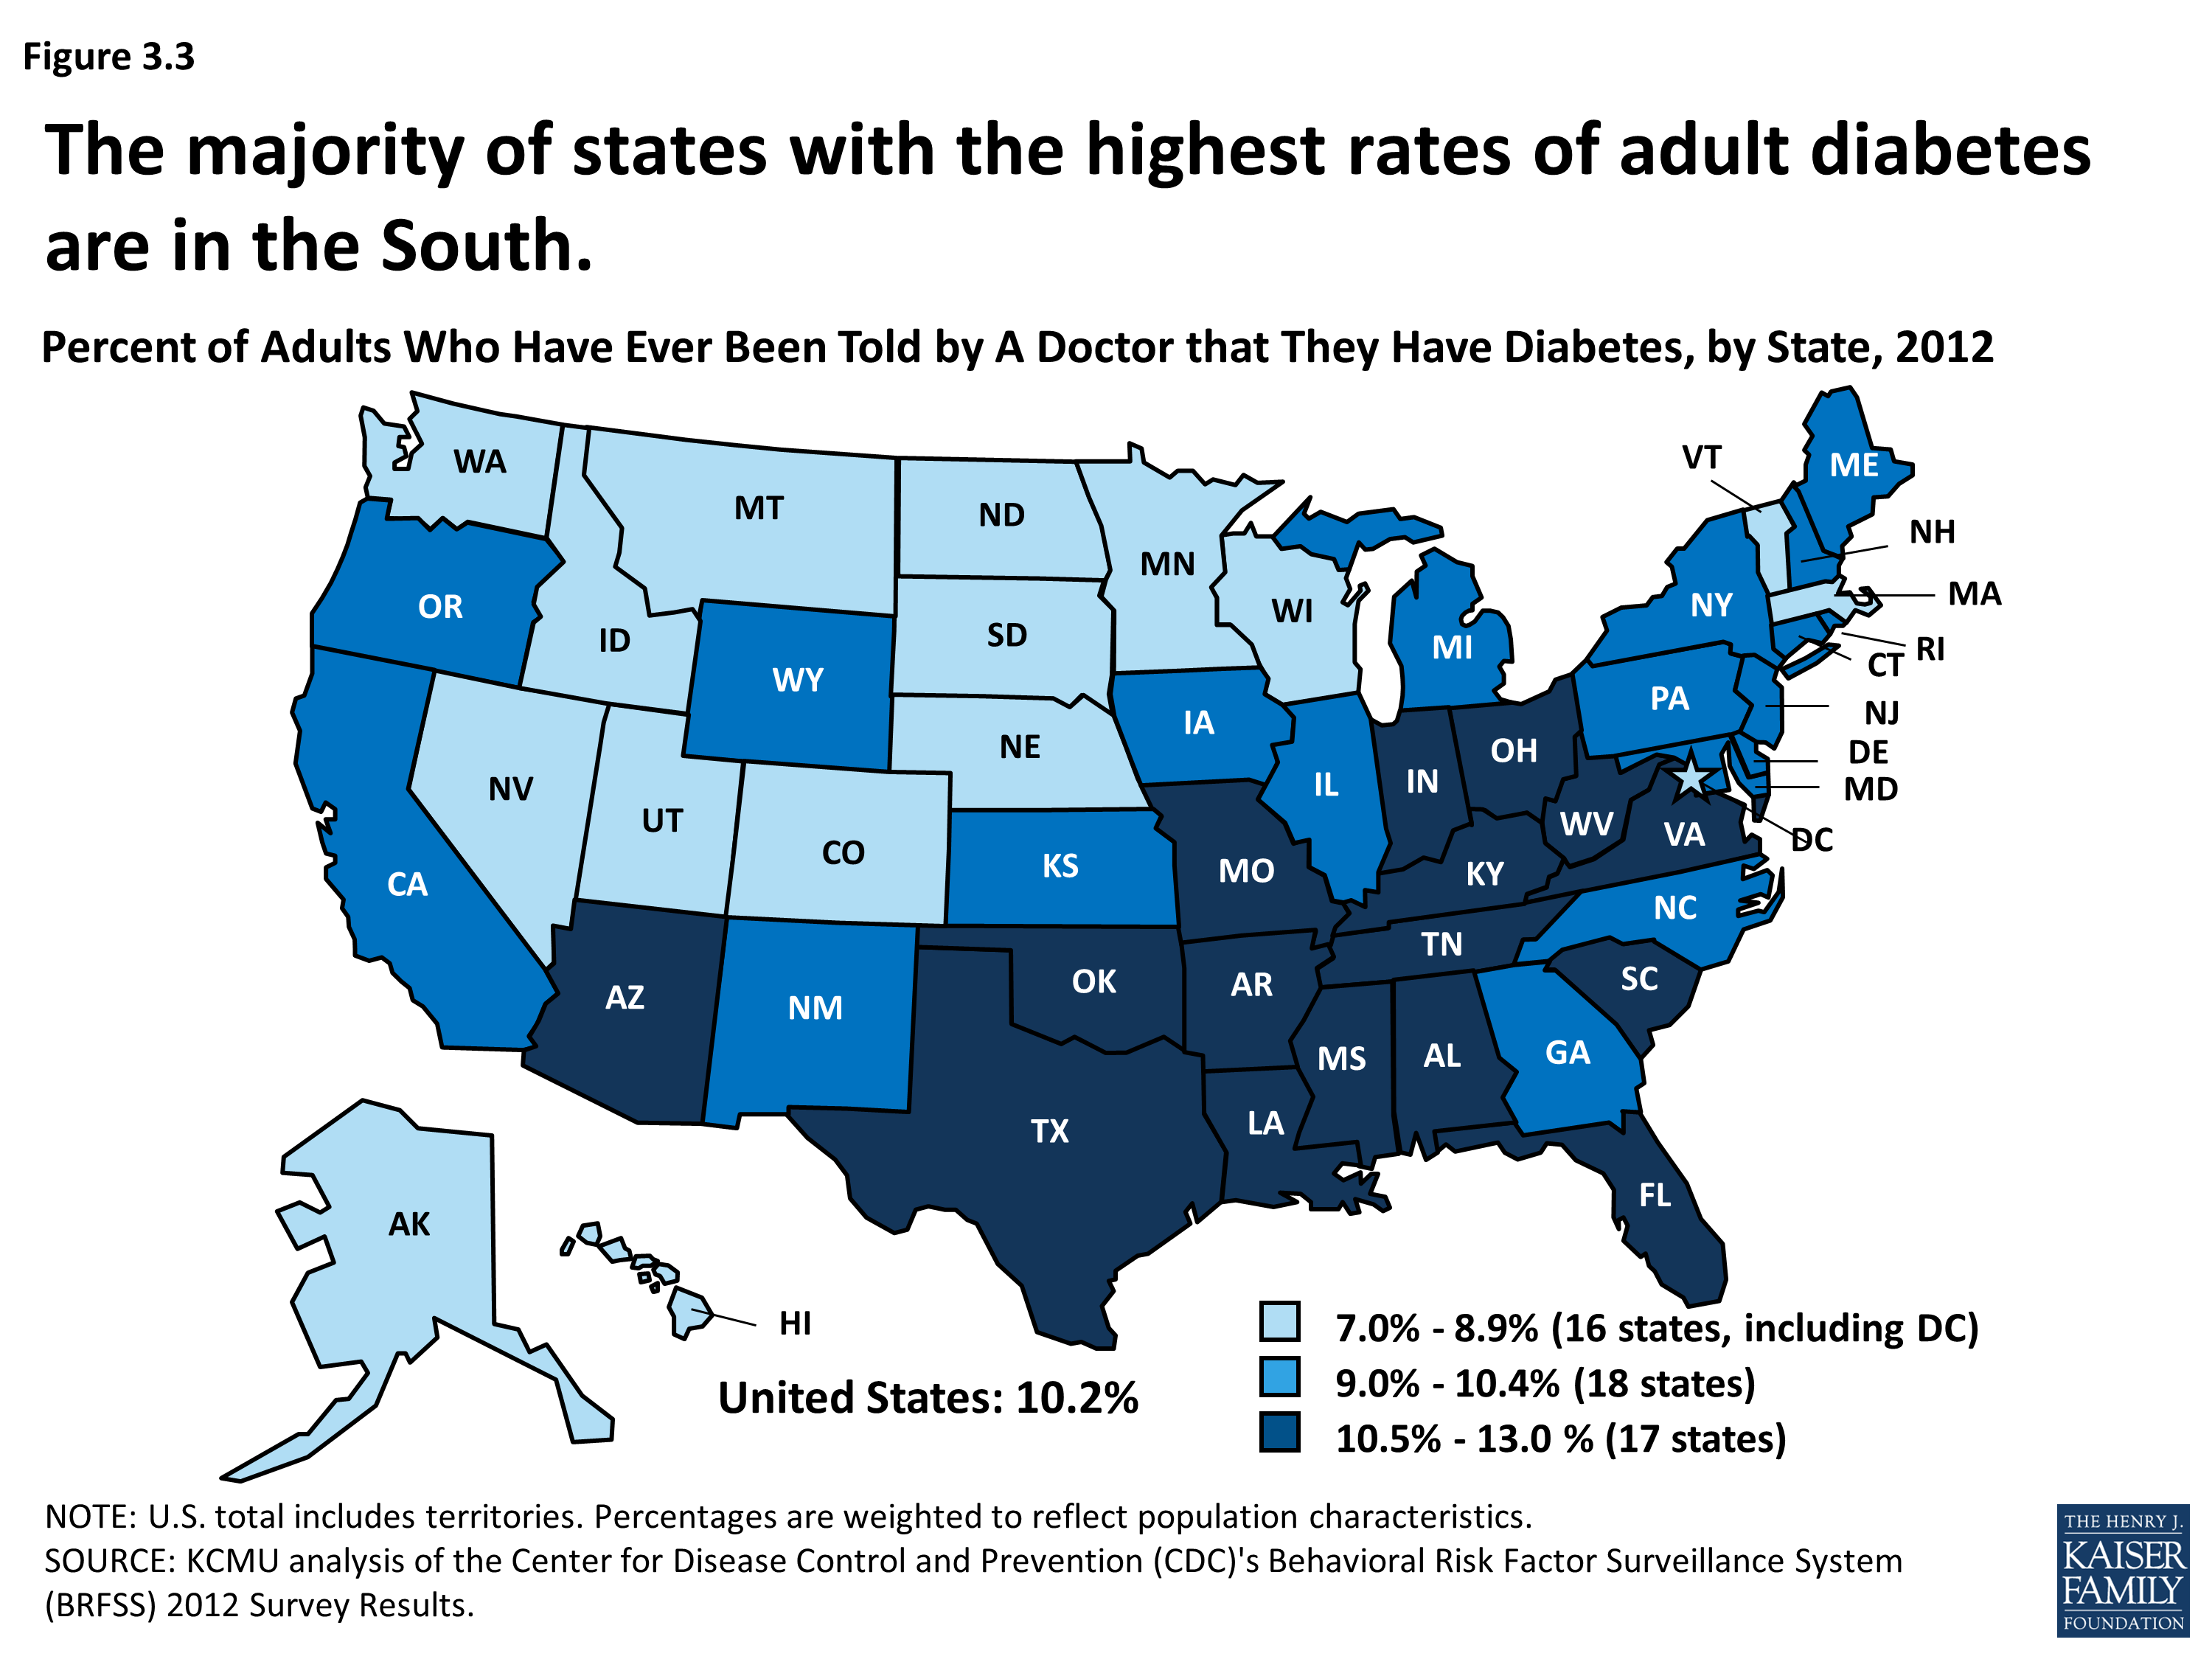
Percent of Adults Who Have Ever Been Told by a Doctor that they Have Diabetes, by State, 2012
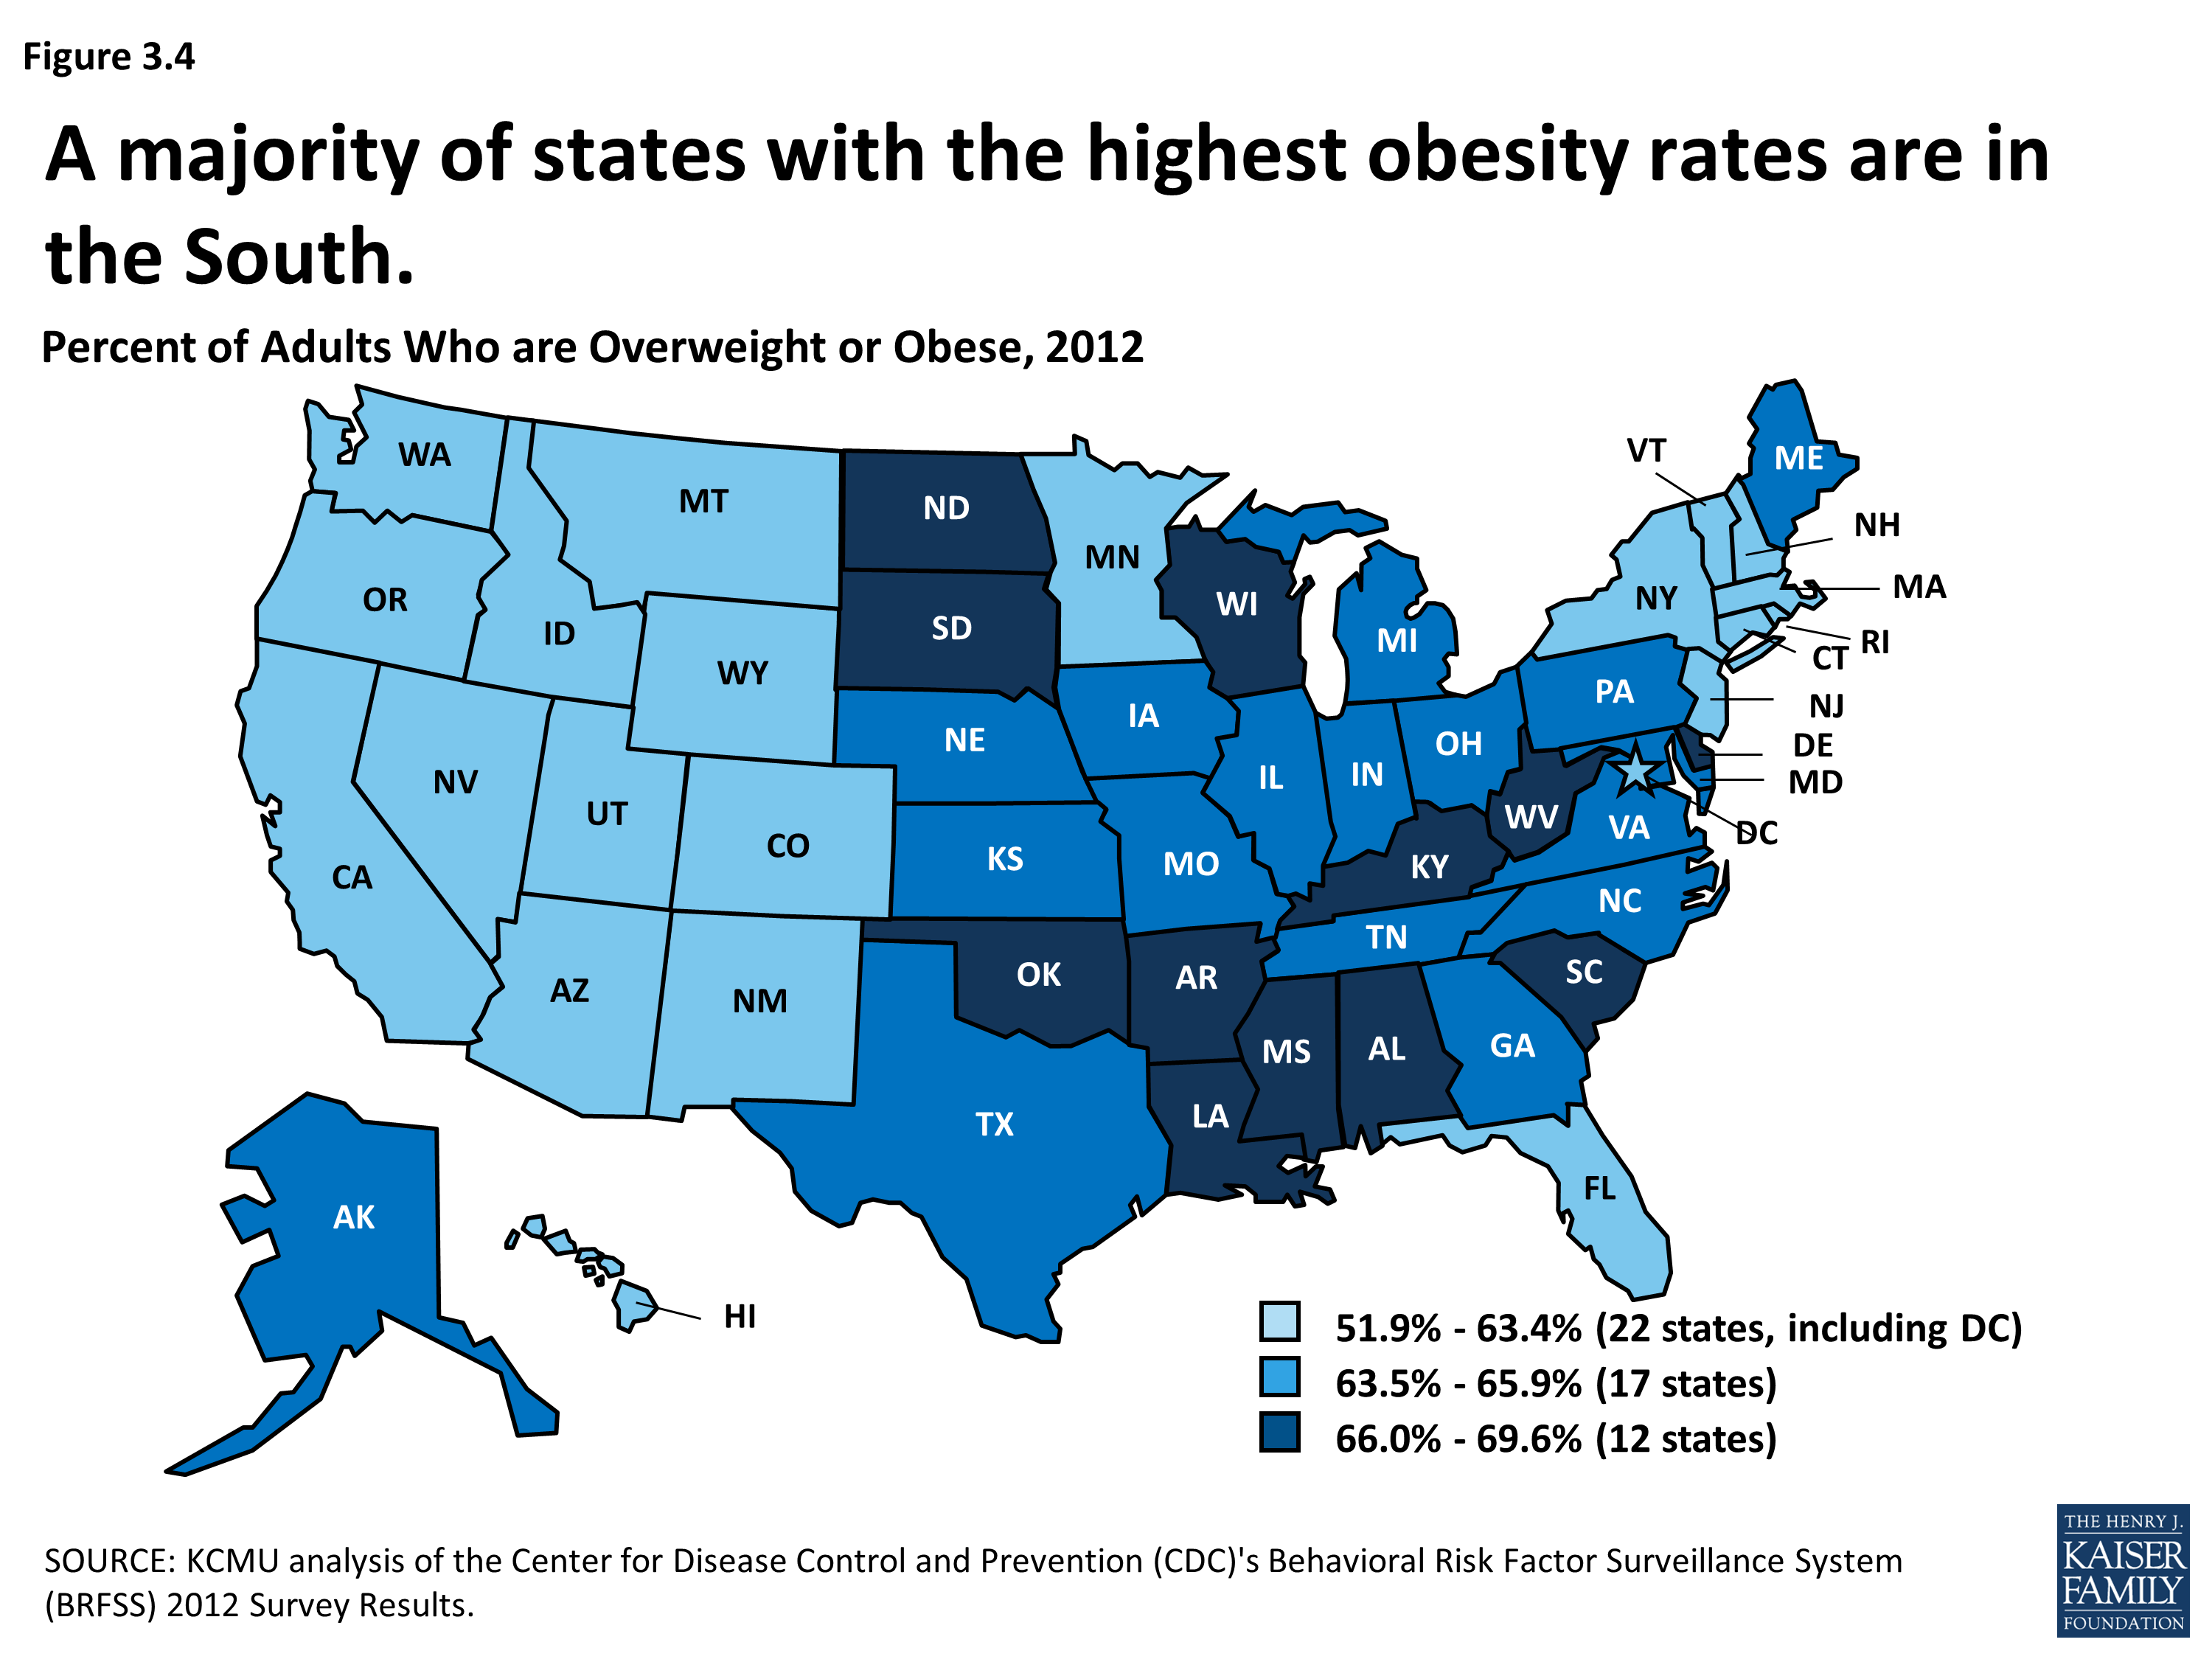
Percent of Adults Who are Overweight or Obese, 2012
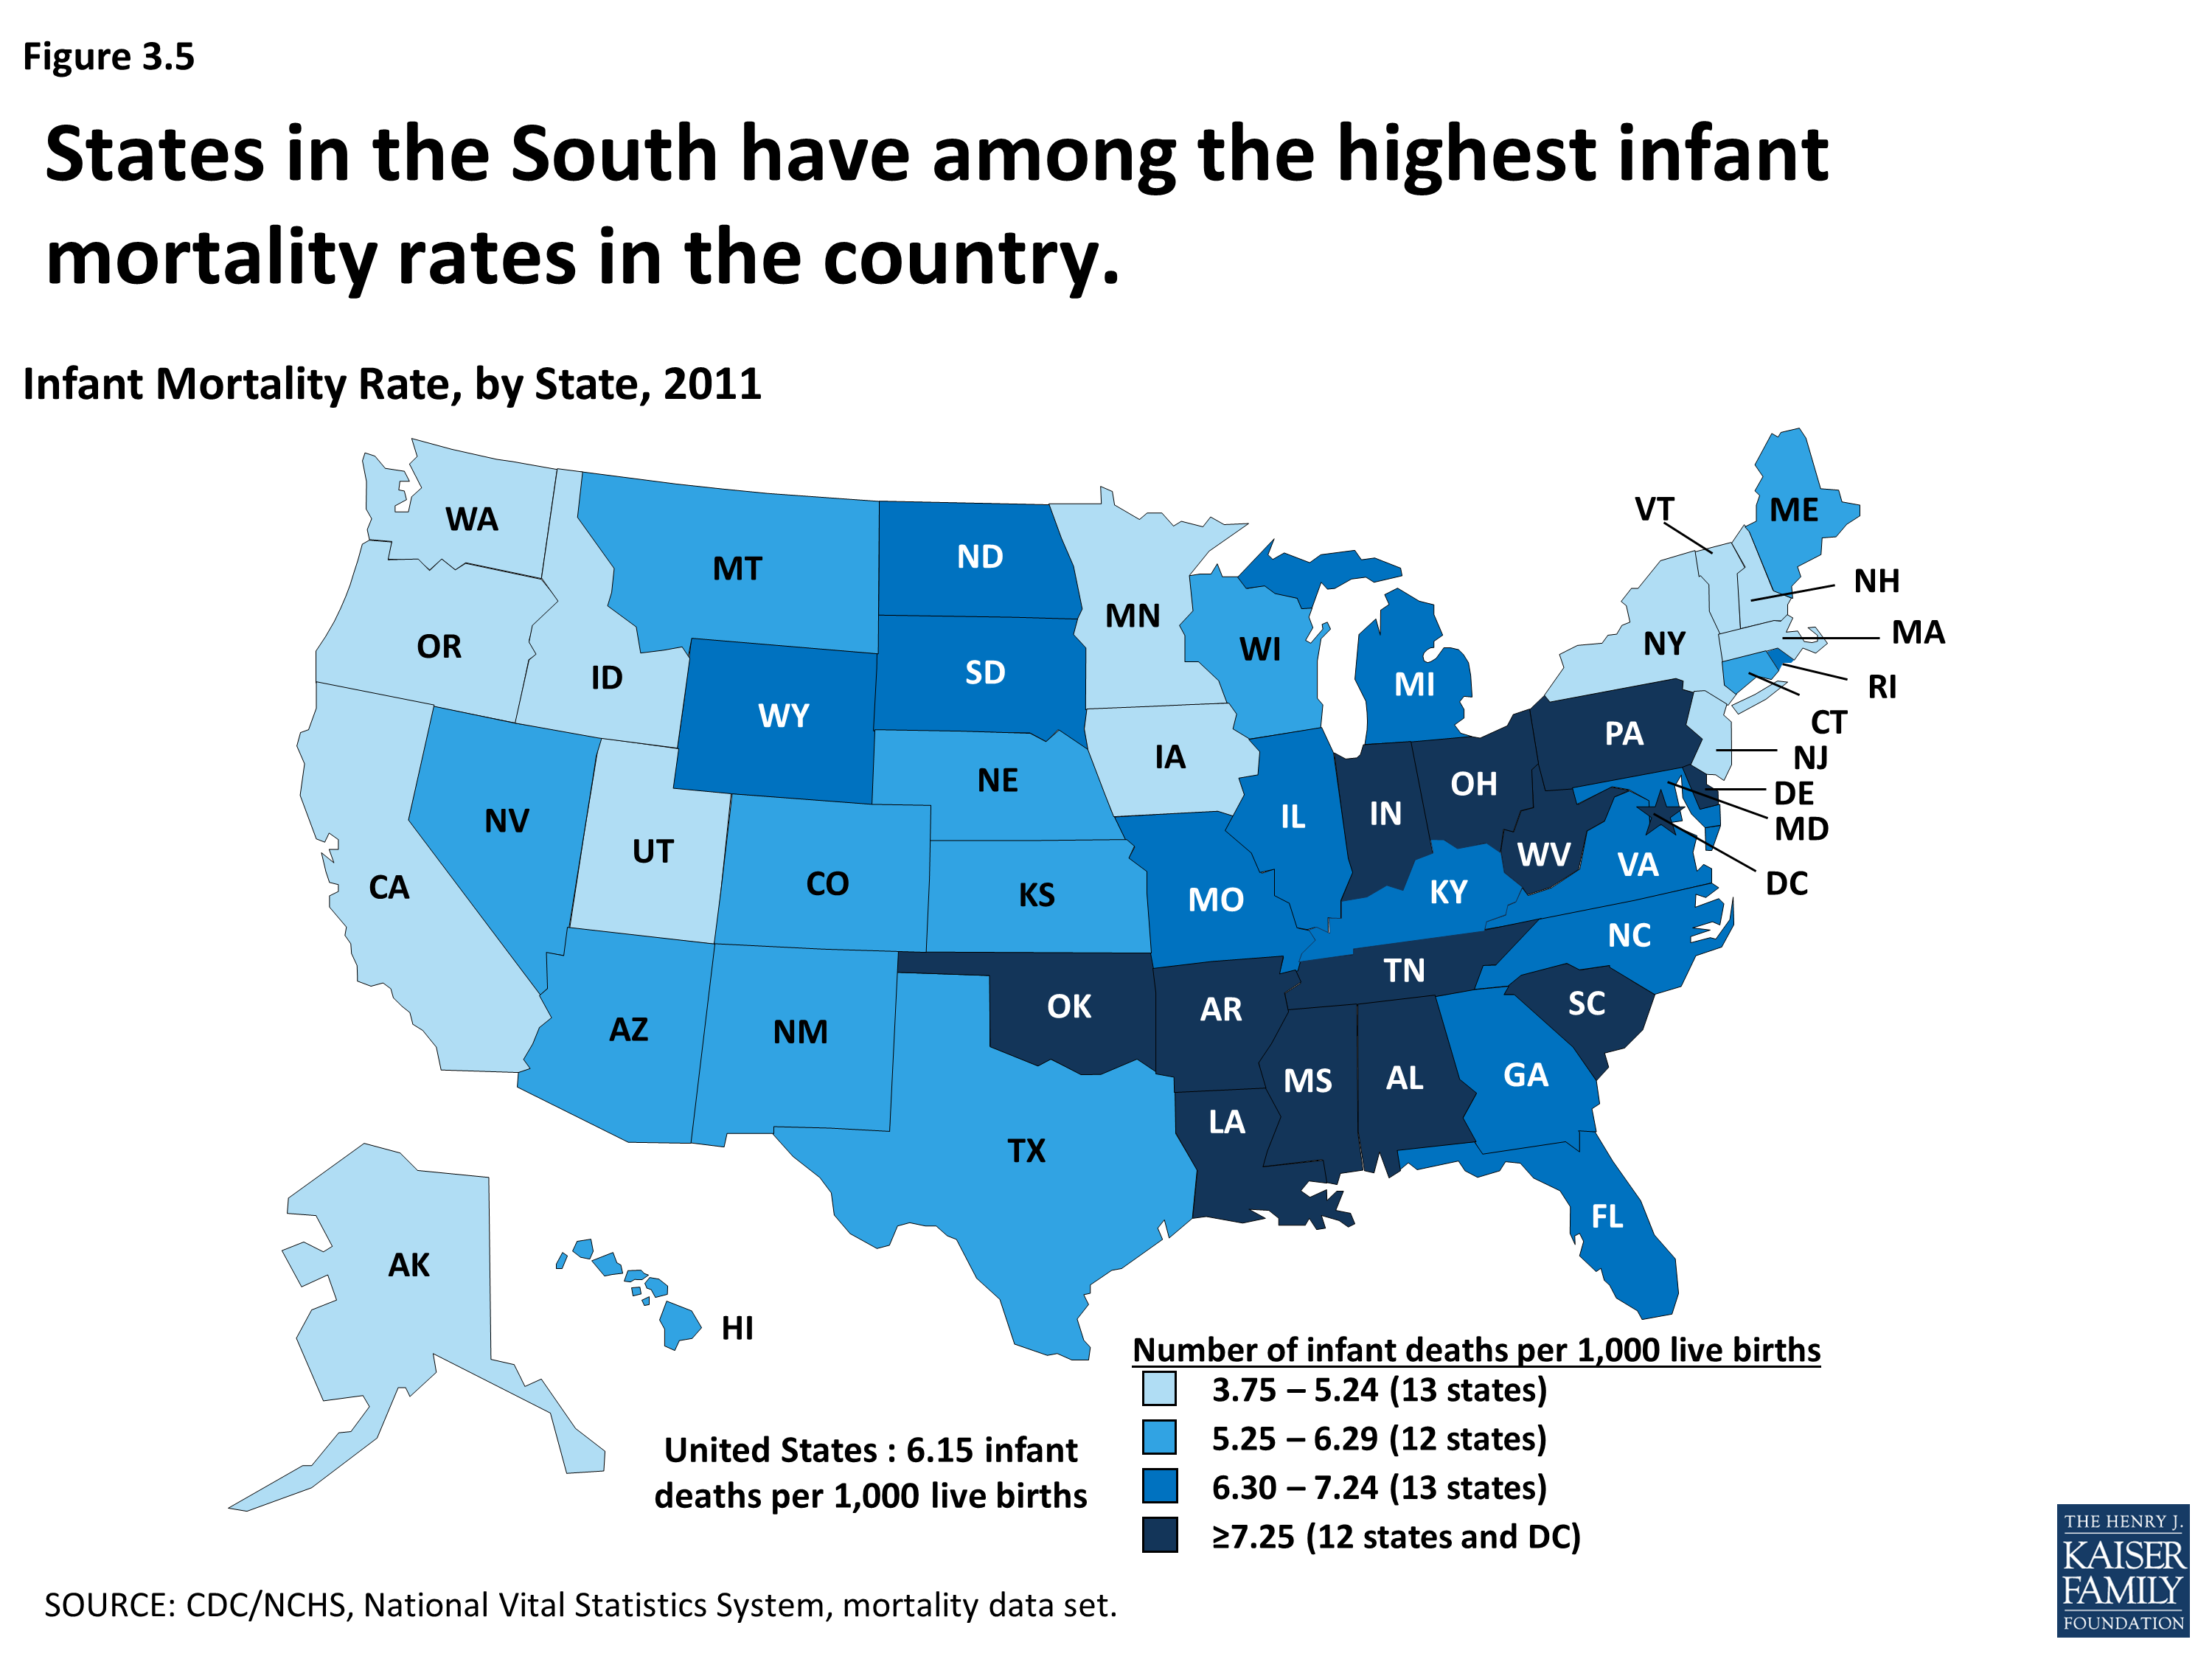
Infant Mortality Rate, by State, 2011
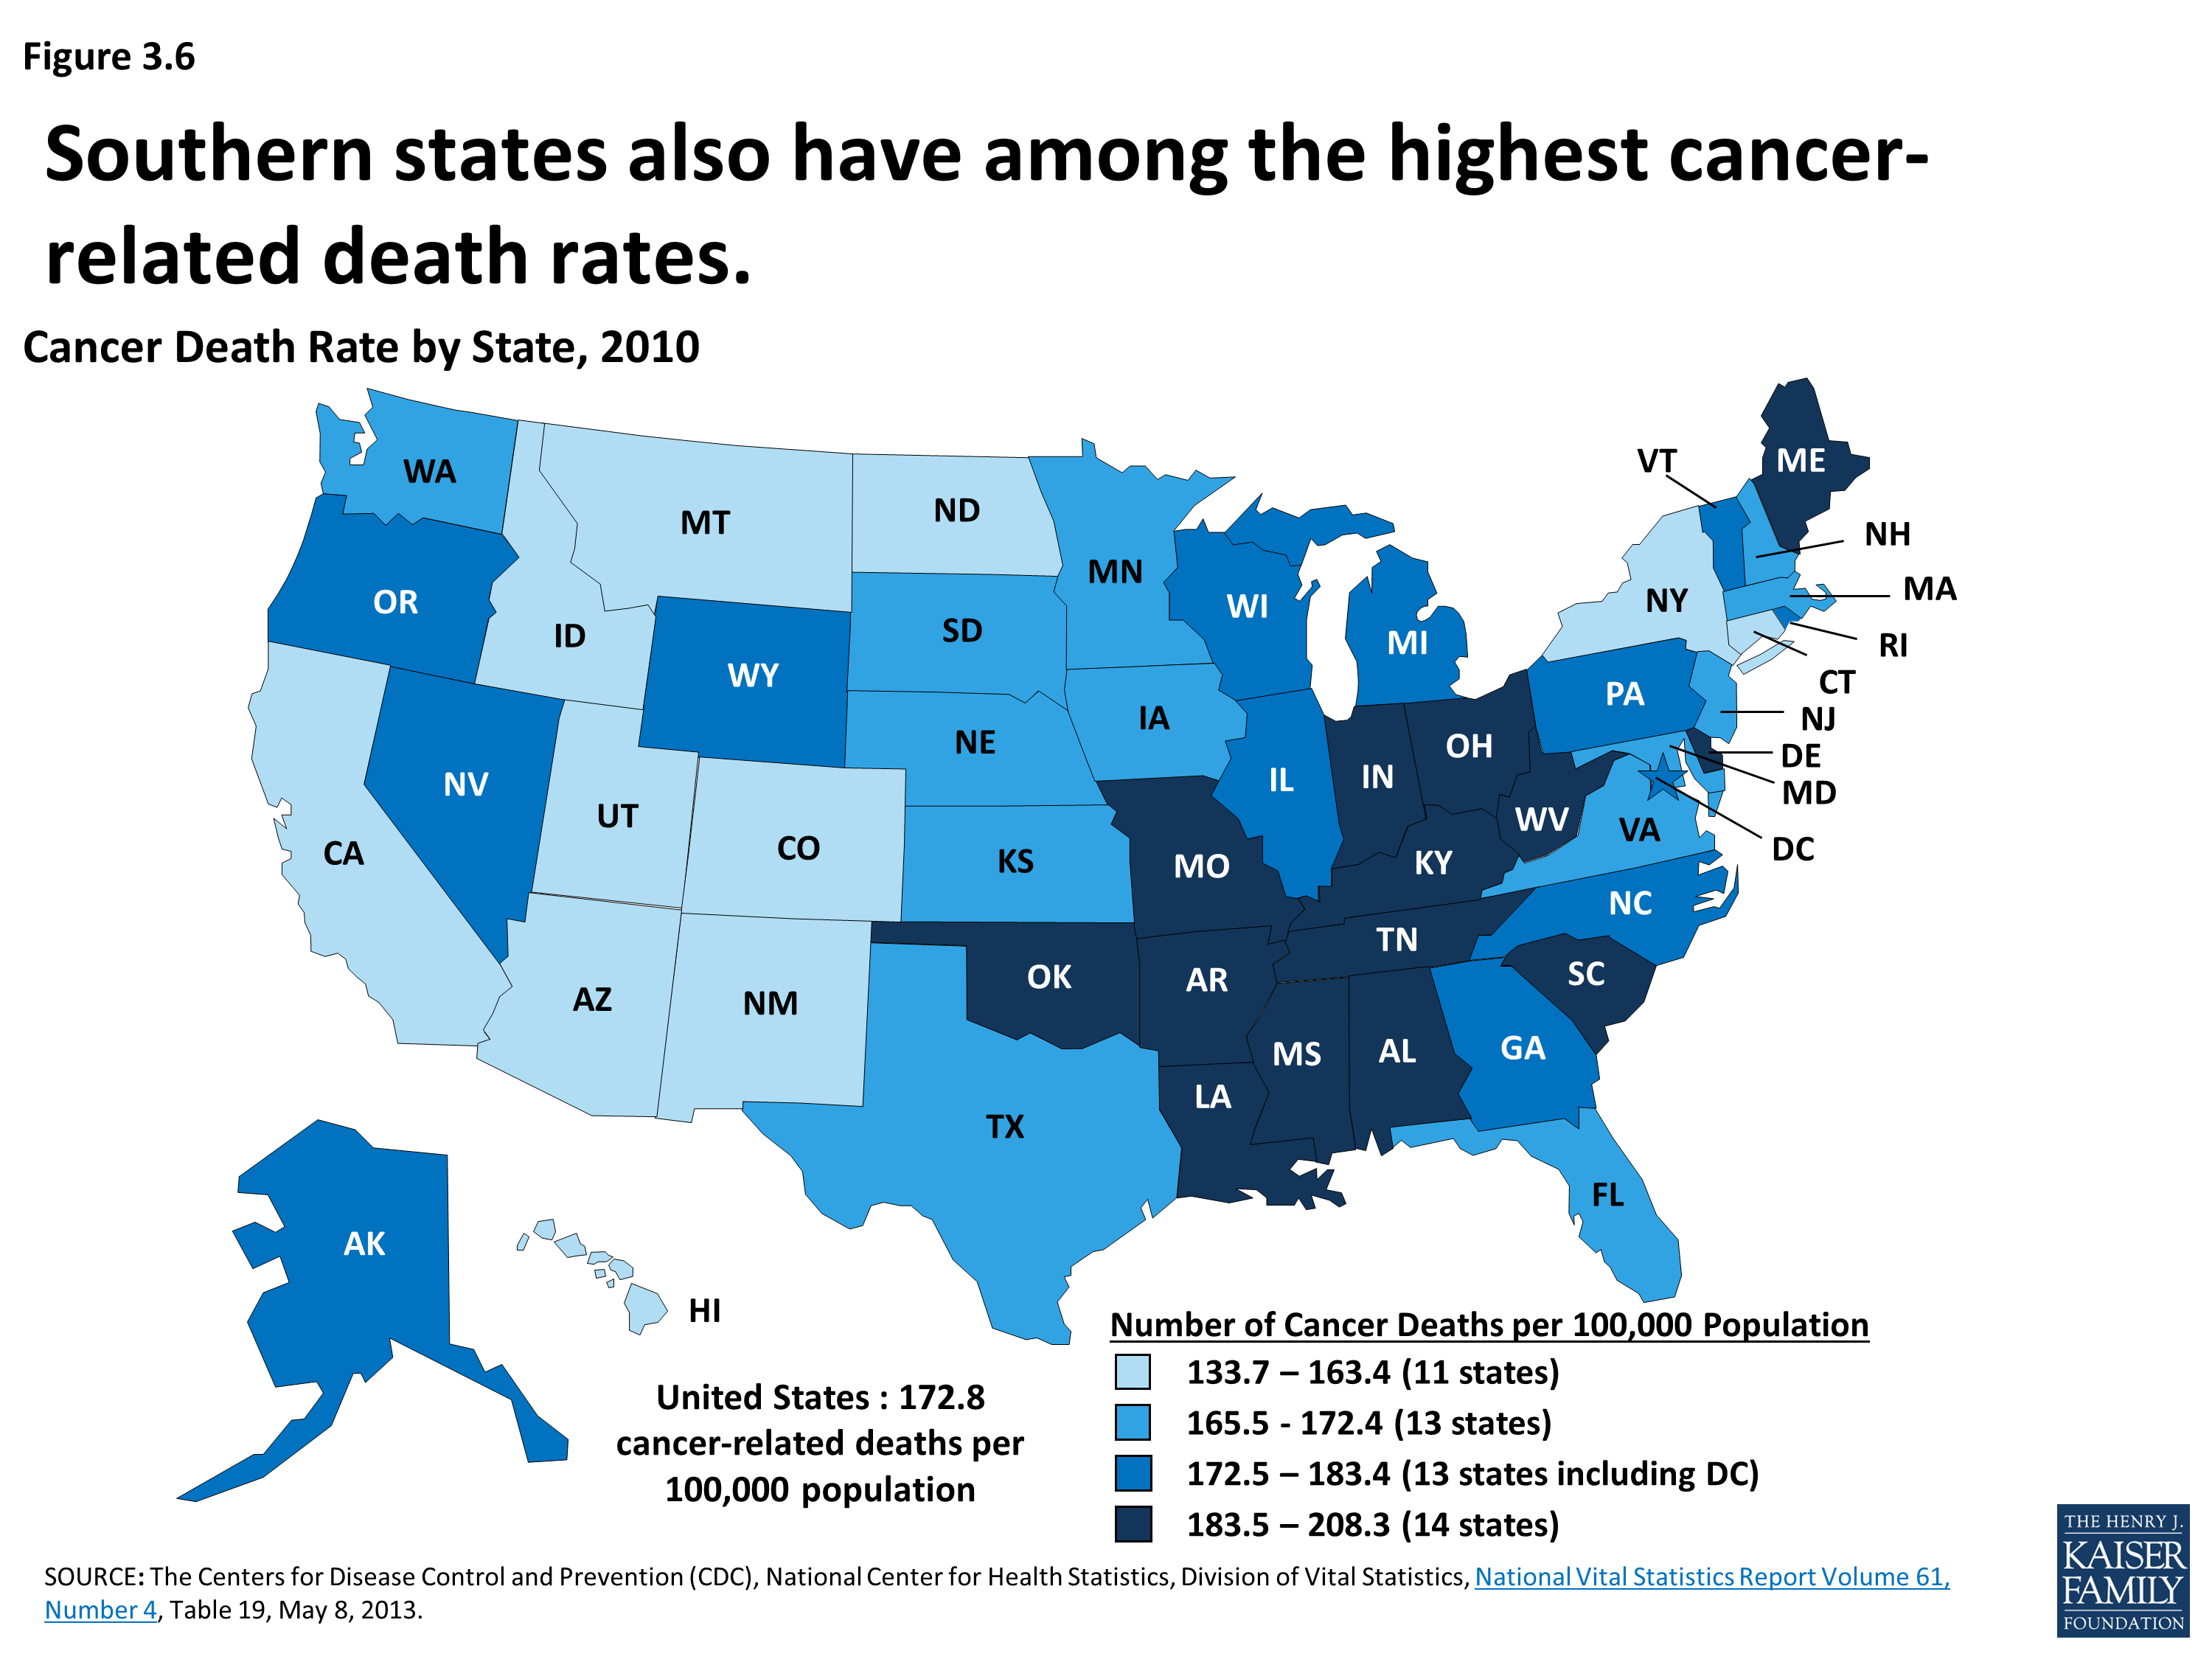
Cancer Death Rate, by State, 2010
Section 4: Health Insurance Coverage
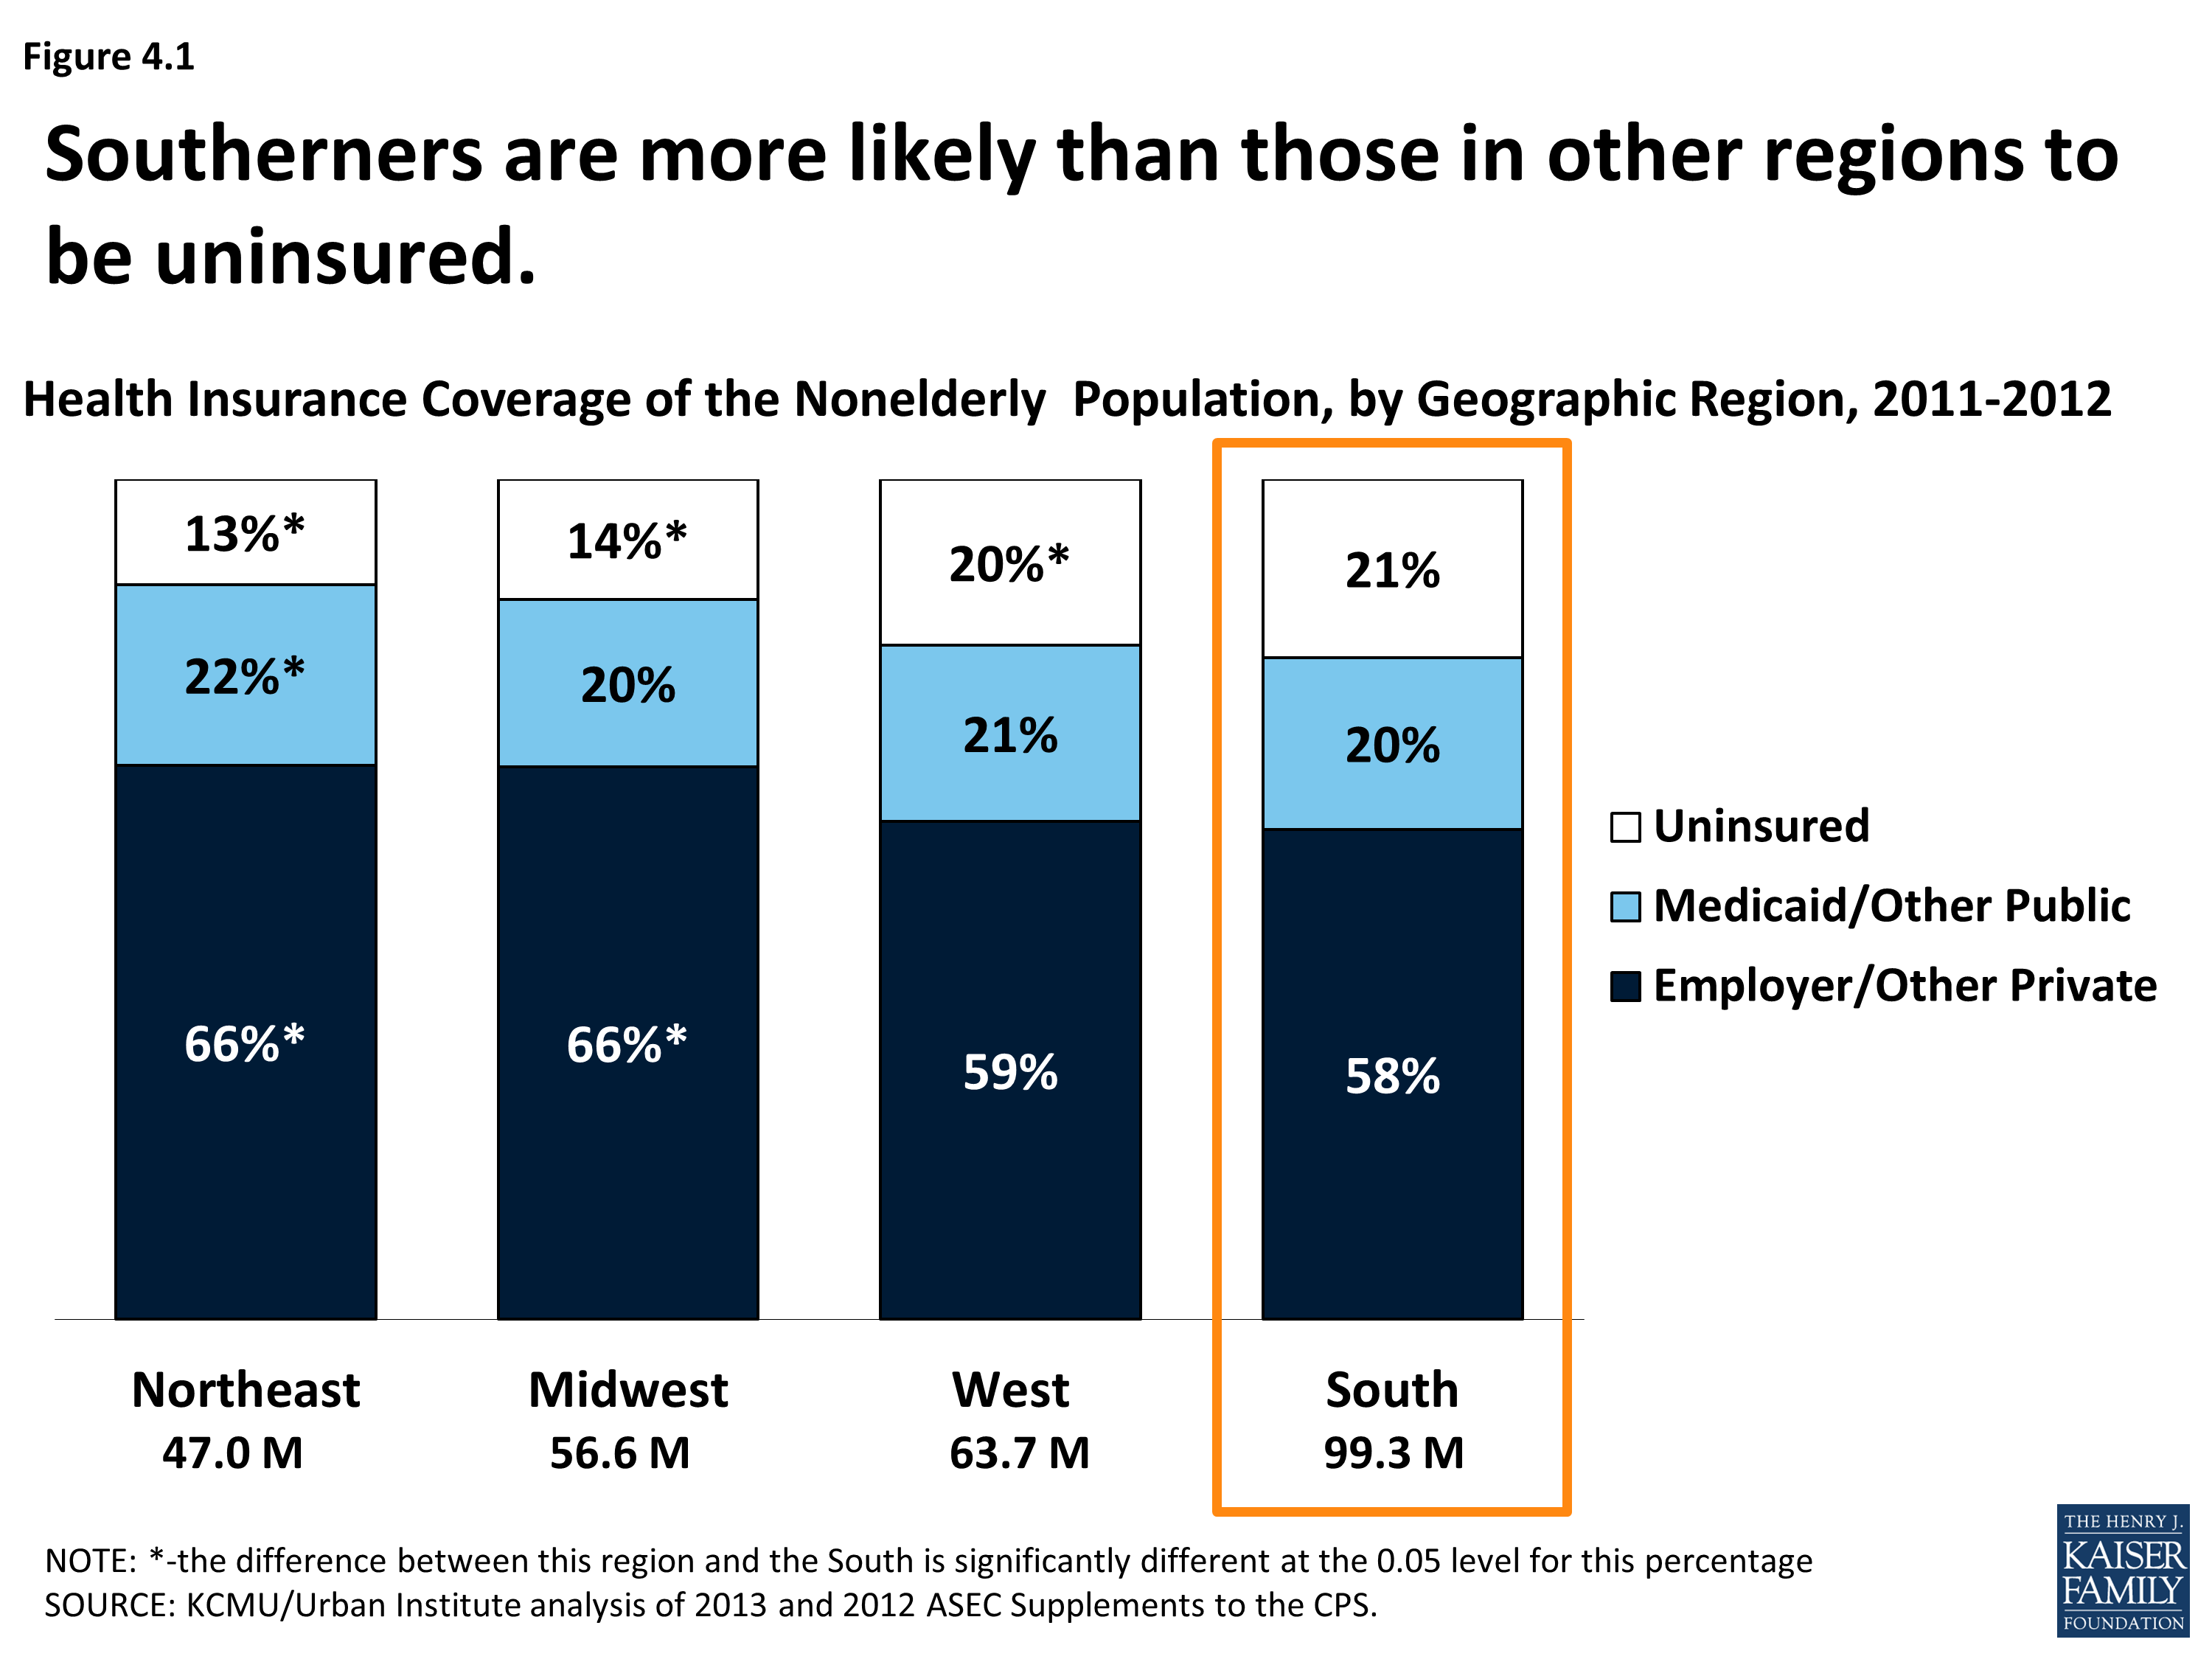
Health Insurance Coverage of the Nonelderly Population, by Geographic Region, 2011-2012
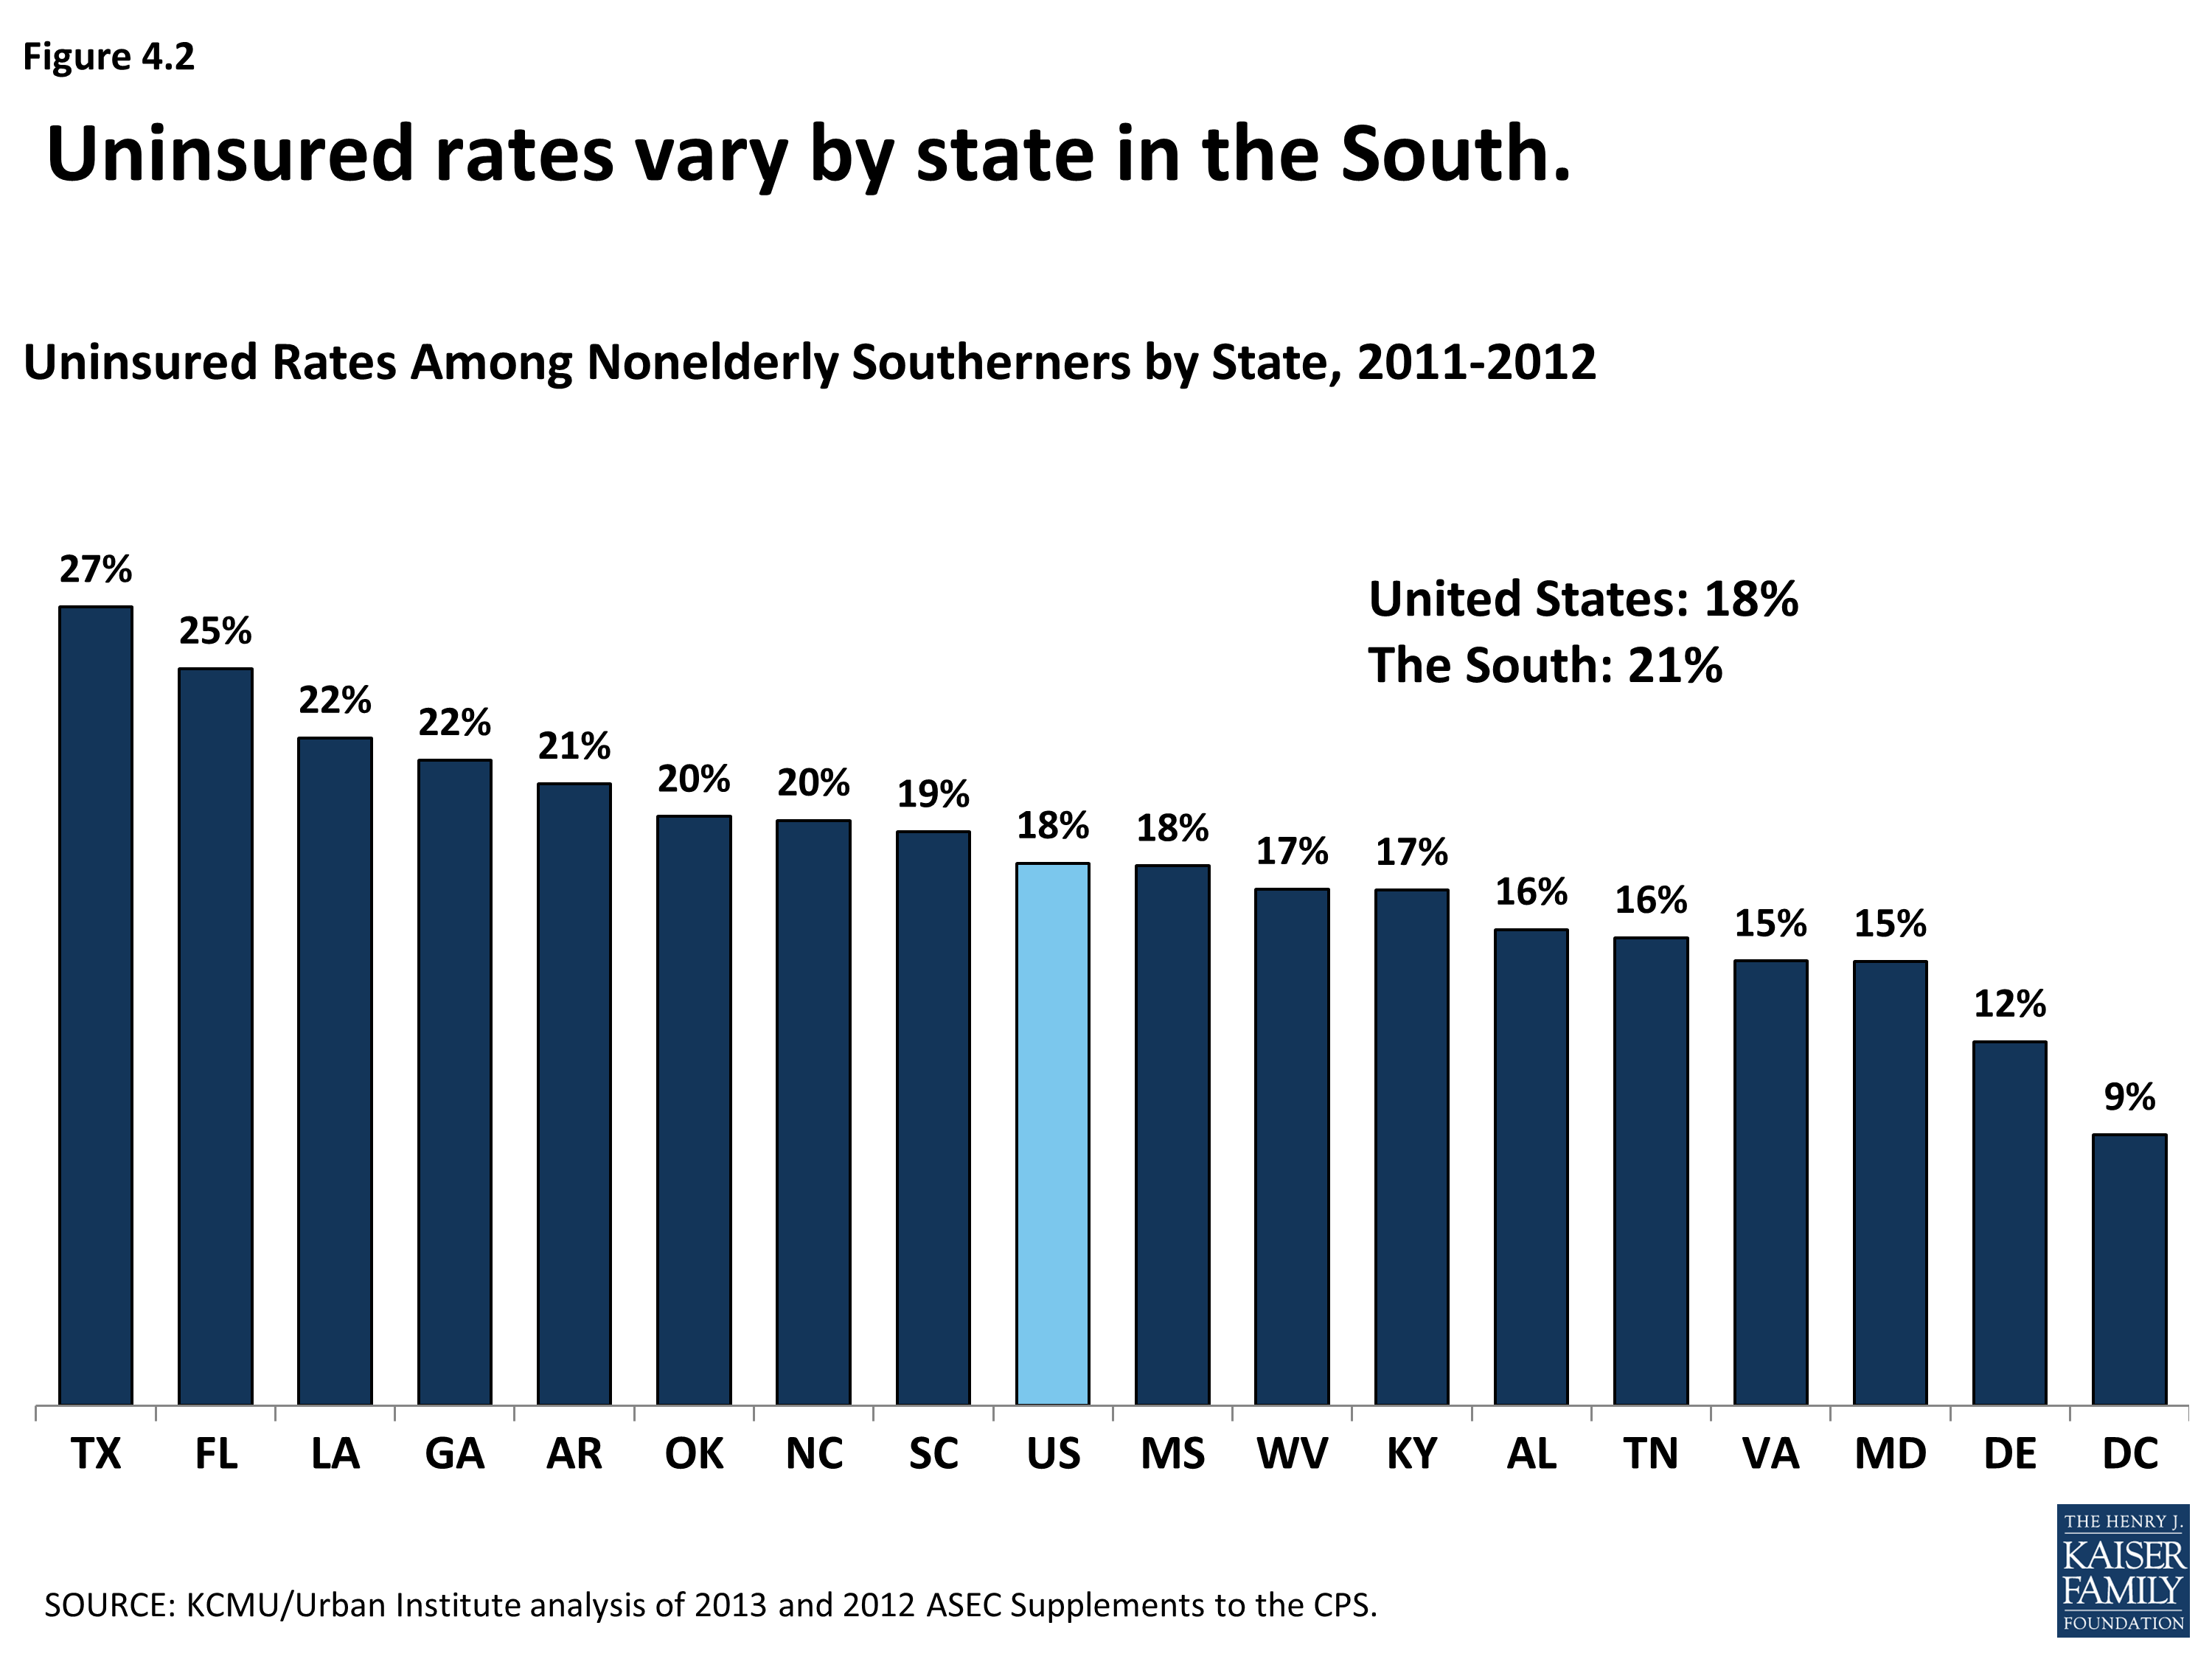
Uninsured Rates Among Nonelderly Southerners, by State, 2011-2012
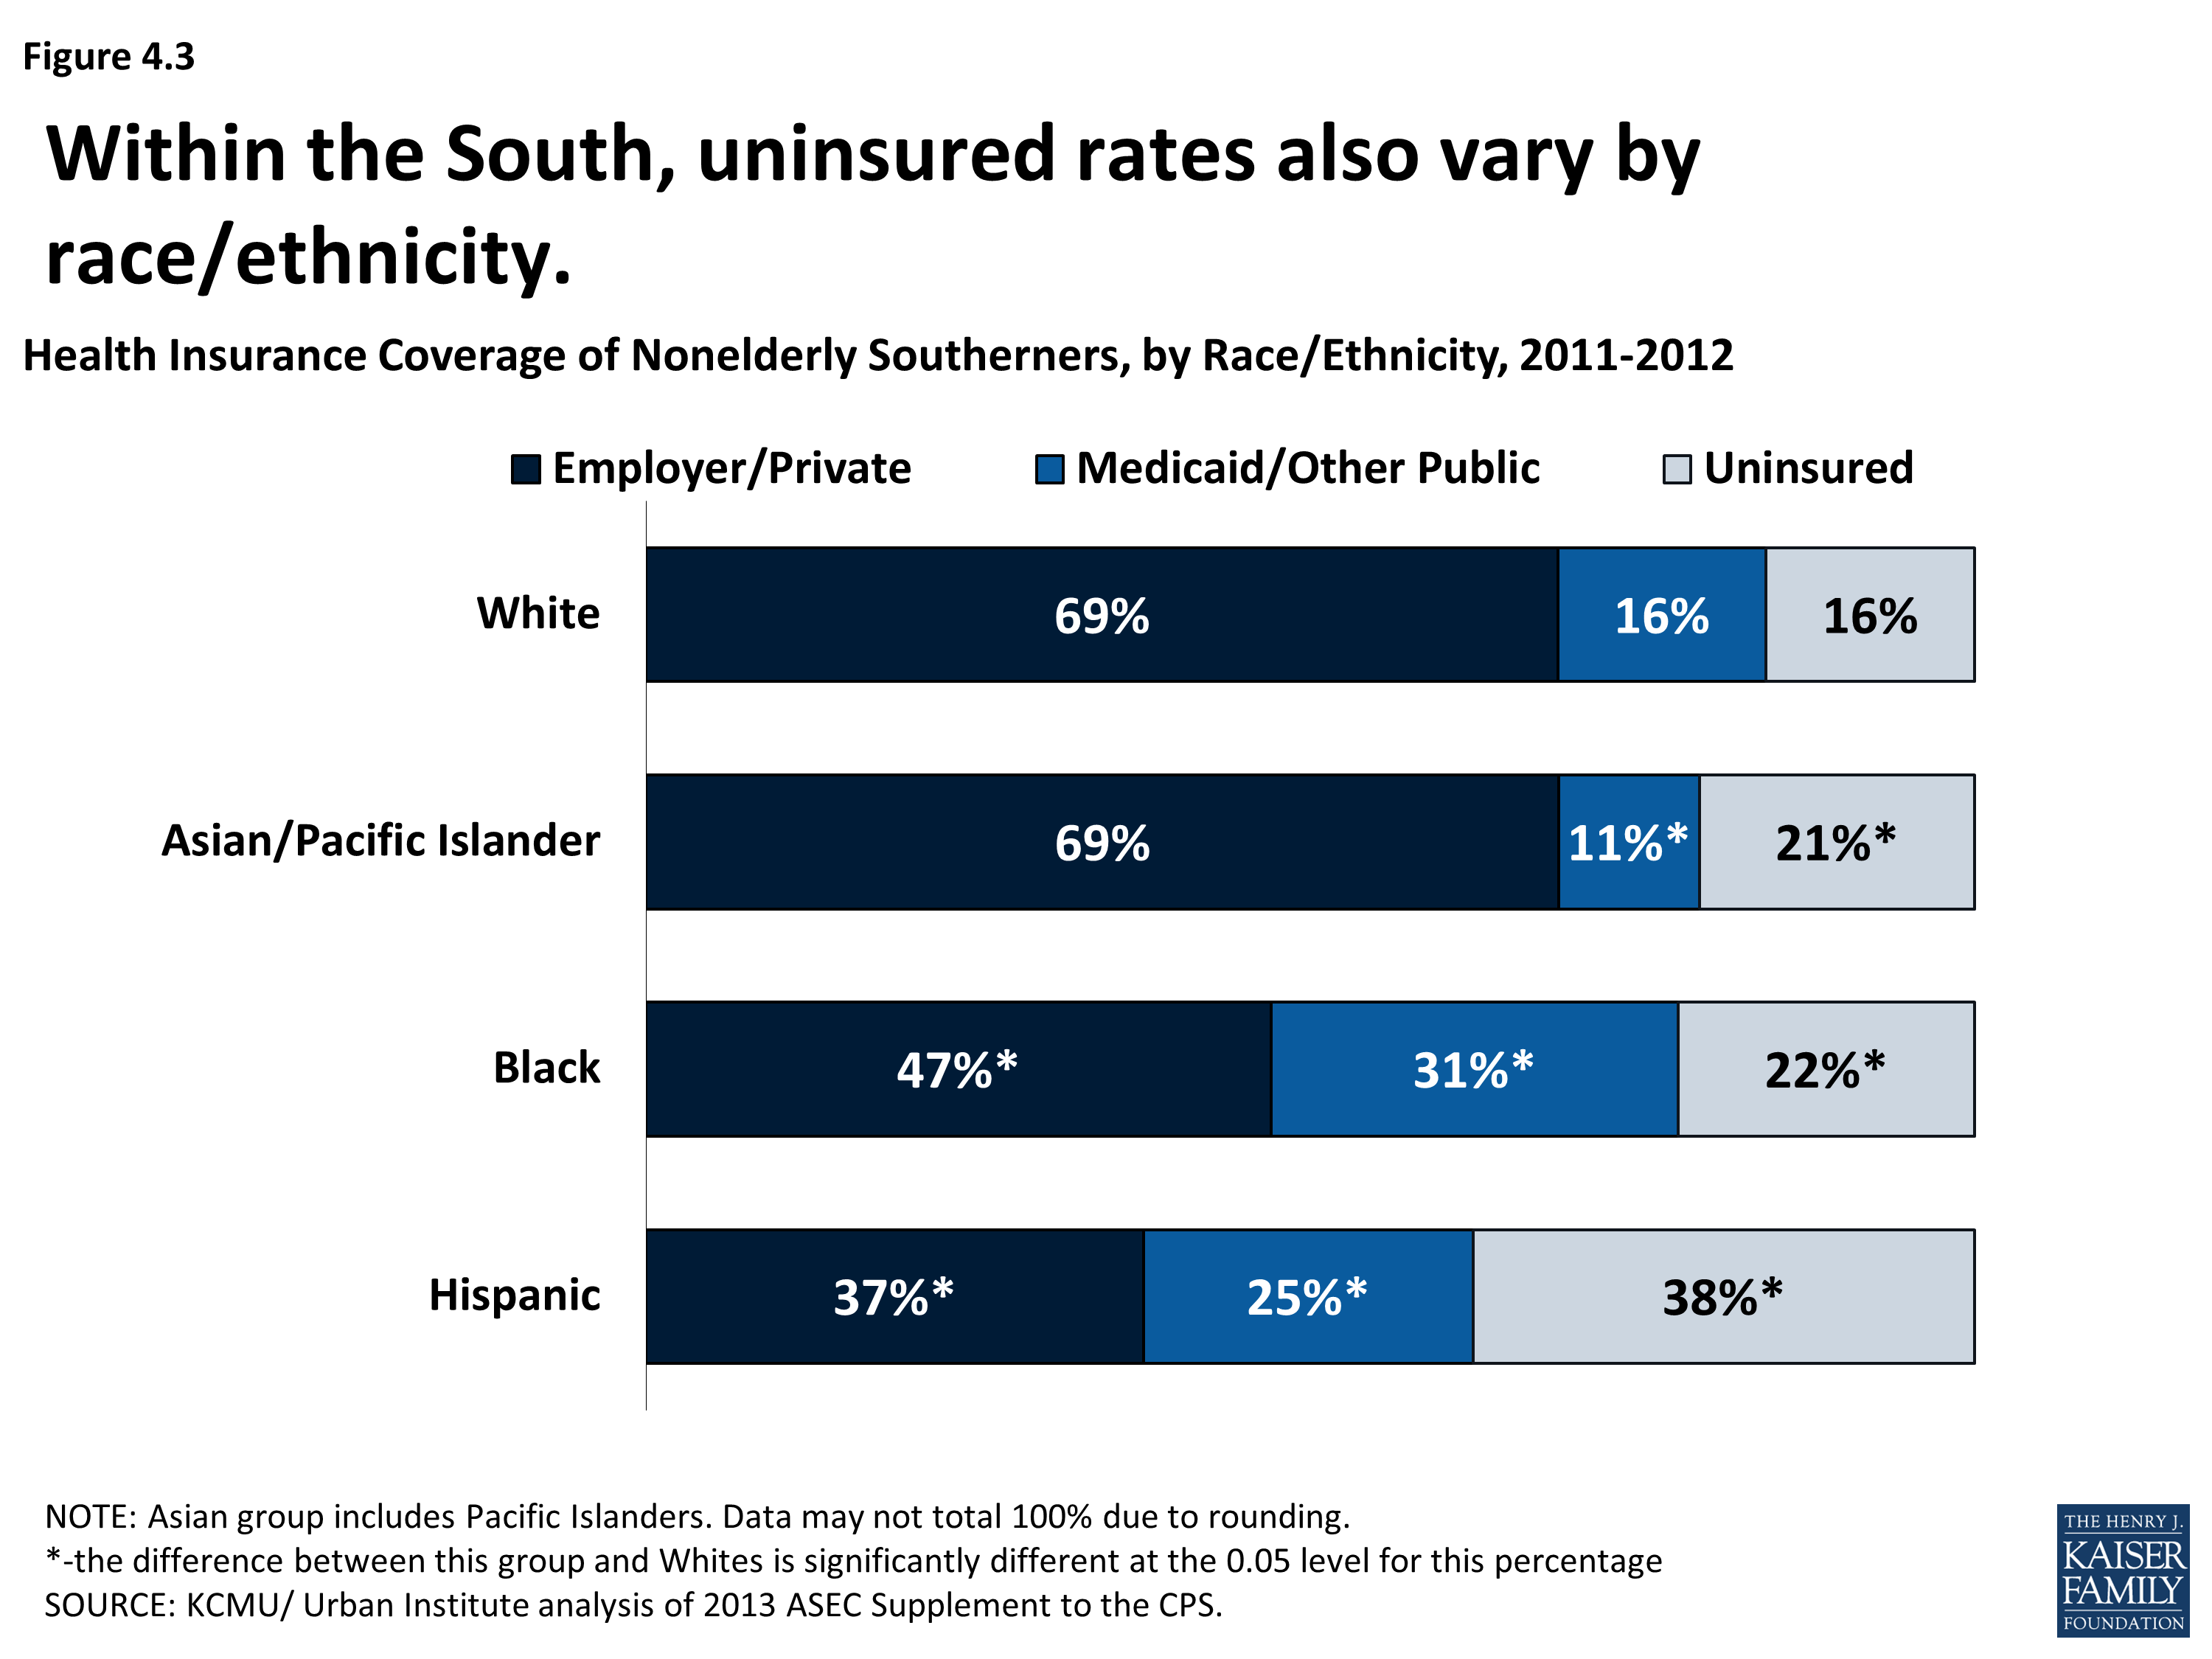
Health Insurance Coverage of Nonelderly Southerners, by Race/Ethnicity, 2011-2012
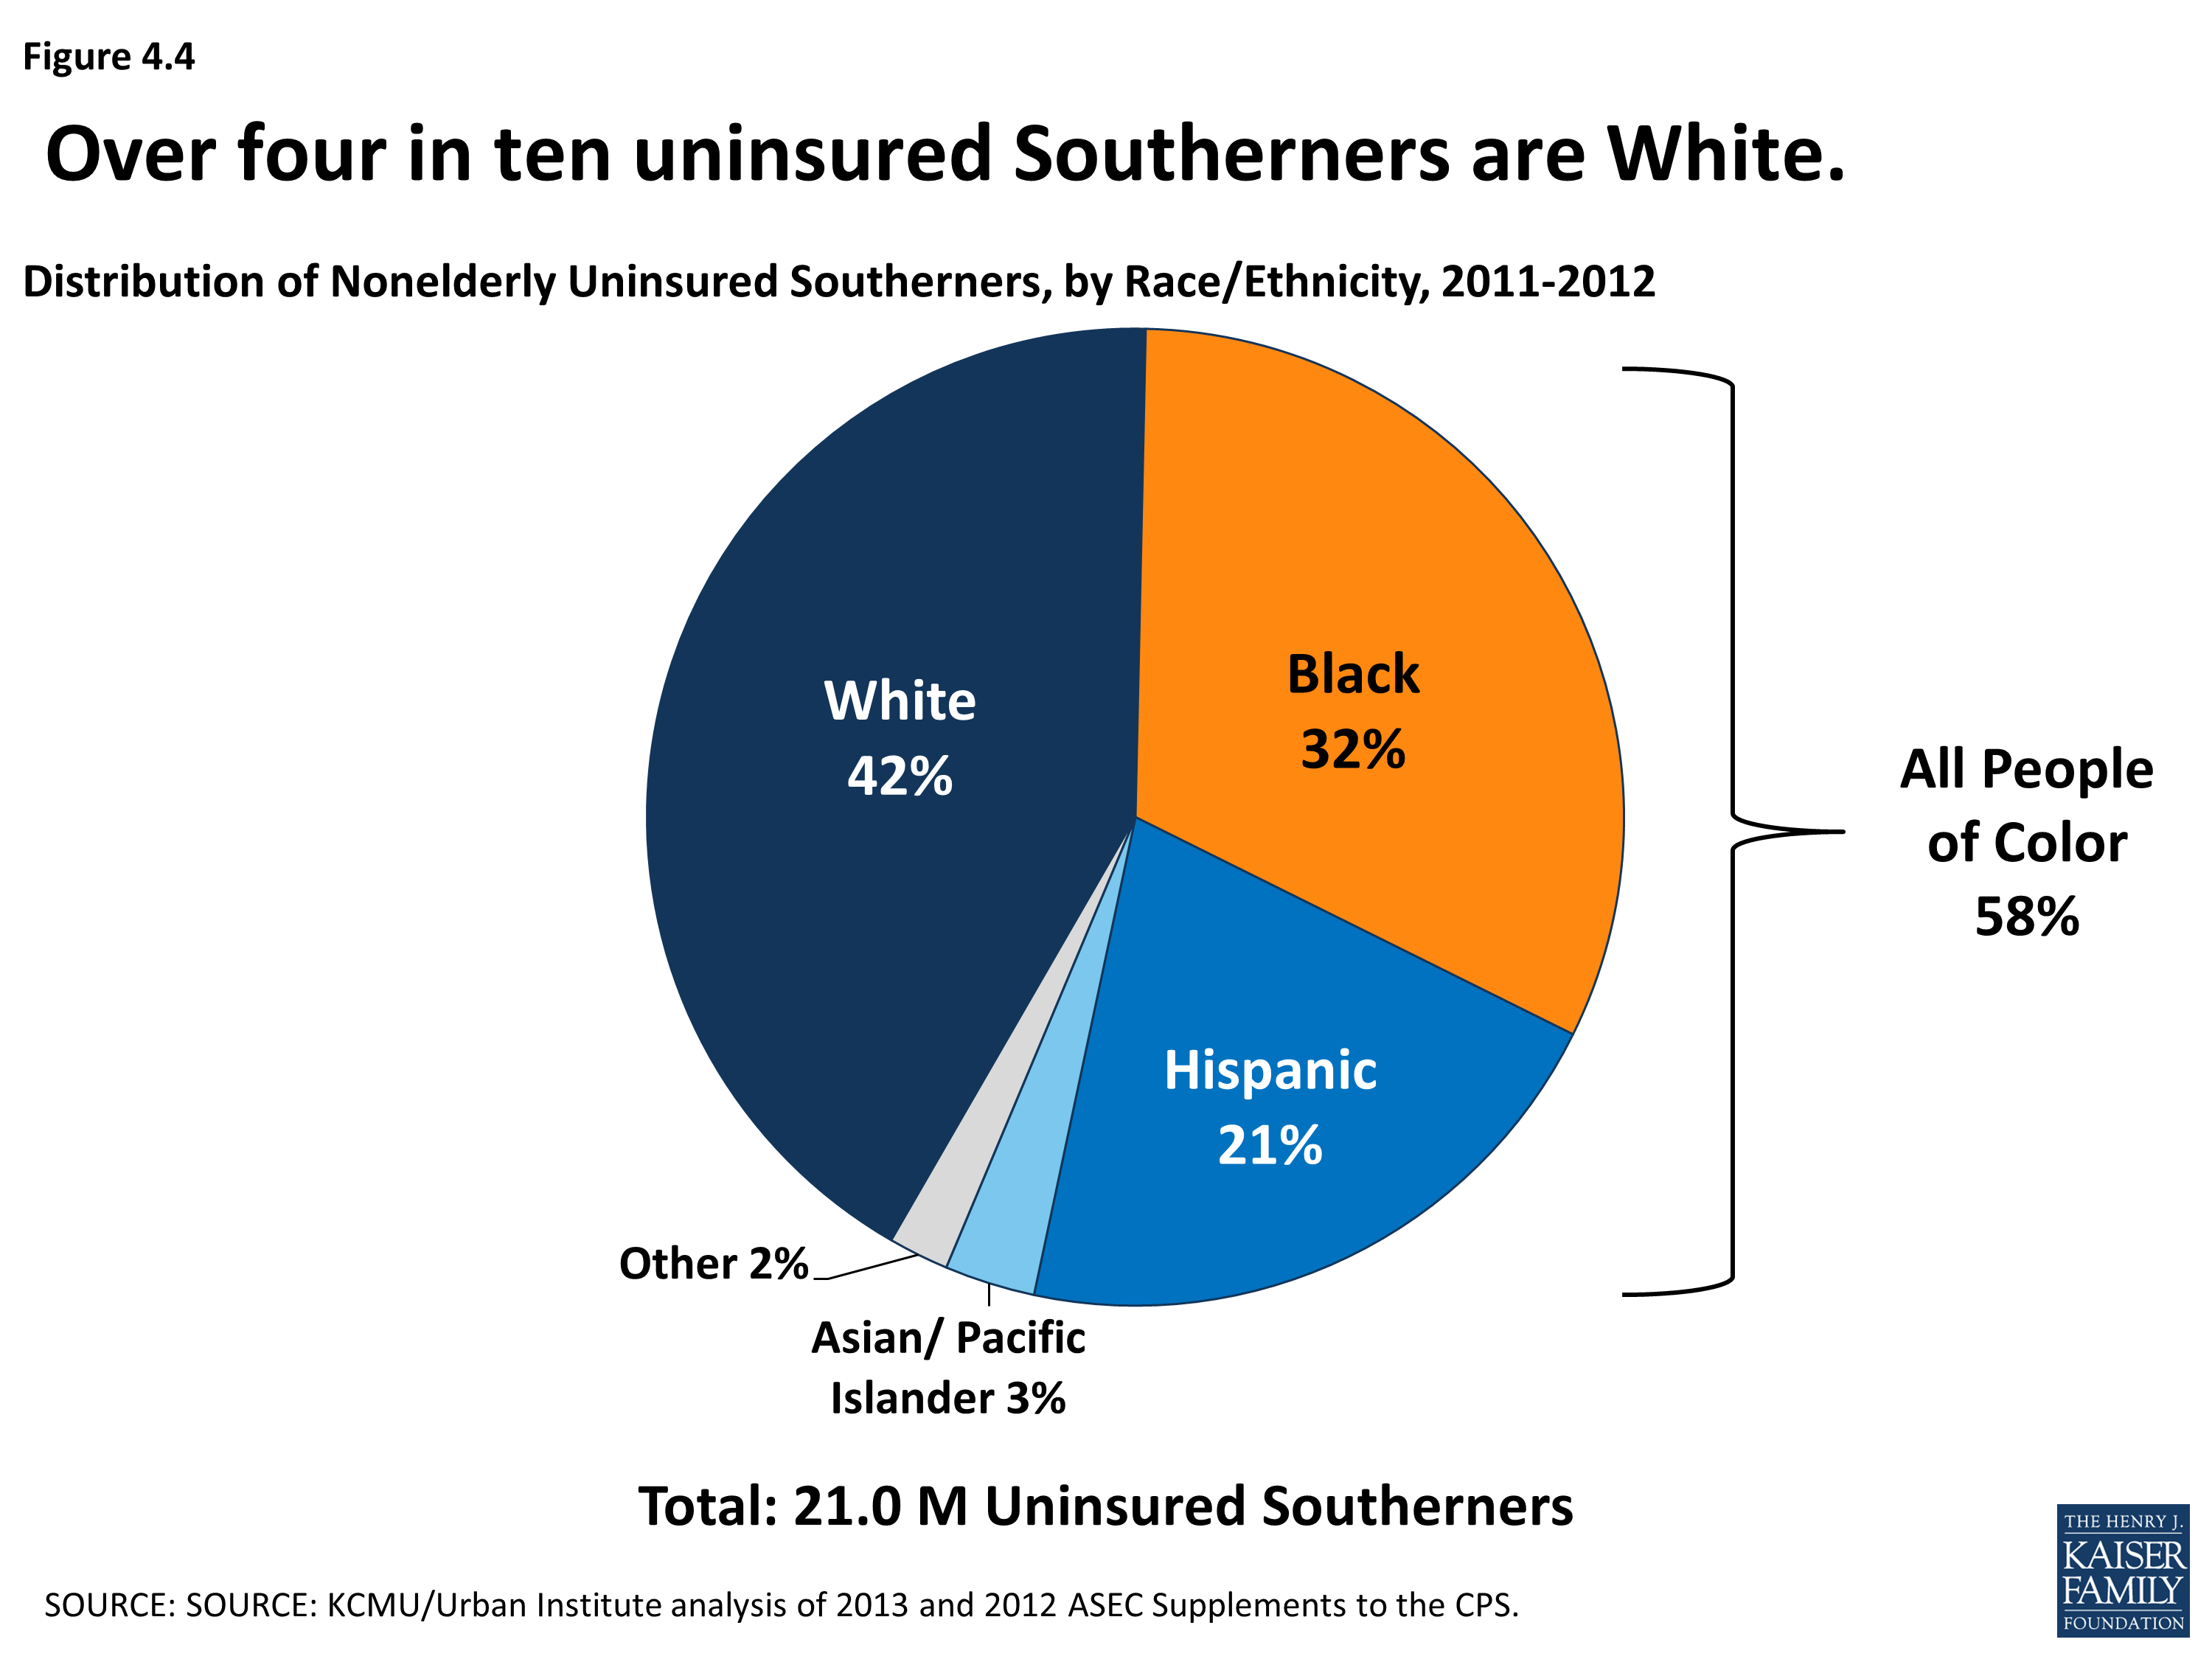
Distribution of Nonelderly Uninsured Southerners, by Race/Ethnicity, 2011-2012
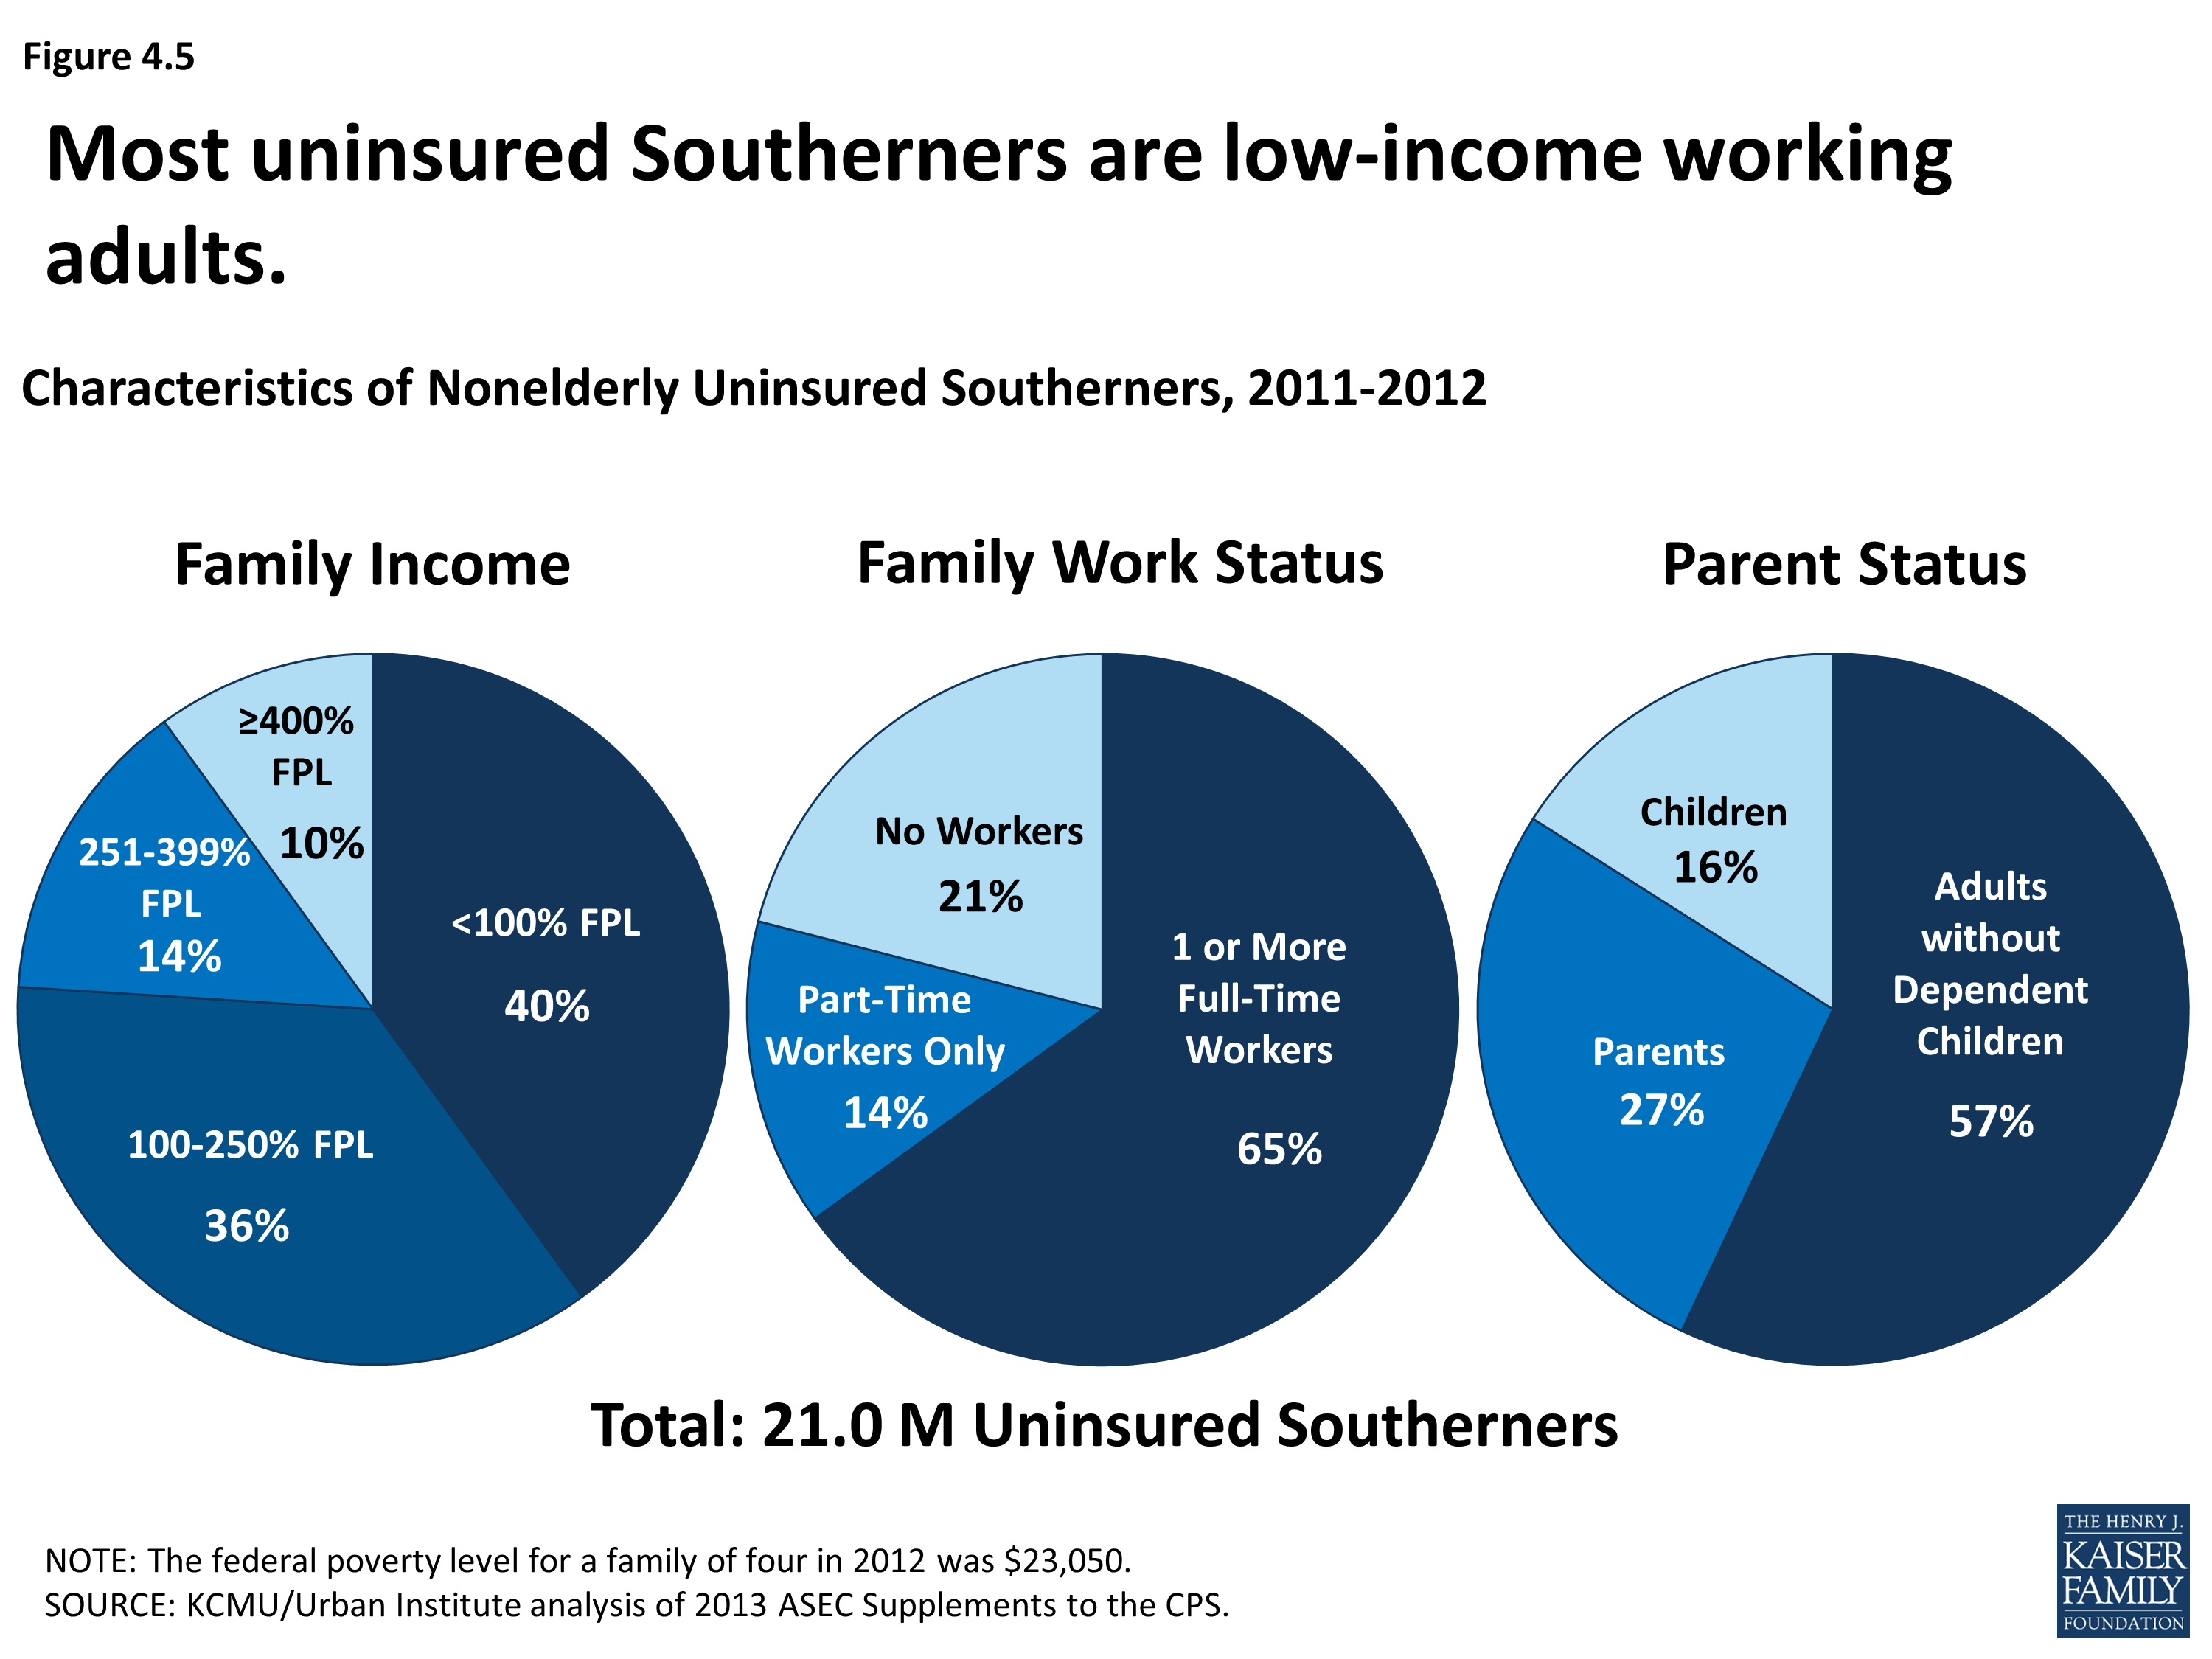
Characteristics of Nonelderly Uninsured Southerners, 2011-2012
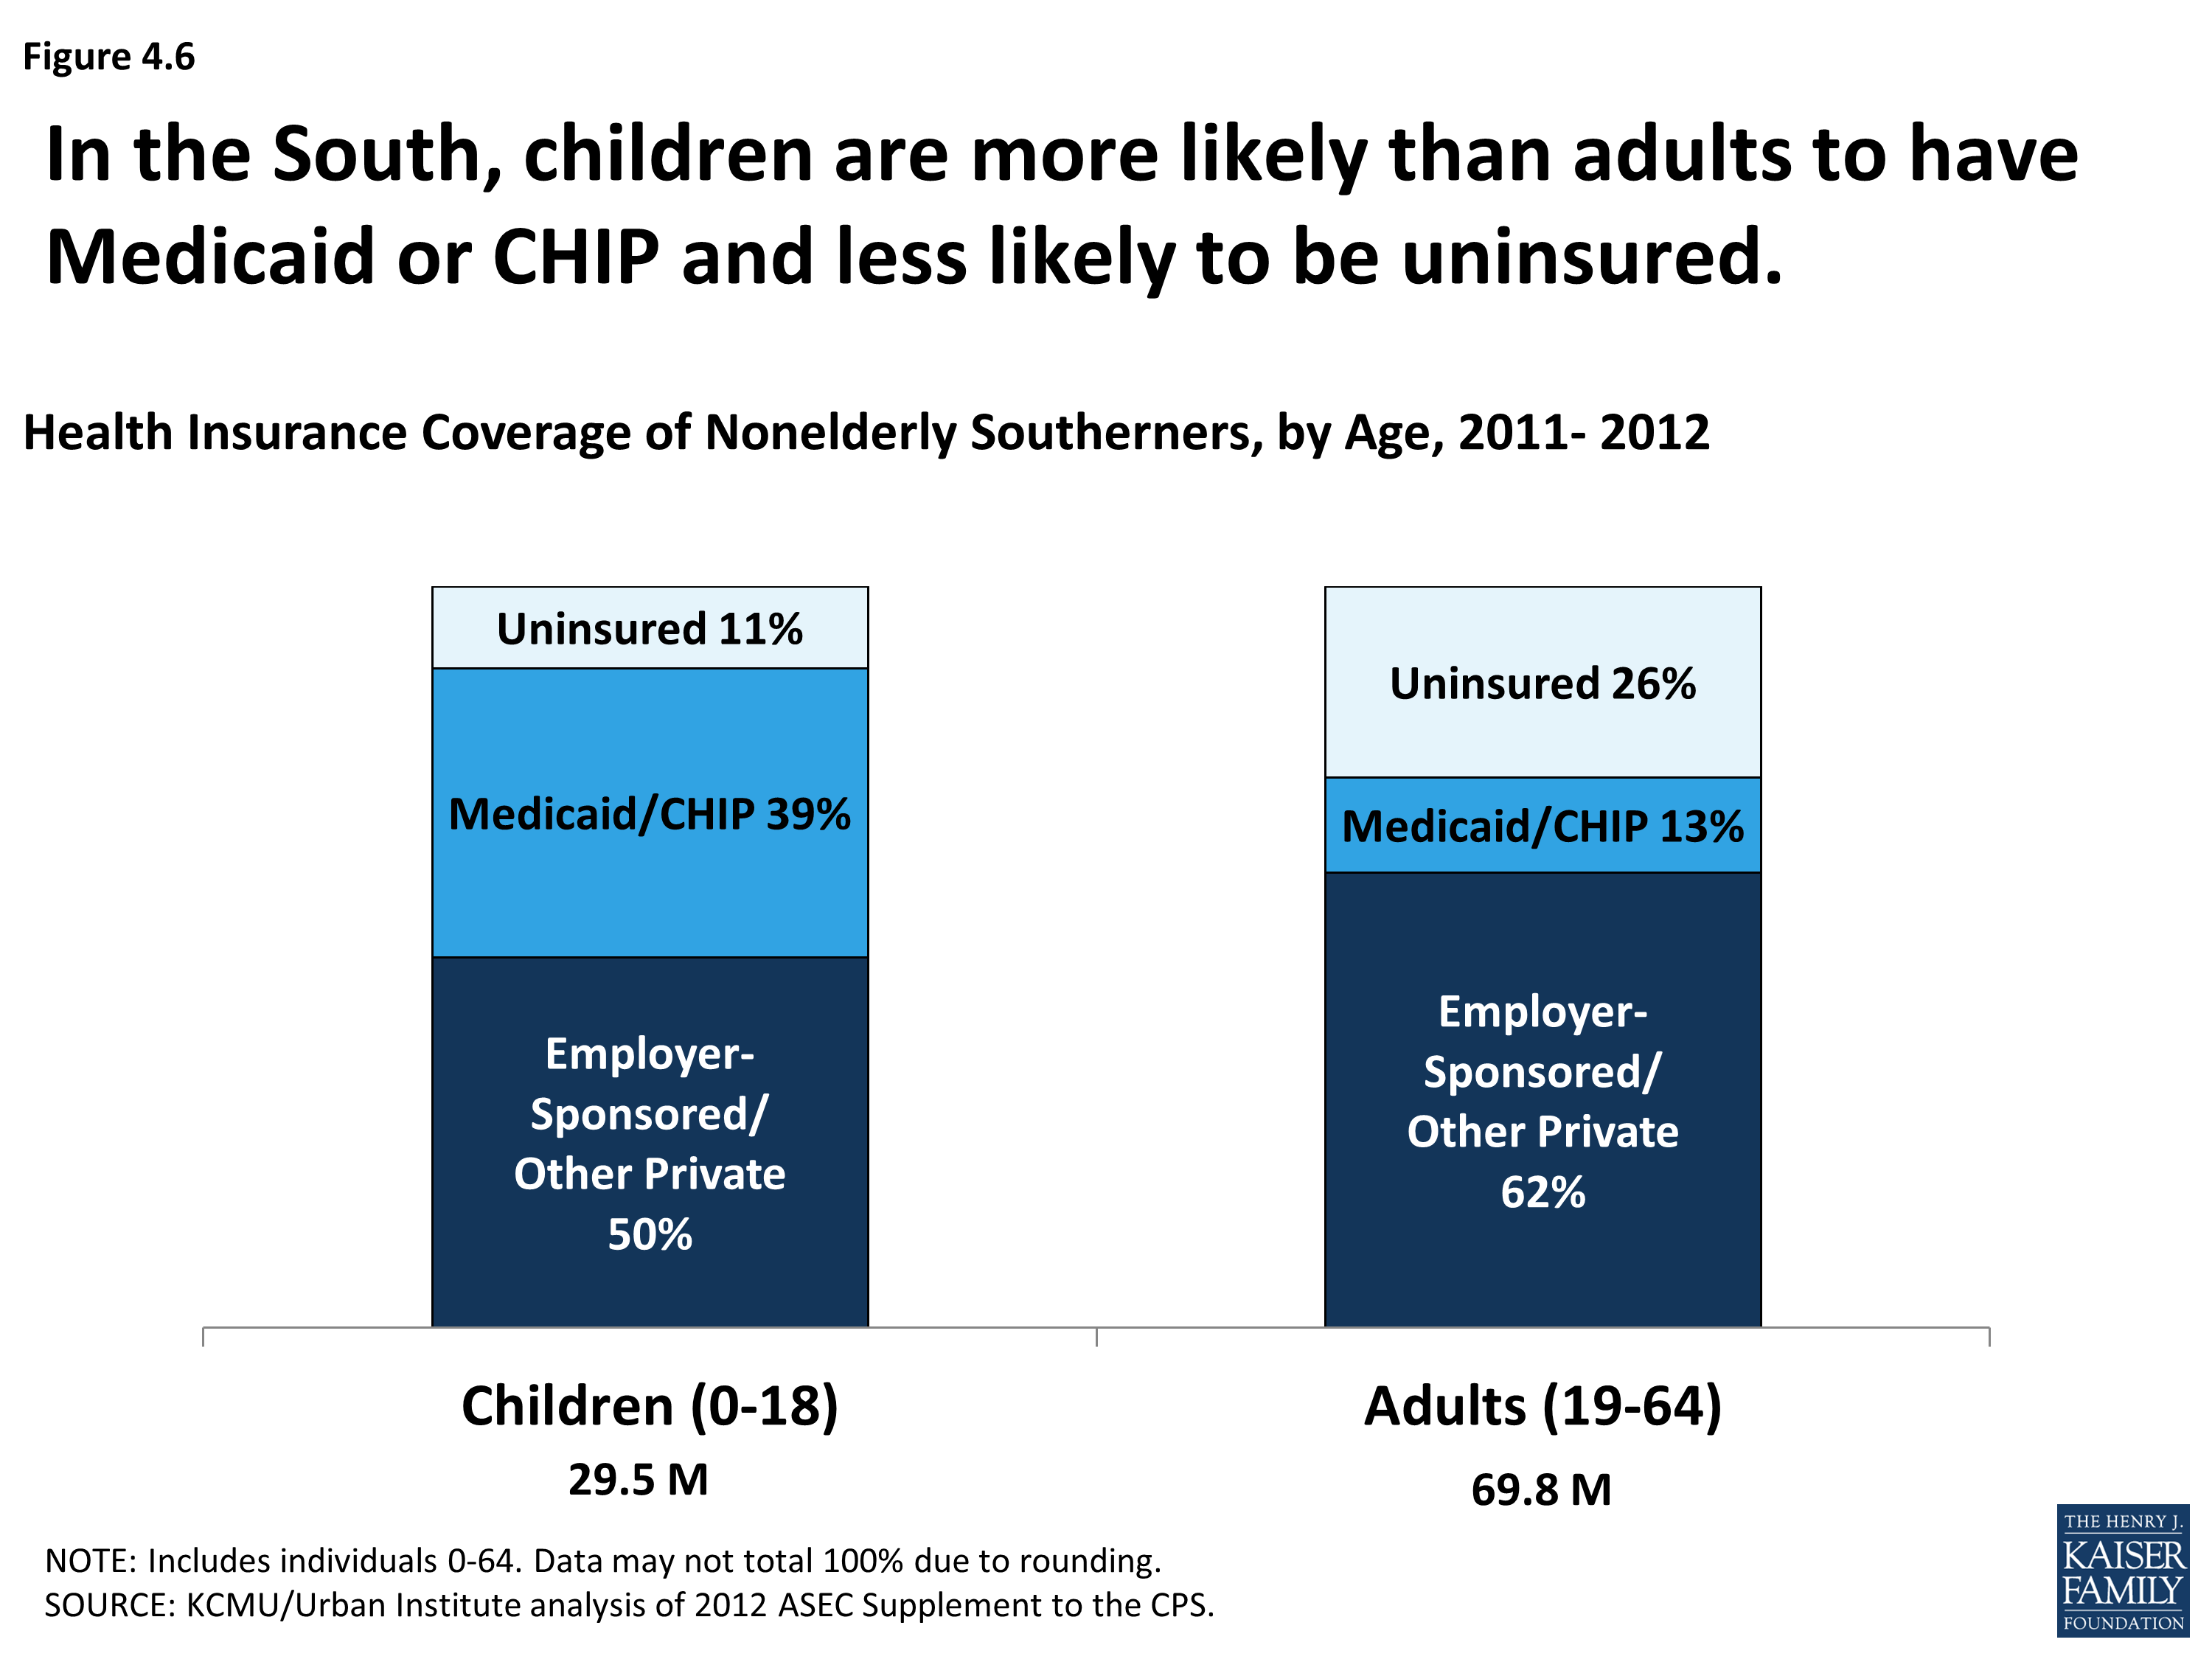
Health Insurance Coverage of Nonelderly Southerners, by Age, 2011-2012
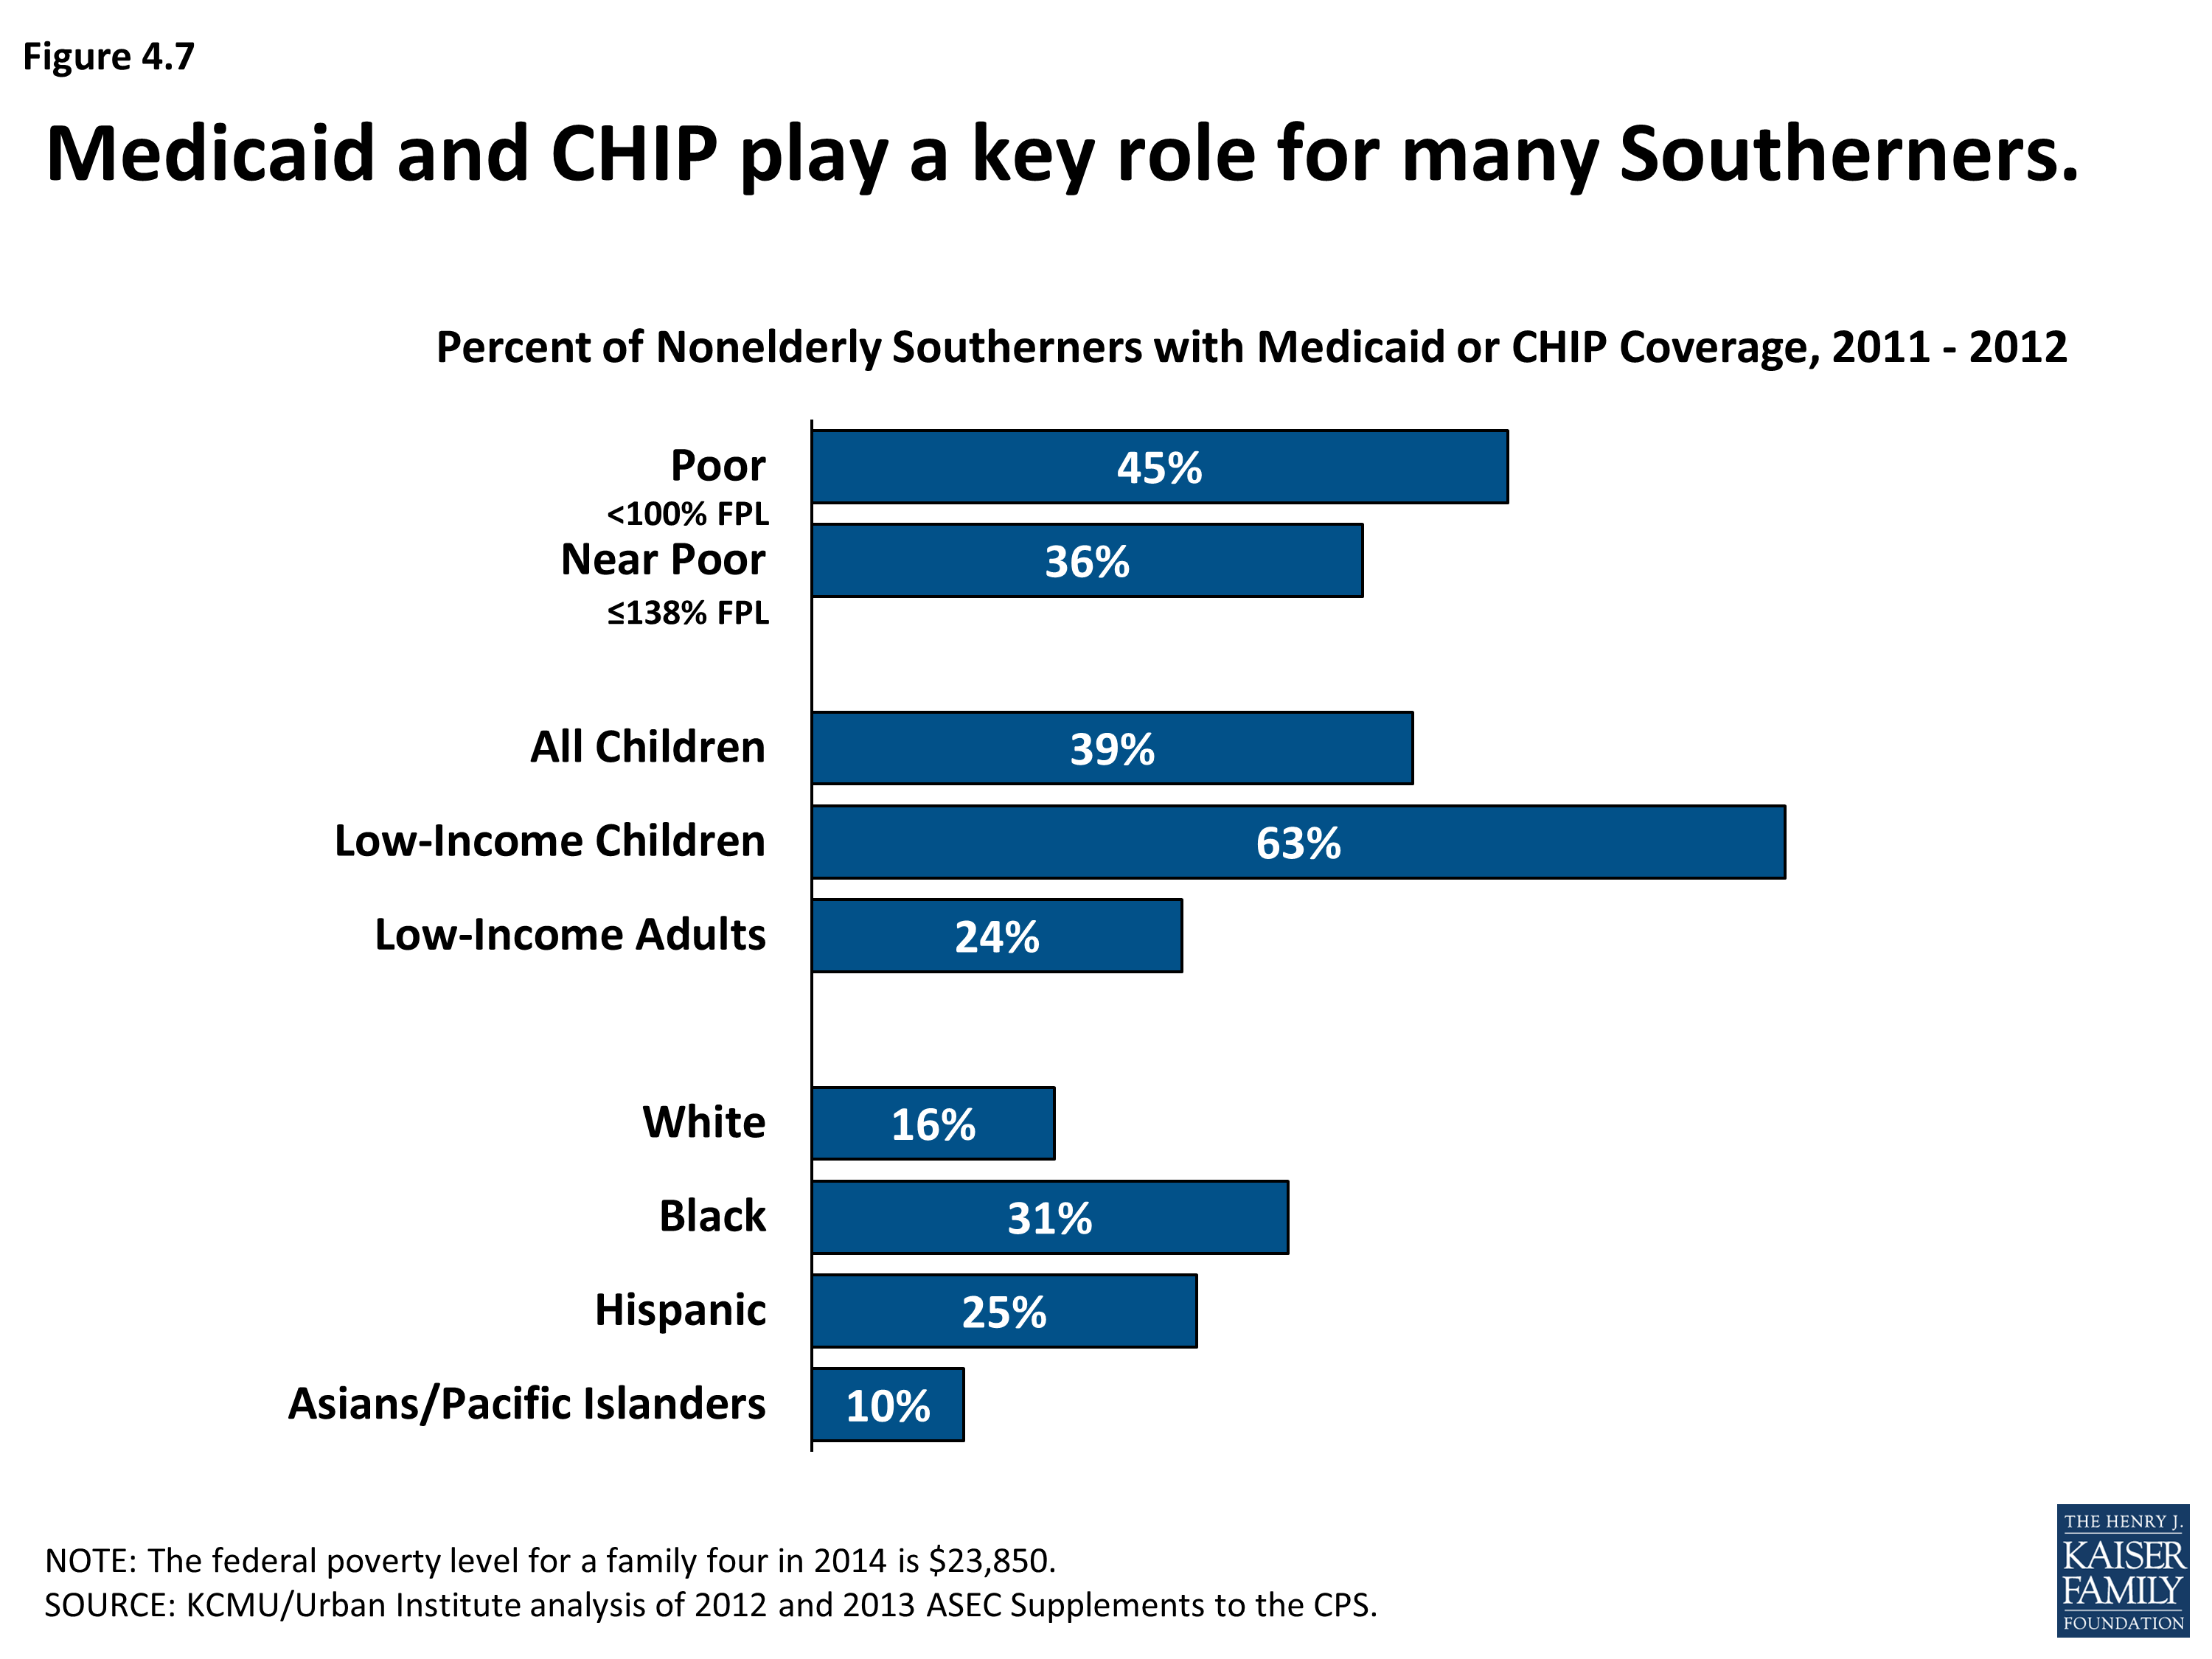
Percent of Nonelderly Southerners with Medicaid or CHIP Coverage, 2011-2012
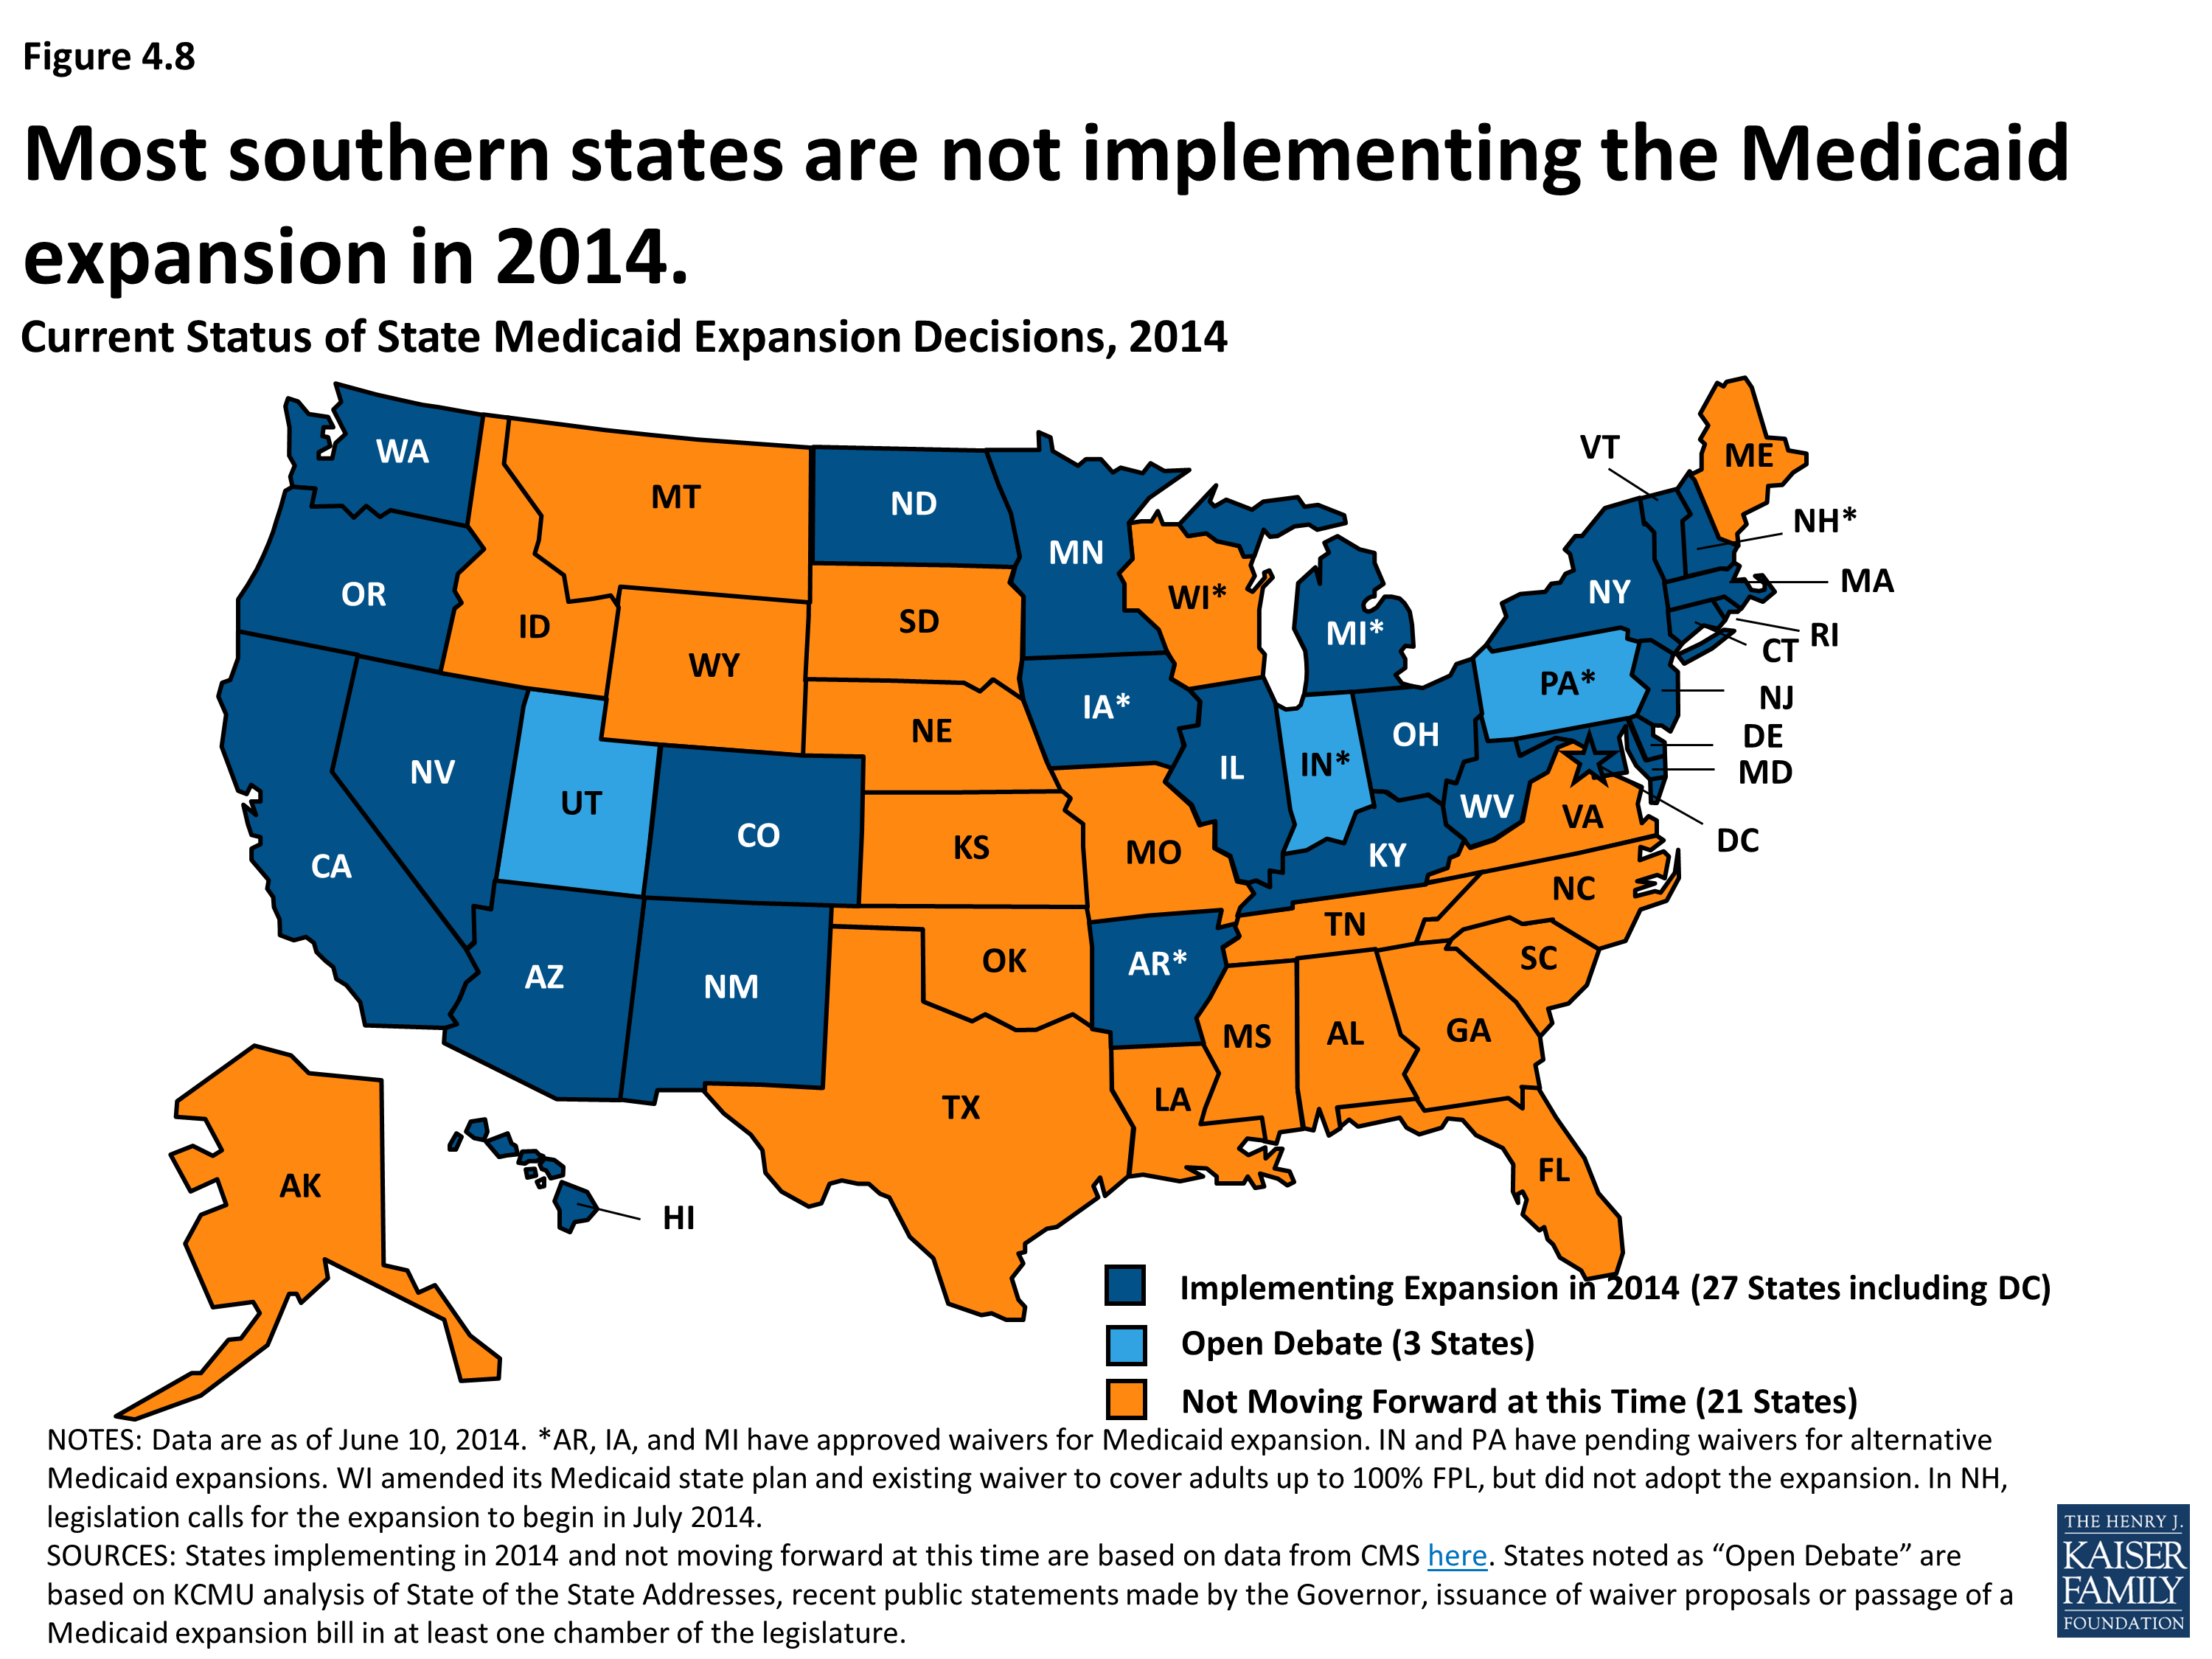
Current Status of State Medicaid Expansion Decisions, 2014
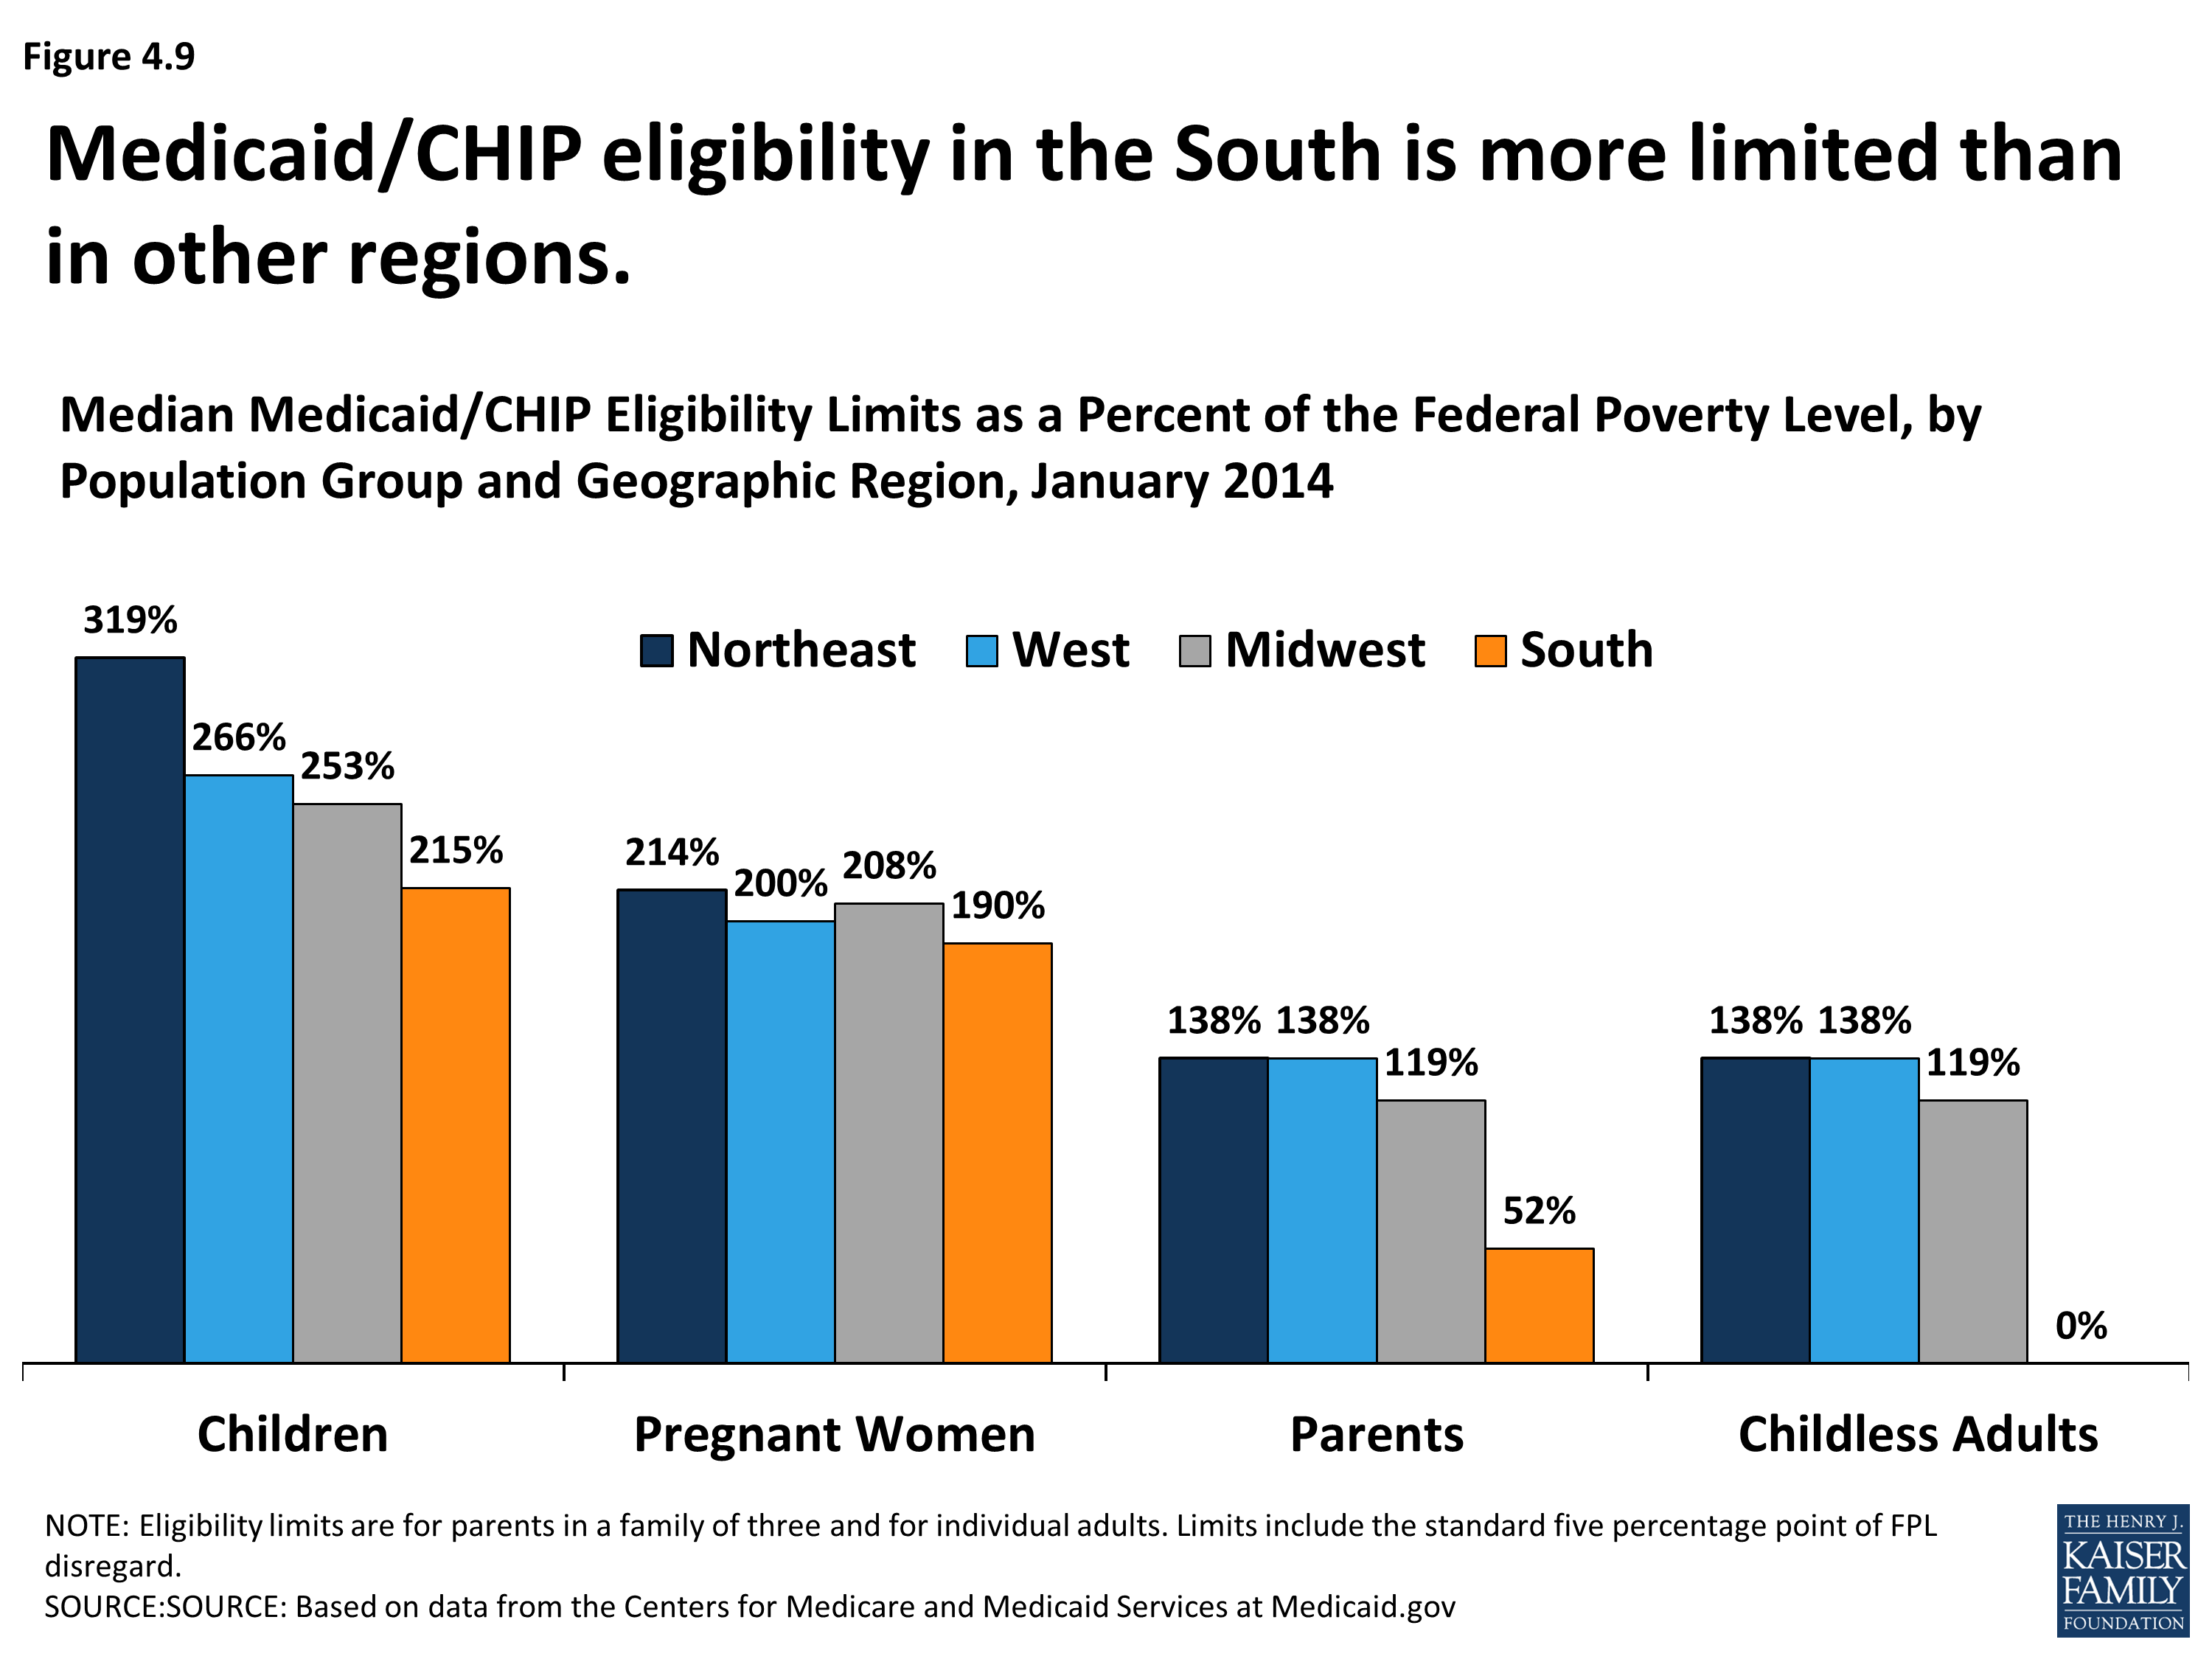
Median Medicaid/CHIP Eligibility Limits as a Percent of the Federal Poverty Level, by Population Group and Geographic Region, January 2014
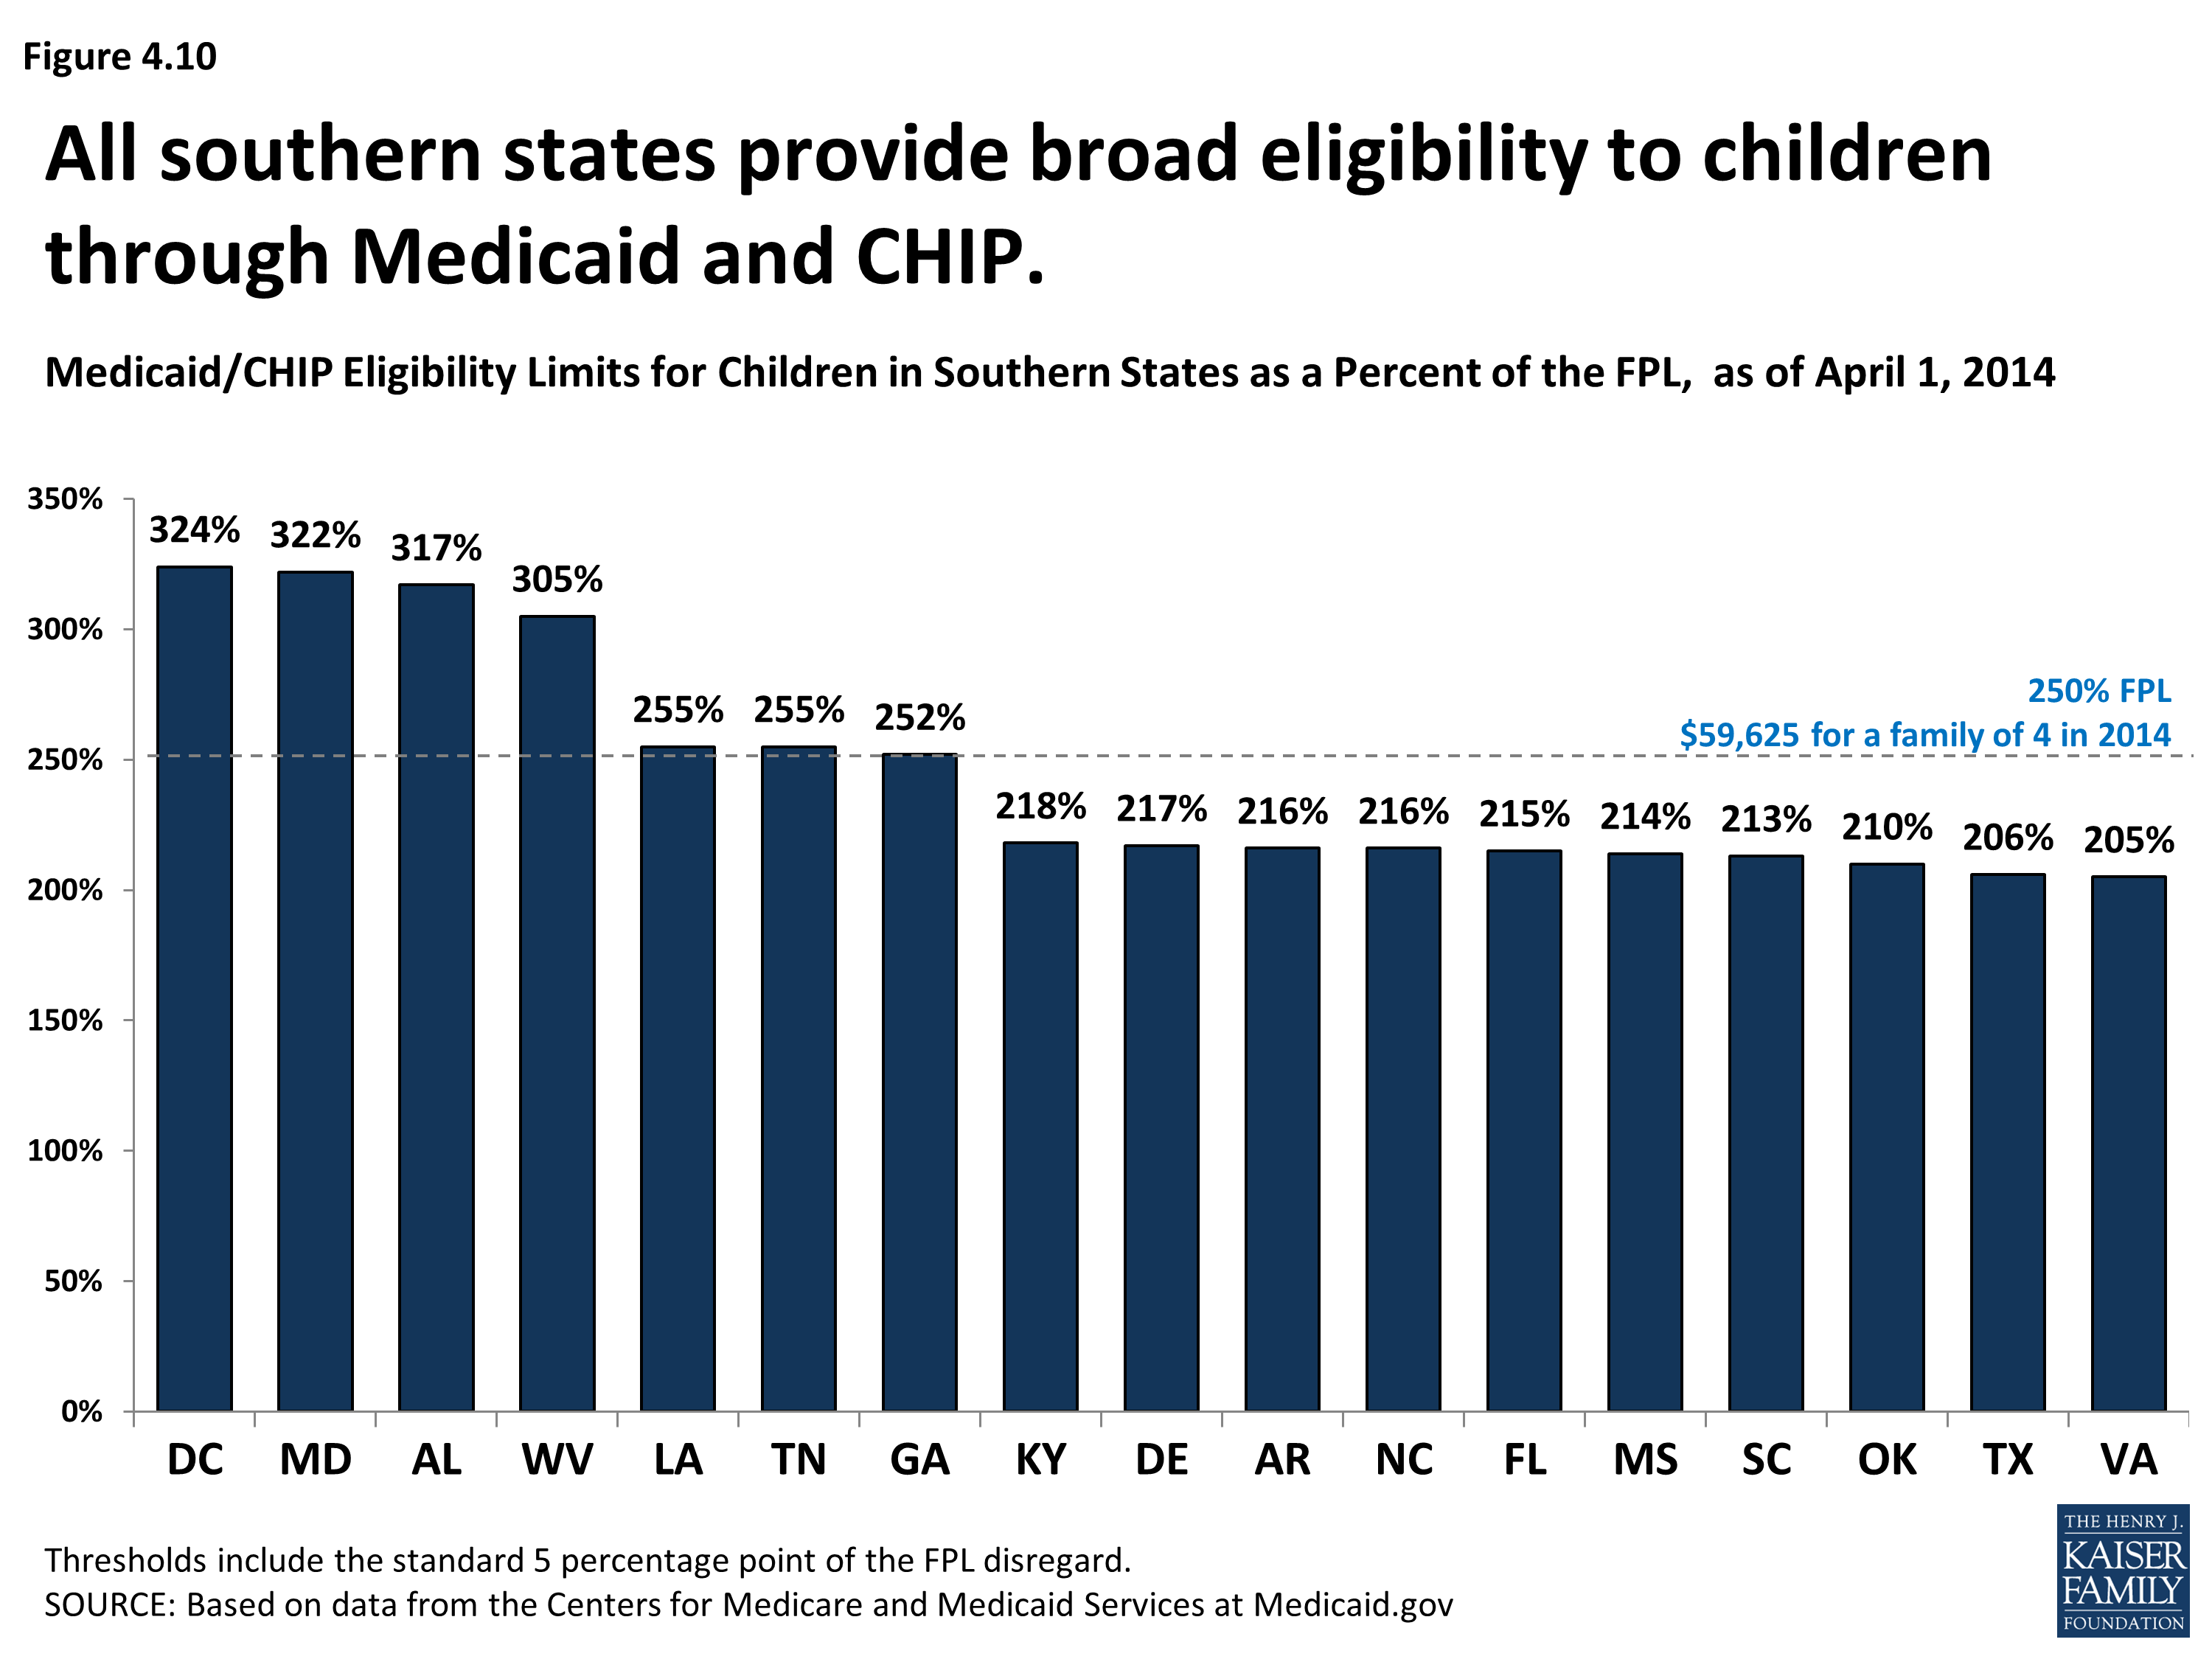
Medicaid/CHIP Eligibility Limits for Children in Southern States as a Percent of the FPL, as of April 1, 2014
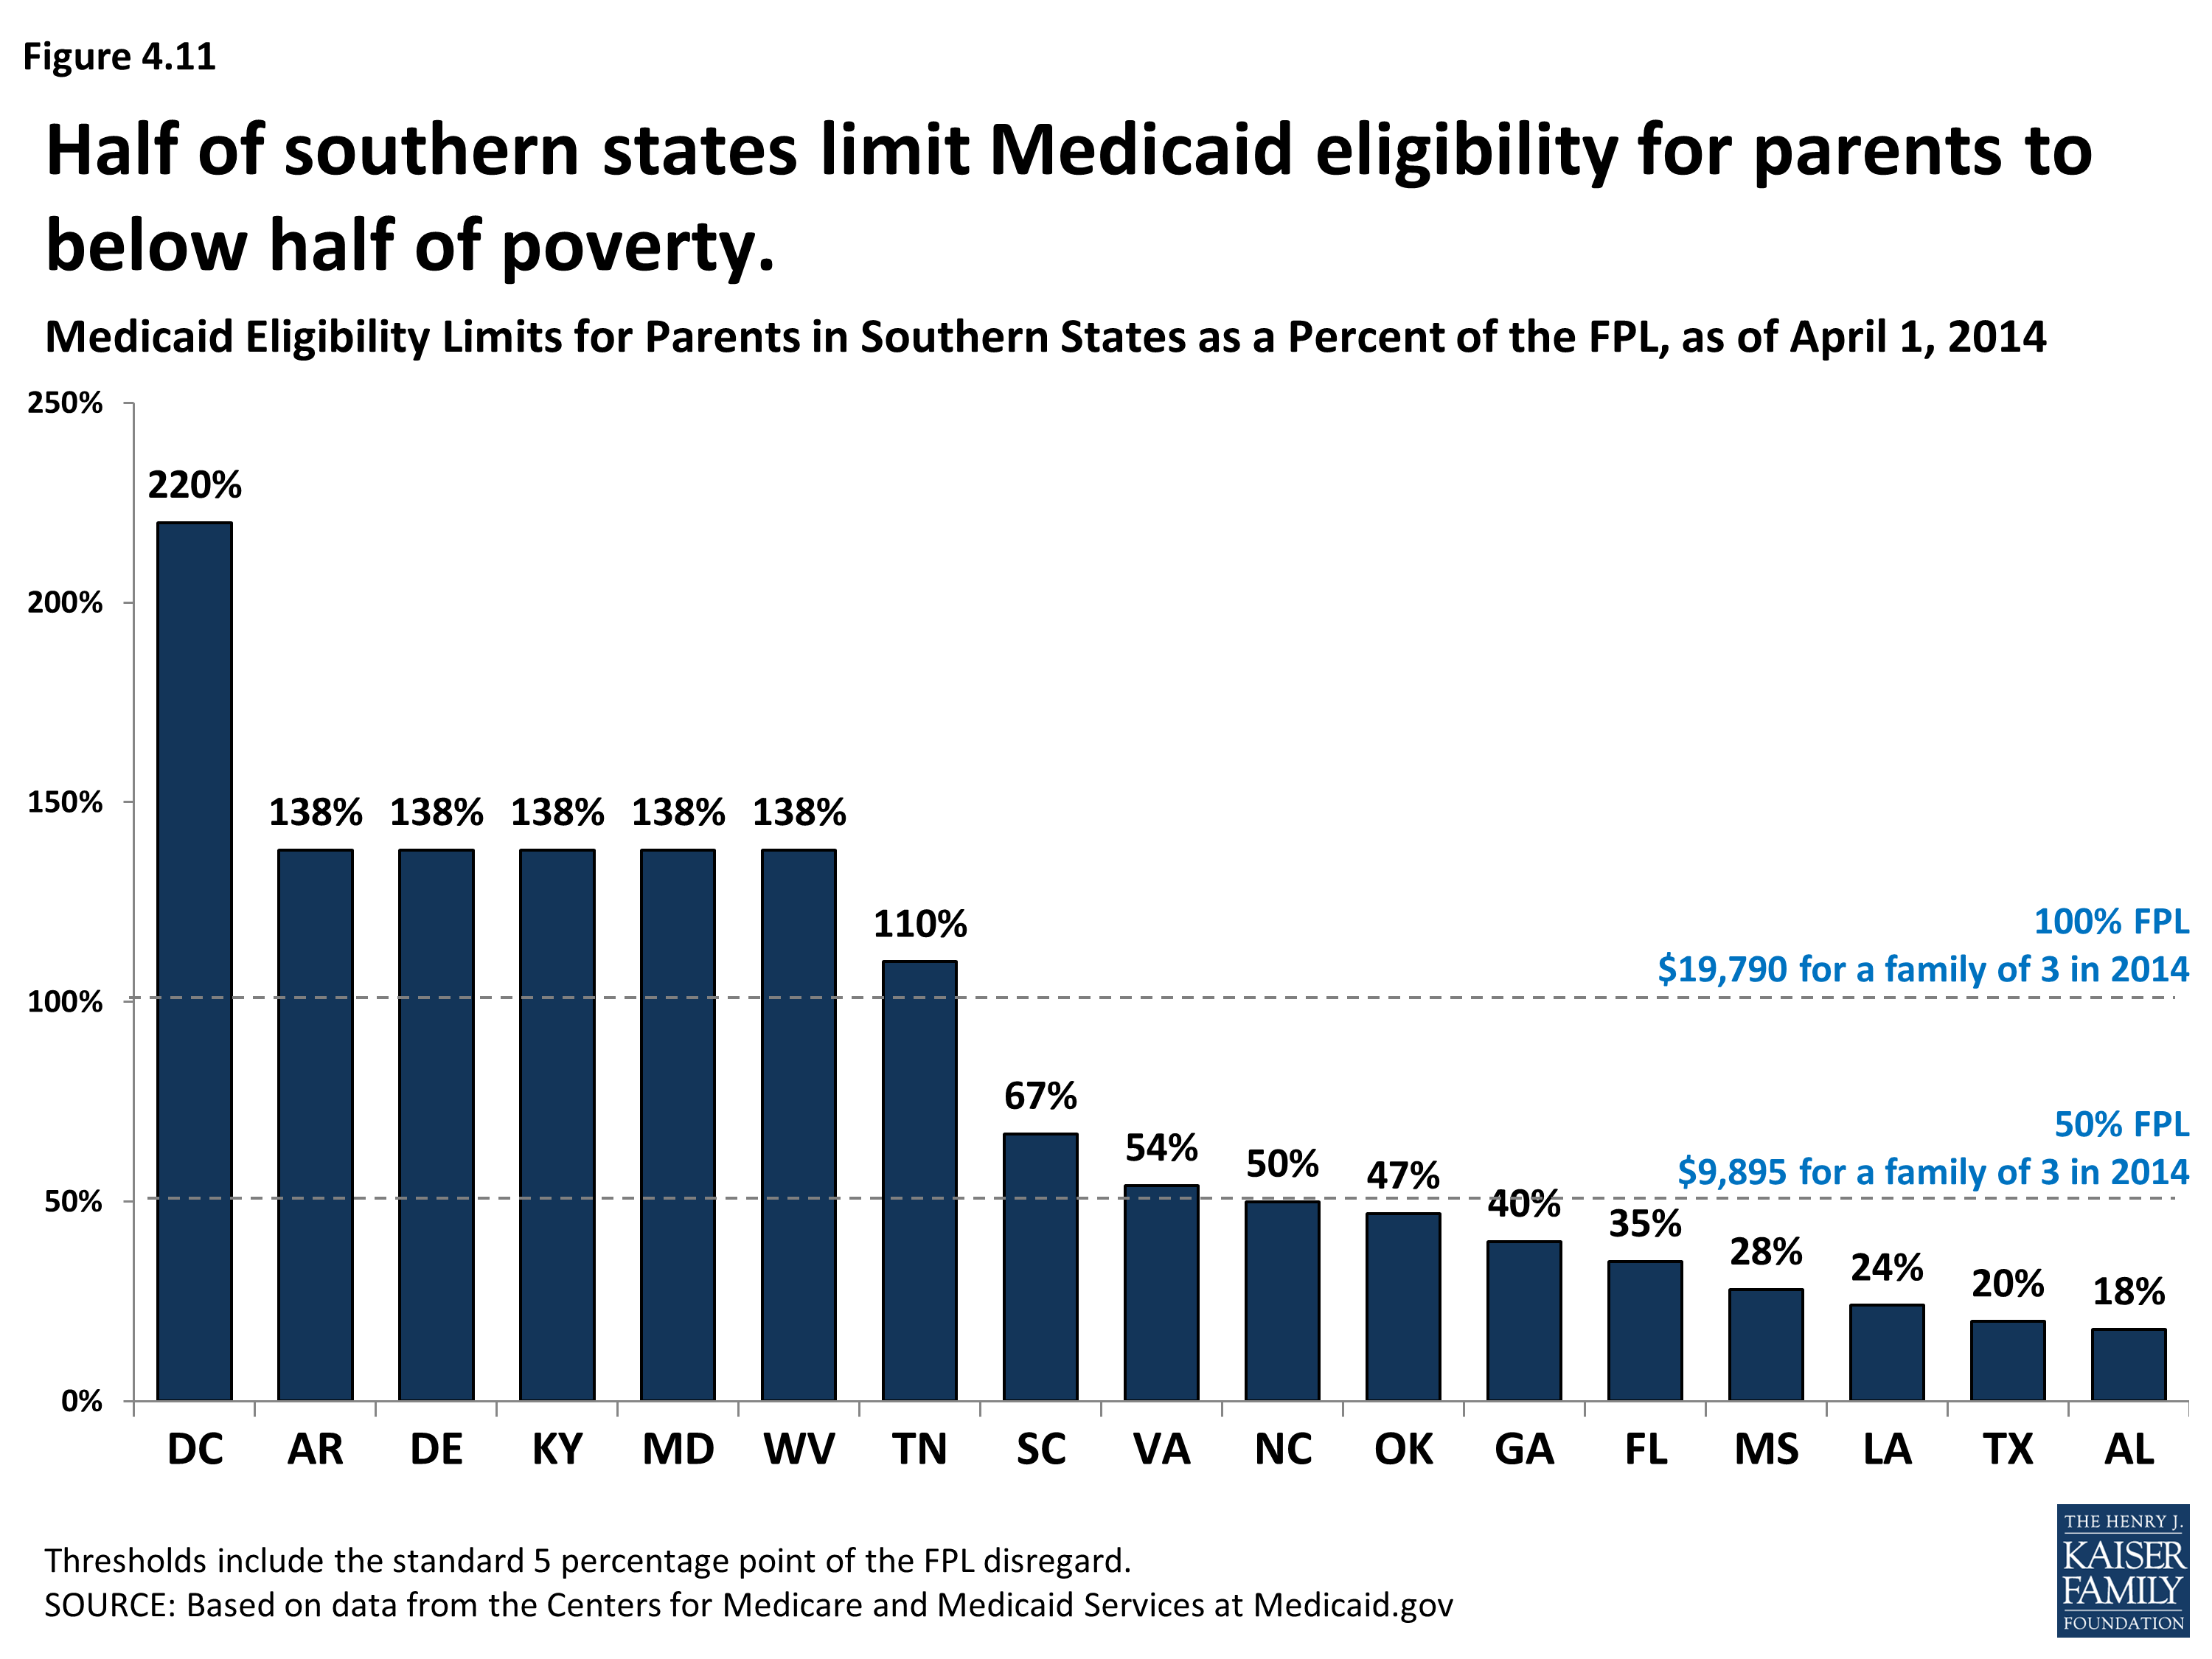
Medicaid Eligibility Limits for Parents in Southern States as a Percent of the FPL, as of April 1, 2014
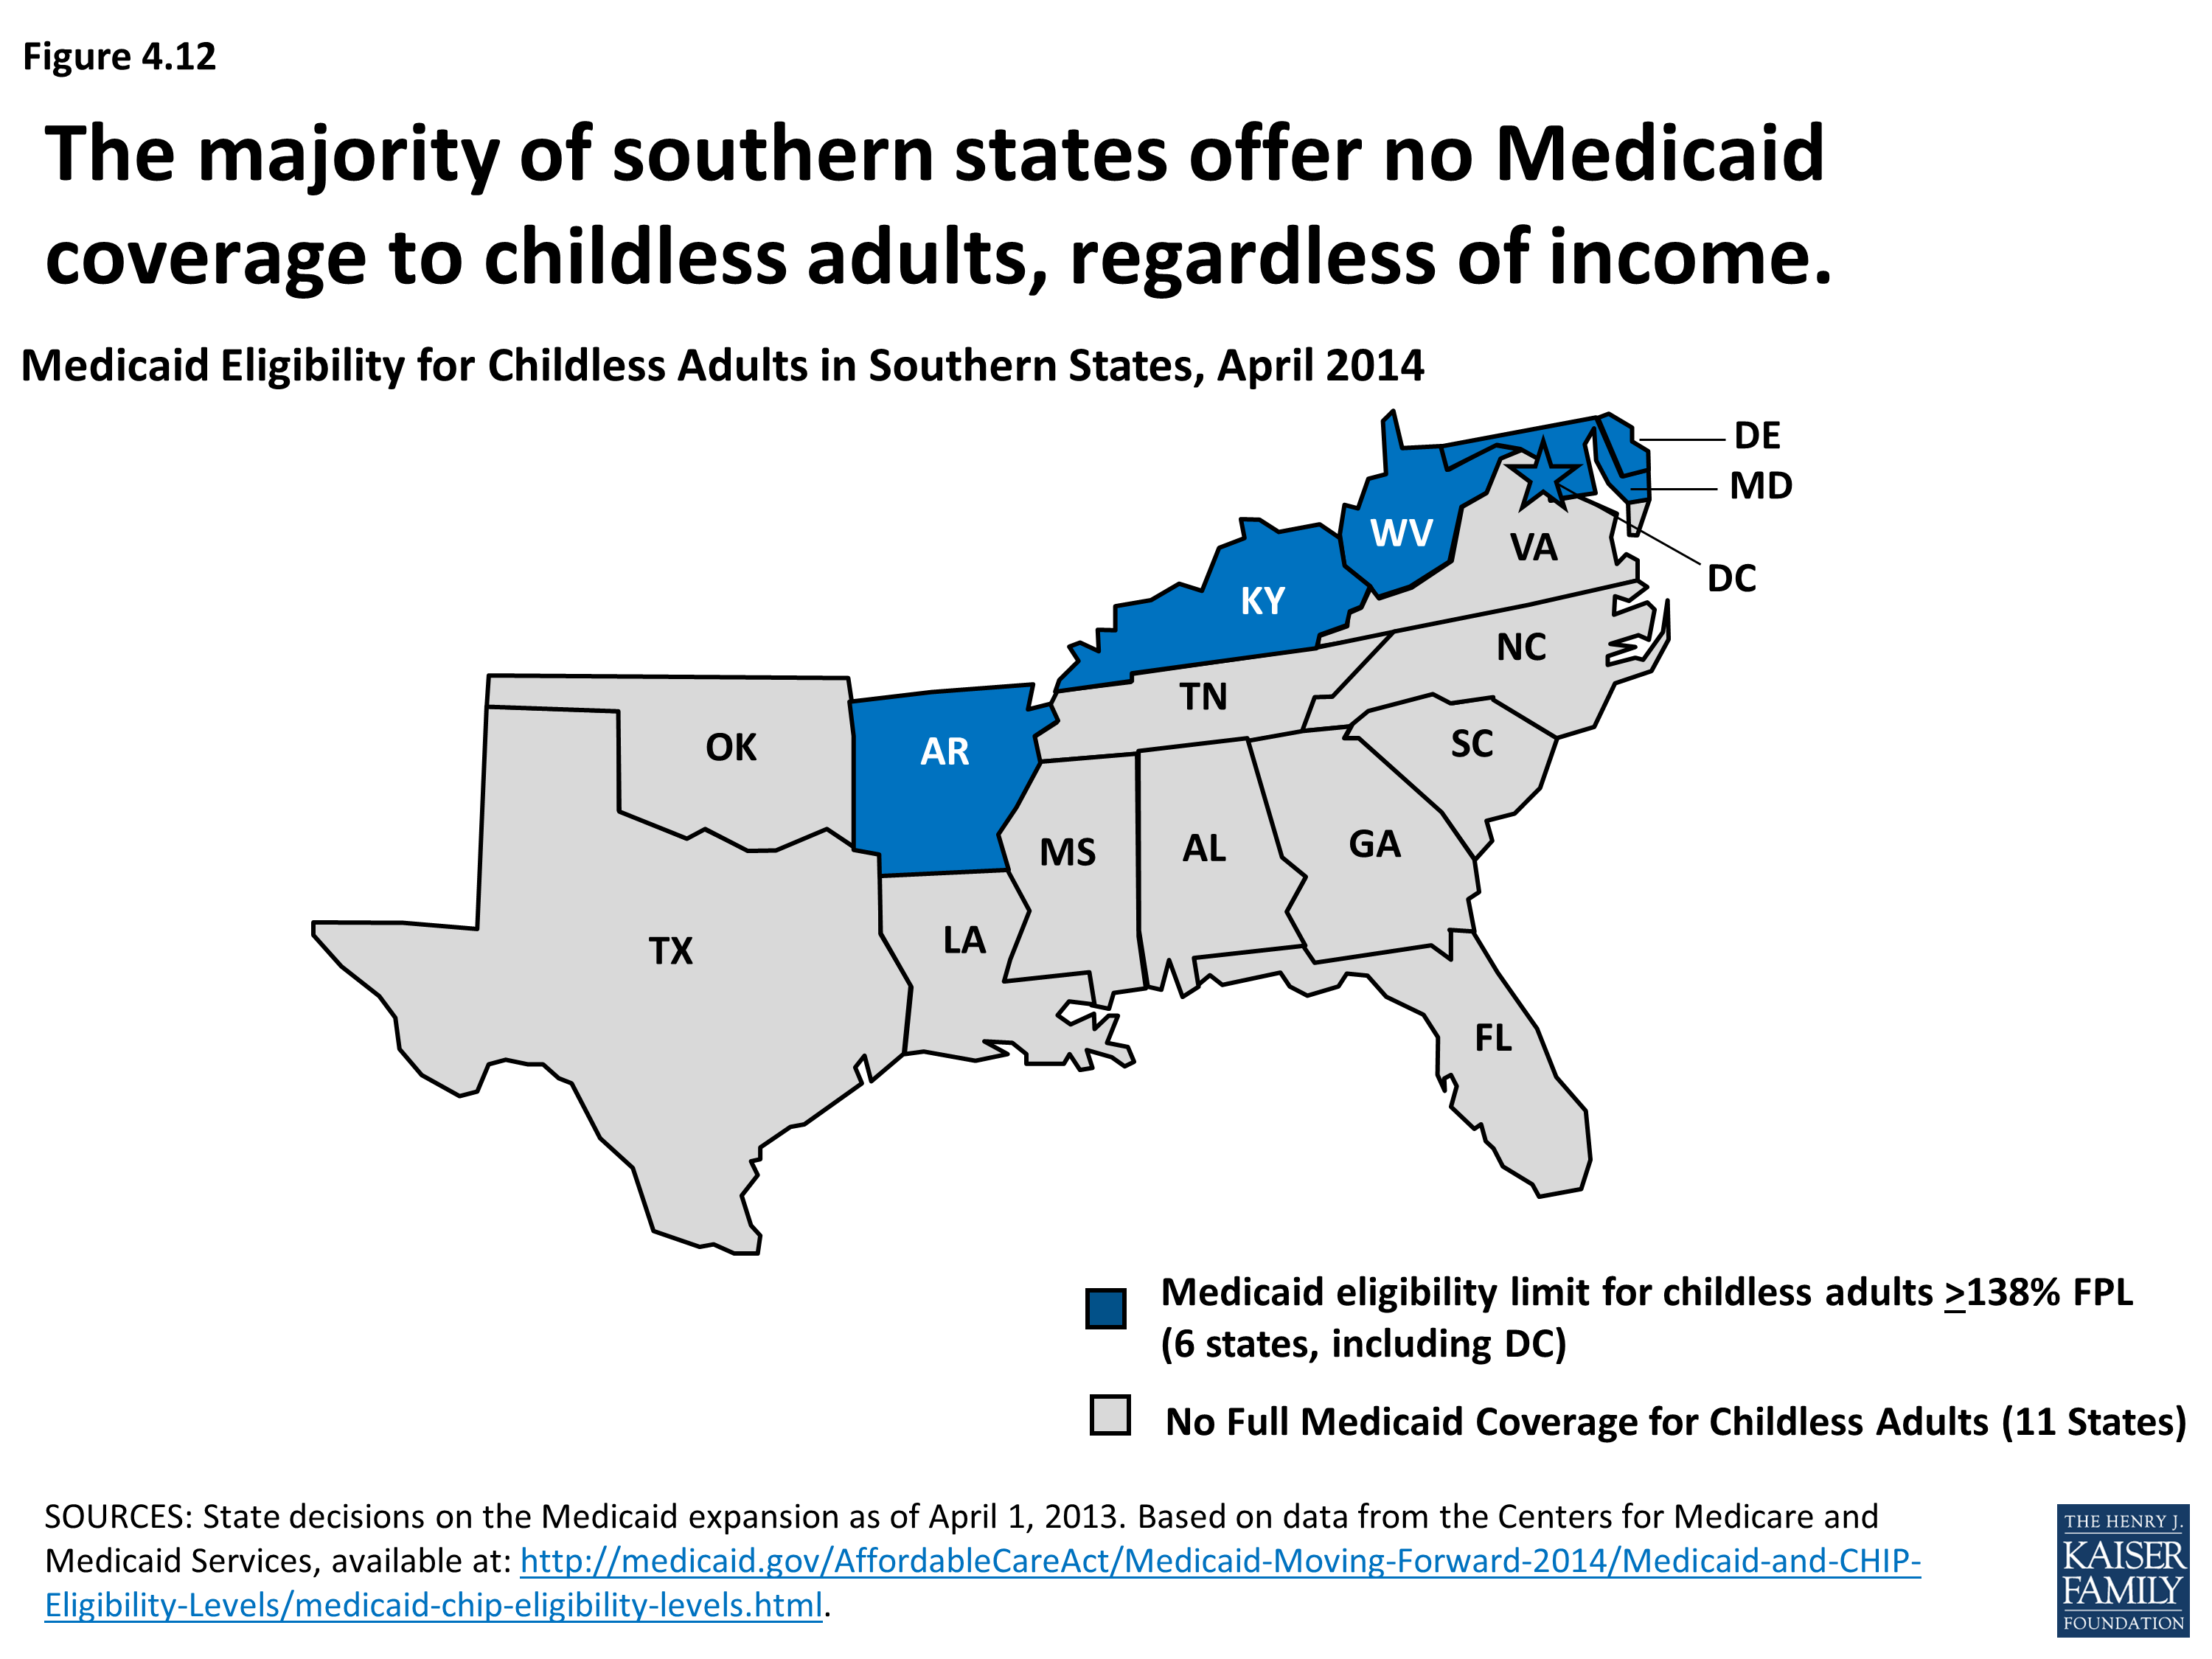
Medicaid Eligibility for Childless Adults in Southern States, April 2014
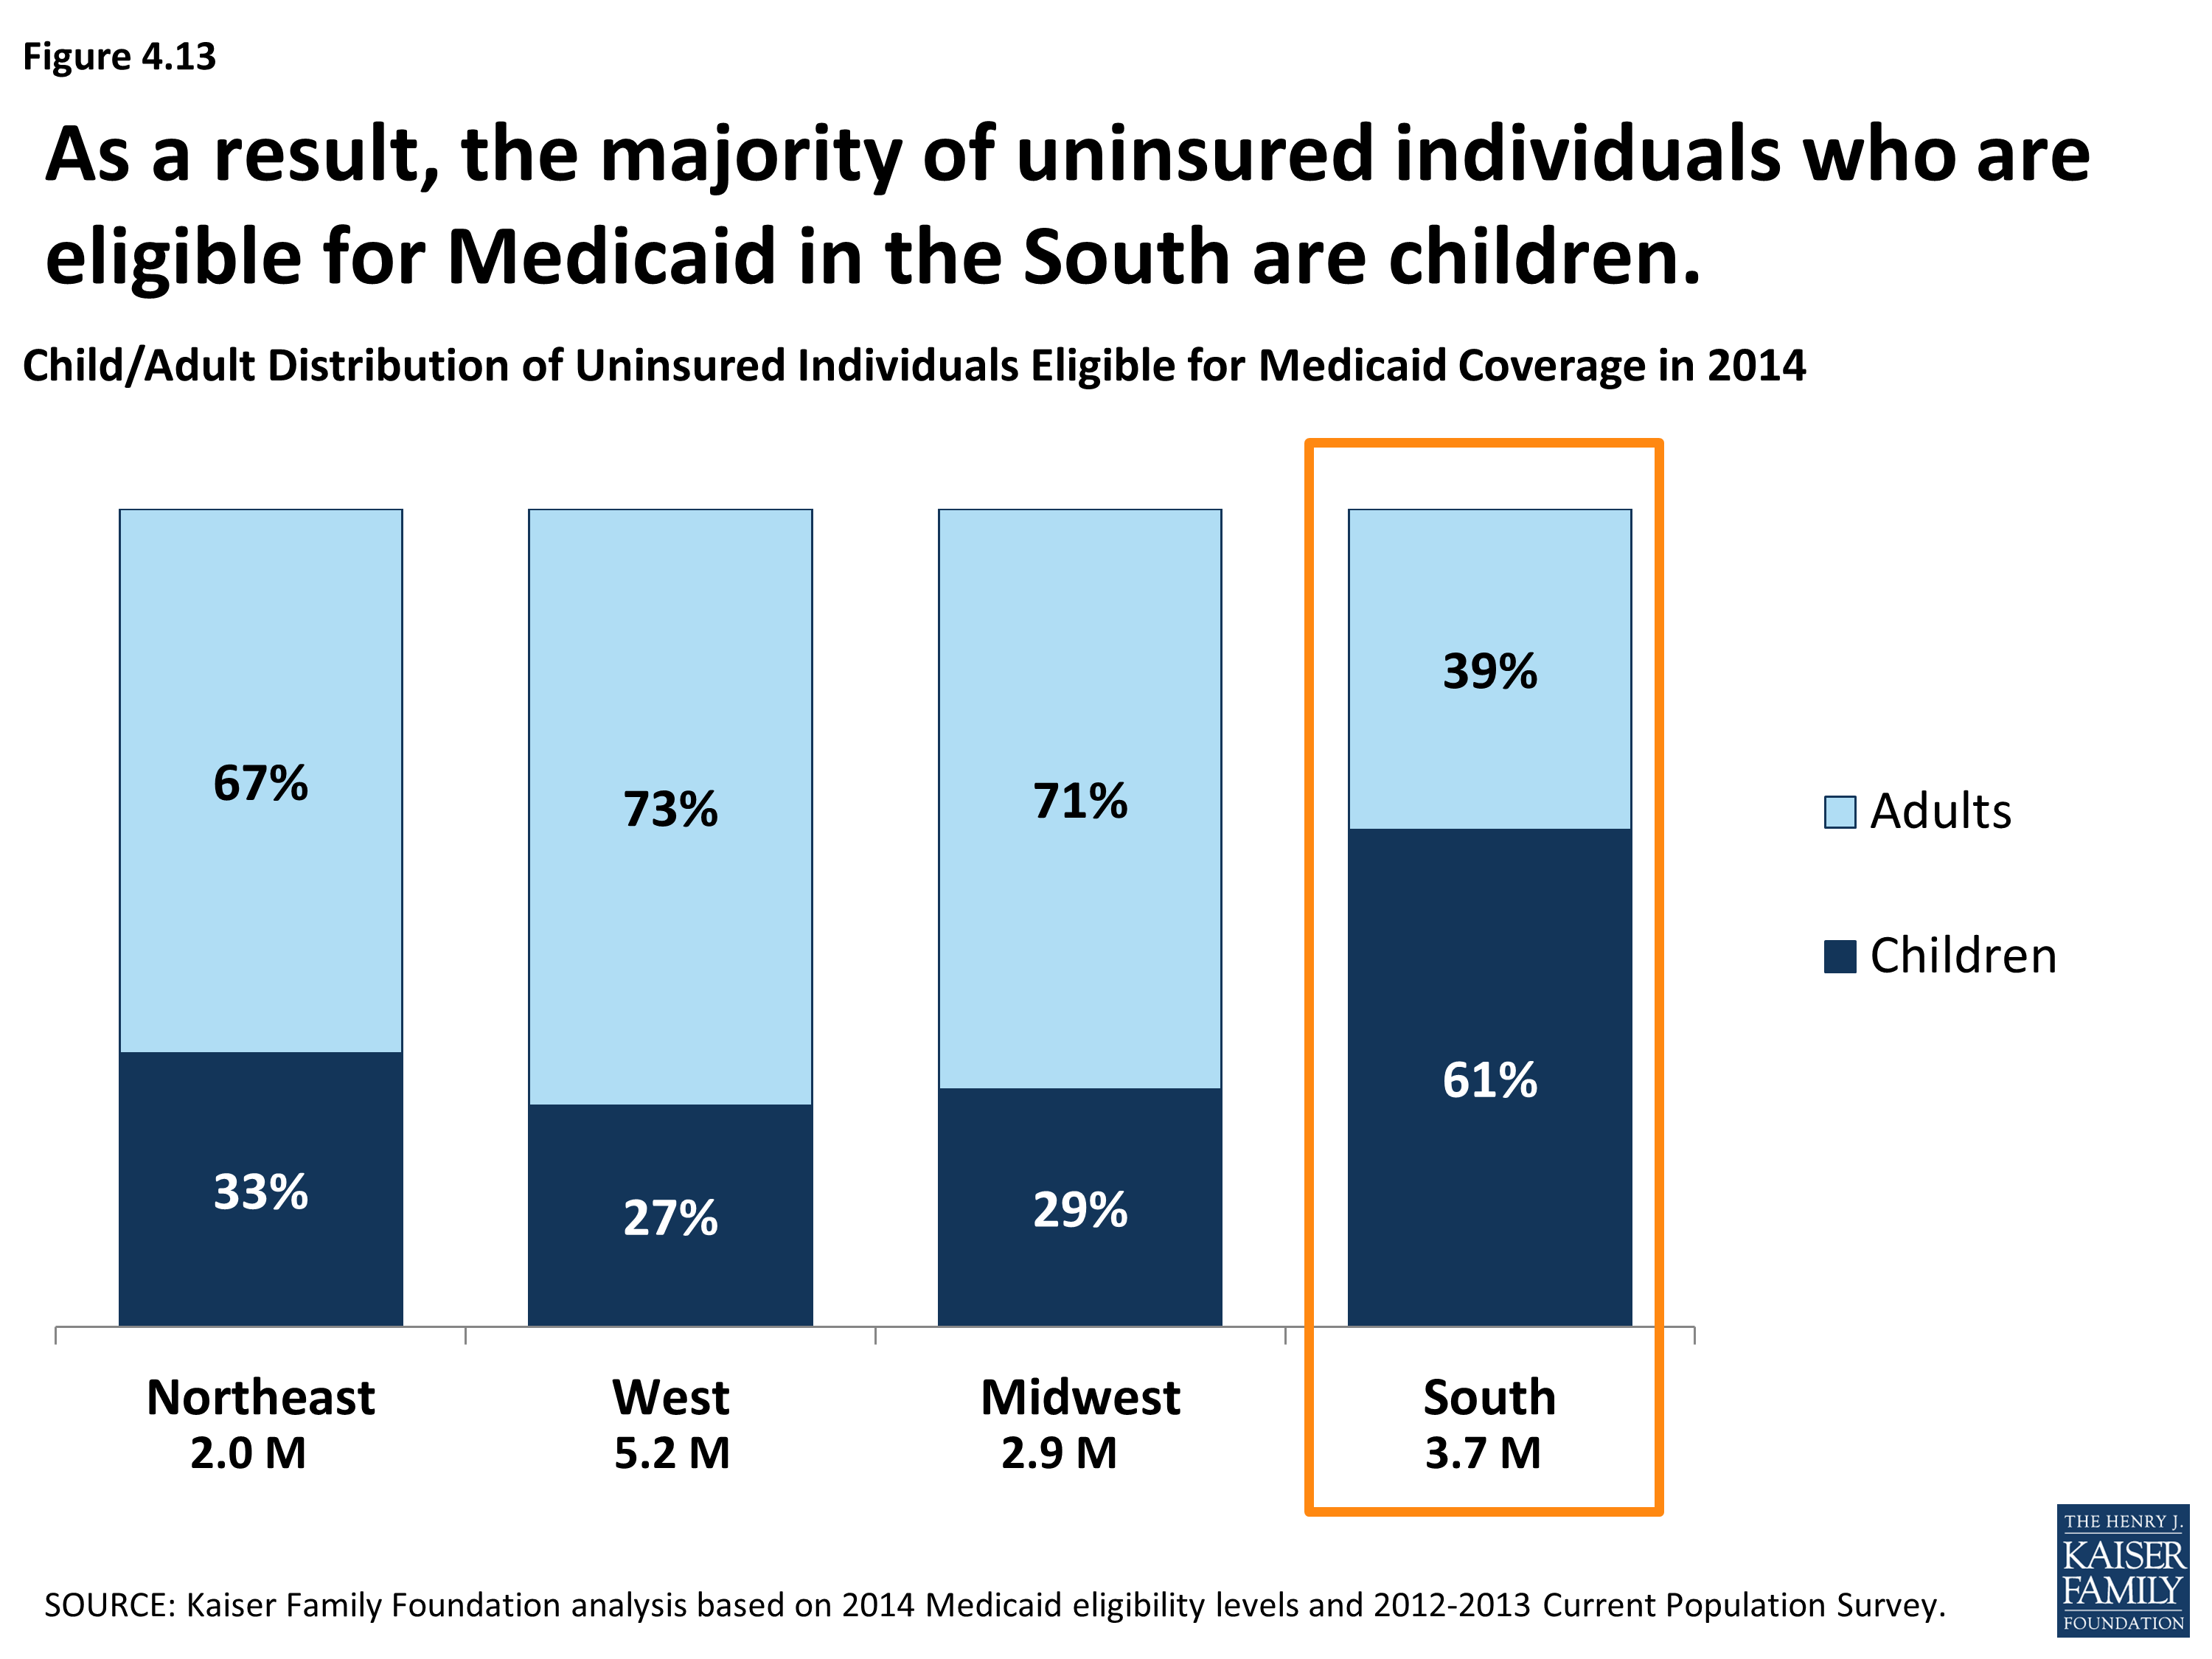
Child/Adult Distribution of Uninsured Individuals Eligible for Medicaid Coverage in 2014
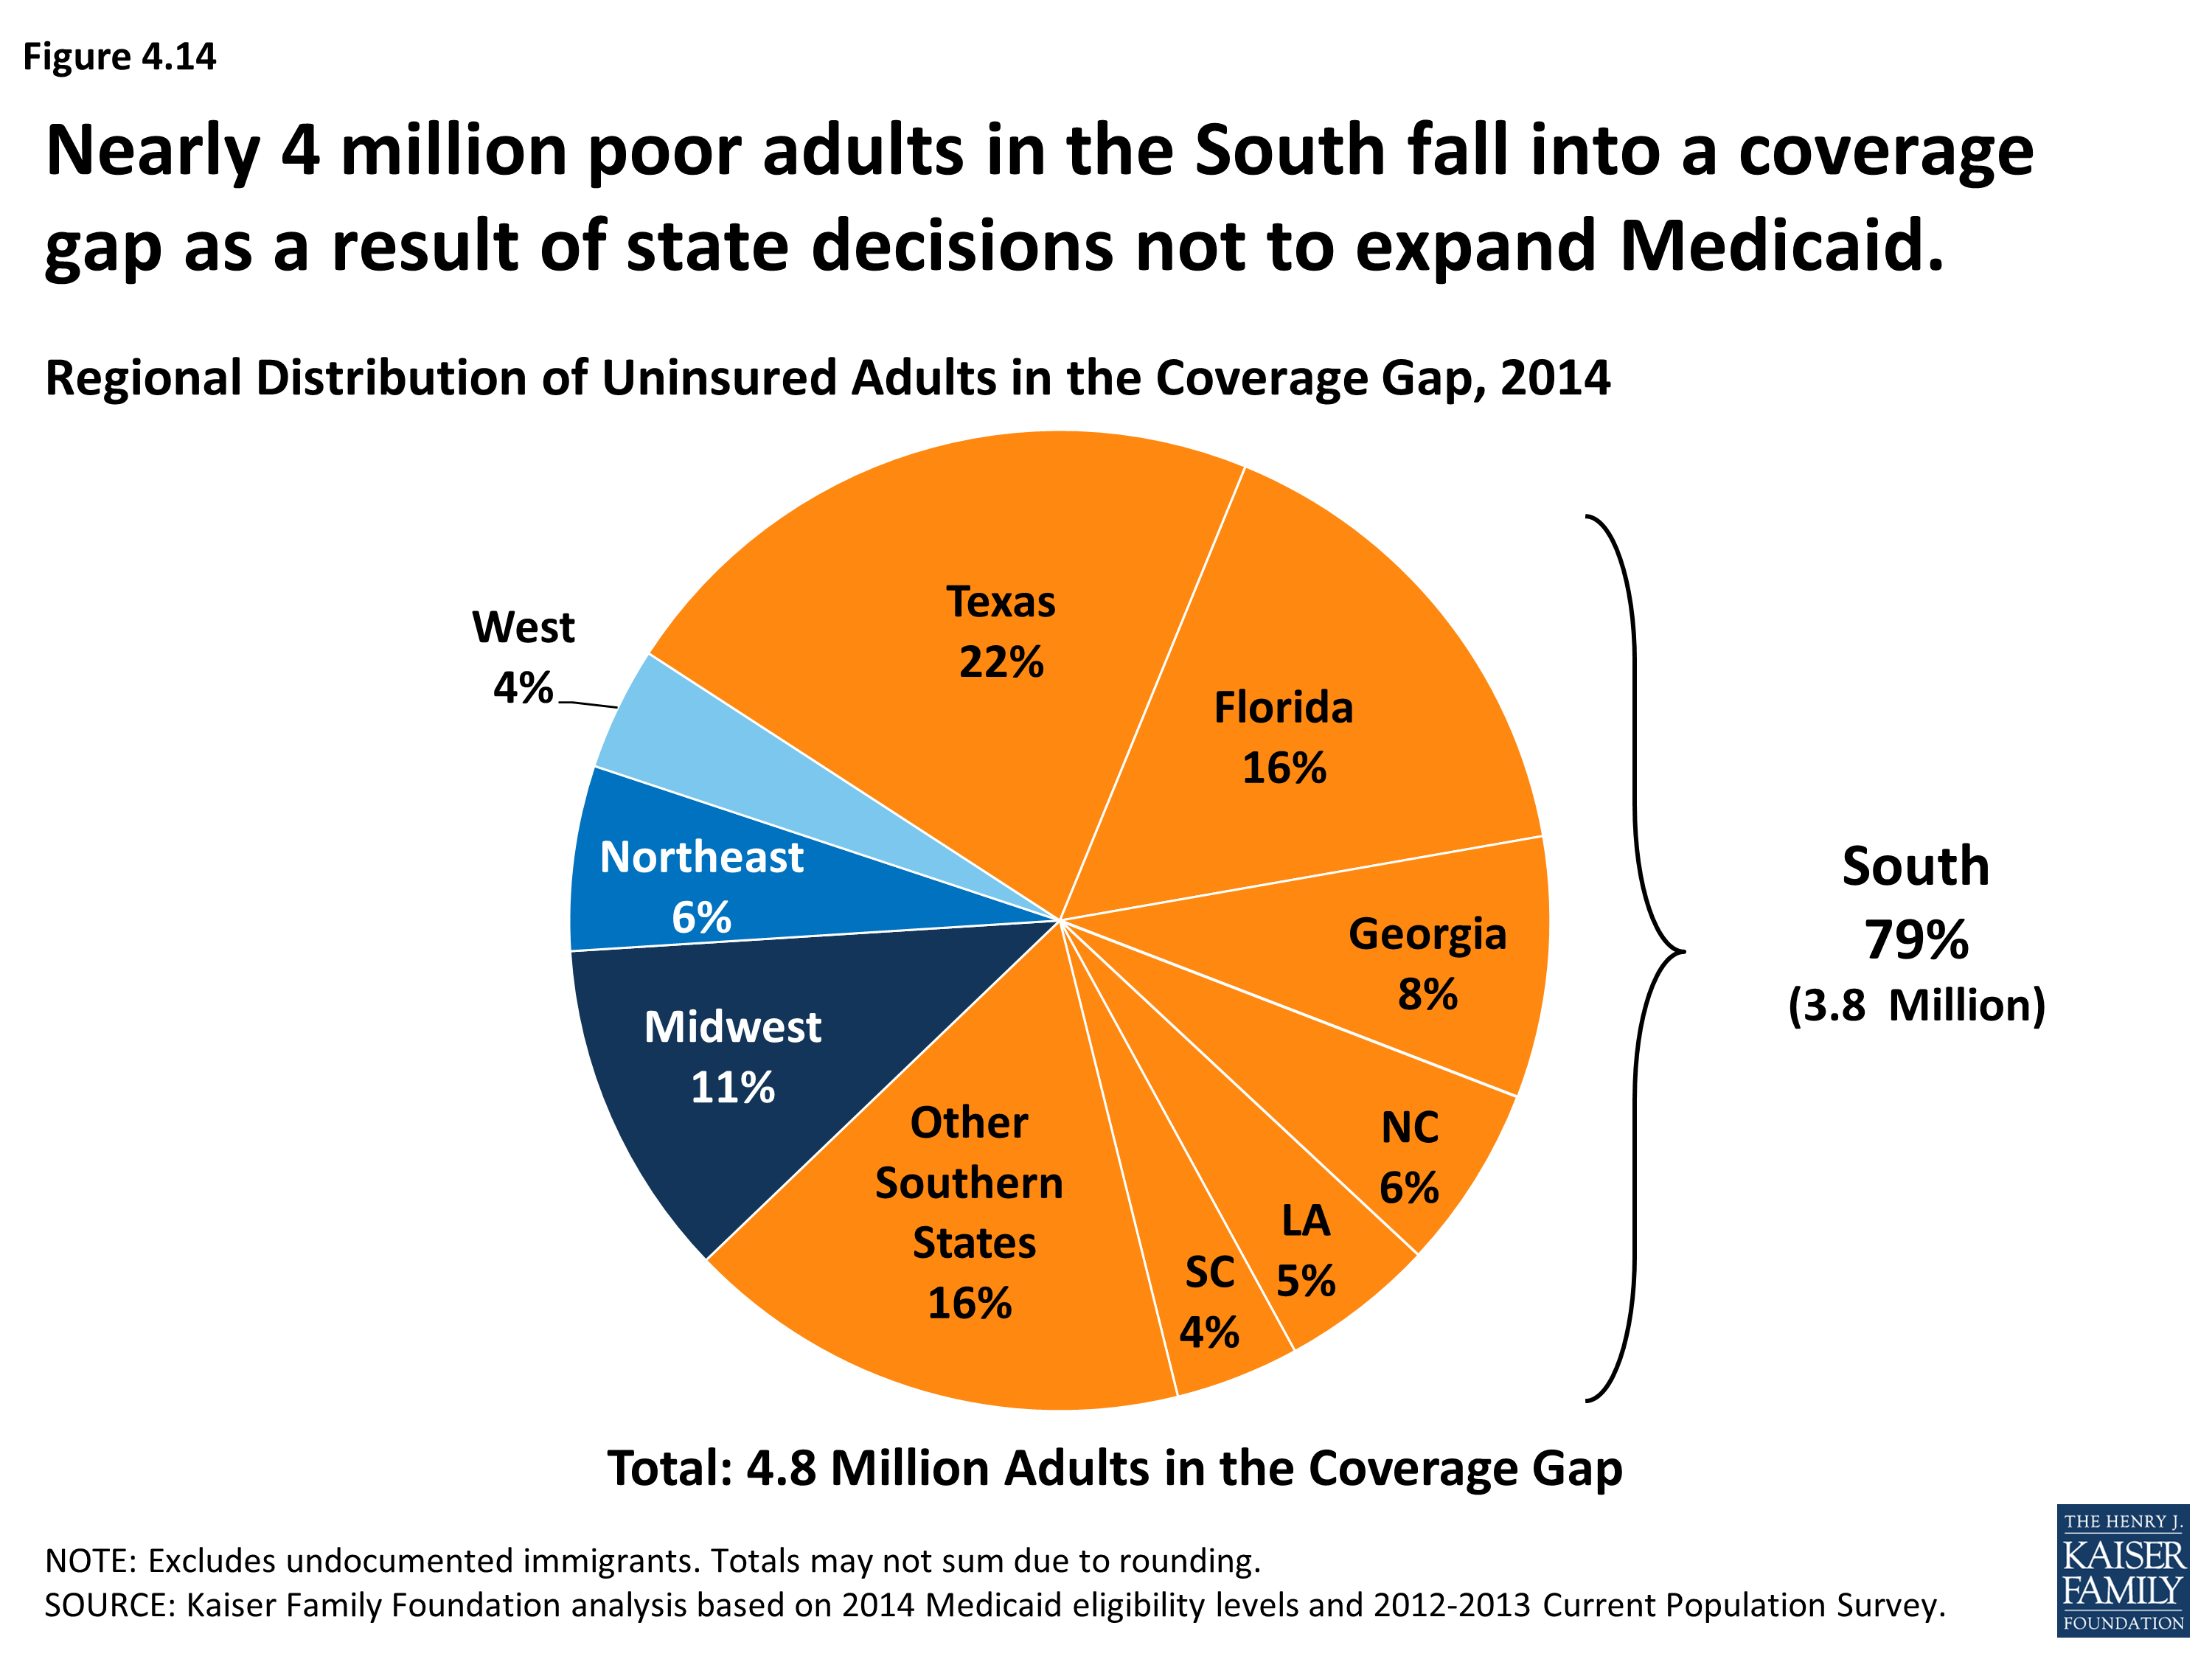
Regional Distribution of Uninsured Adults in the Coverage Gap, 2014
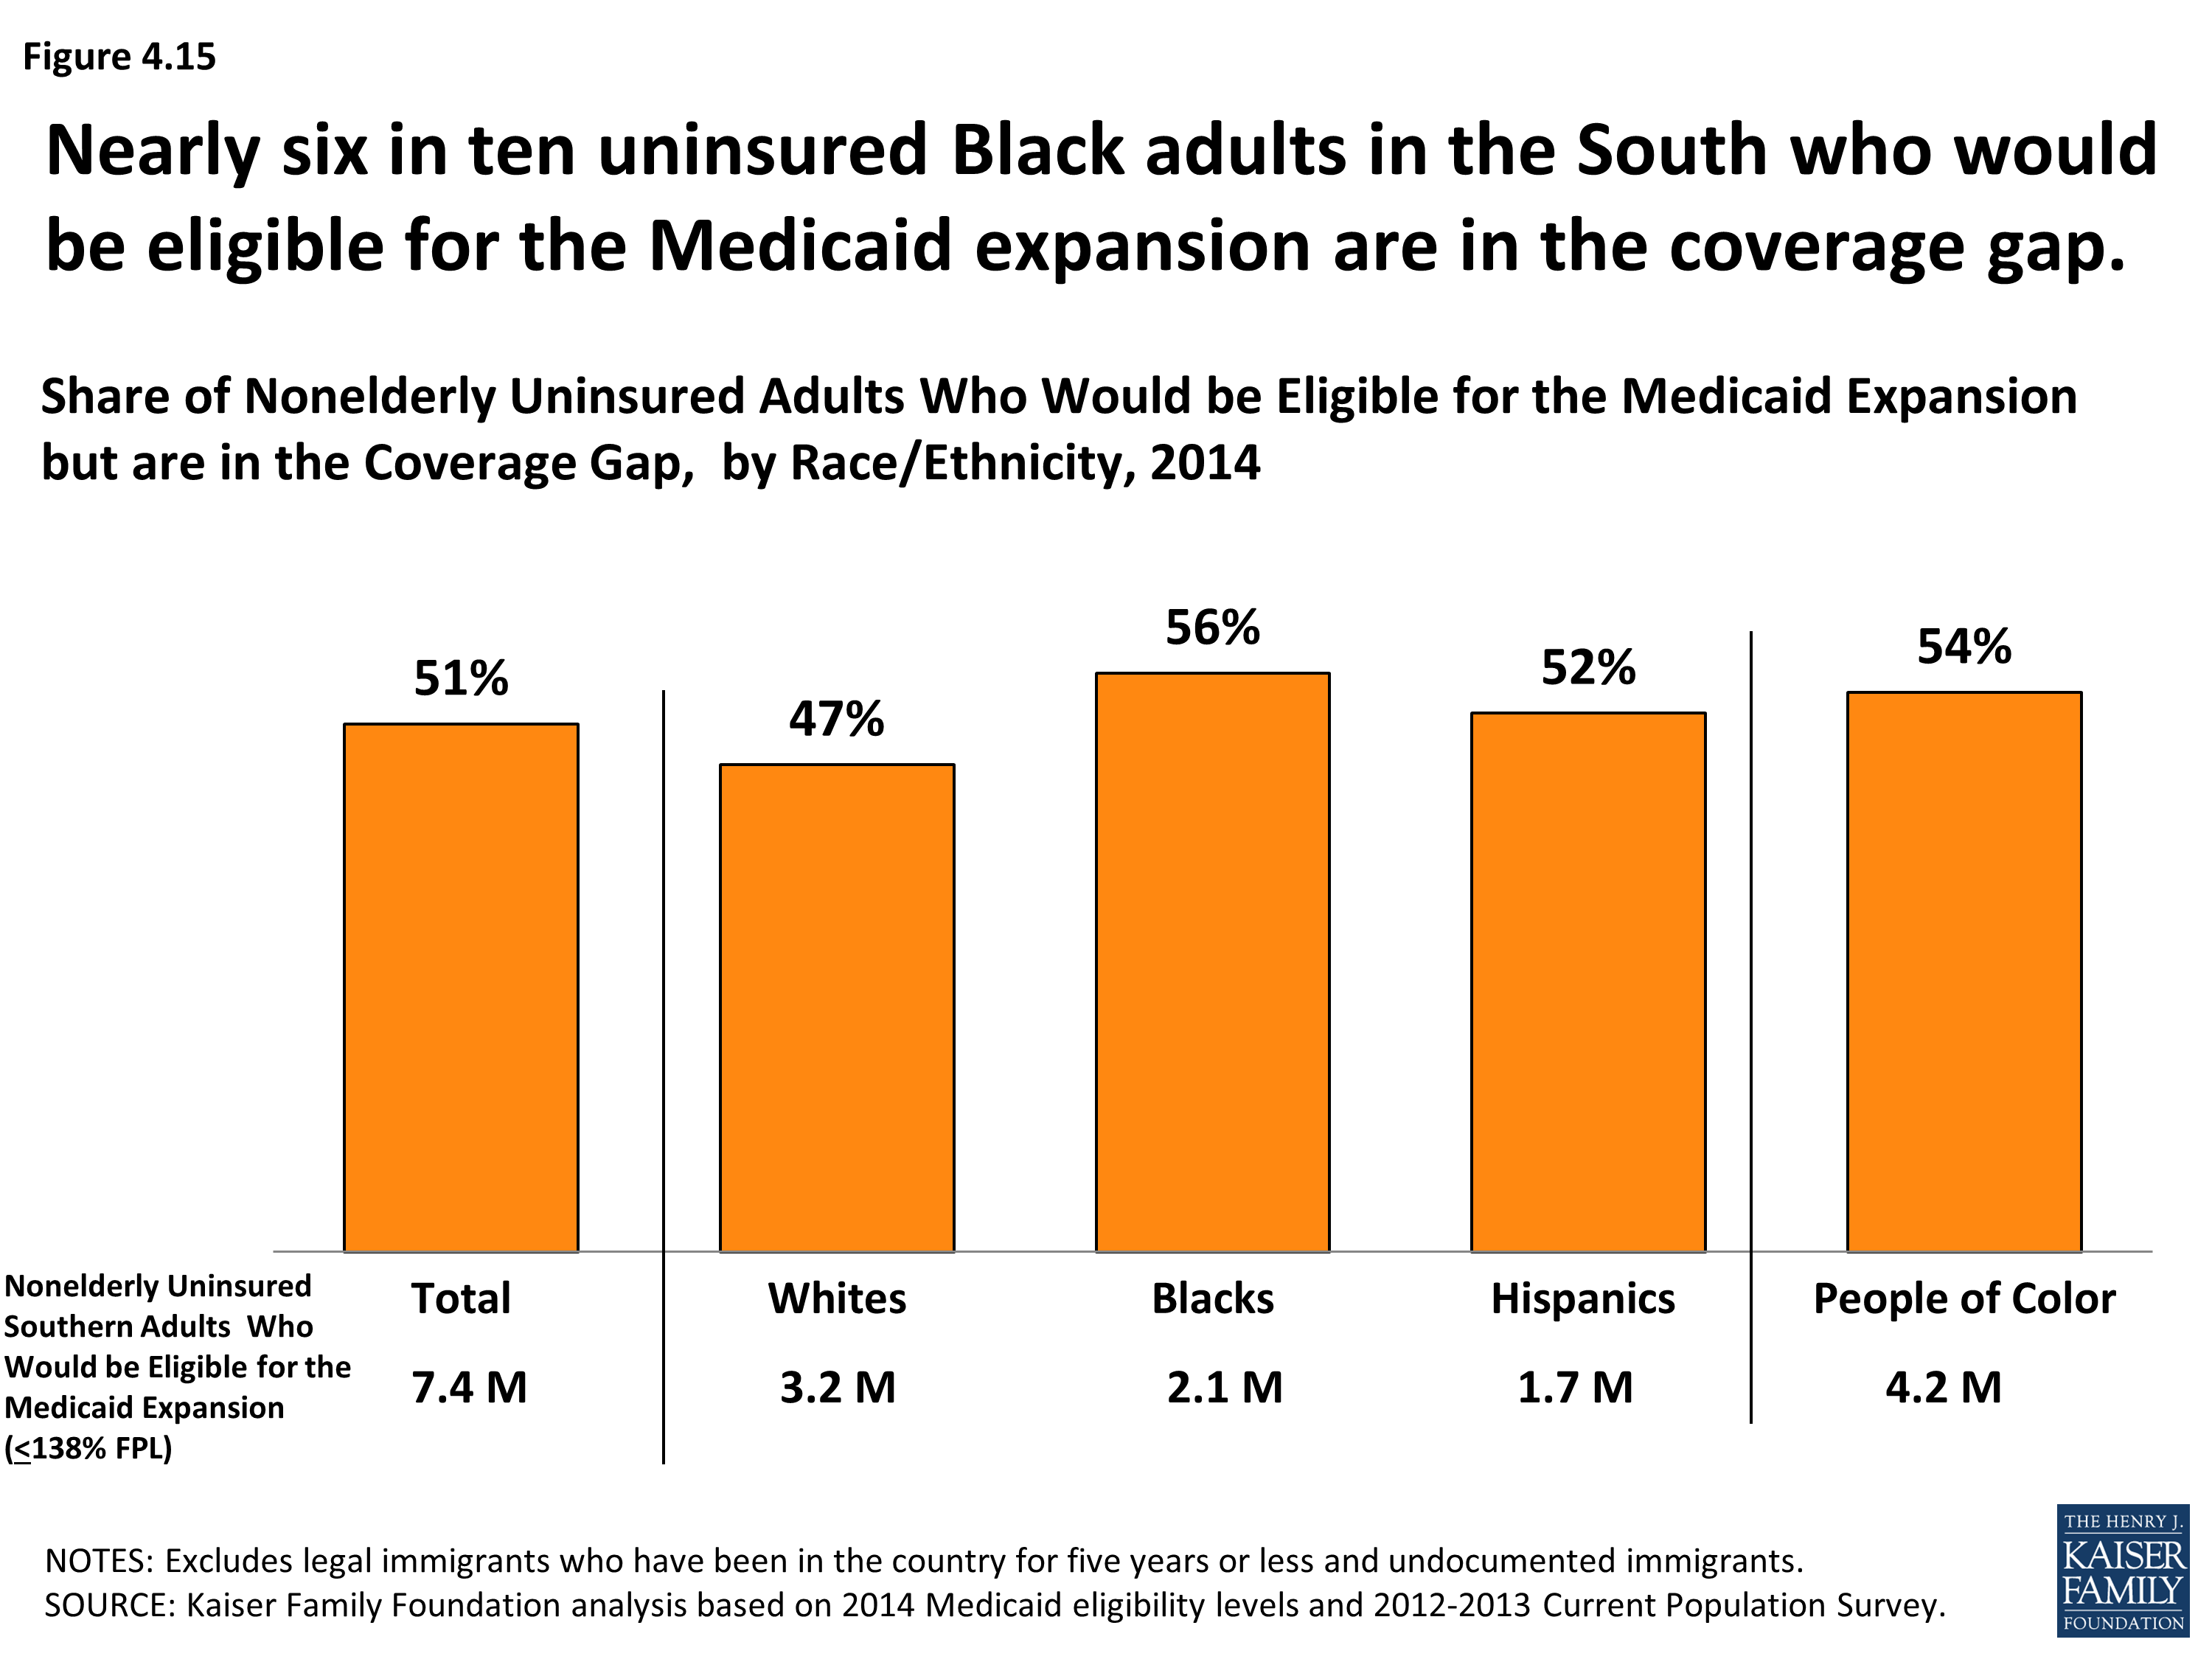
Share of Nonelderly Uninsured Adults Who Would be Eligible for the Medicaid Expansion but are in the Coverage Gap, by Race/Ethnicity, 2014
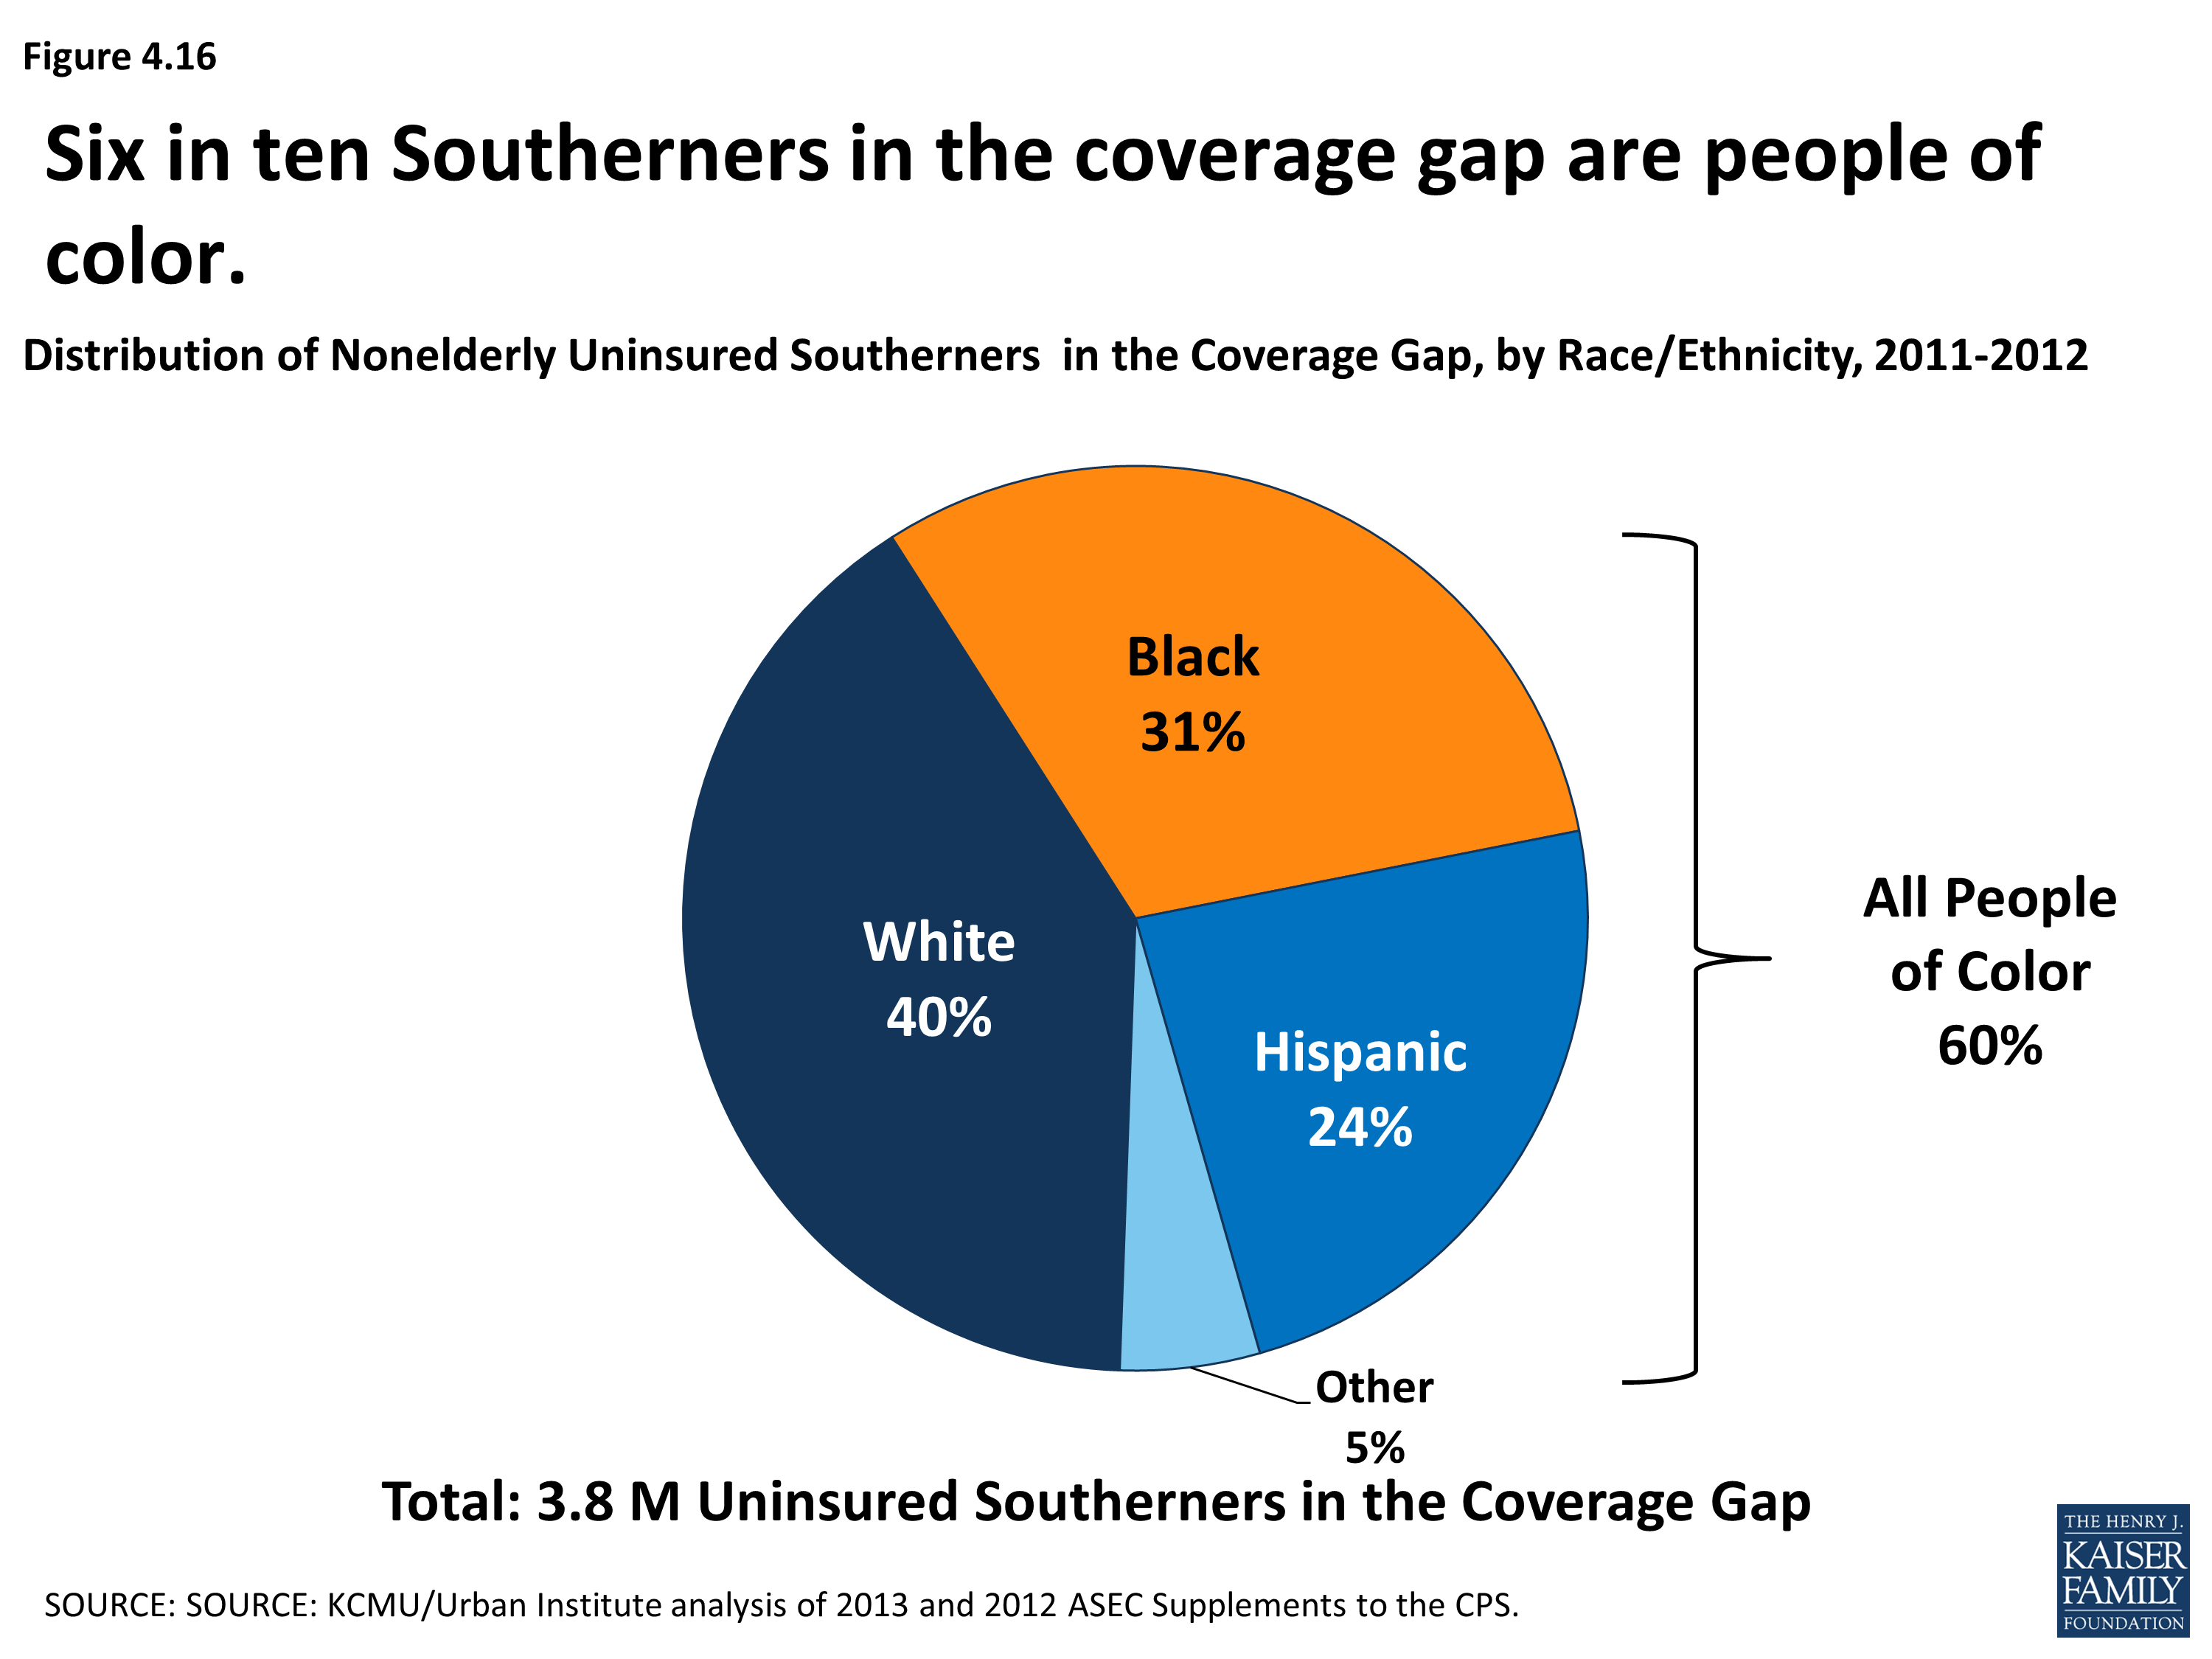
Distribution of Nonelderly Southerners in the Coverage Gap, by Race/Ethnicity, 2011-2012
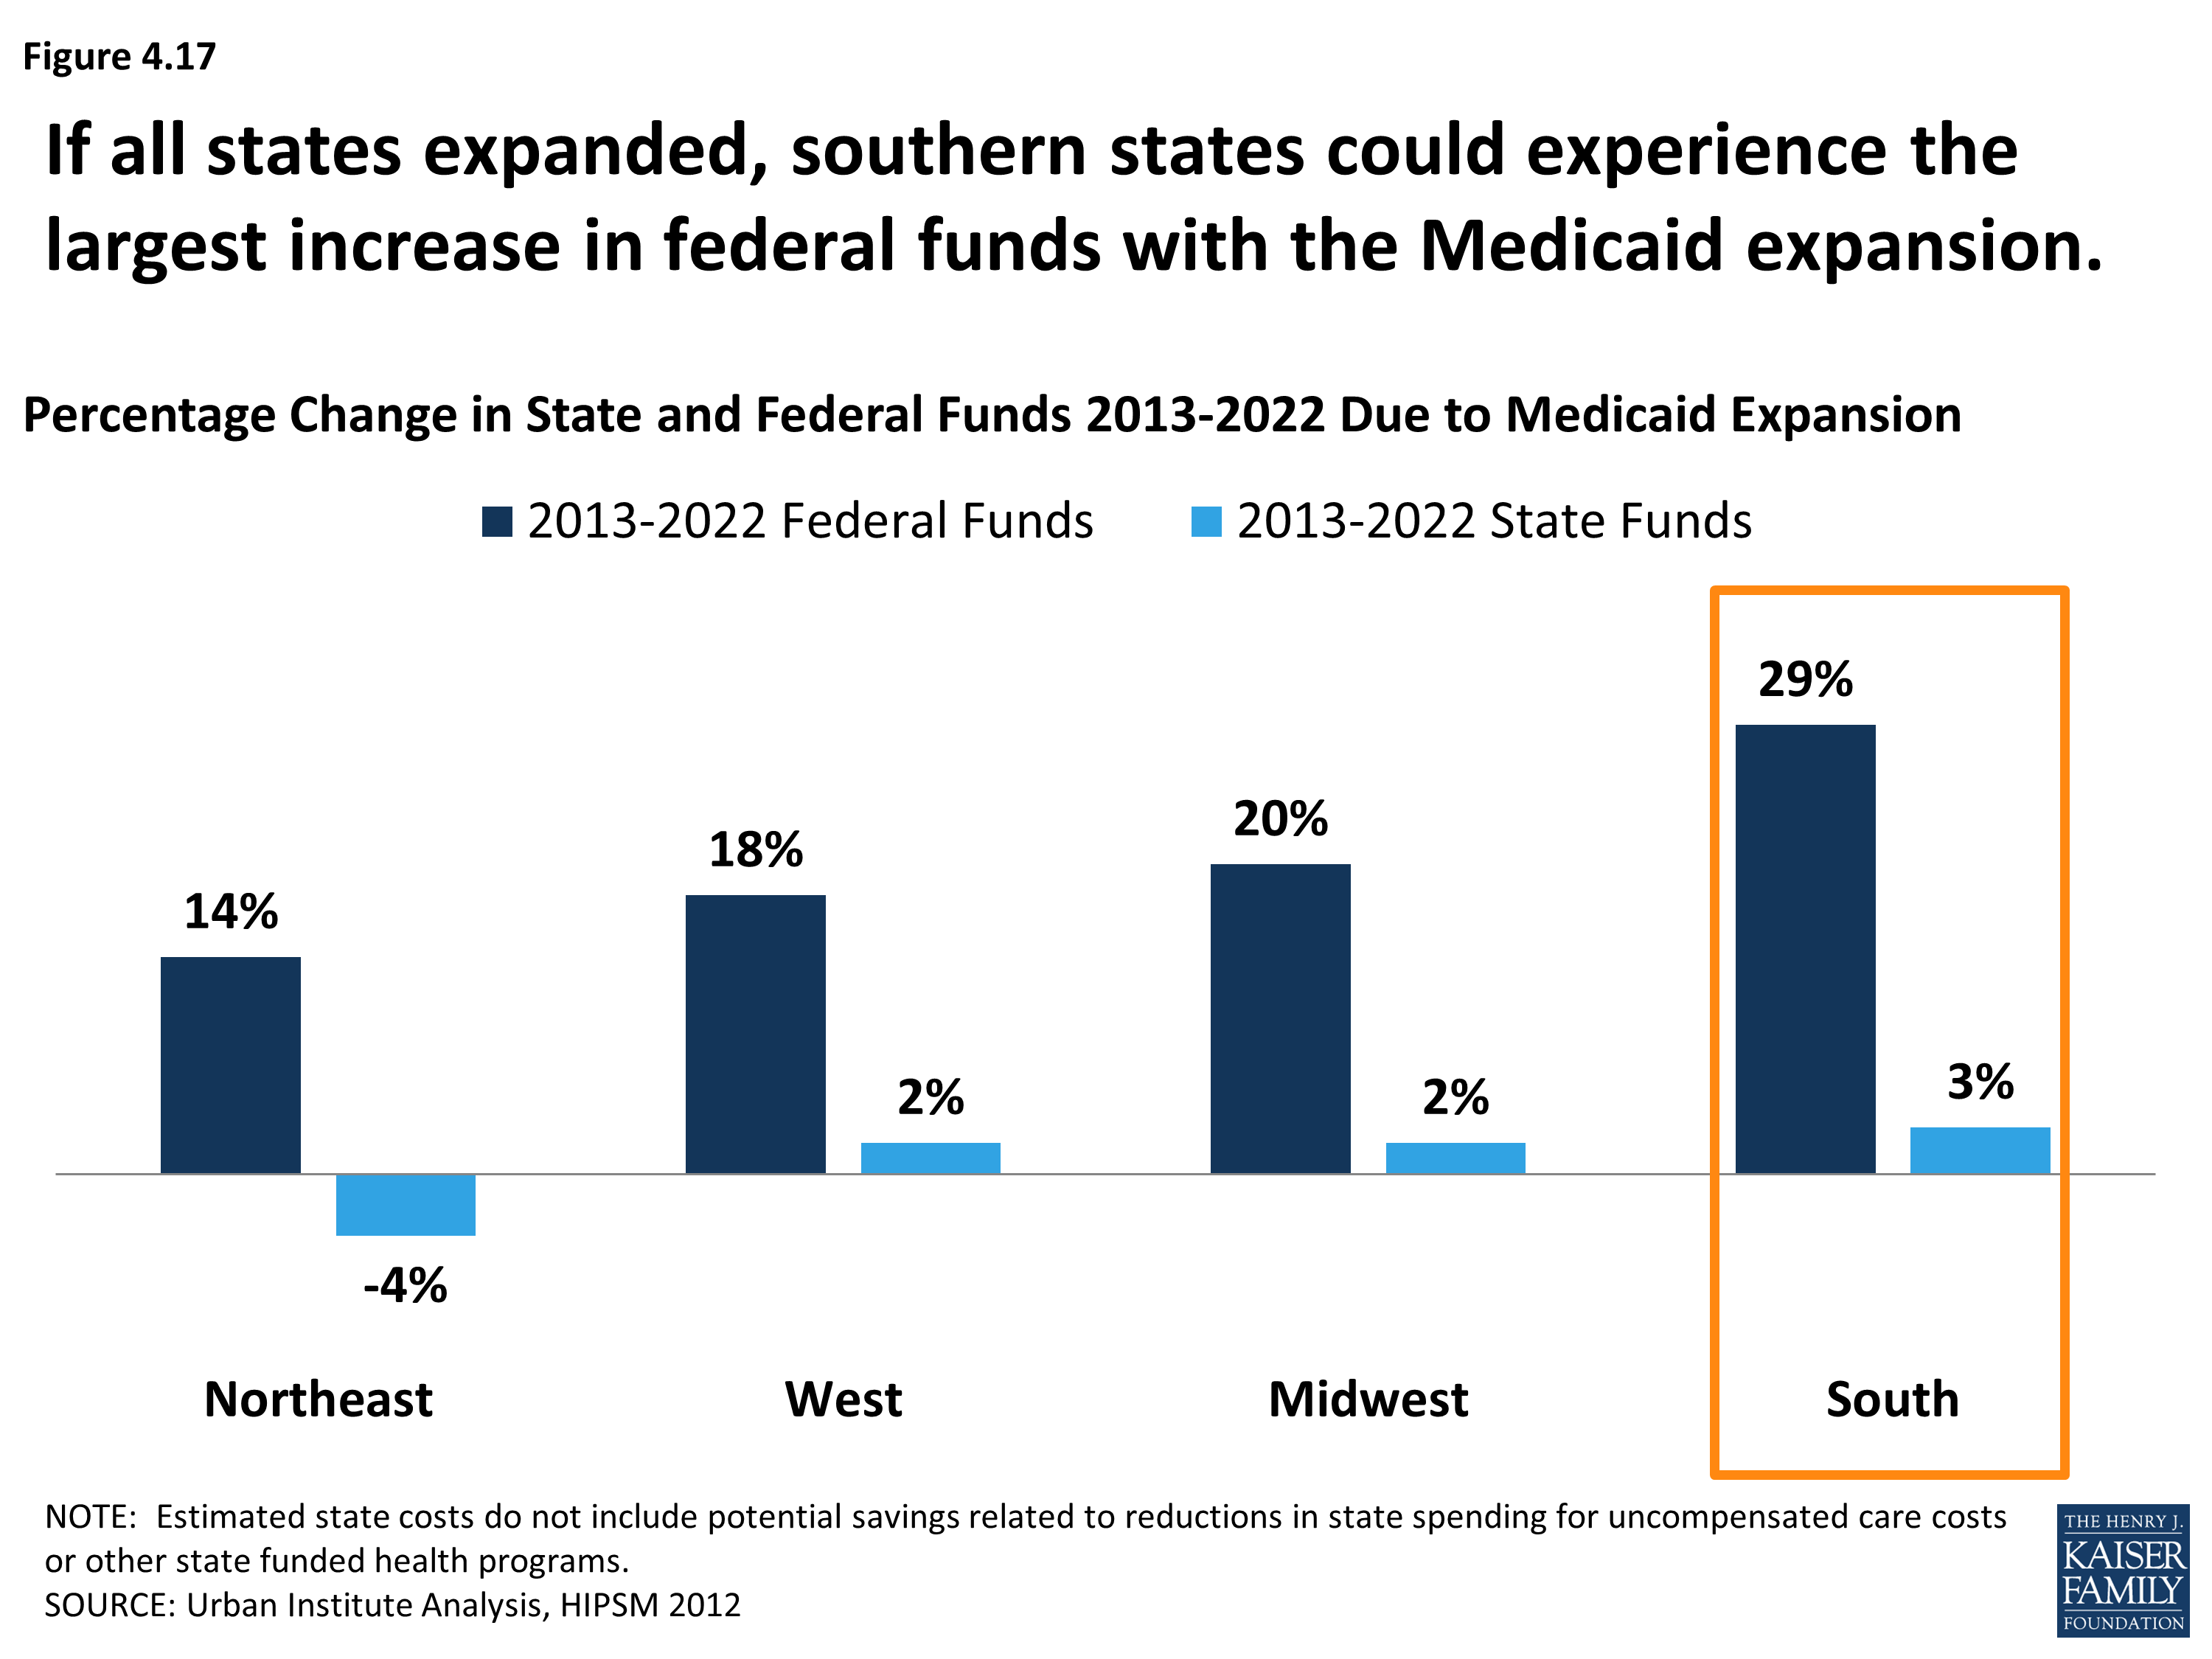
Percentage Change in State and Federal Funds Due to Medicaid Expansion, 2013-2022
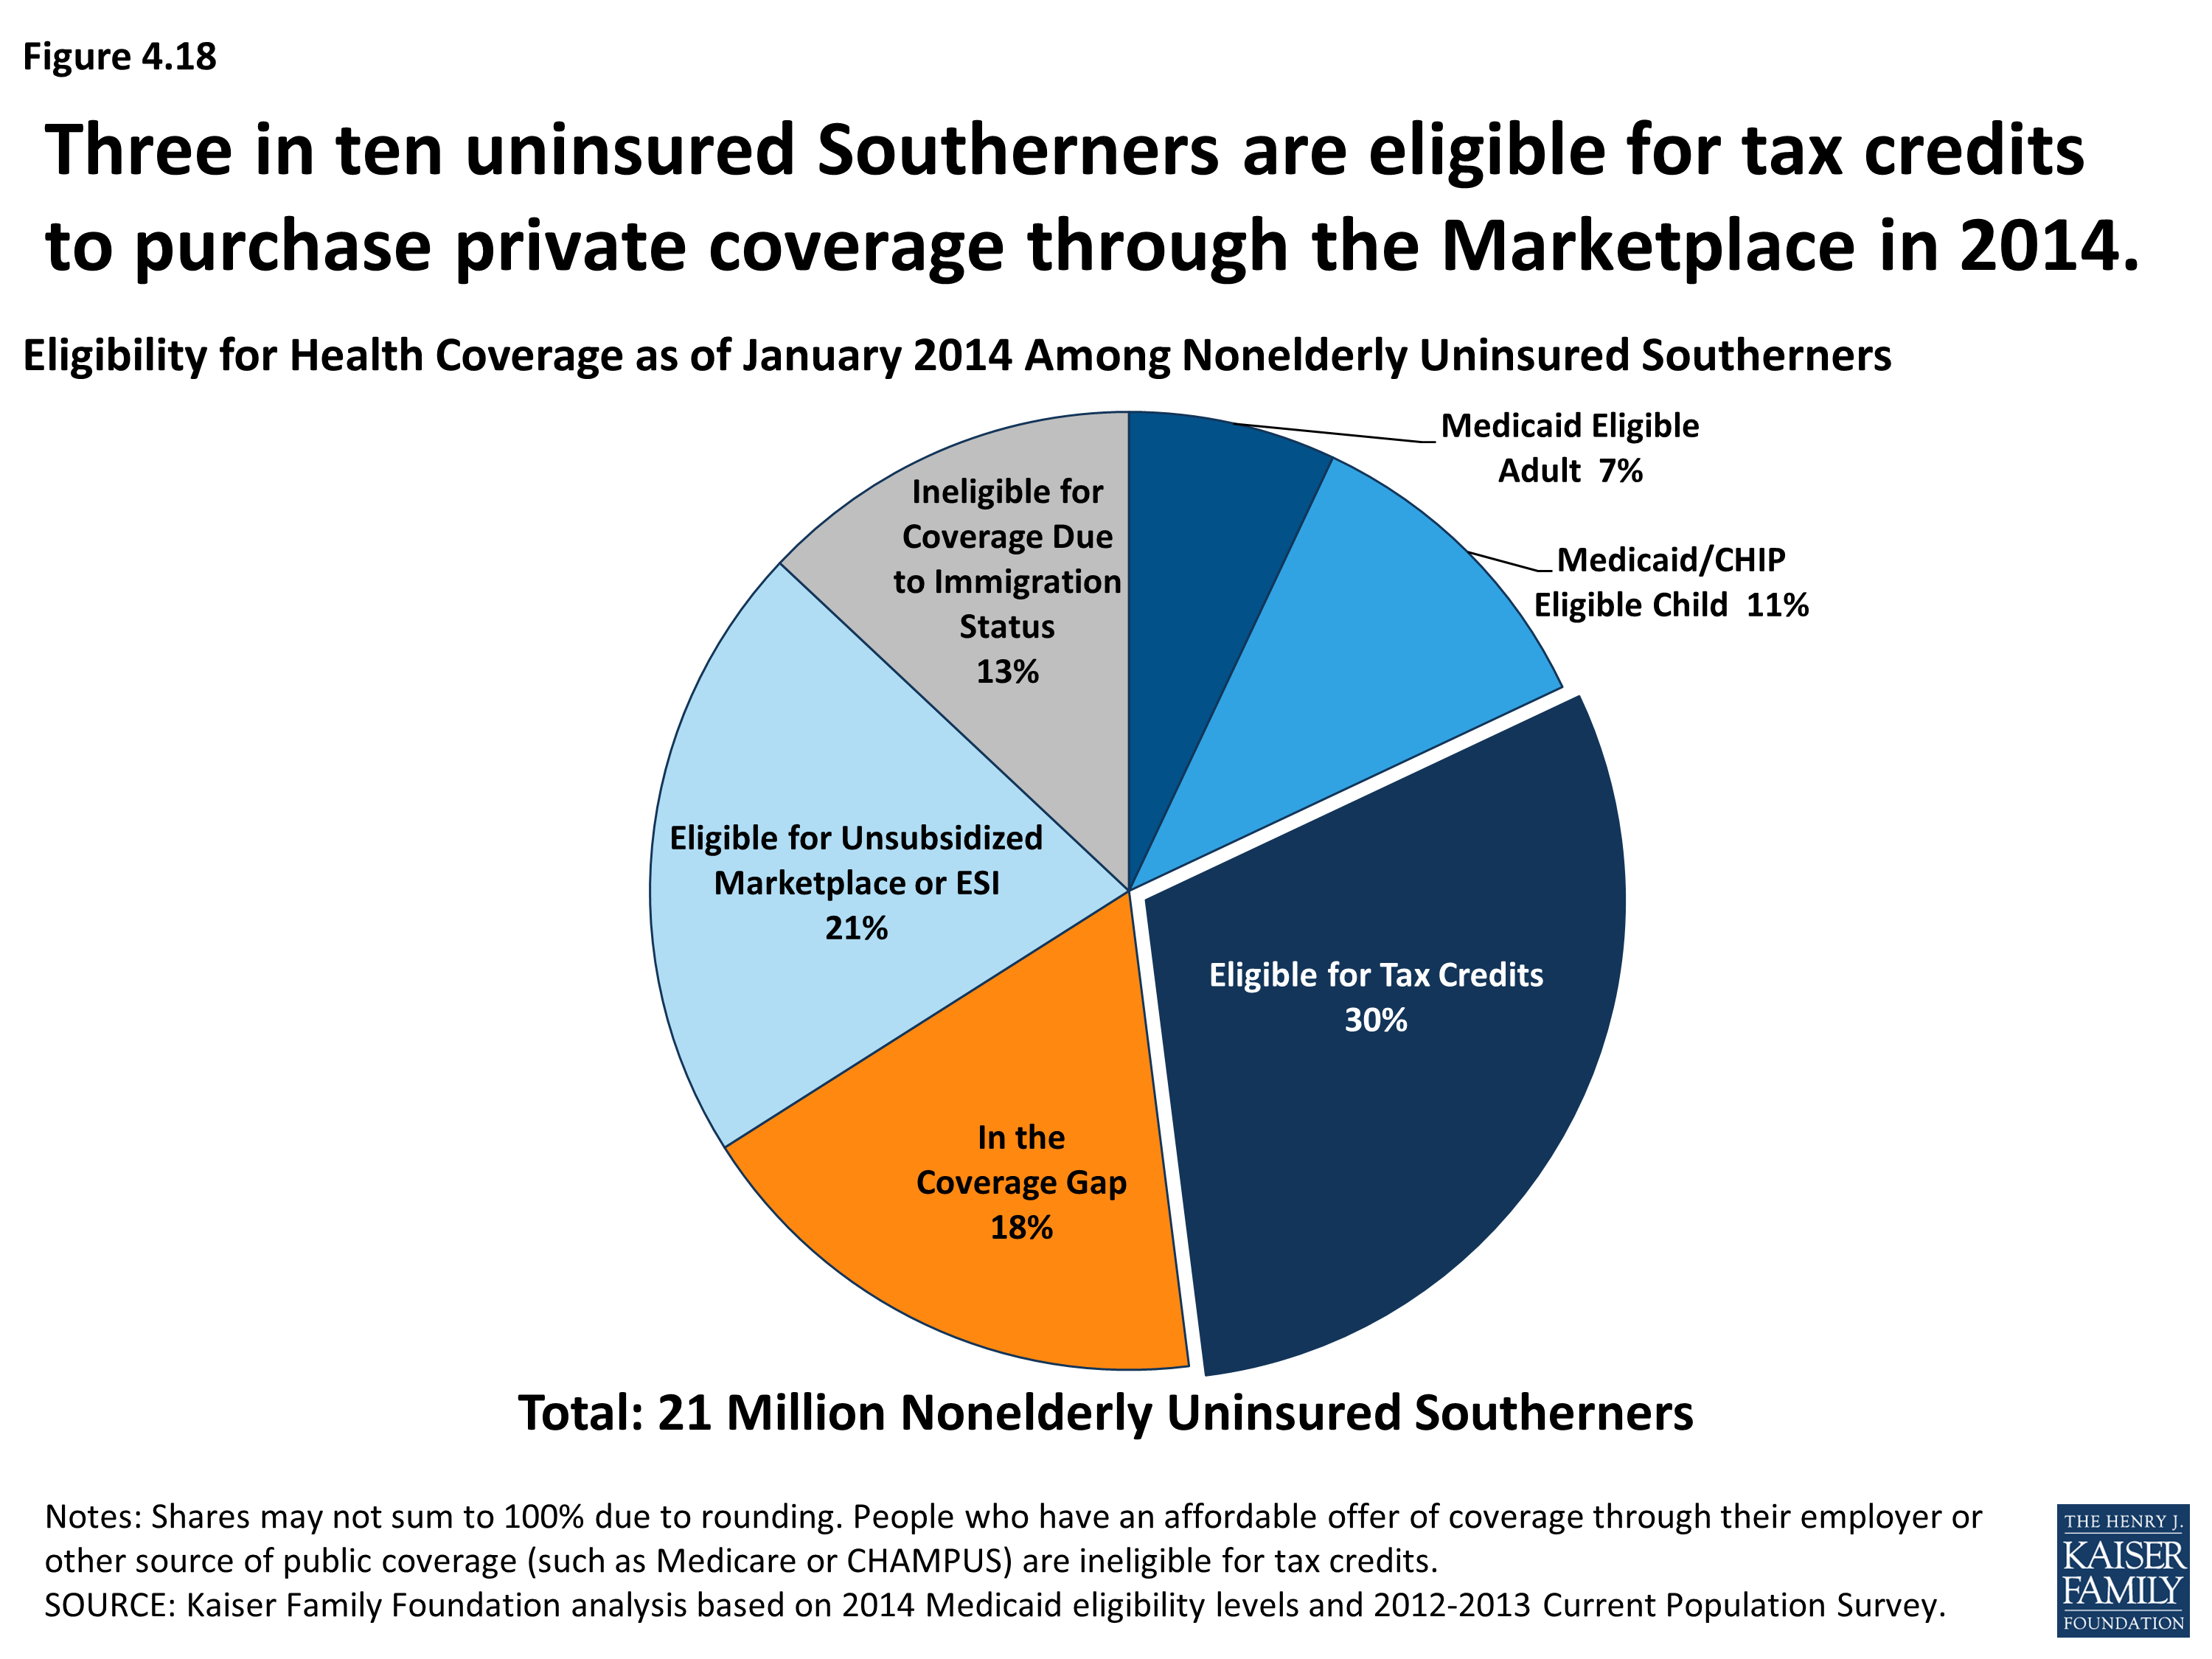
Eligibility for Health Coverage as of January 2014 Among Nonelderly Uninsured Southerners
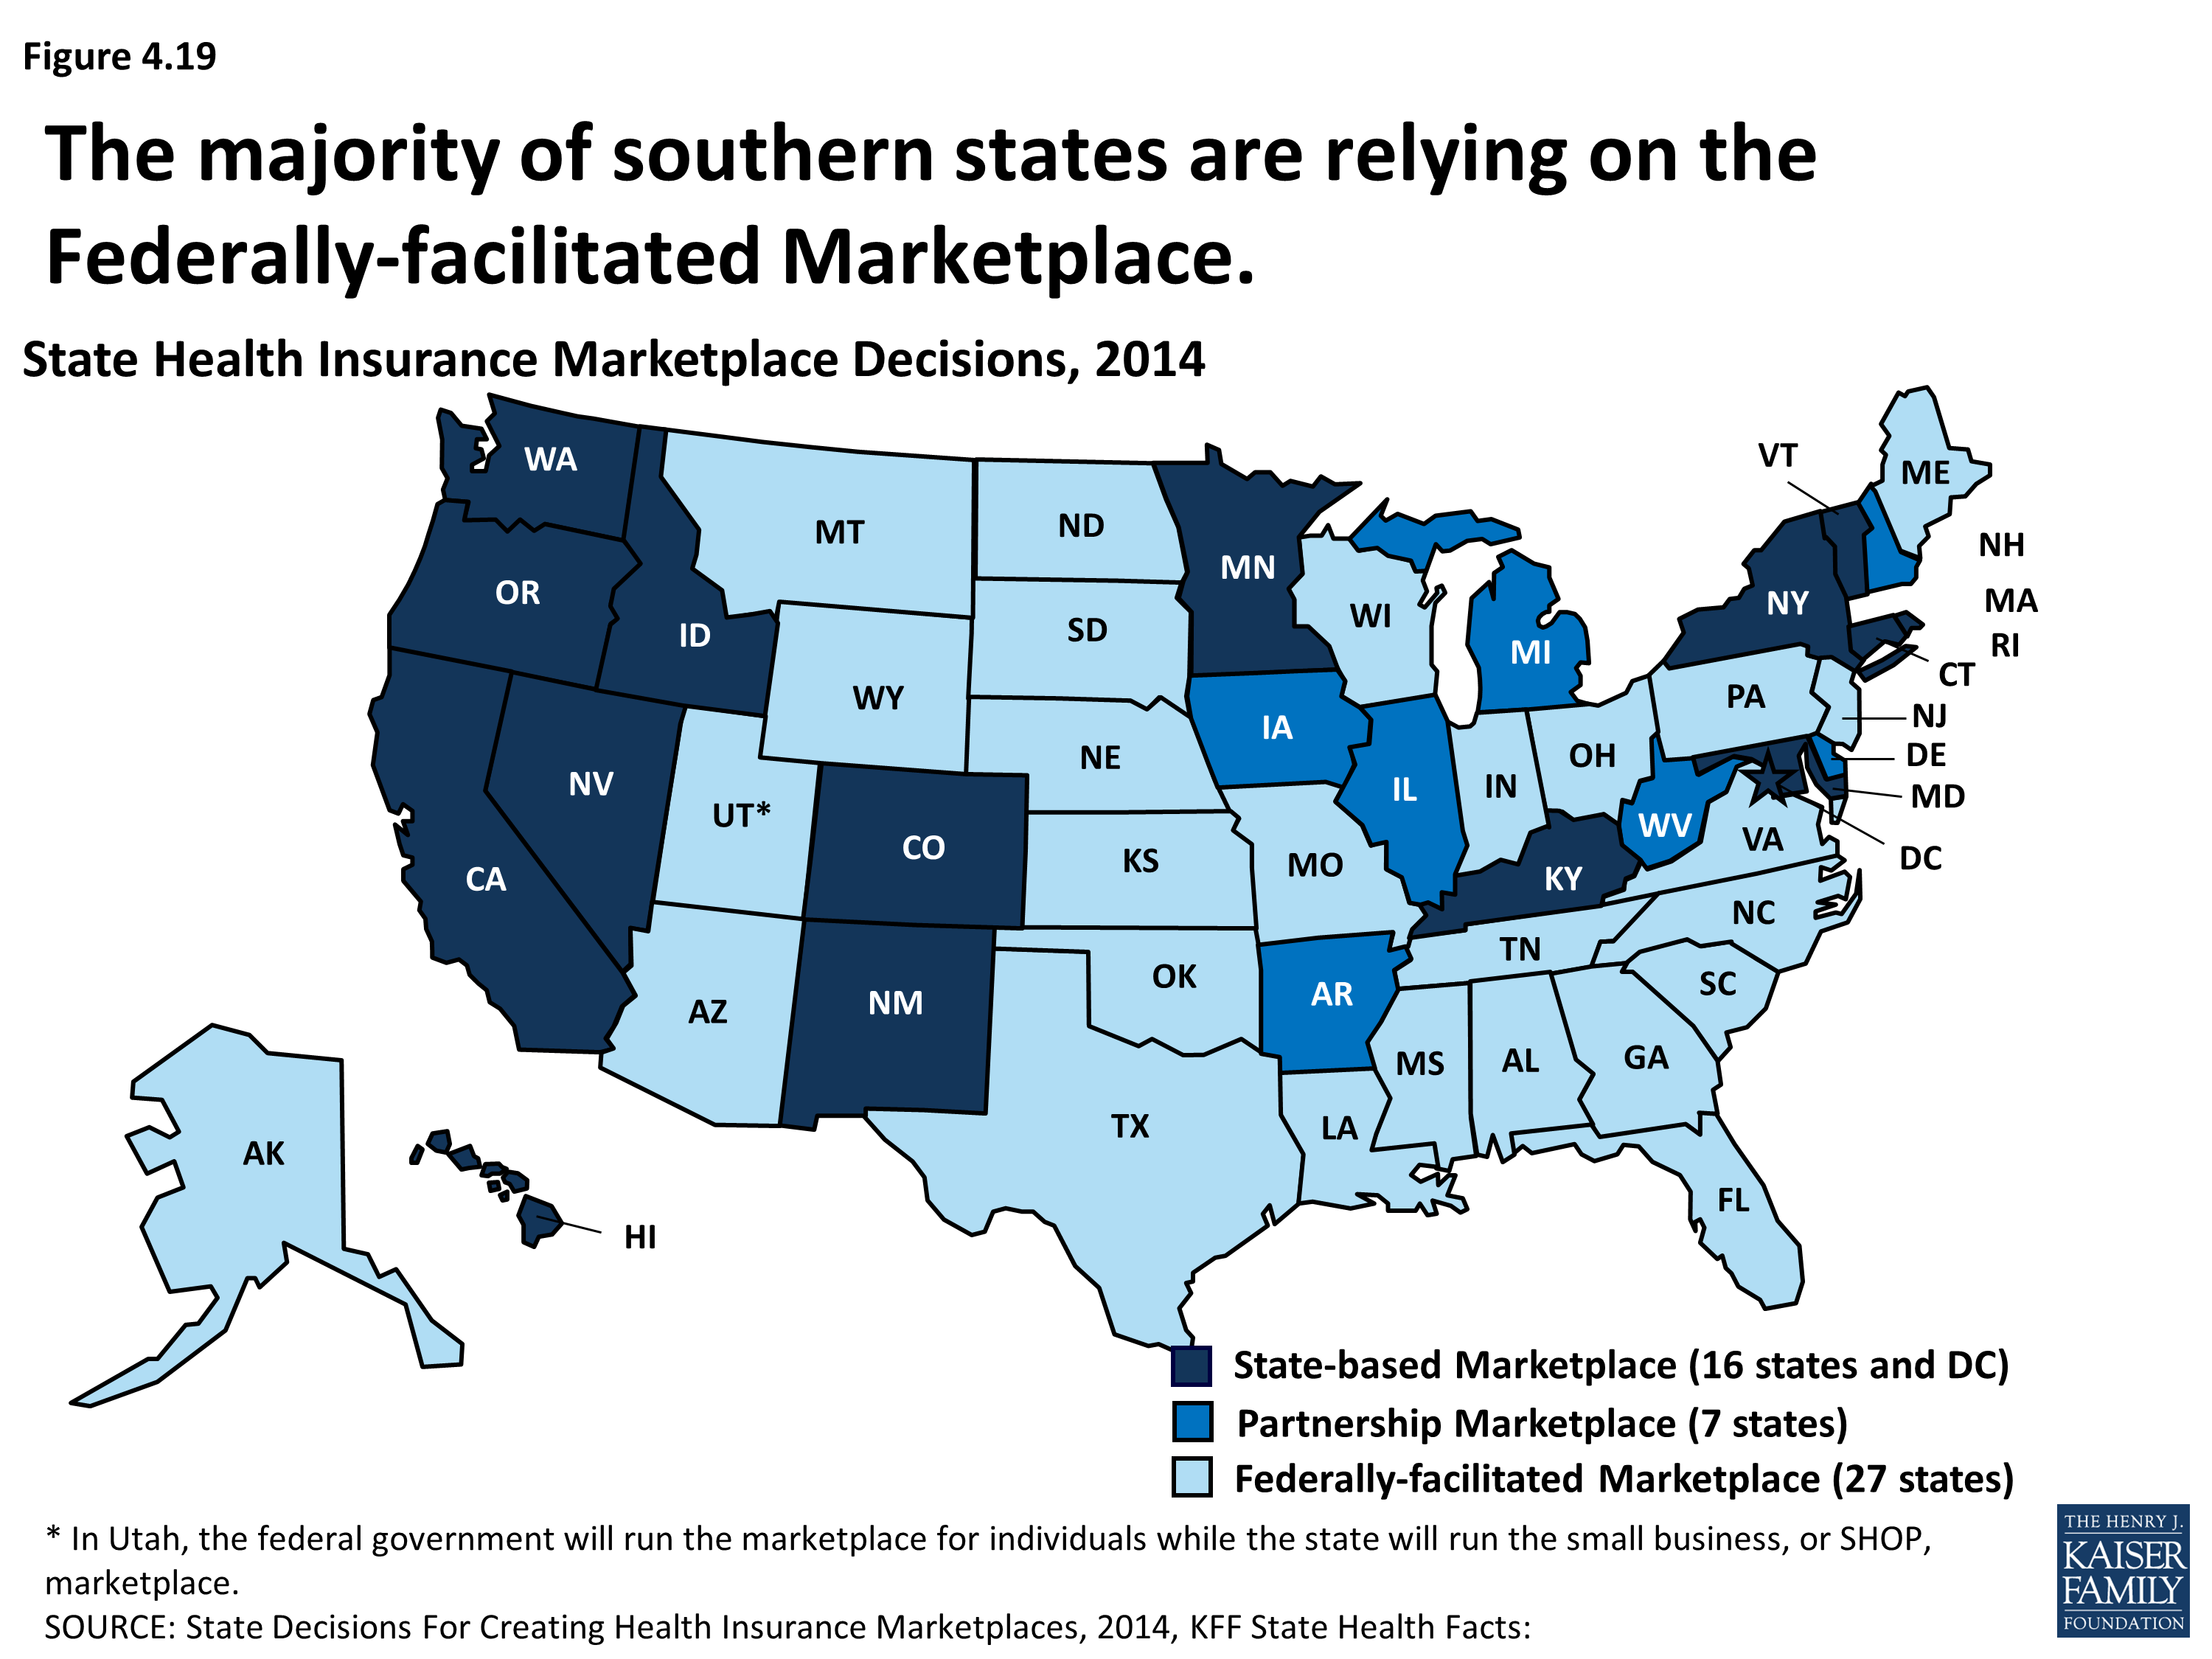
State Health Insurance Marketplace Decisions, 2014
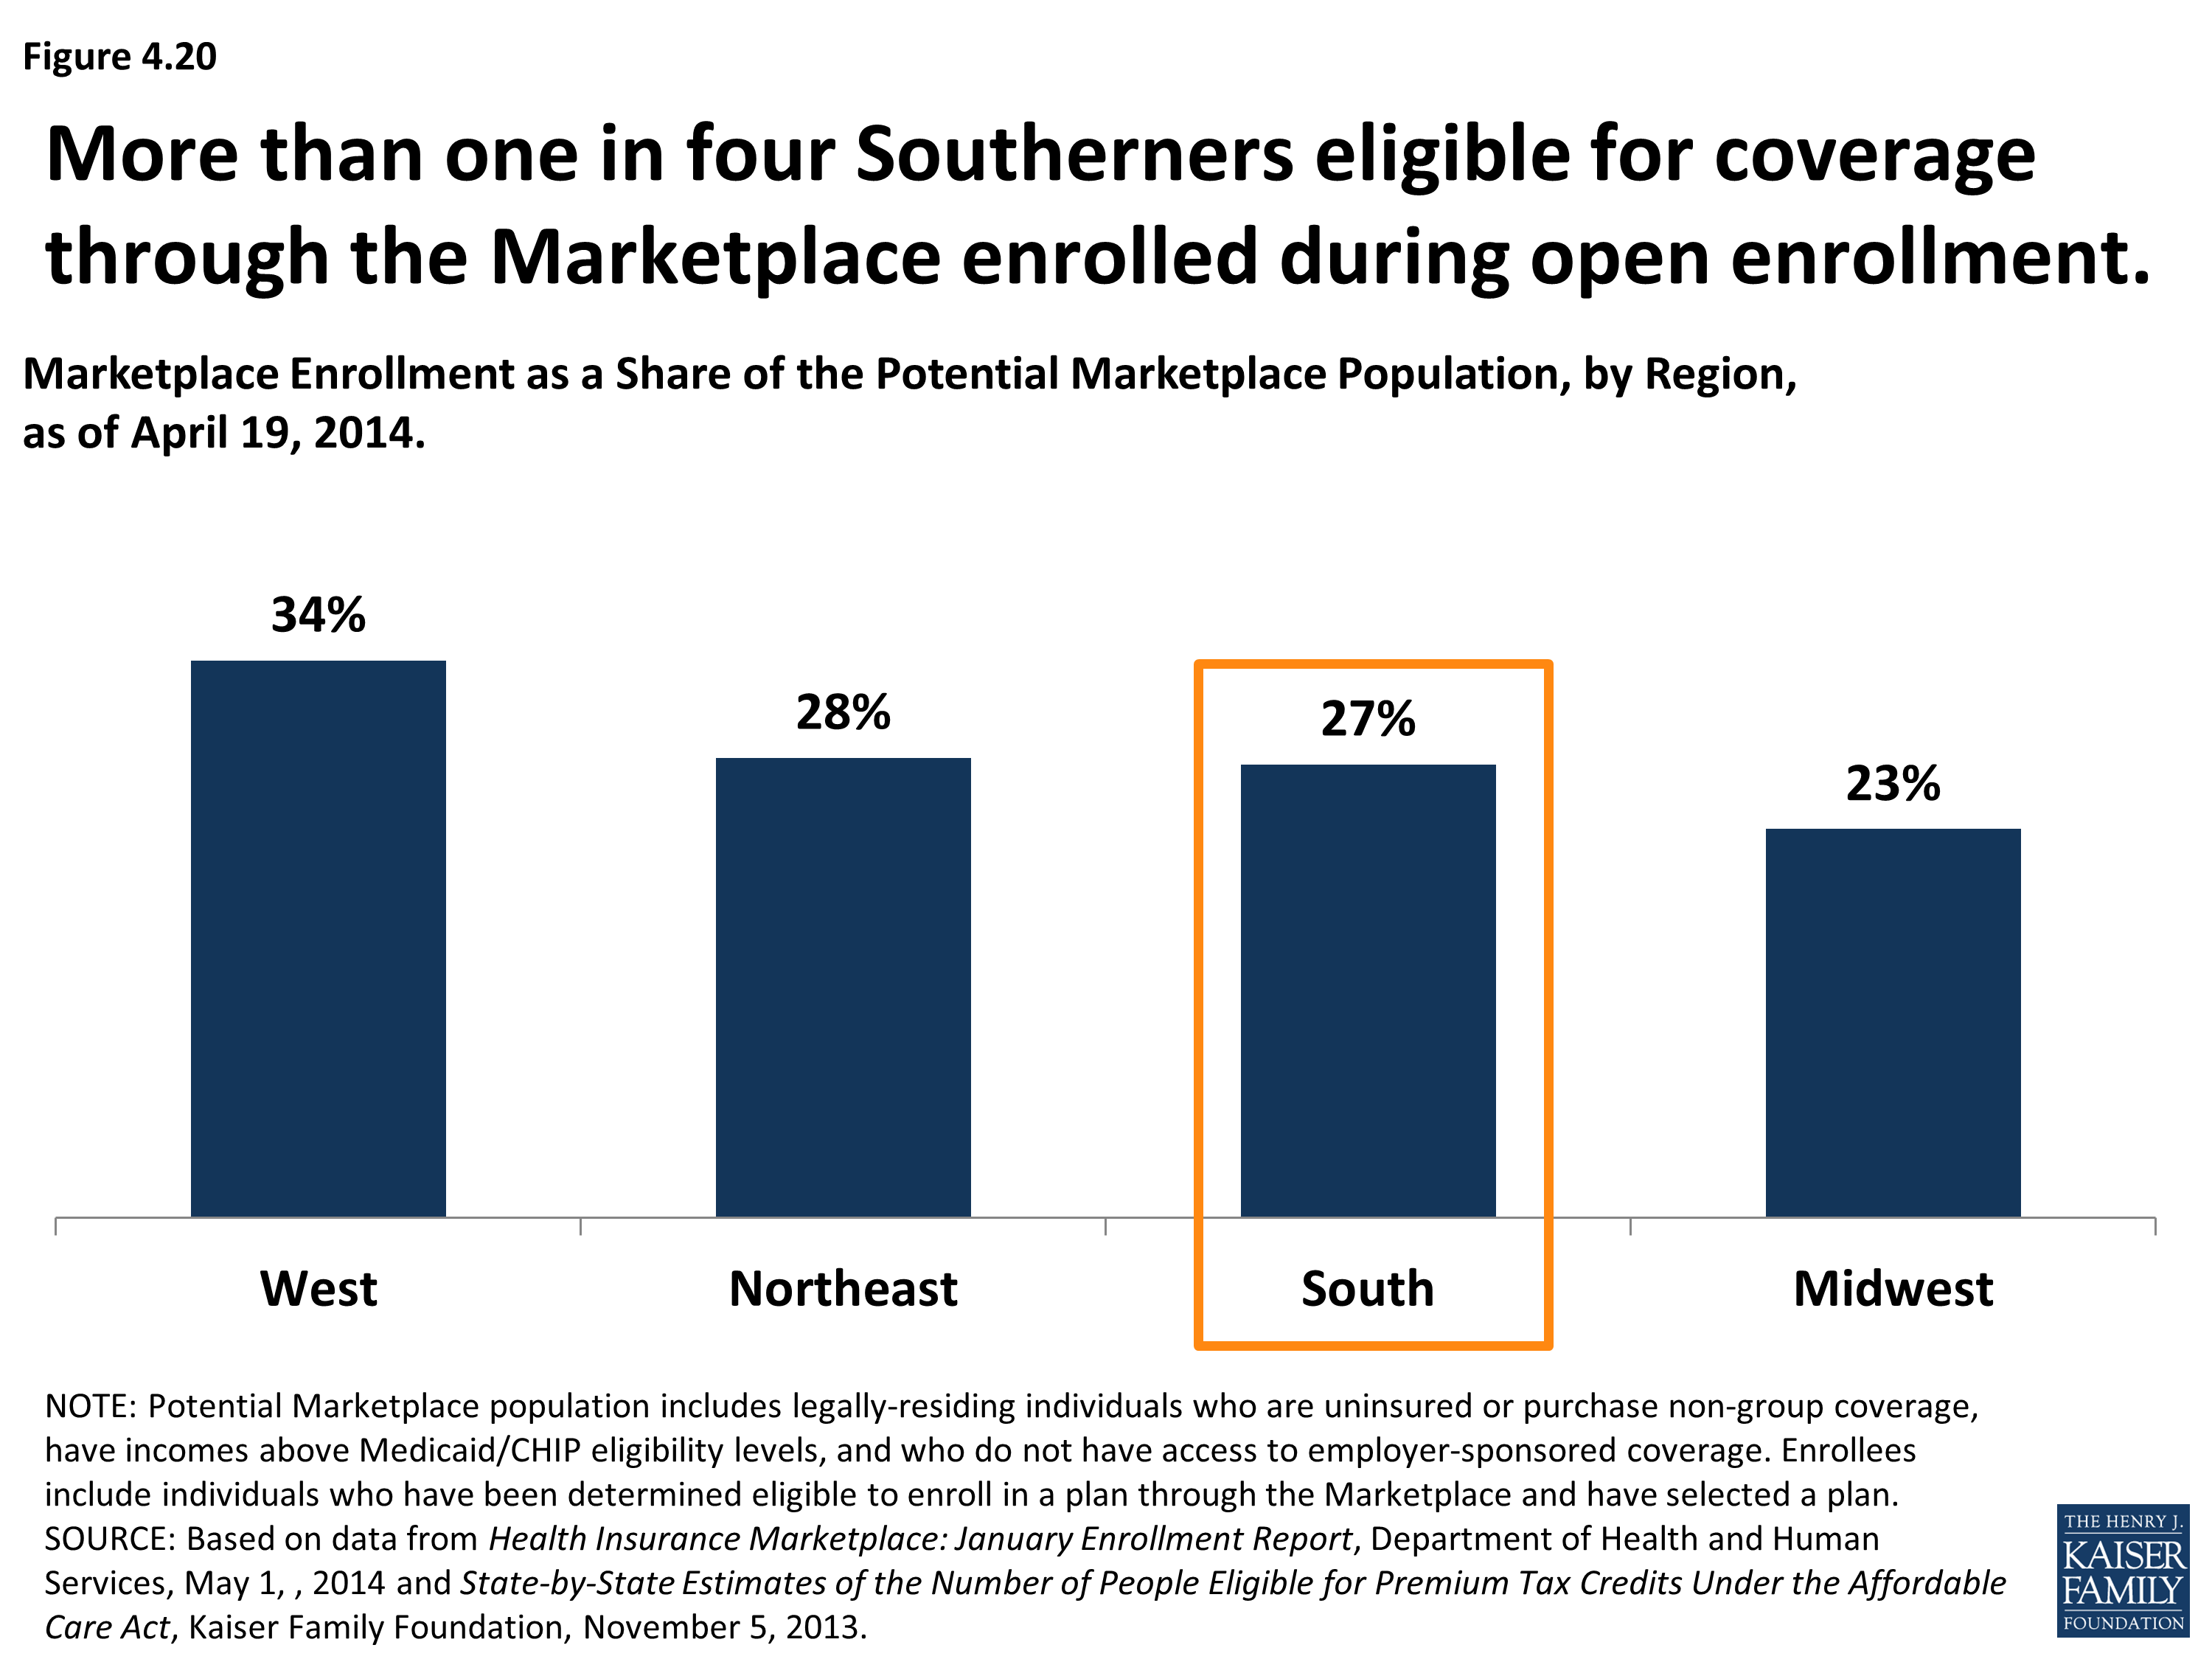
Marketplace Enrollment as a Share of the Potential Marketplace Population, by Region, as of April 19, 2014
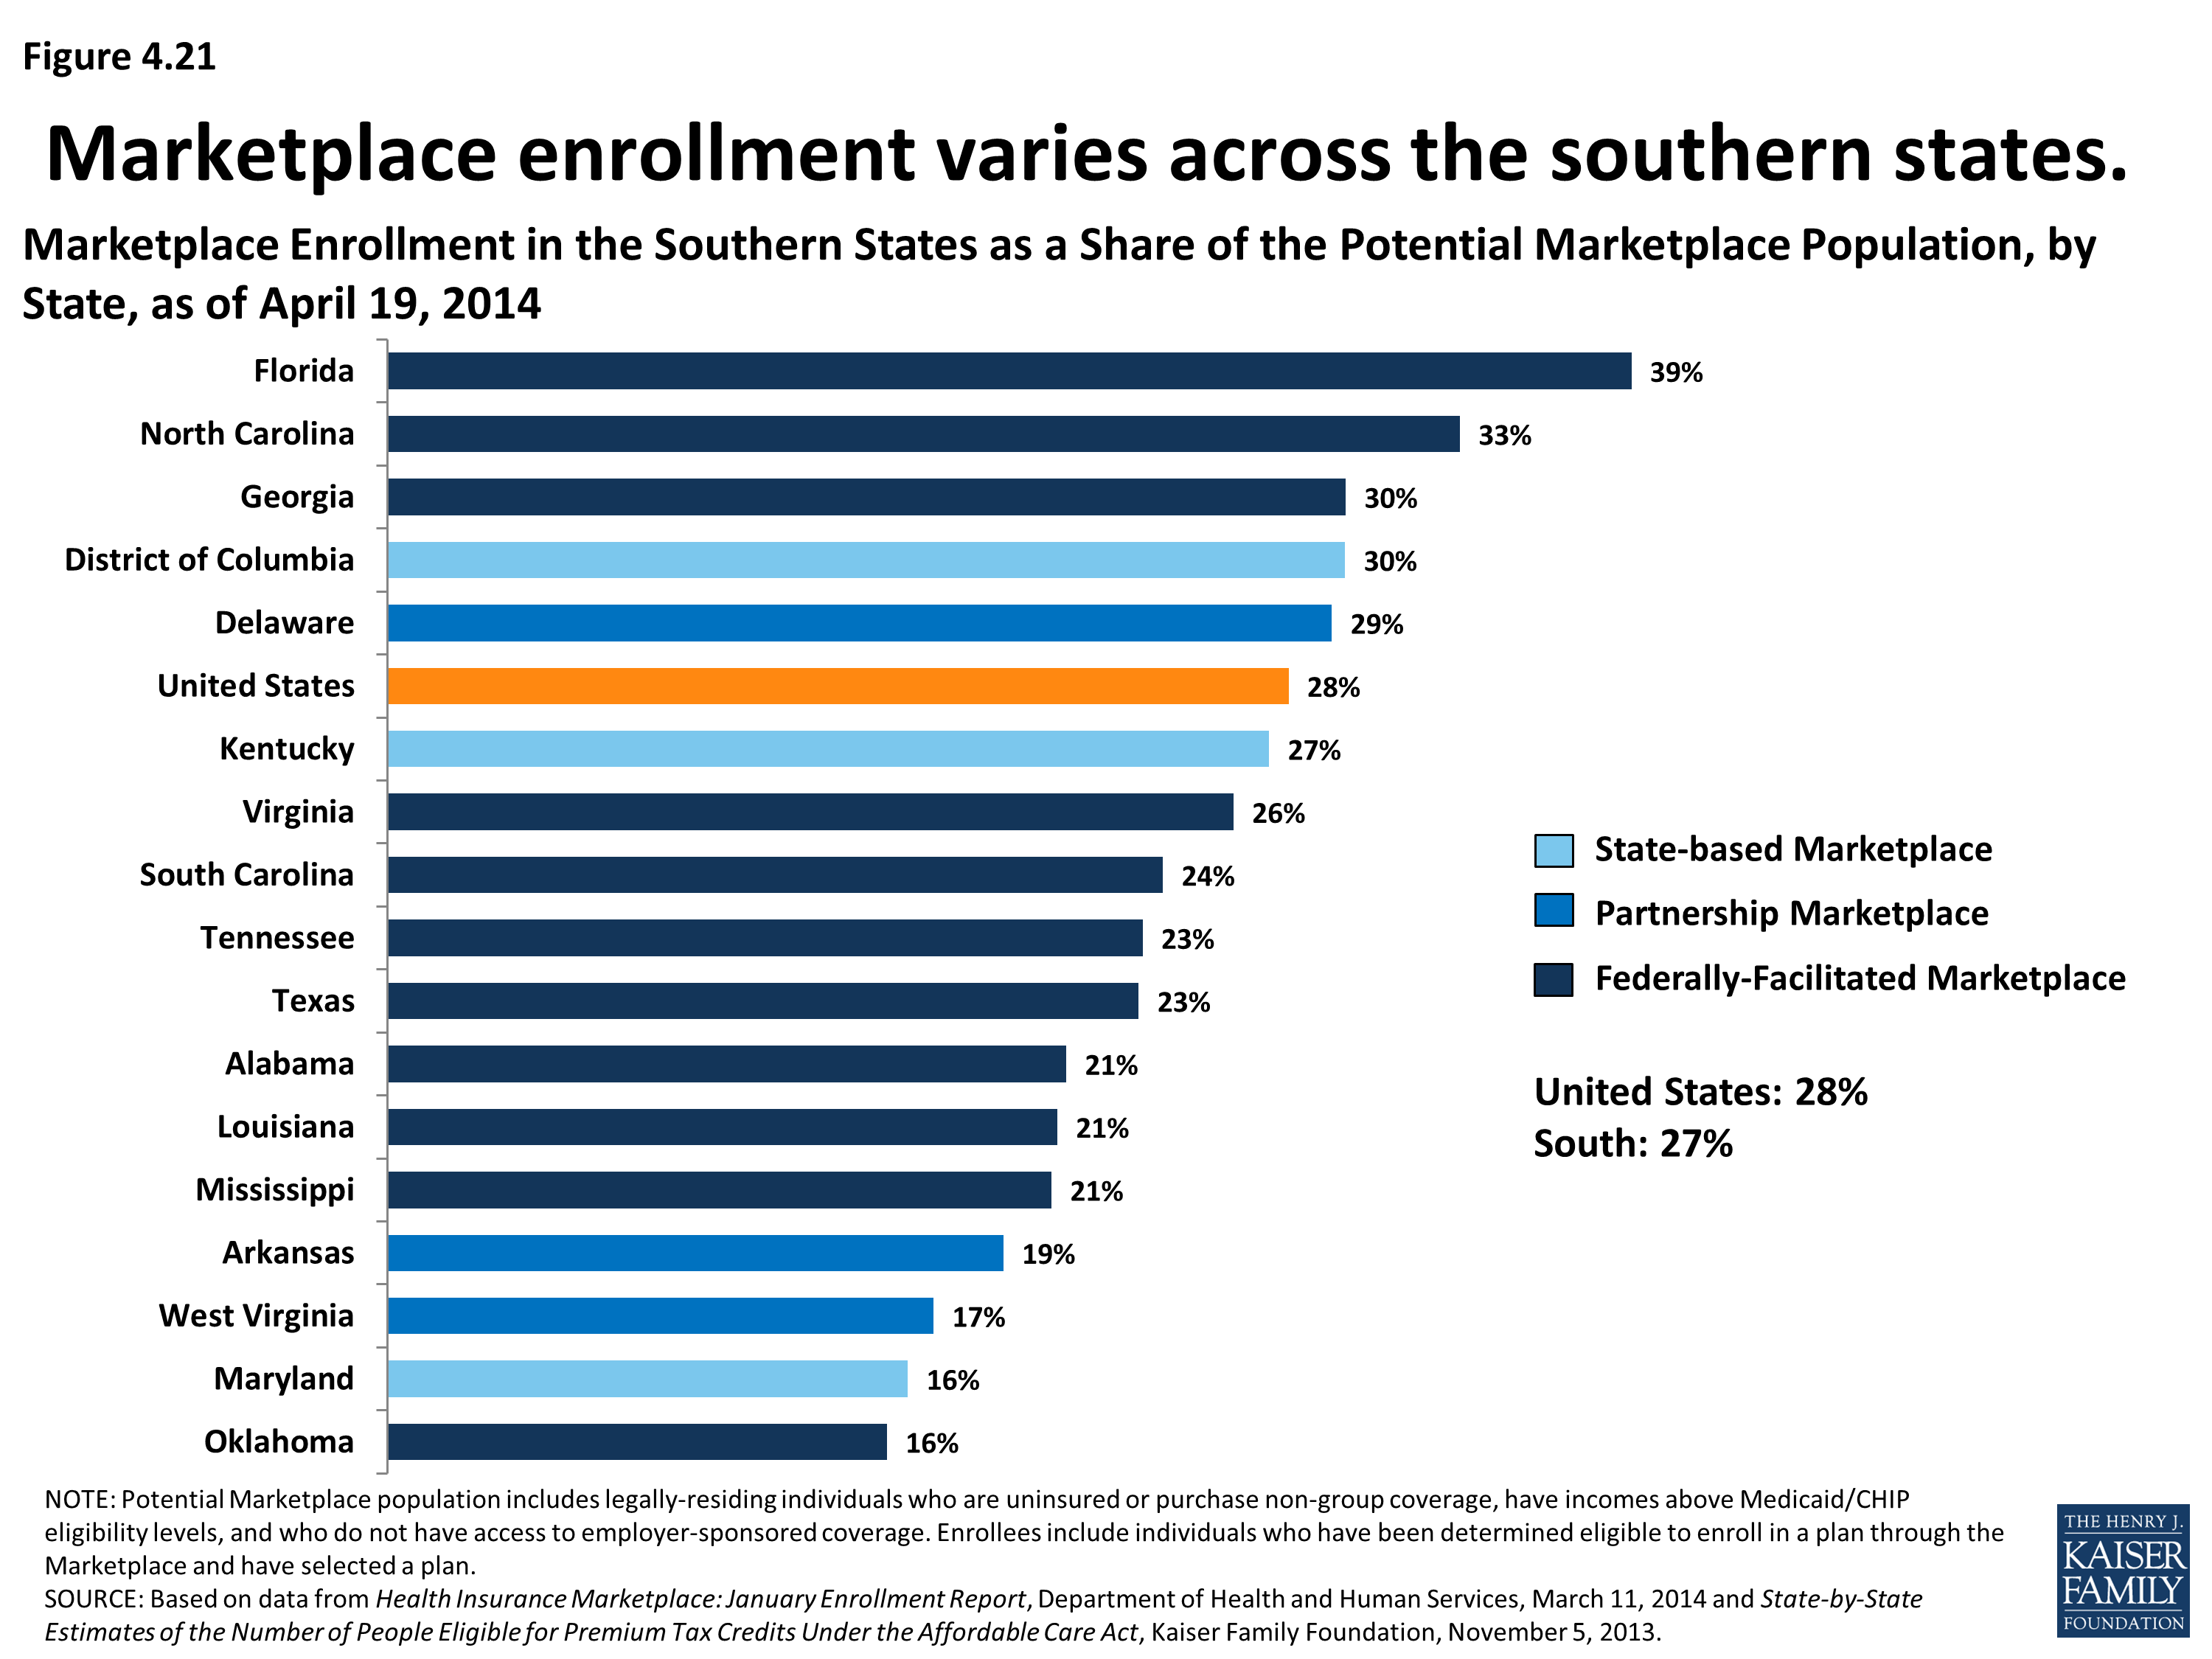
Marketplace Enrollment in the Southern States as a Share of the Potential Marketplace Population, by State, as of April 19, 2014
Section 5: Access to Care, Delivery Systems, and the Safety Net
To improve health outcomes in the long term, it will be important to ensure that all individuals are able to obtain needed primary and specialty health care services. Southerners have historically been more likely than those in other regions to report difficulty accessing and paying for needed care.
States are increasingly relying on a number of tools to improve provider capacity and reform the delivery of care including expanding the use of Medicaid managed care, increasing payment to providers, and revising scope of practice laws to allow nurse practitioners to treat patients with fewer restrictions. Even with improvements to the delivery and coordination of care, however, community health centers and other safety net providers in the South will likely continue to serve an important role in providing care to some of the region’s most vulnerable low-income populations including the uninsured, people of color, homeless individuals, and those with limited English proficiency.
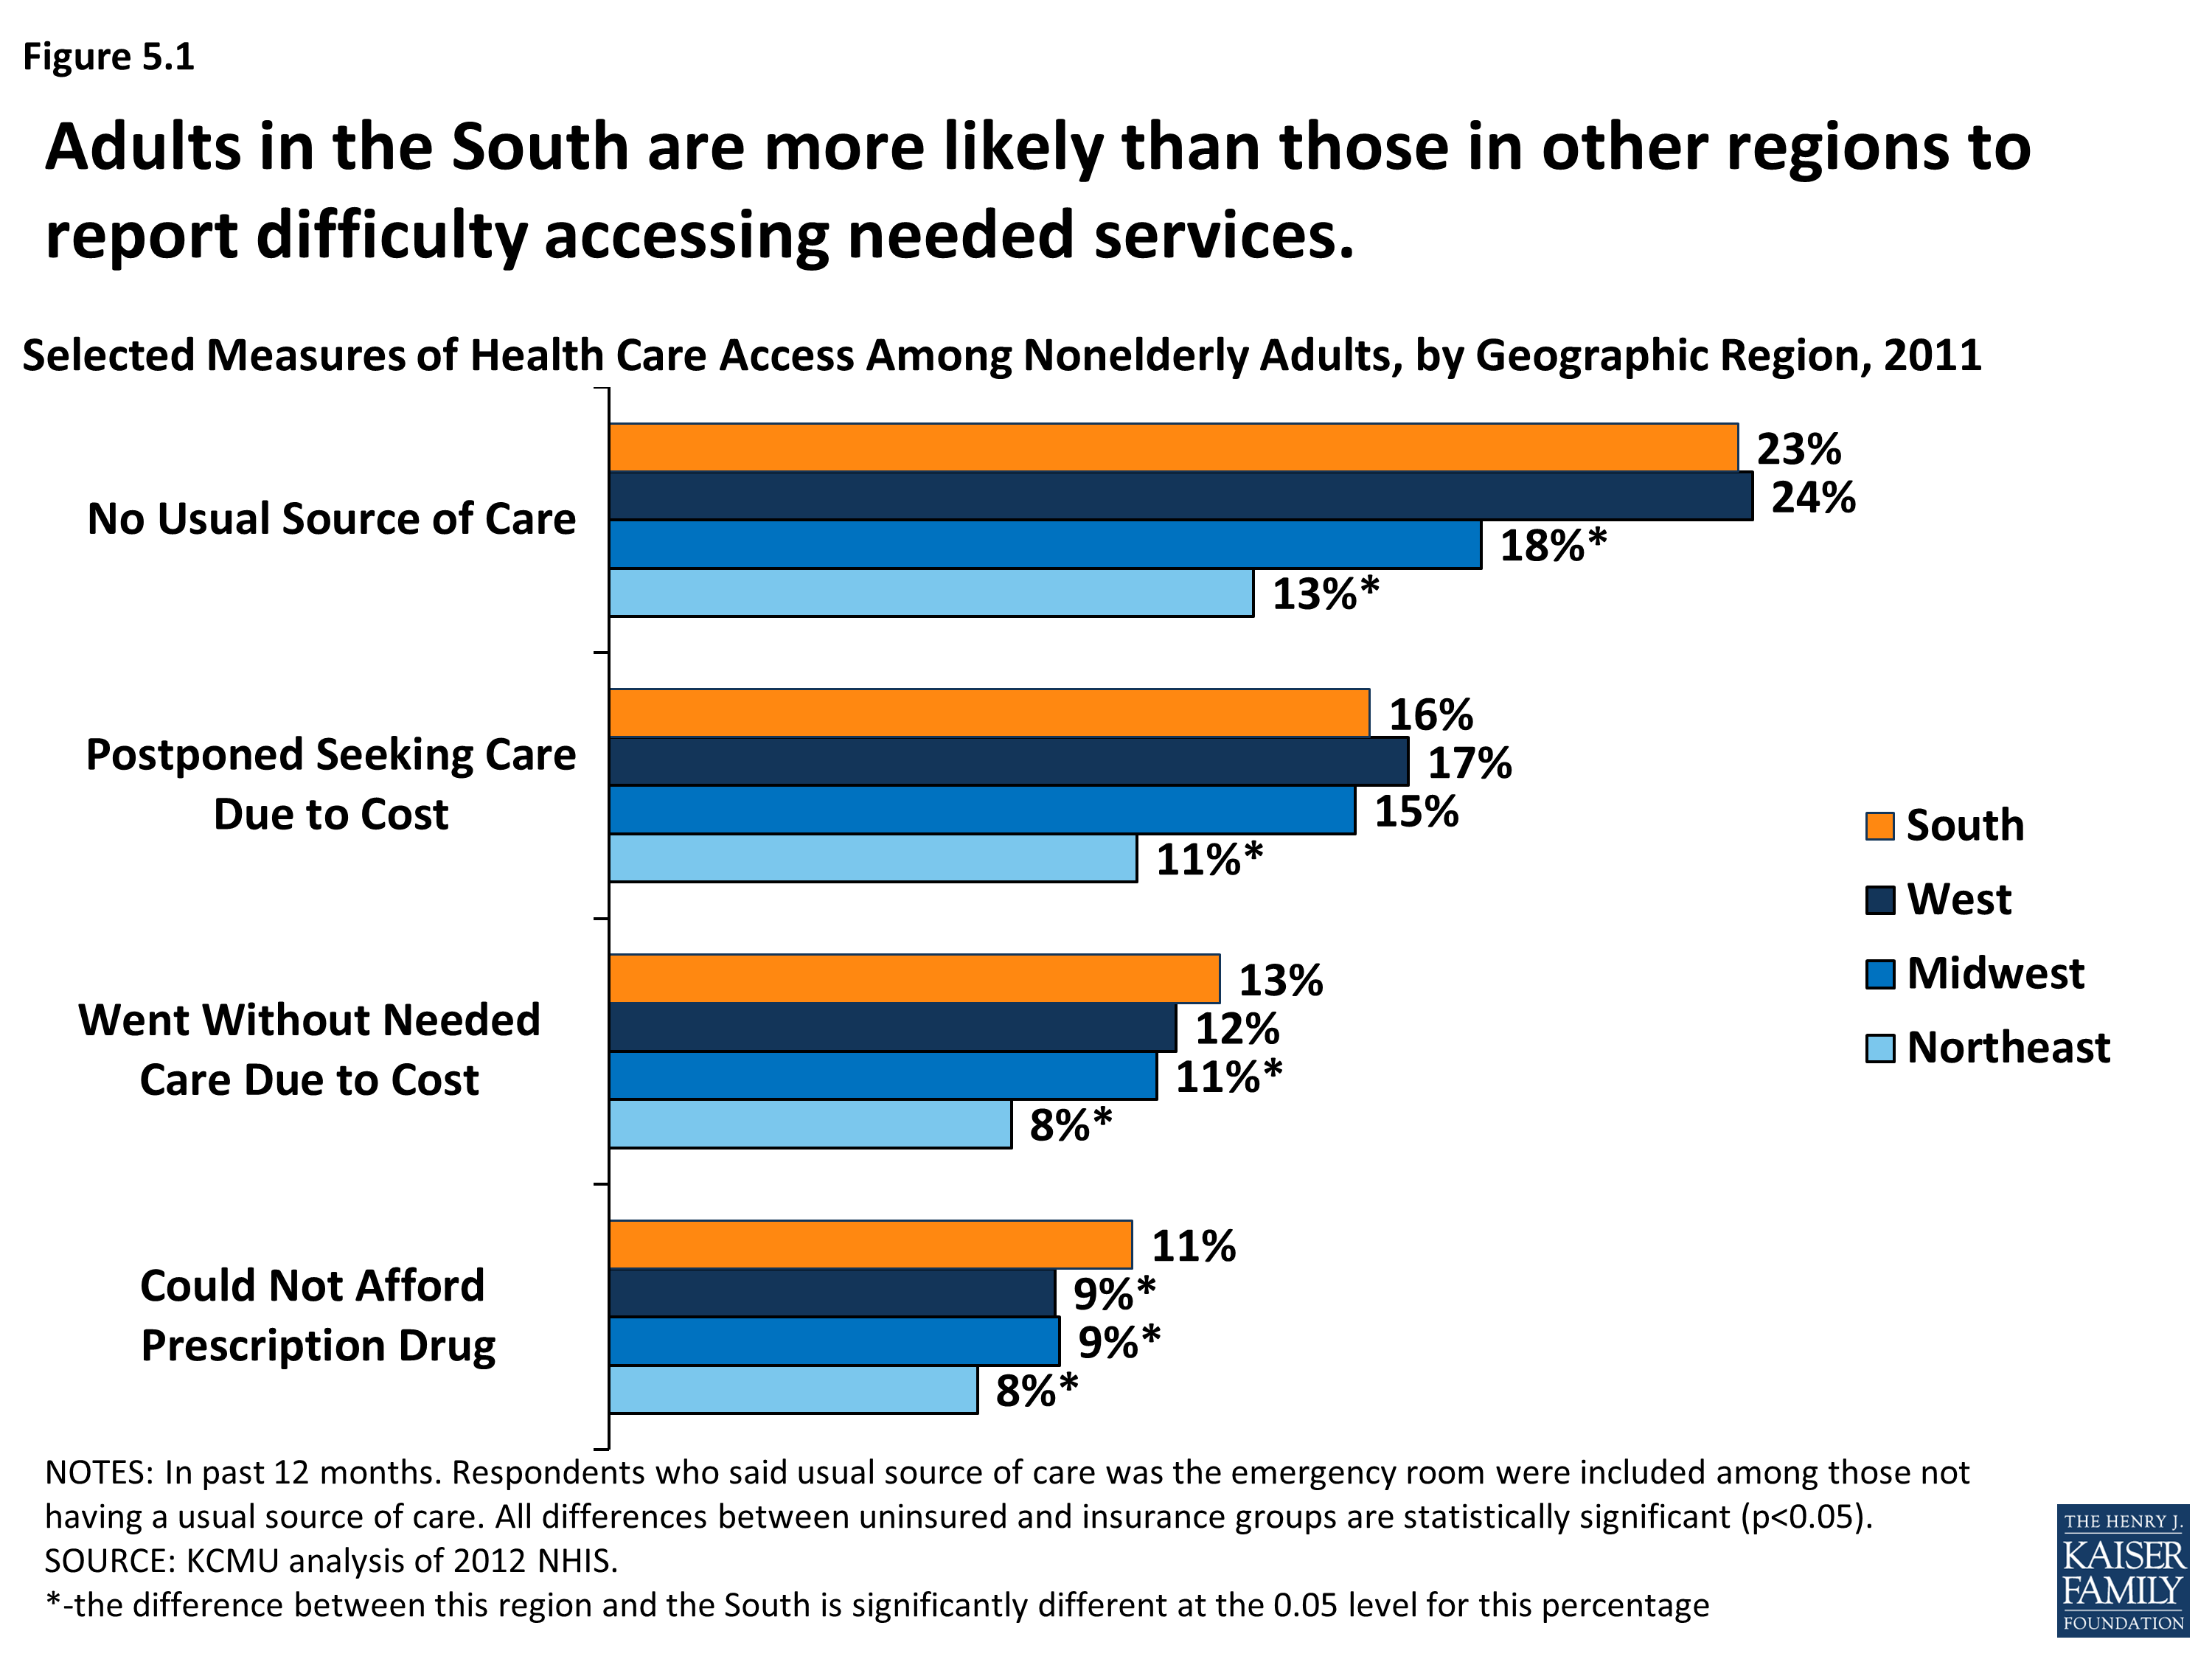
Selected Measures of Health Care Access Among Nonelderly Adults, by Geographic Region, 2011
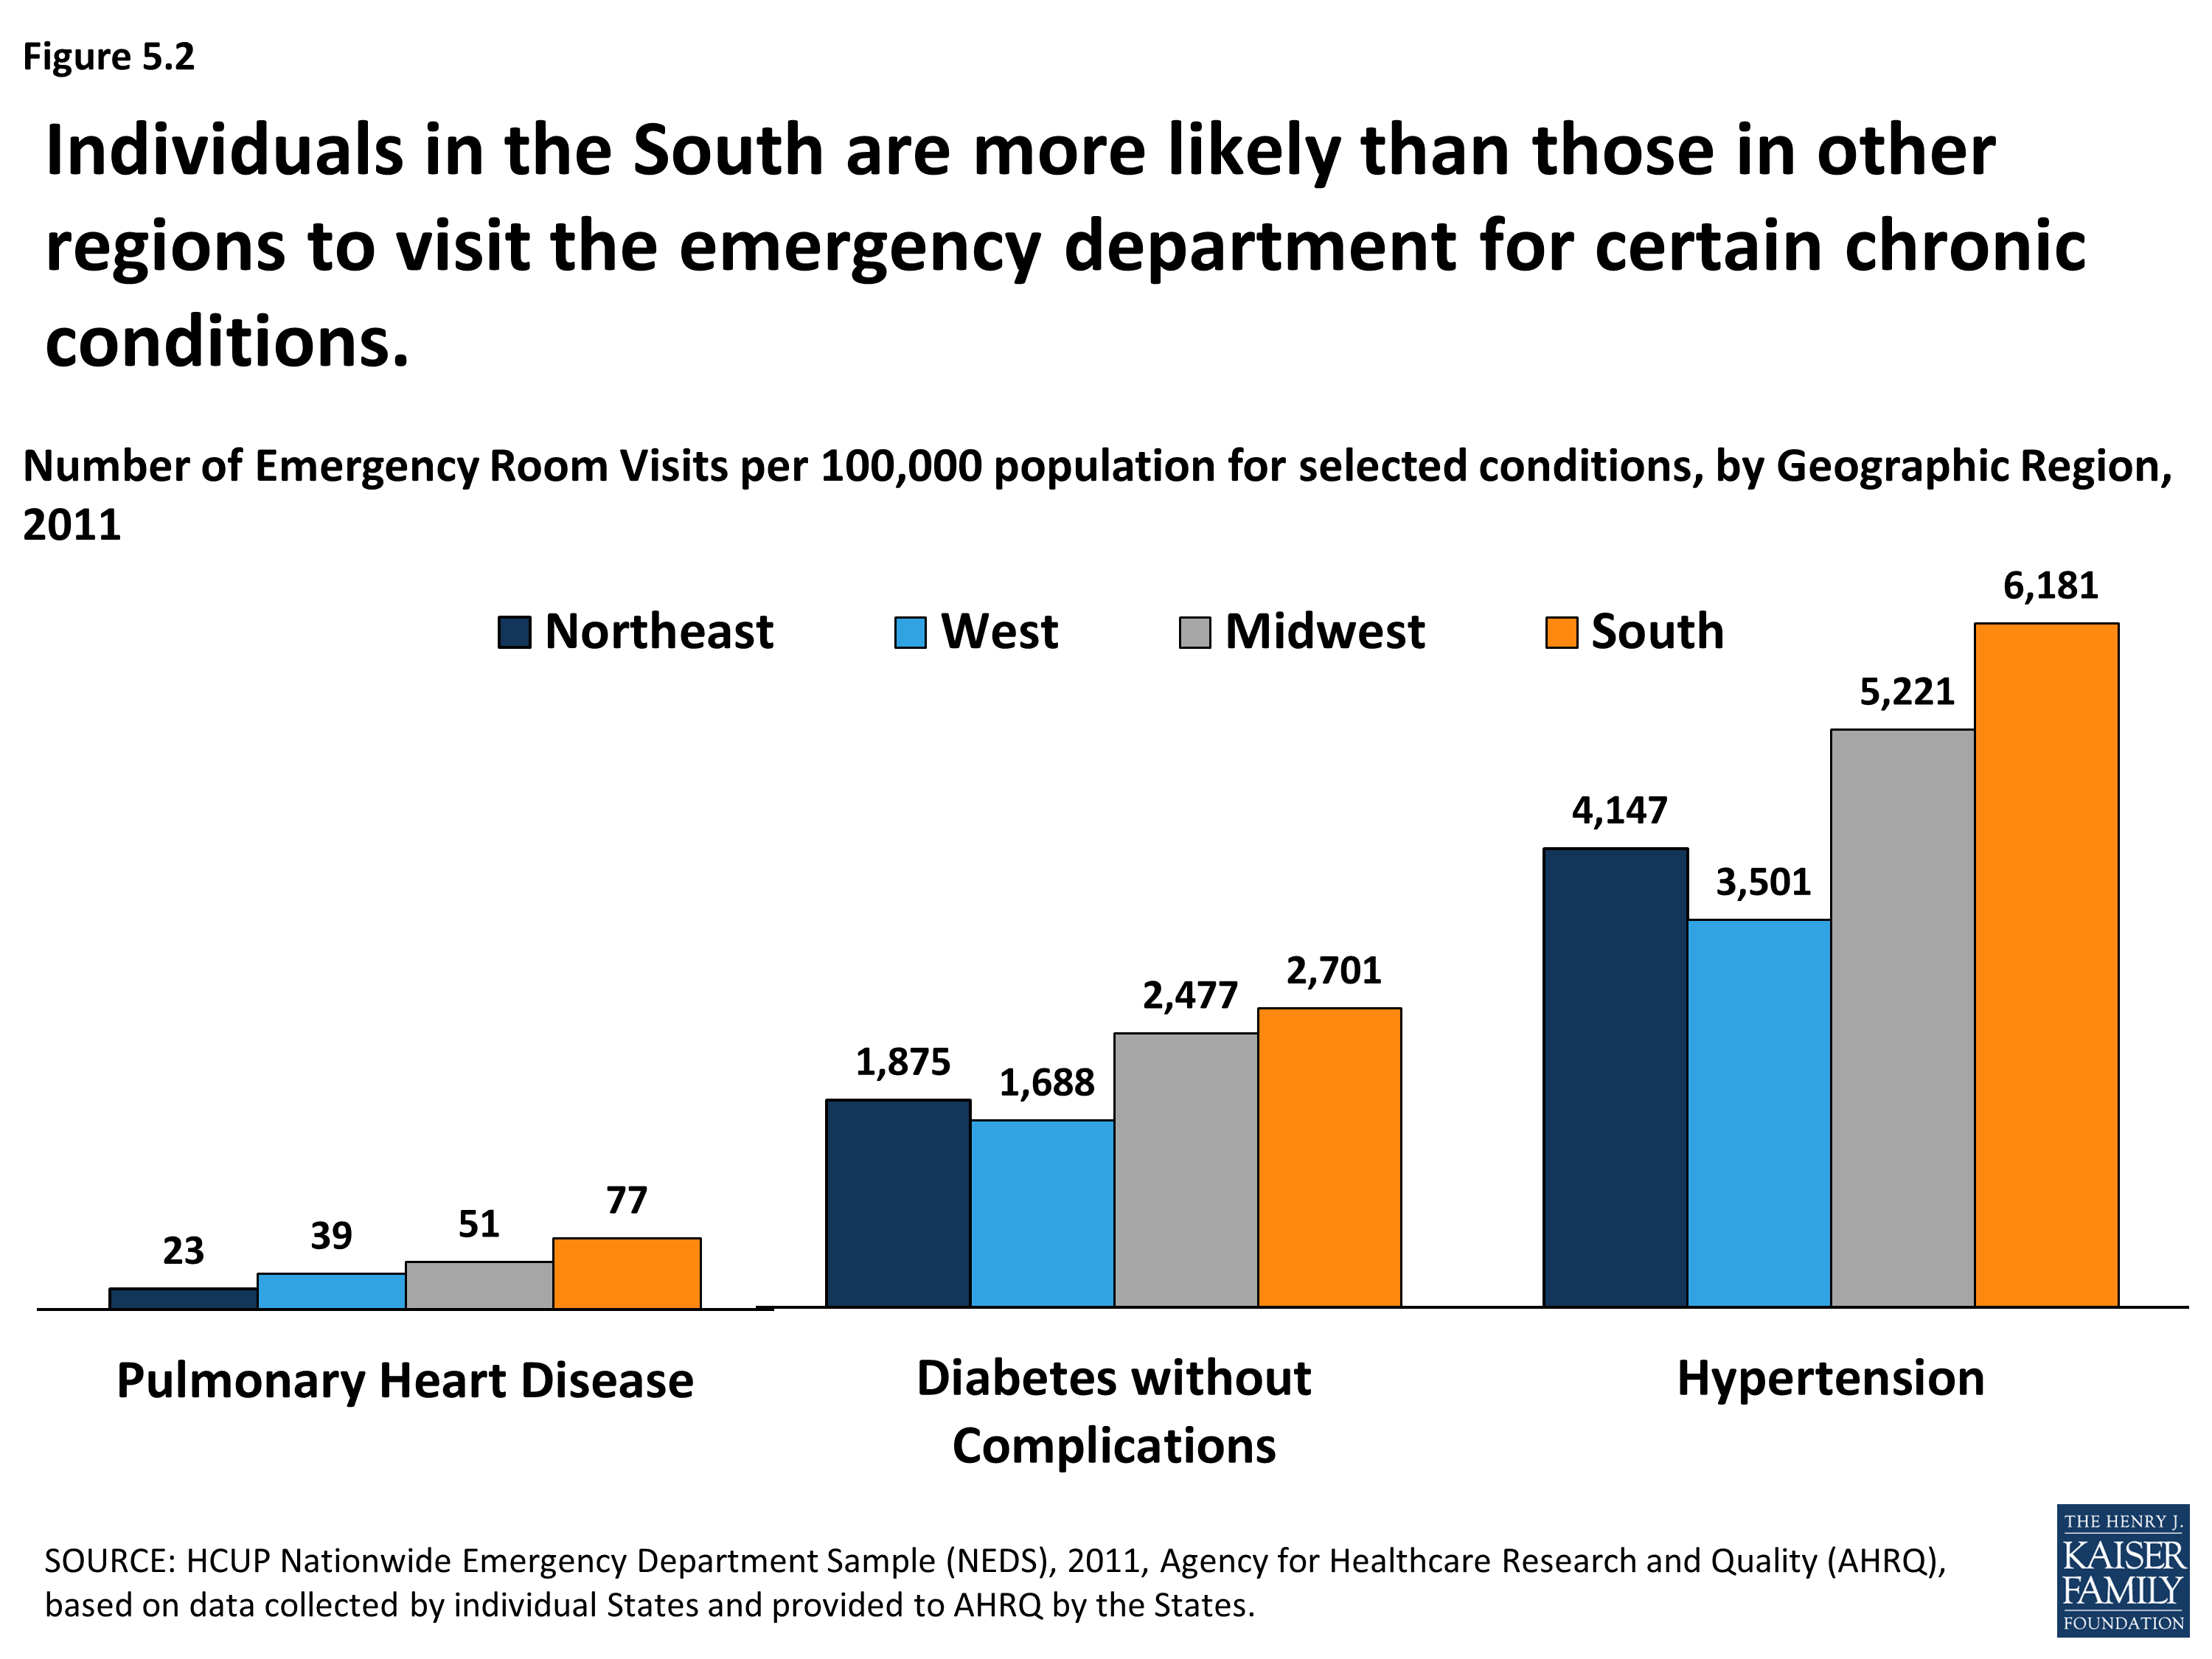
Number of Emergency Room Visits per 100,000 Population for Selected Conditions, by Geographic Region, 2011
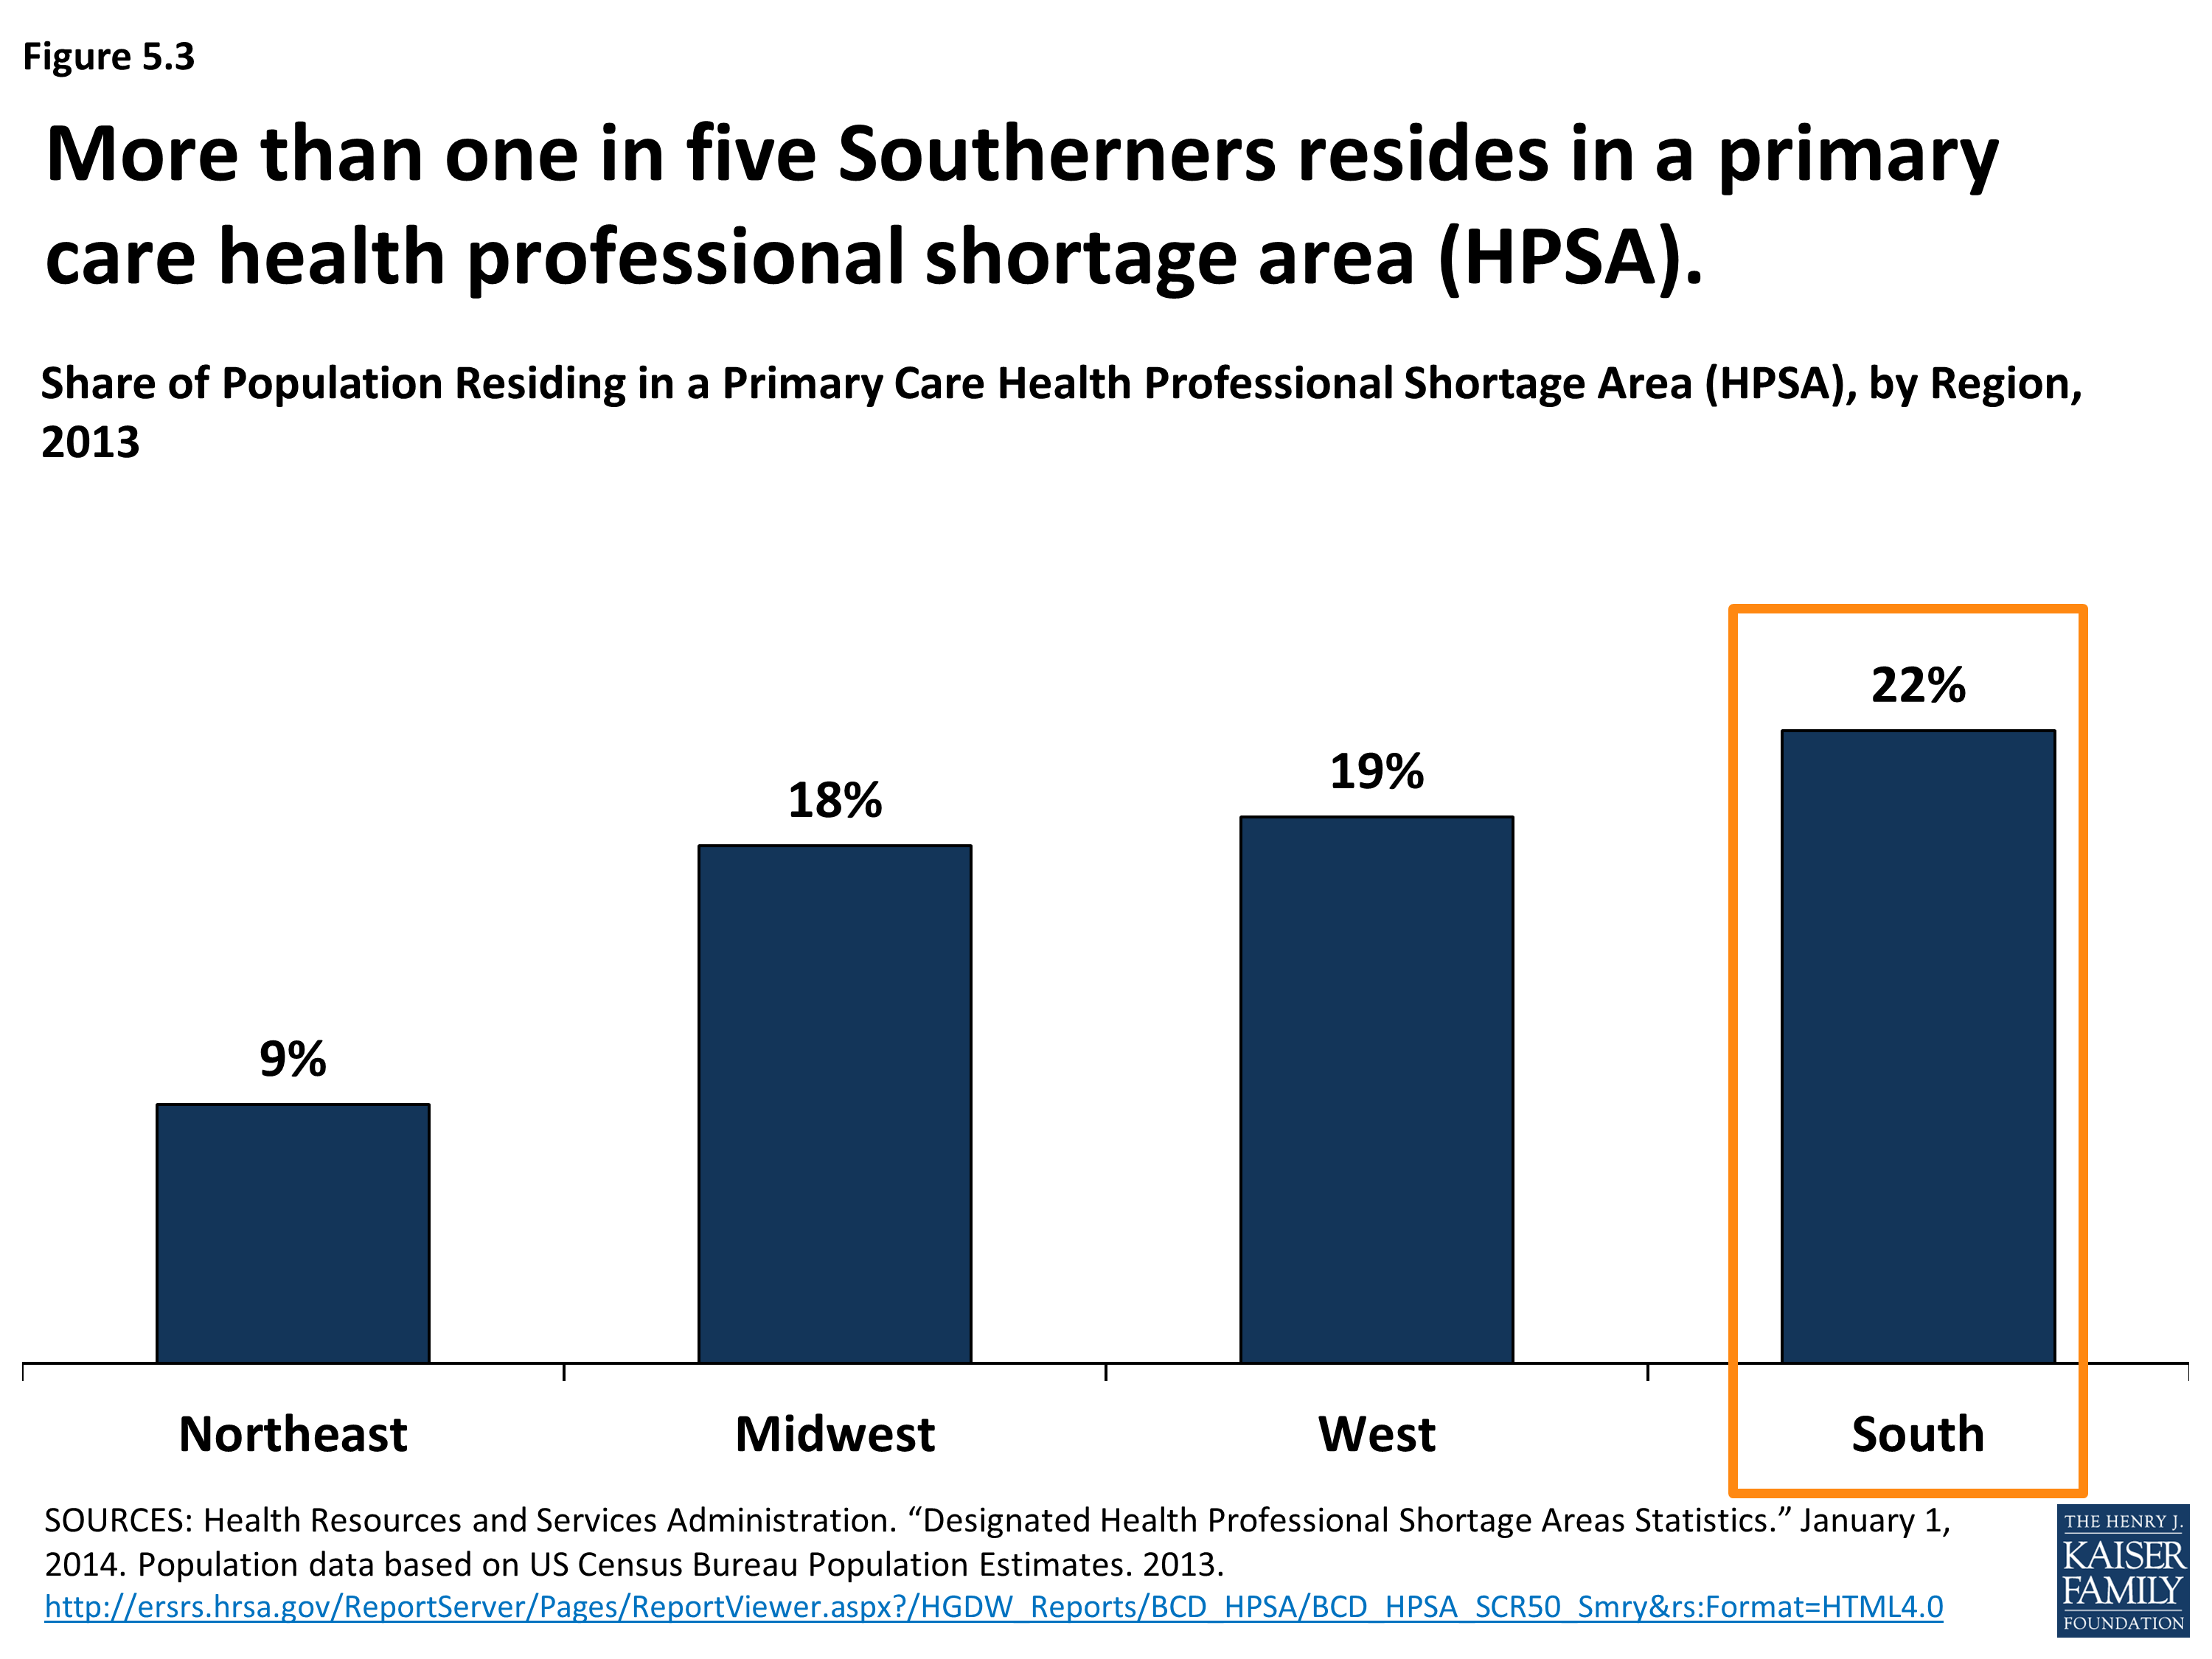
Share of Population Residing in a Primary Care Health Professional Shortage Area (HPSA) by Region, 2013
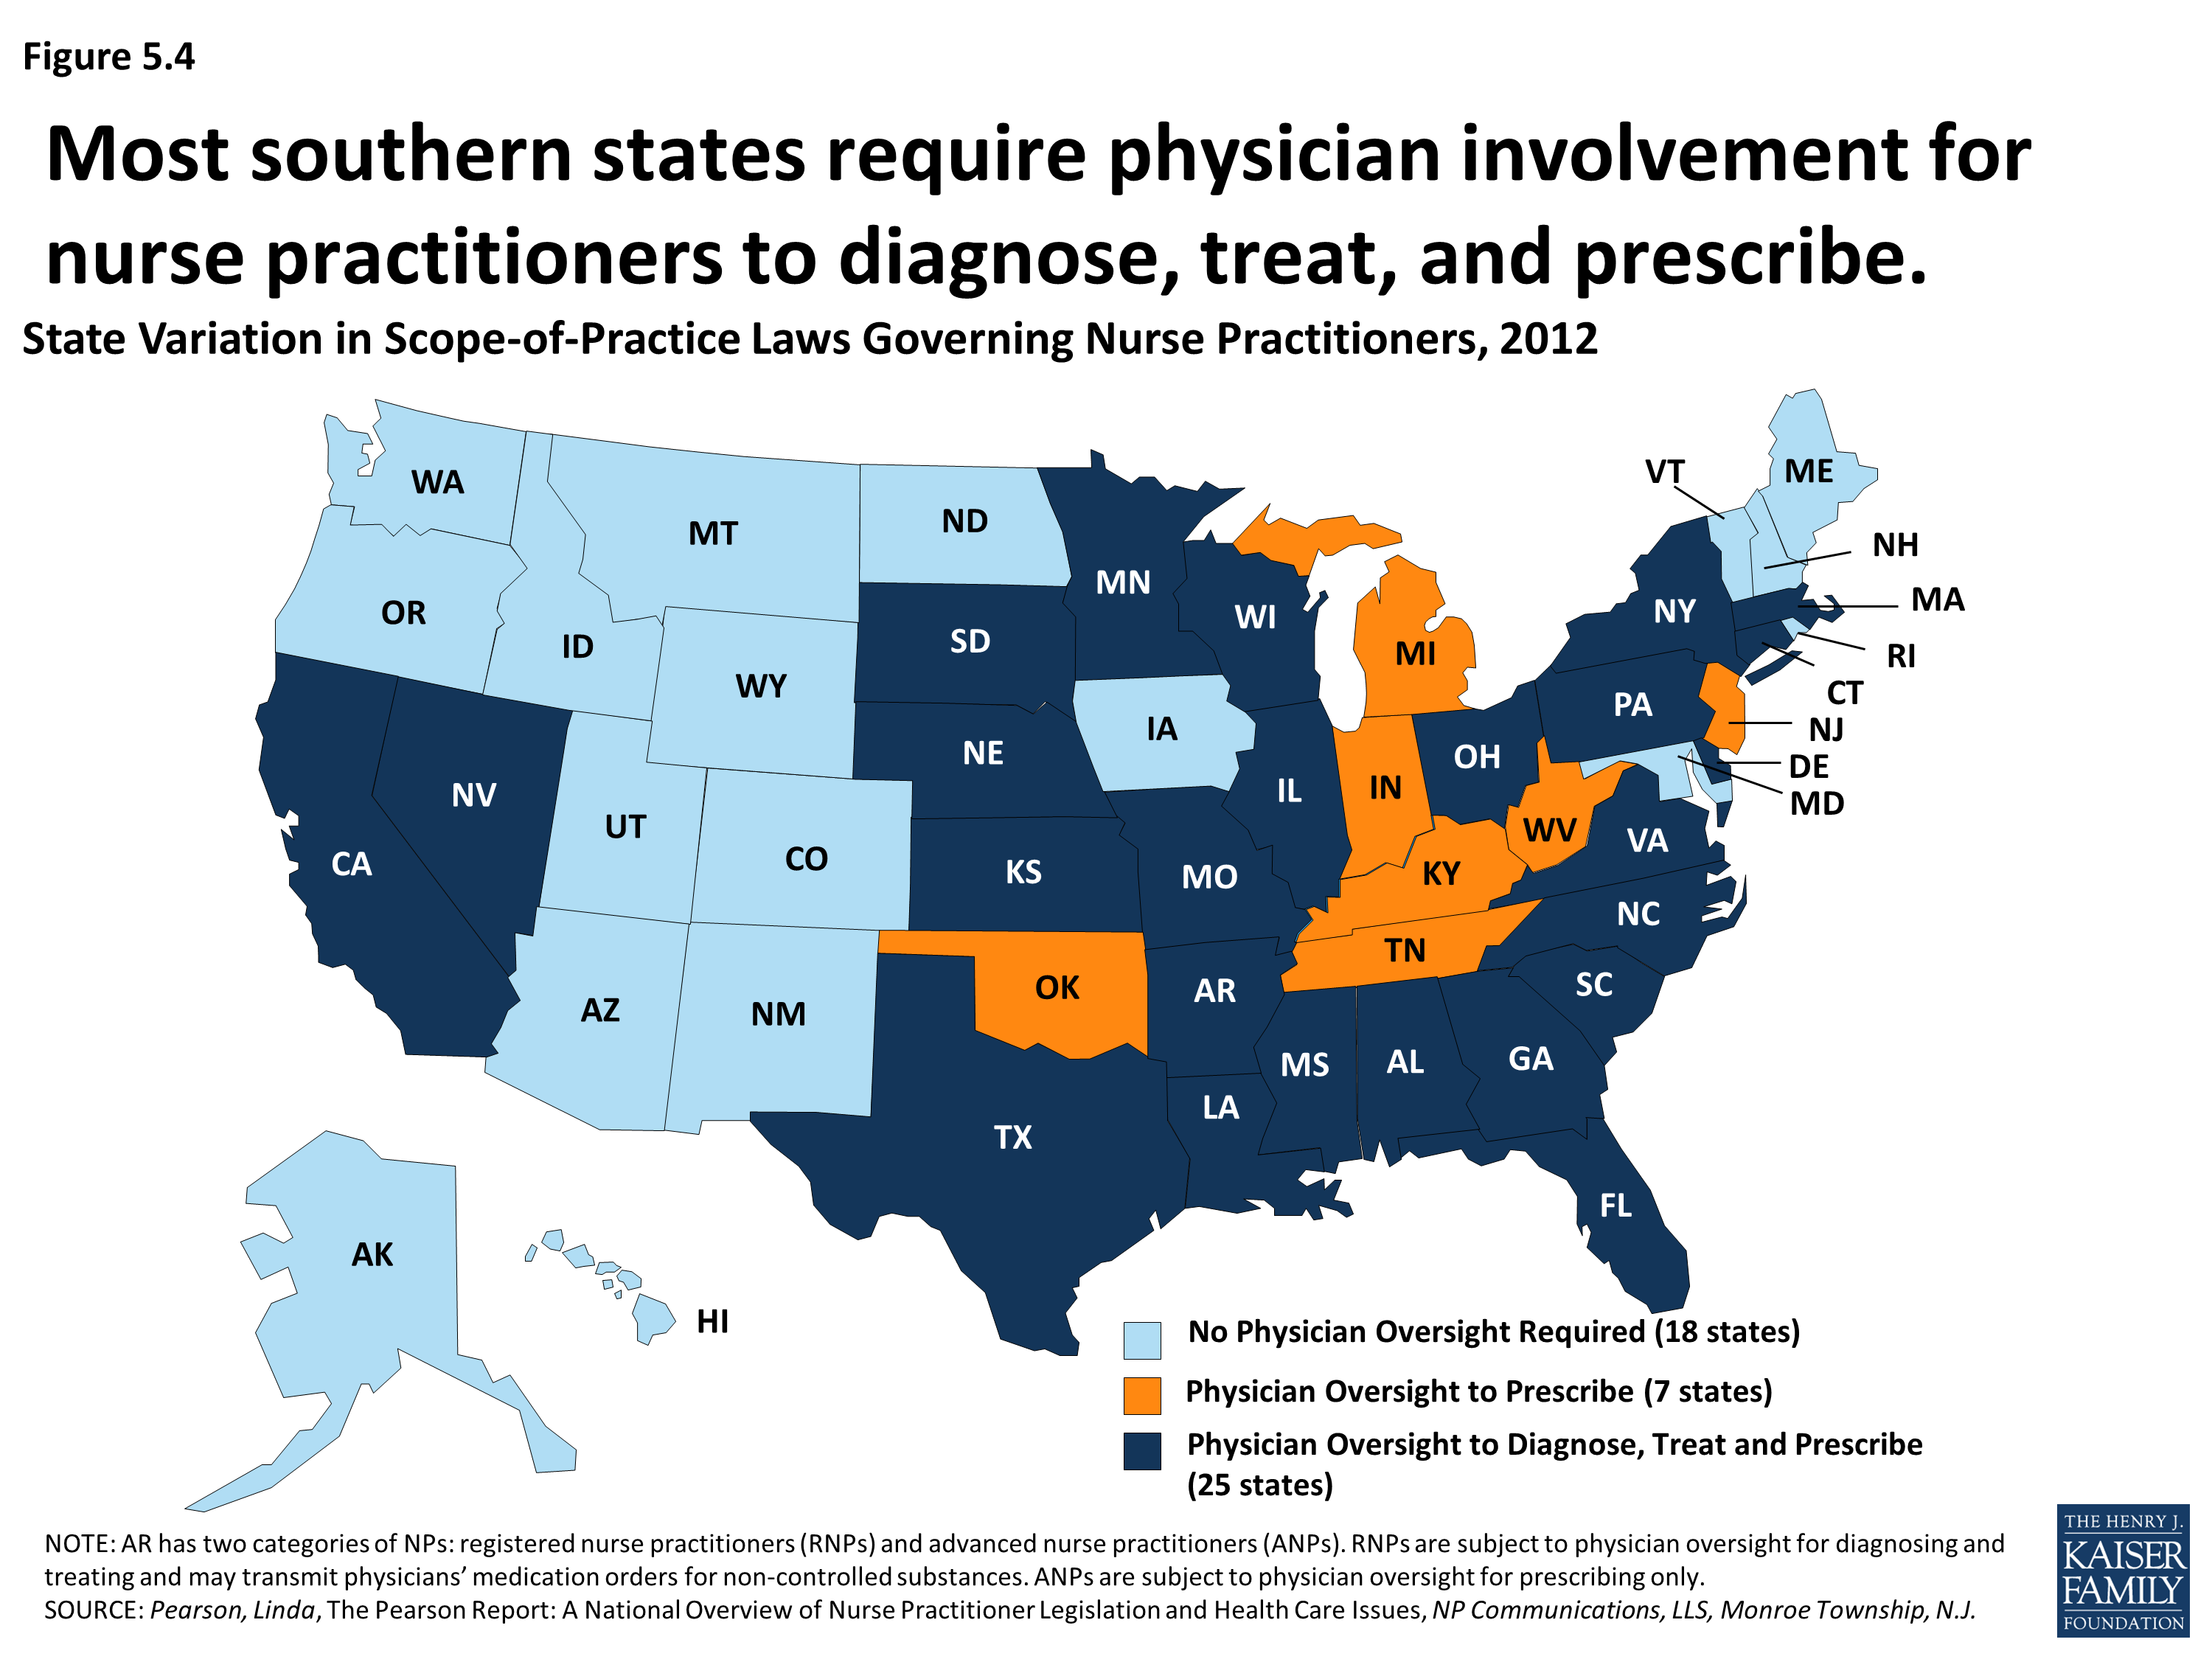
State Variation in Scope-of-Practice Laws Governing Nurse Practitioners, 2012
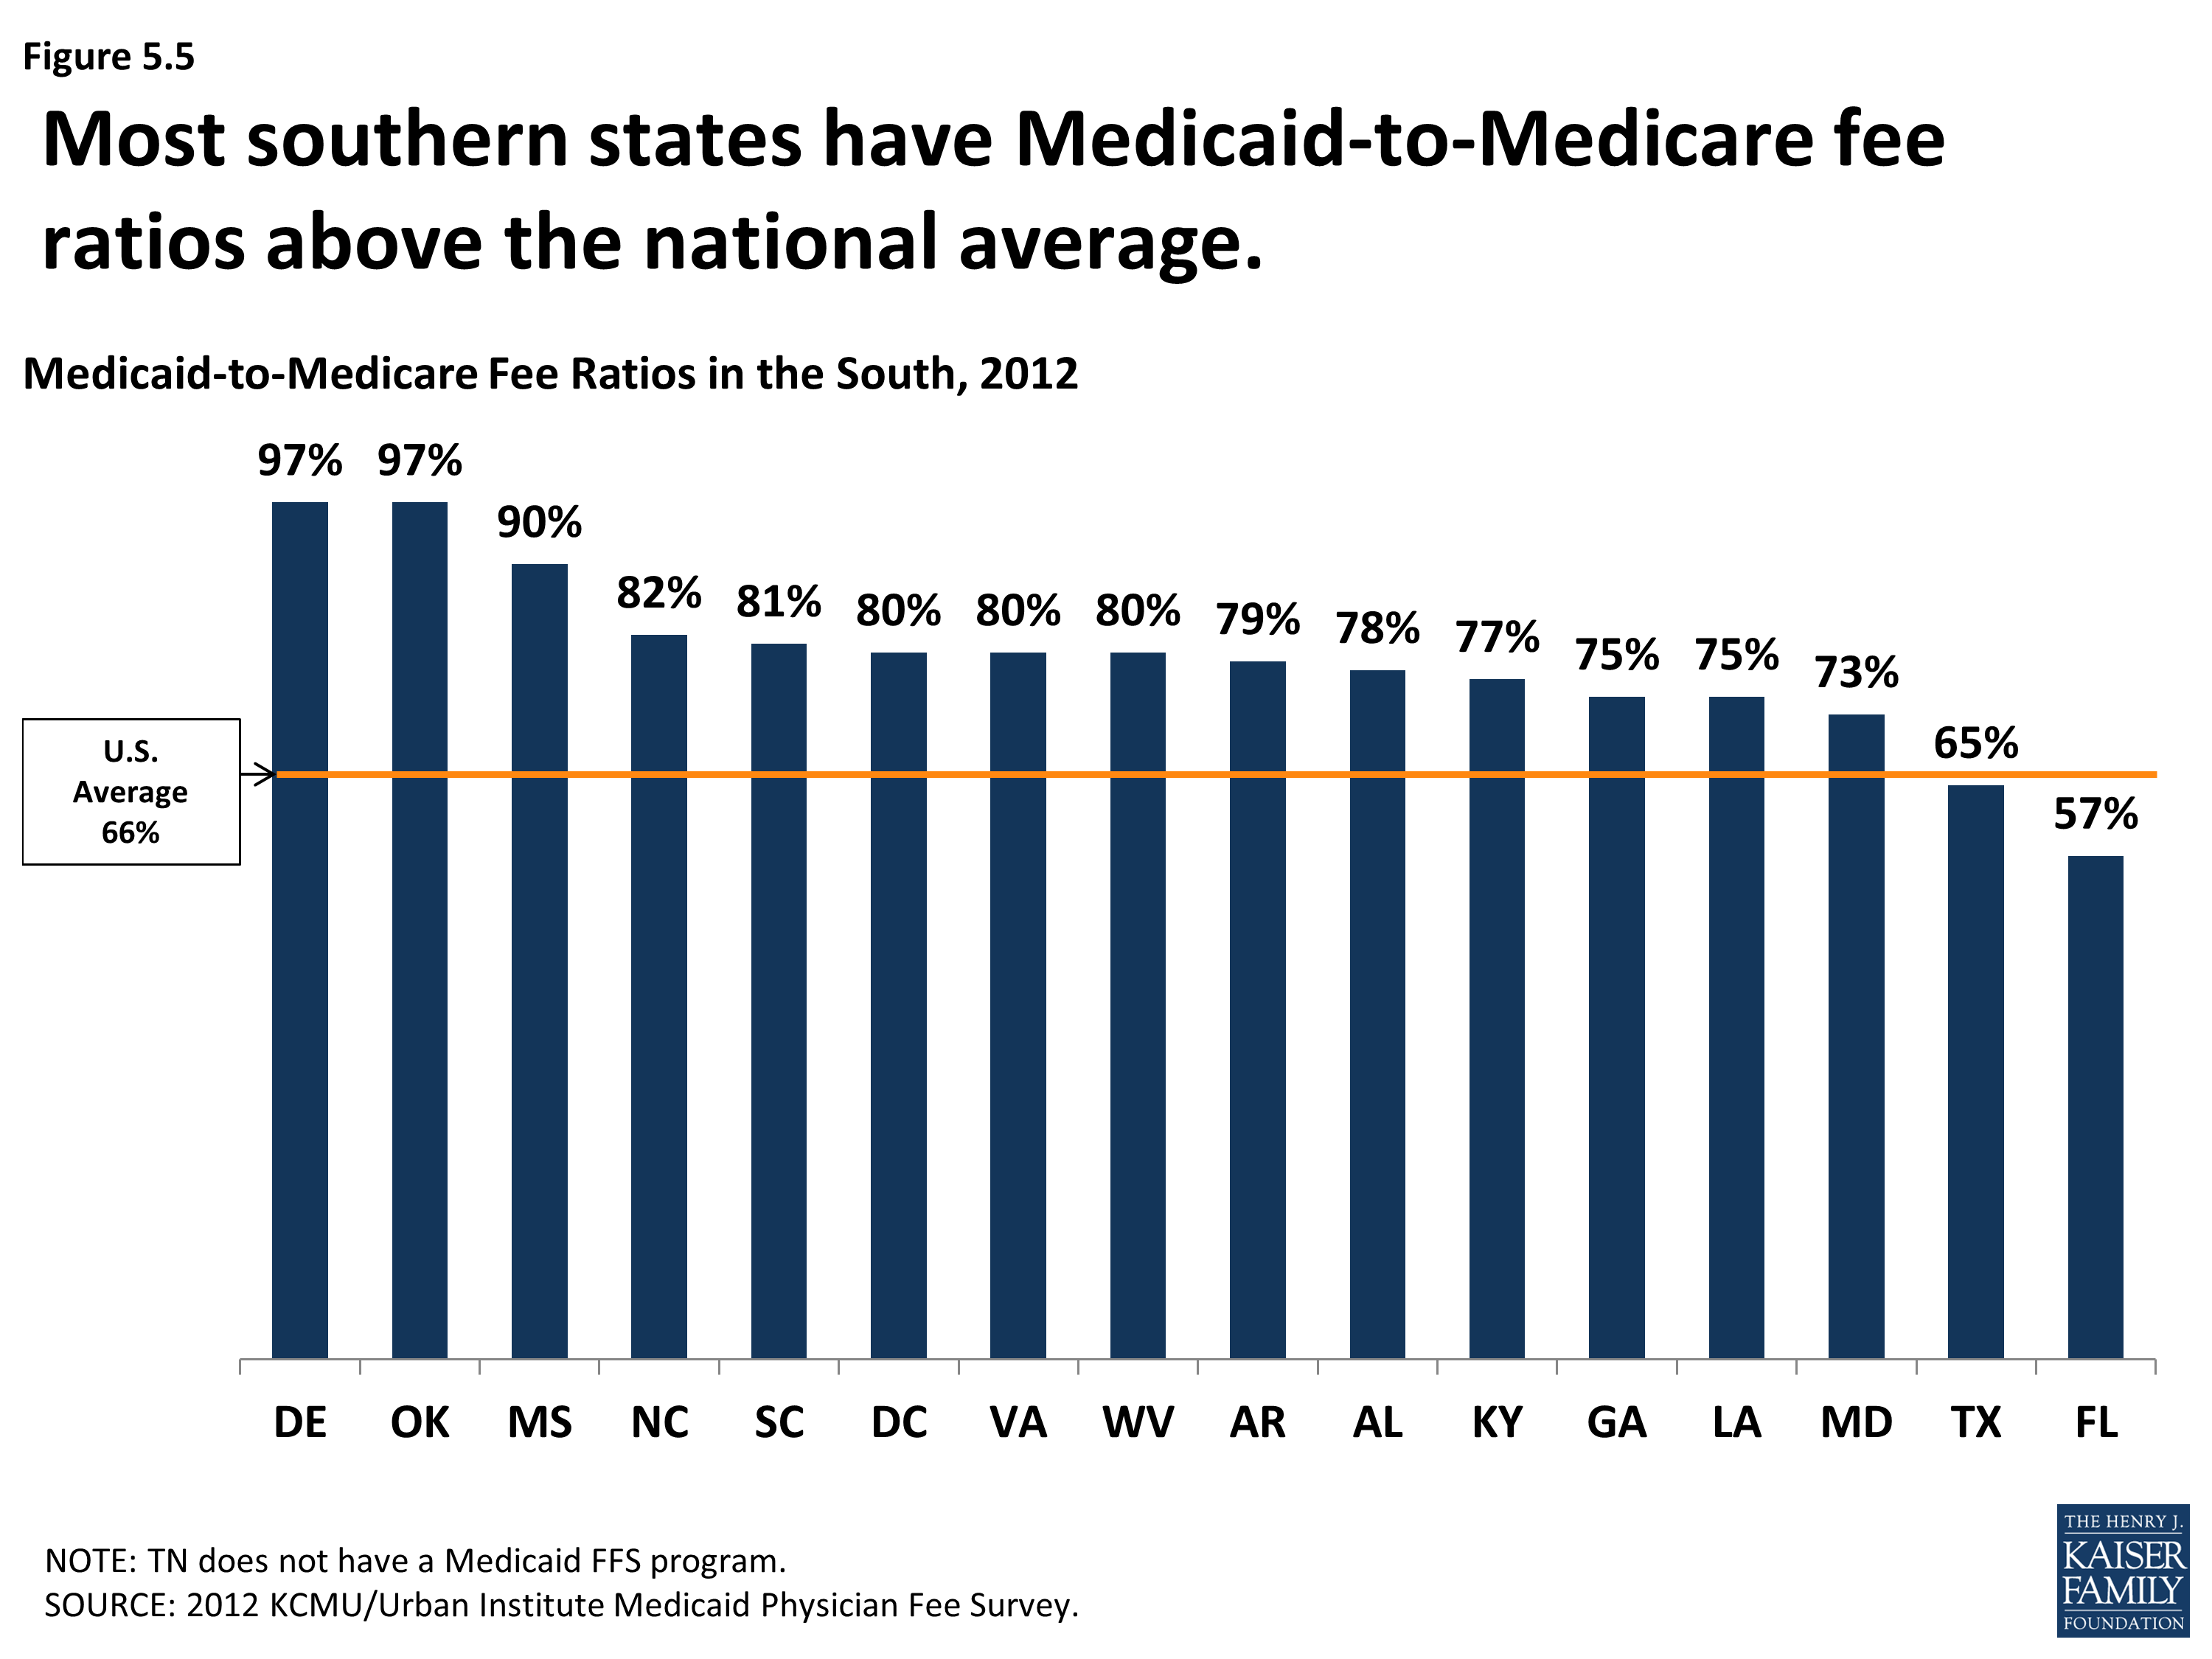
Medicaid-to-Medicare Fee Ratios in the South, 2012
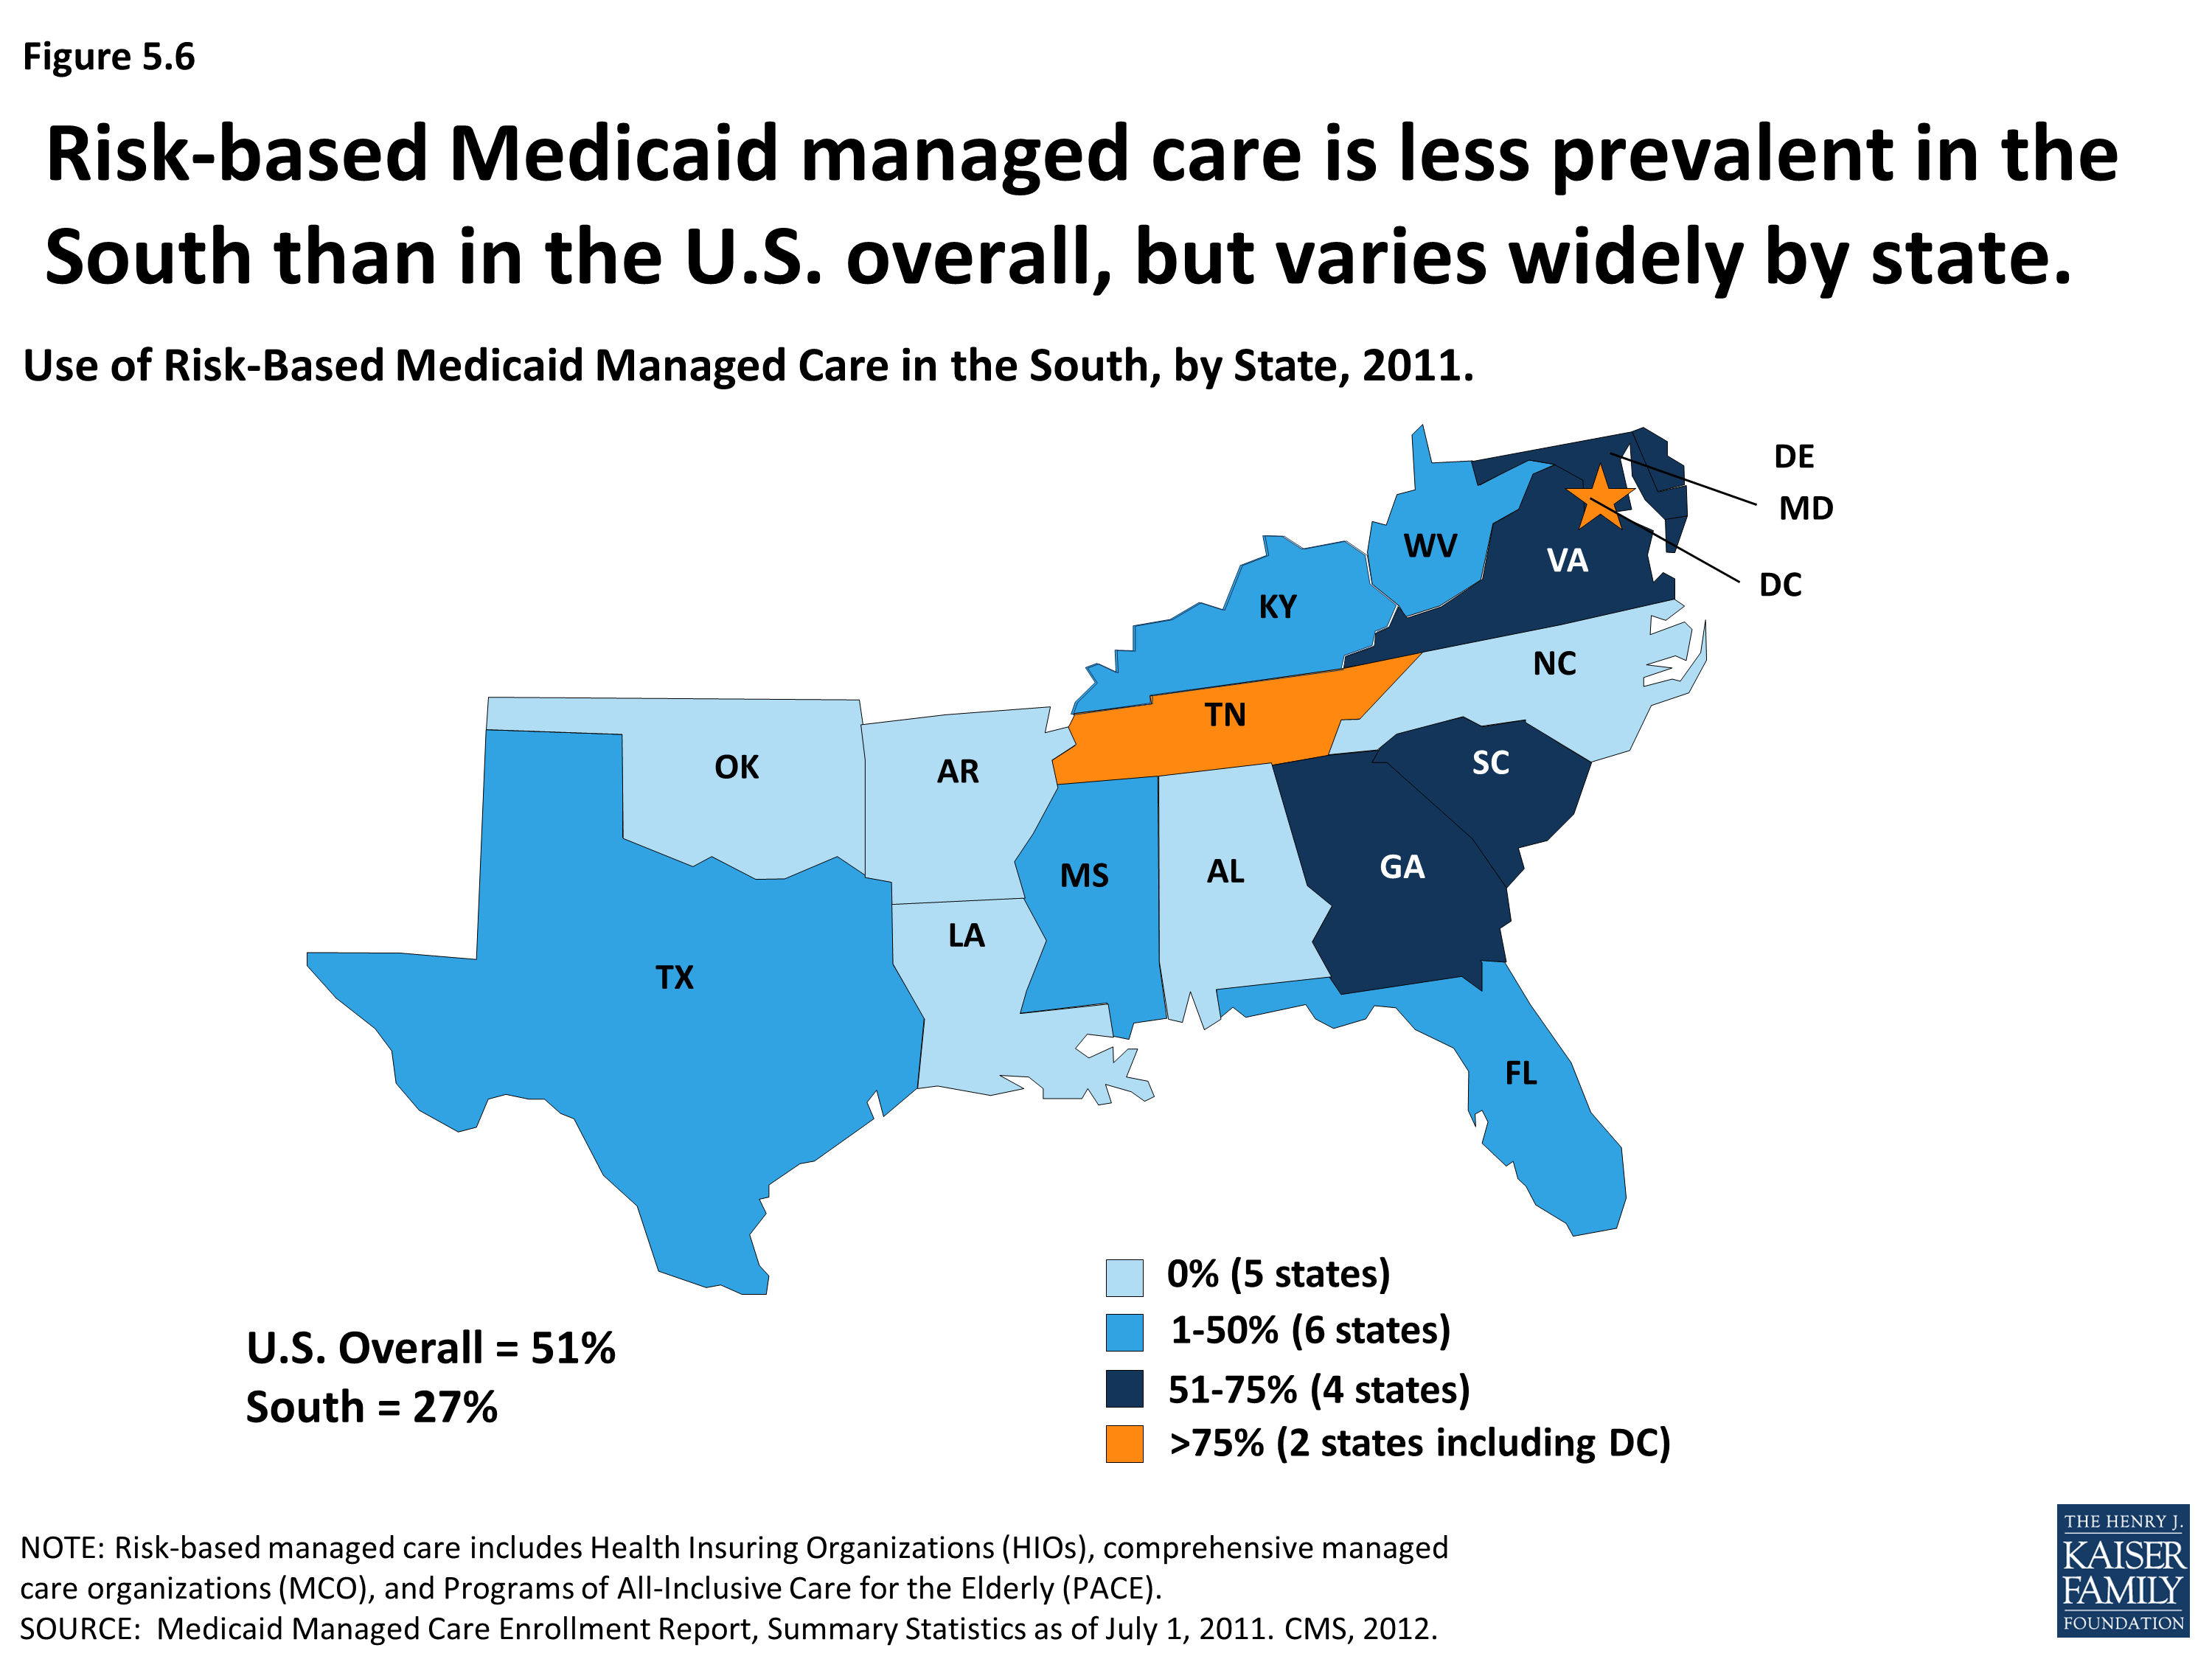
Use of Risk-Based Medicaid Managed Care in the South, by State, 2011
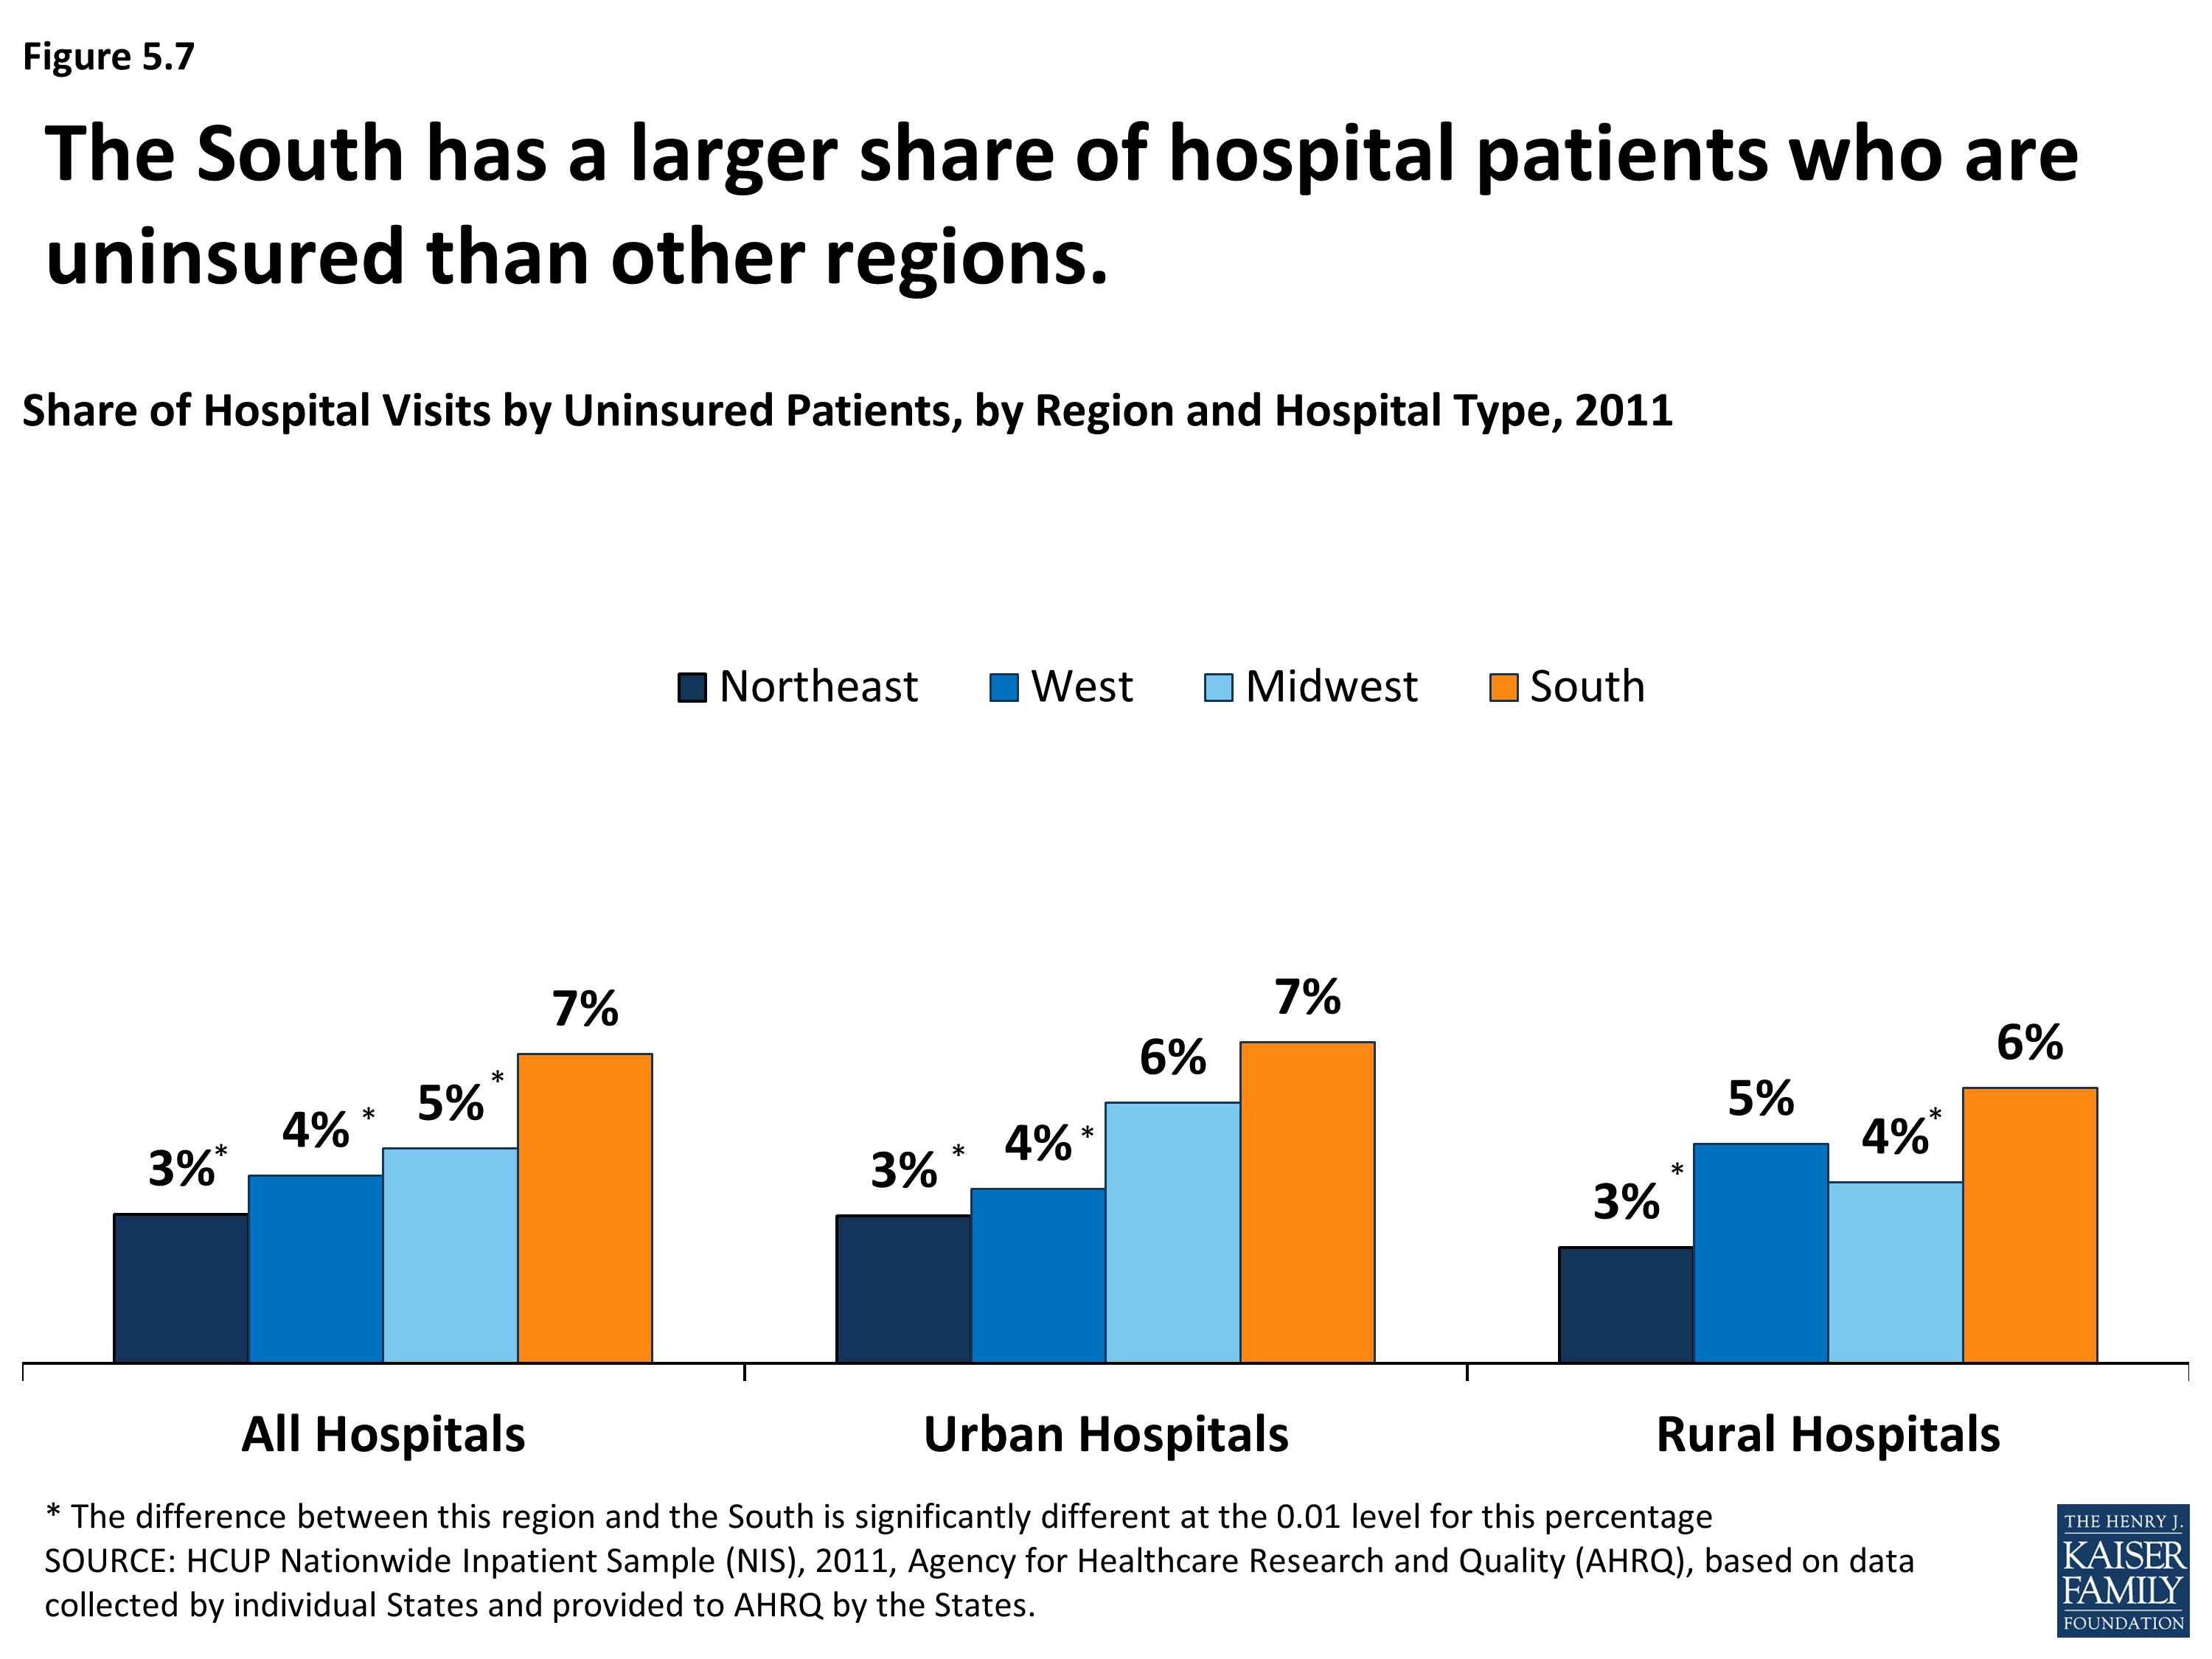
Share of Hospital Patients by Uninsured Patients, by Region and Hospital Type, 2011
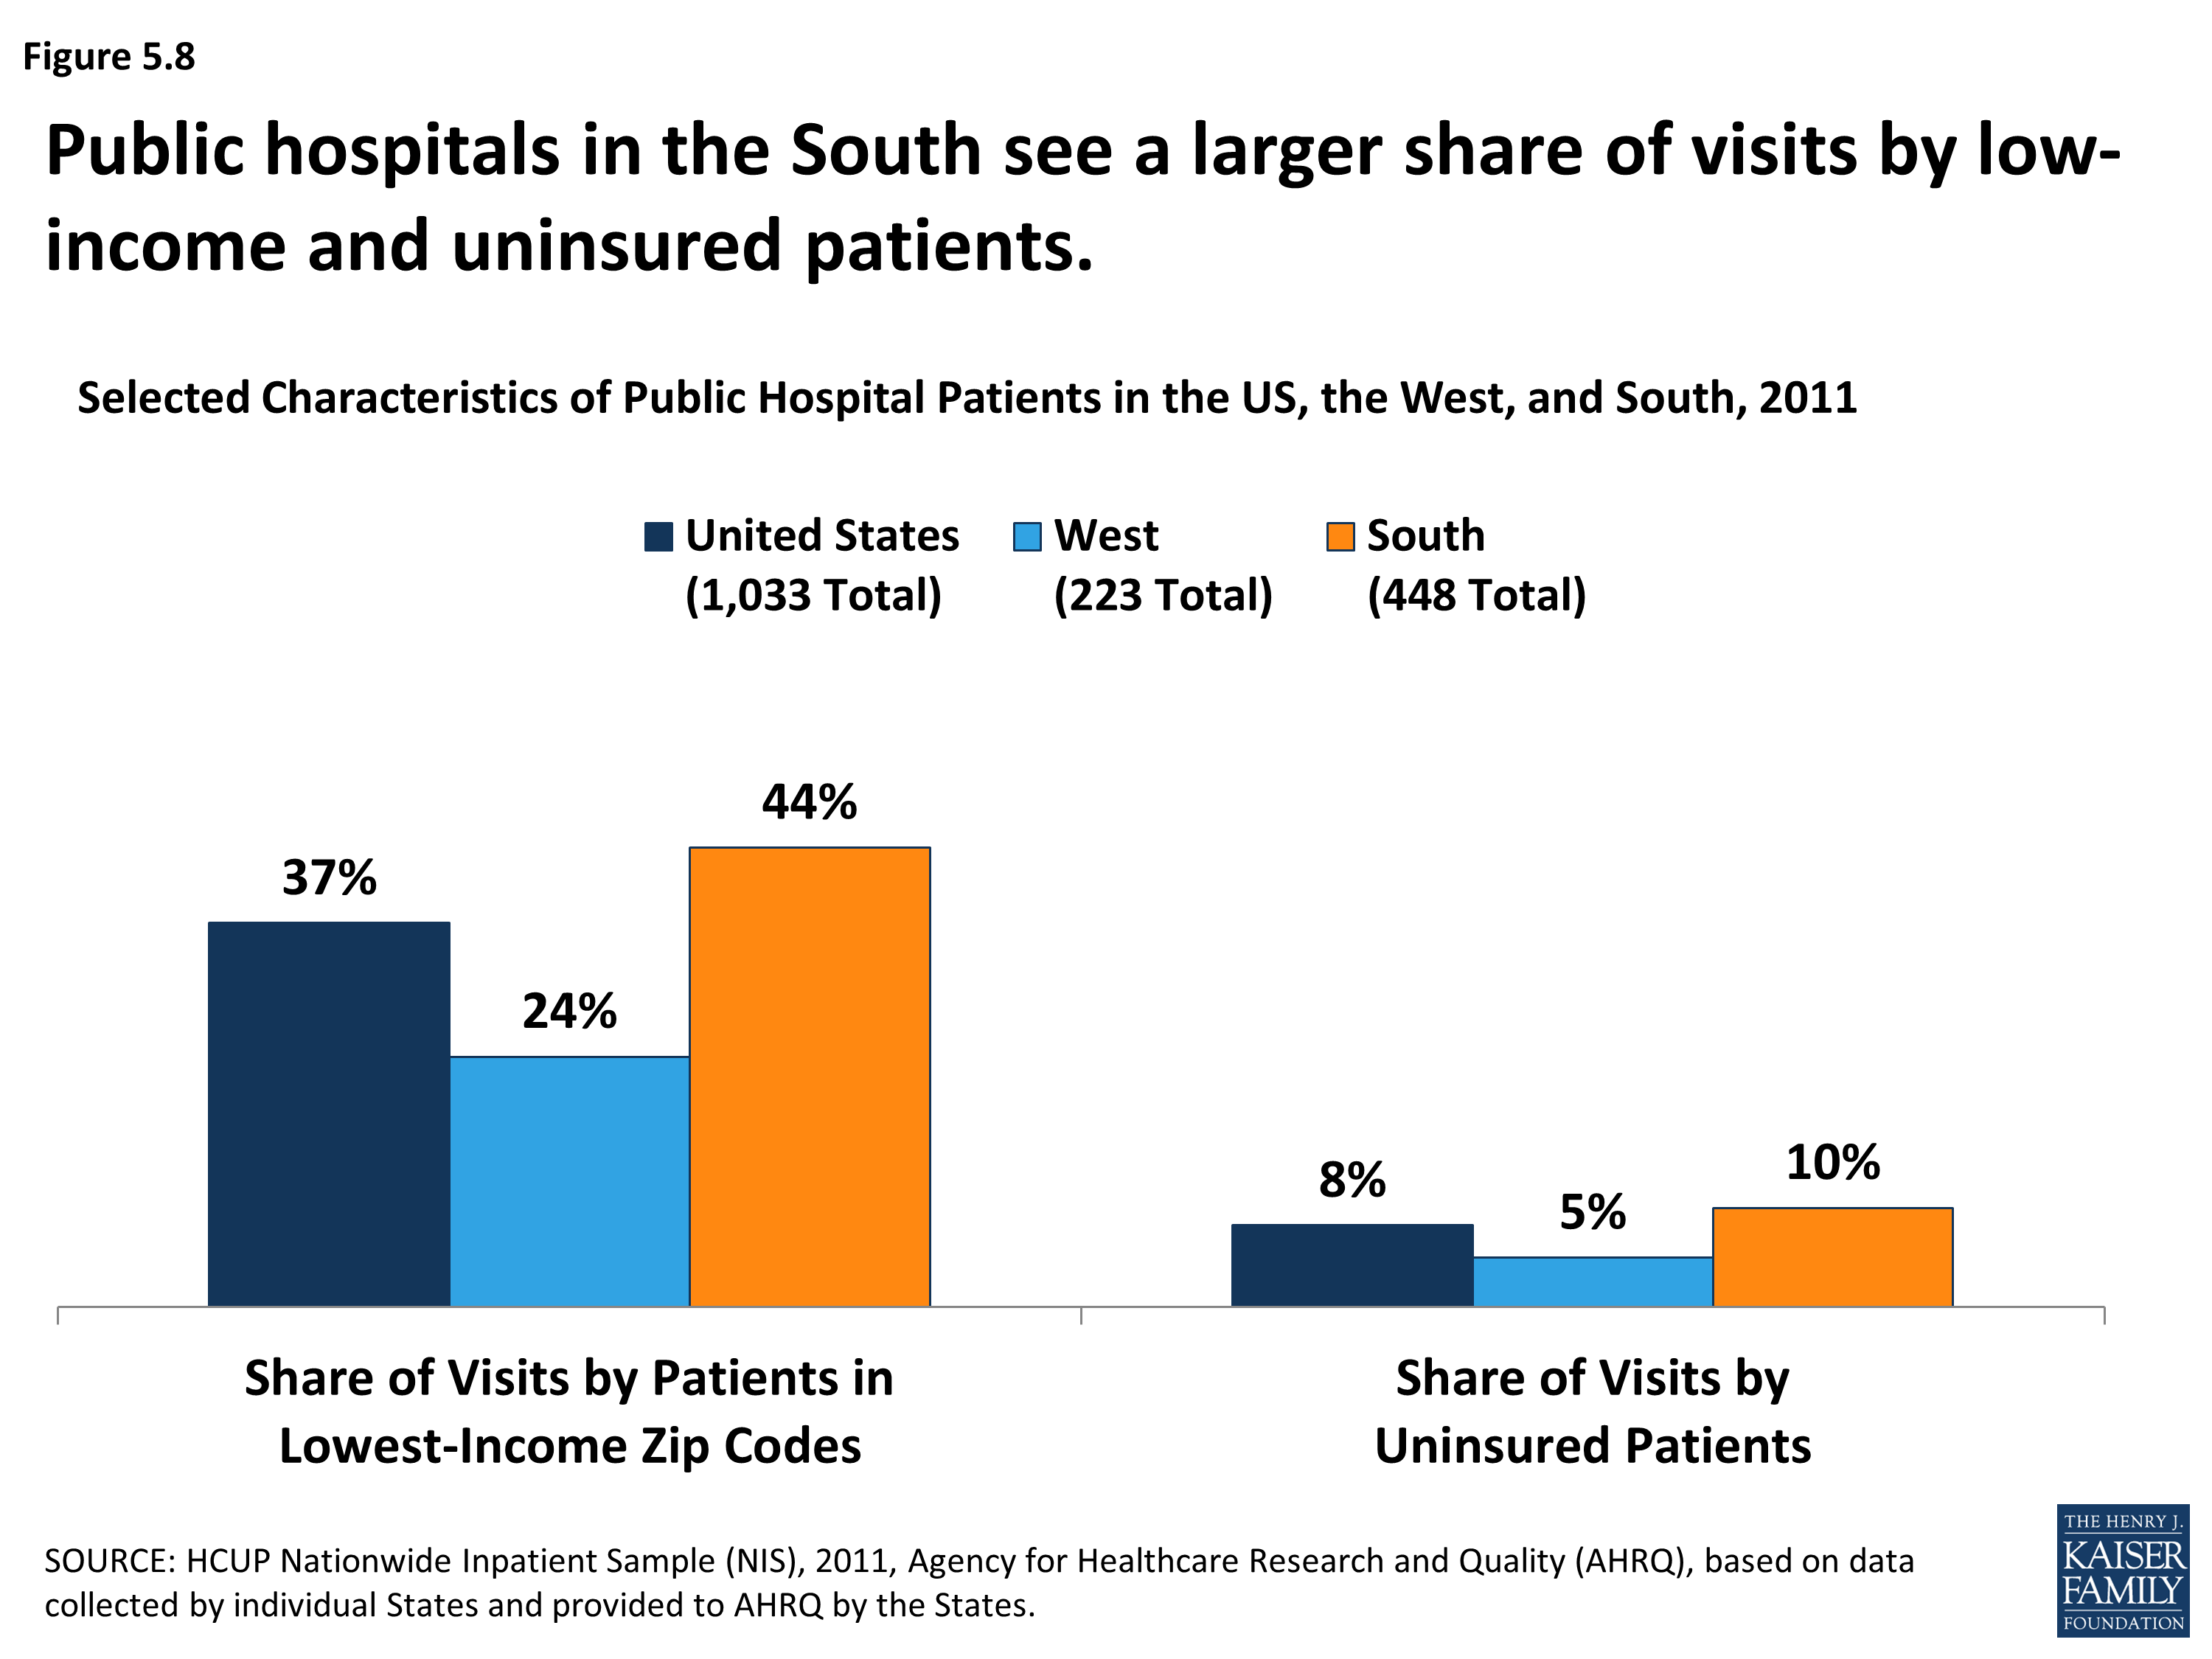
Selected Characteristics of Public Hospital Patients in the United States, the West, and South, 2011
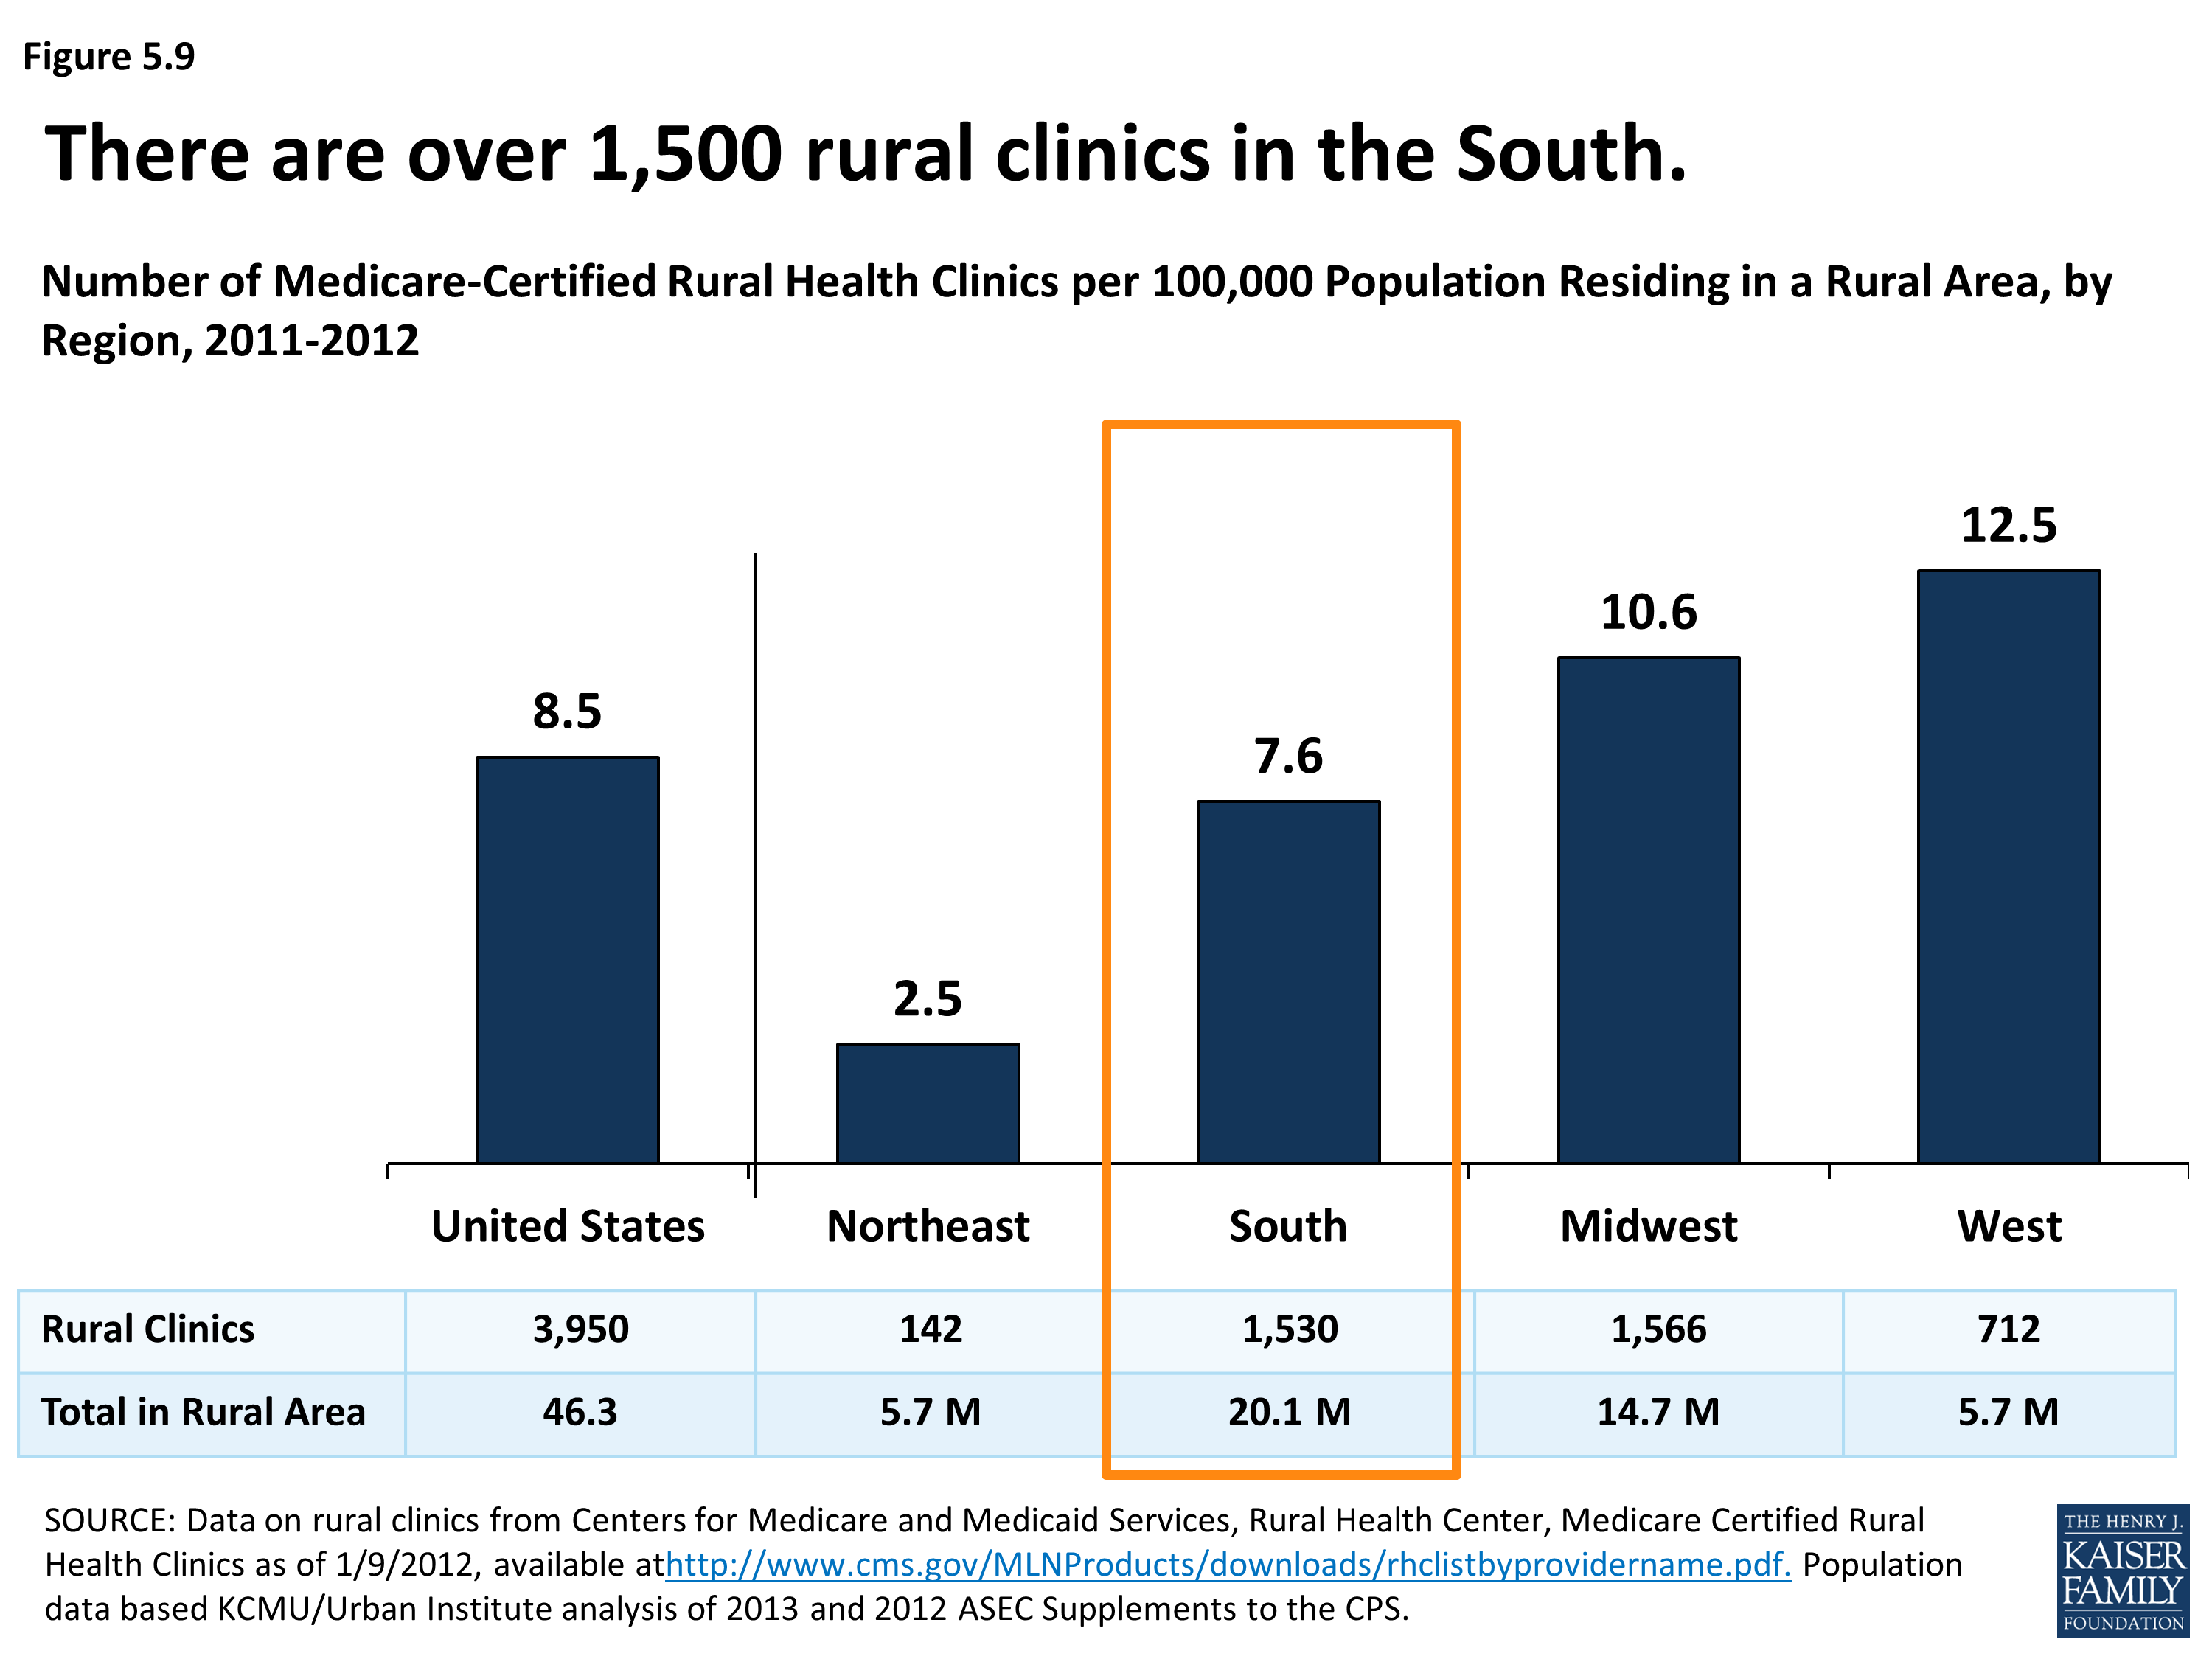
Number of Medicare-Certified Rural Health Clinics per 100,000 Population Residing in a Rural Area, by Region, 2011-2012
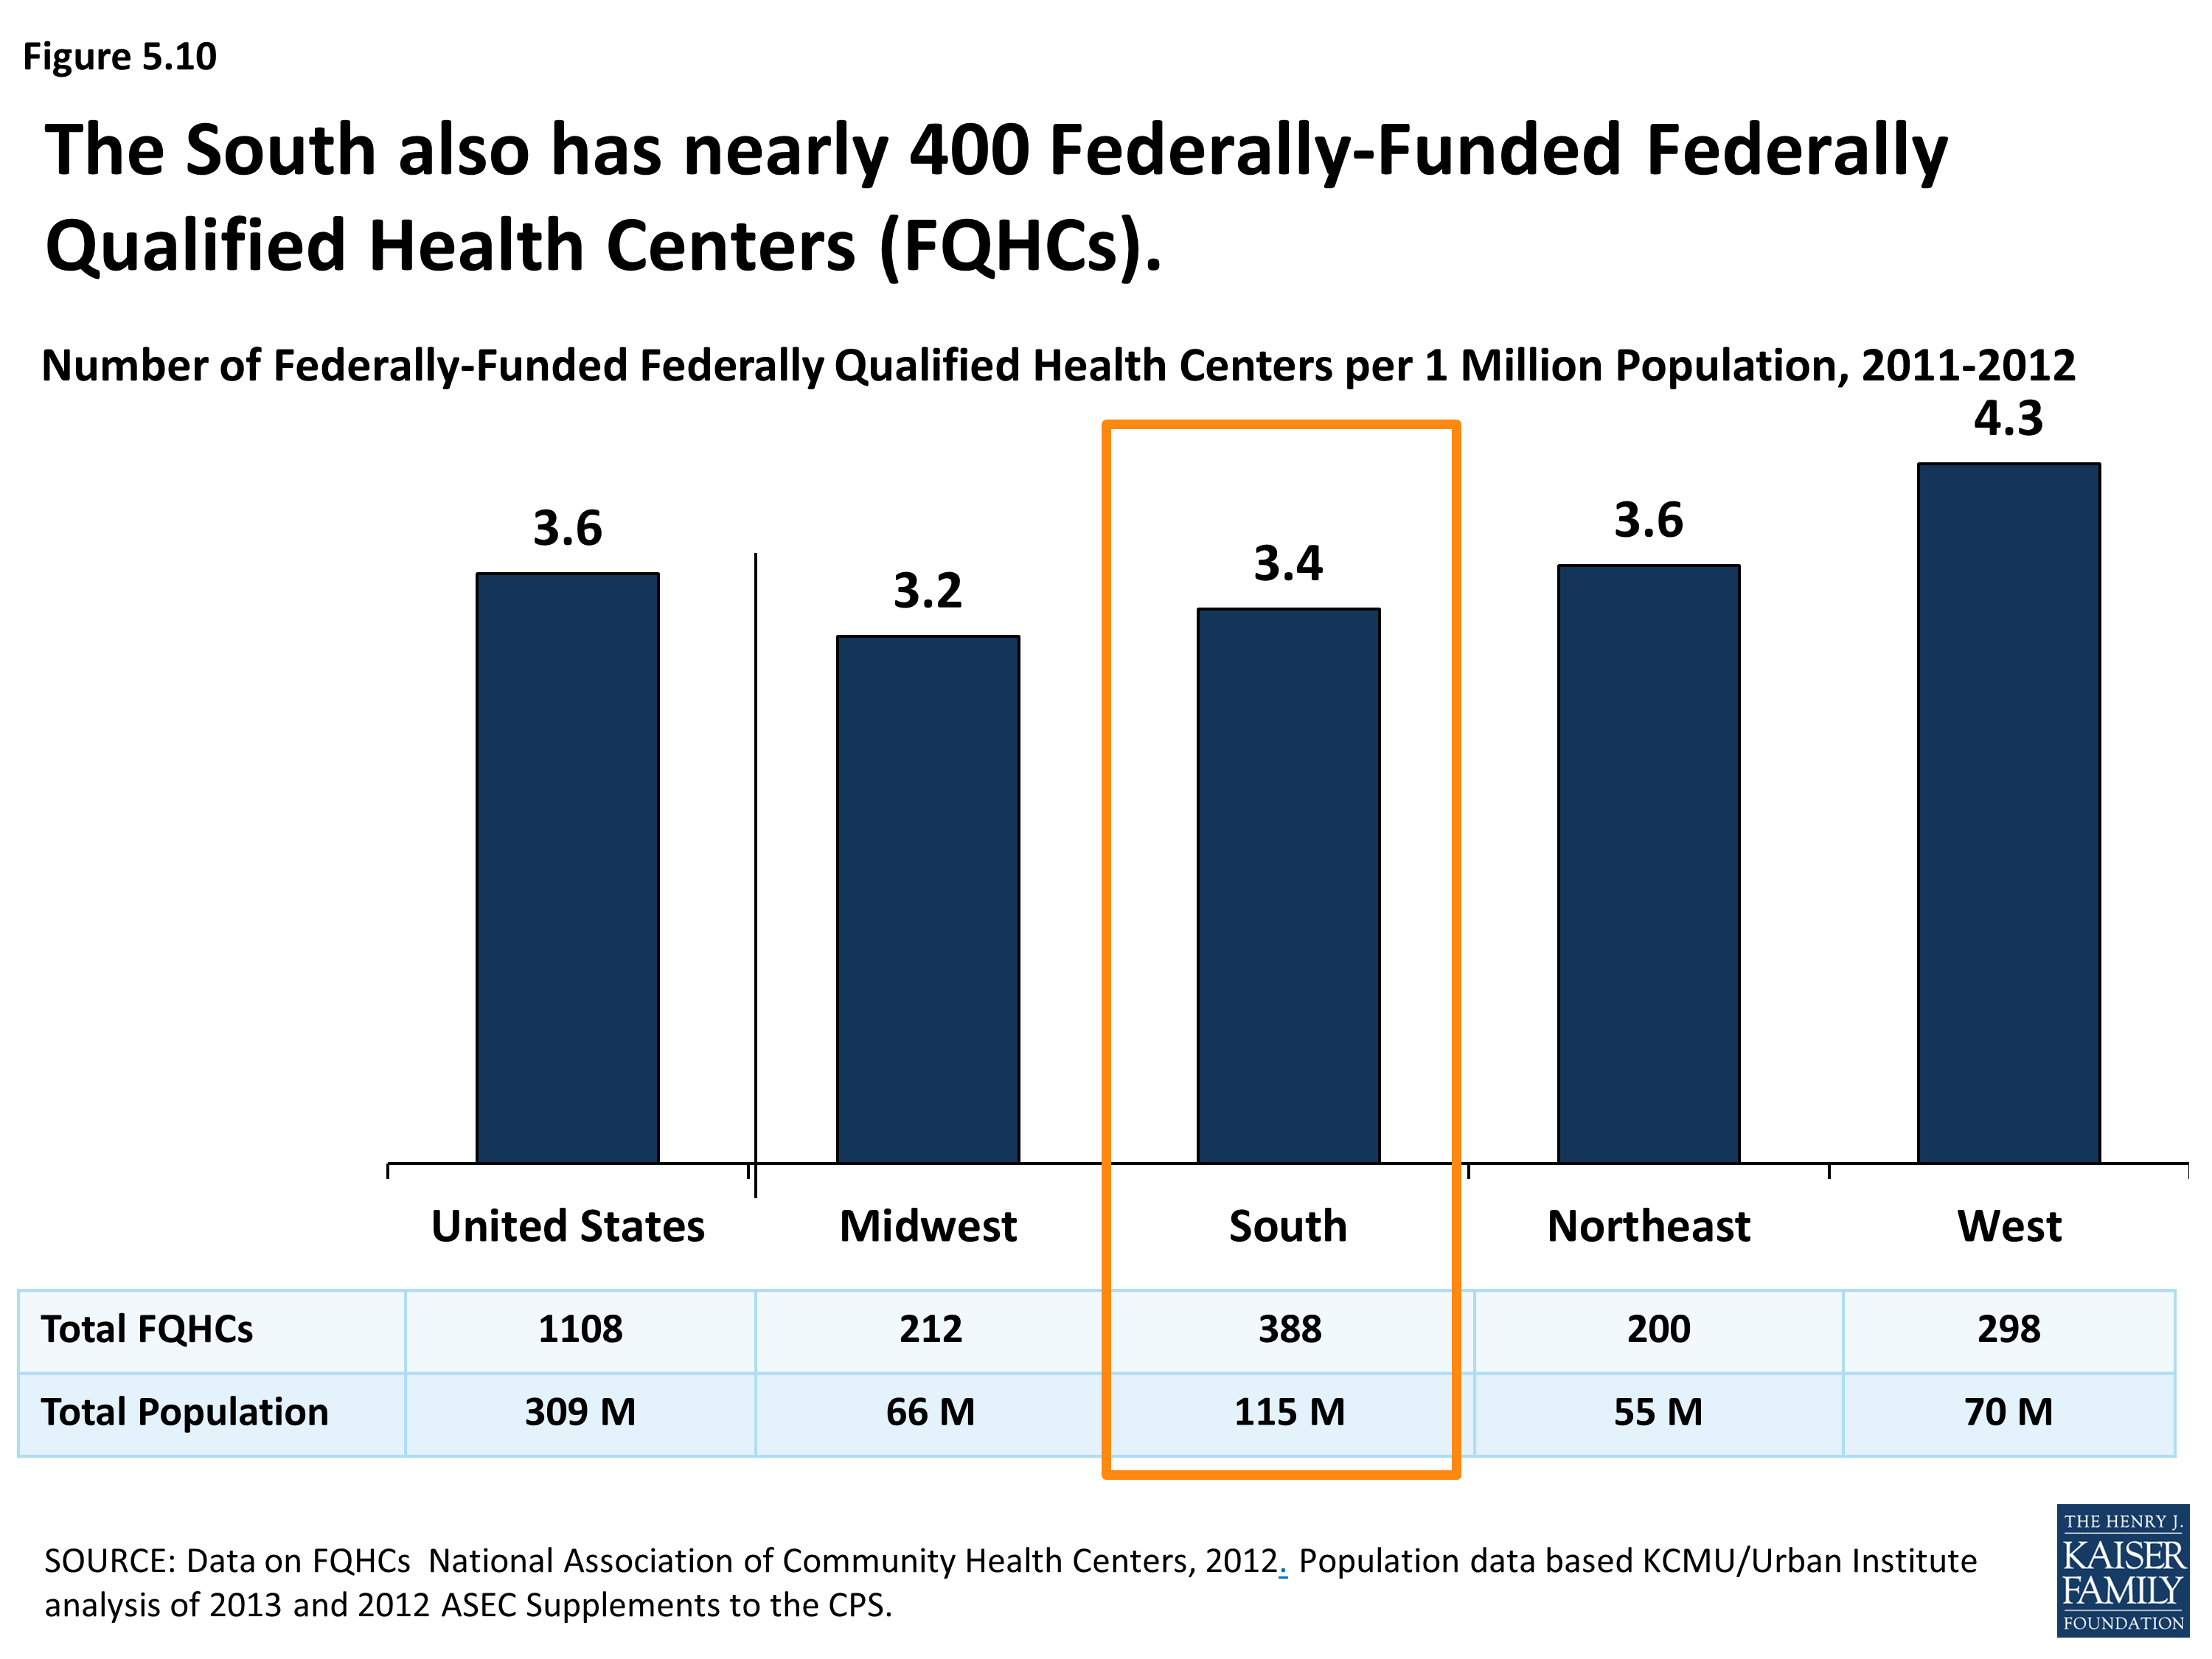
Number of Federally-Funded Federally Qualified Health Centers per 1 Million Population, 2011-2012
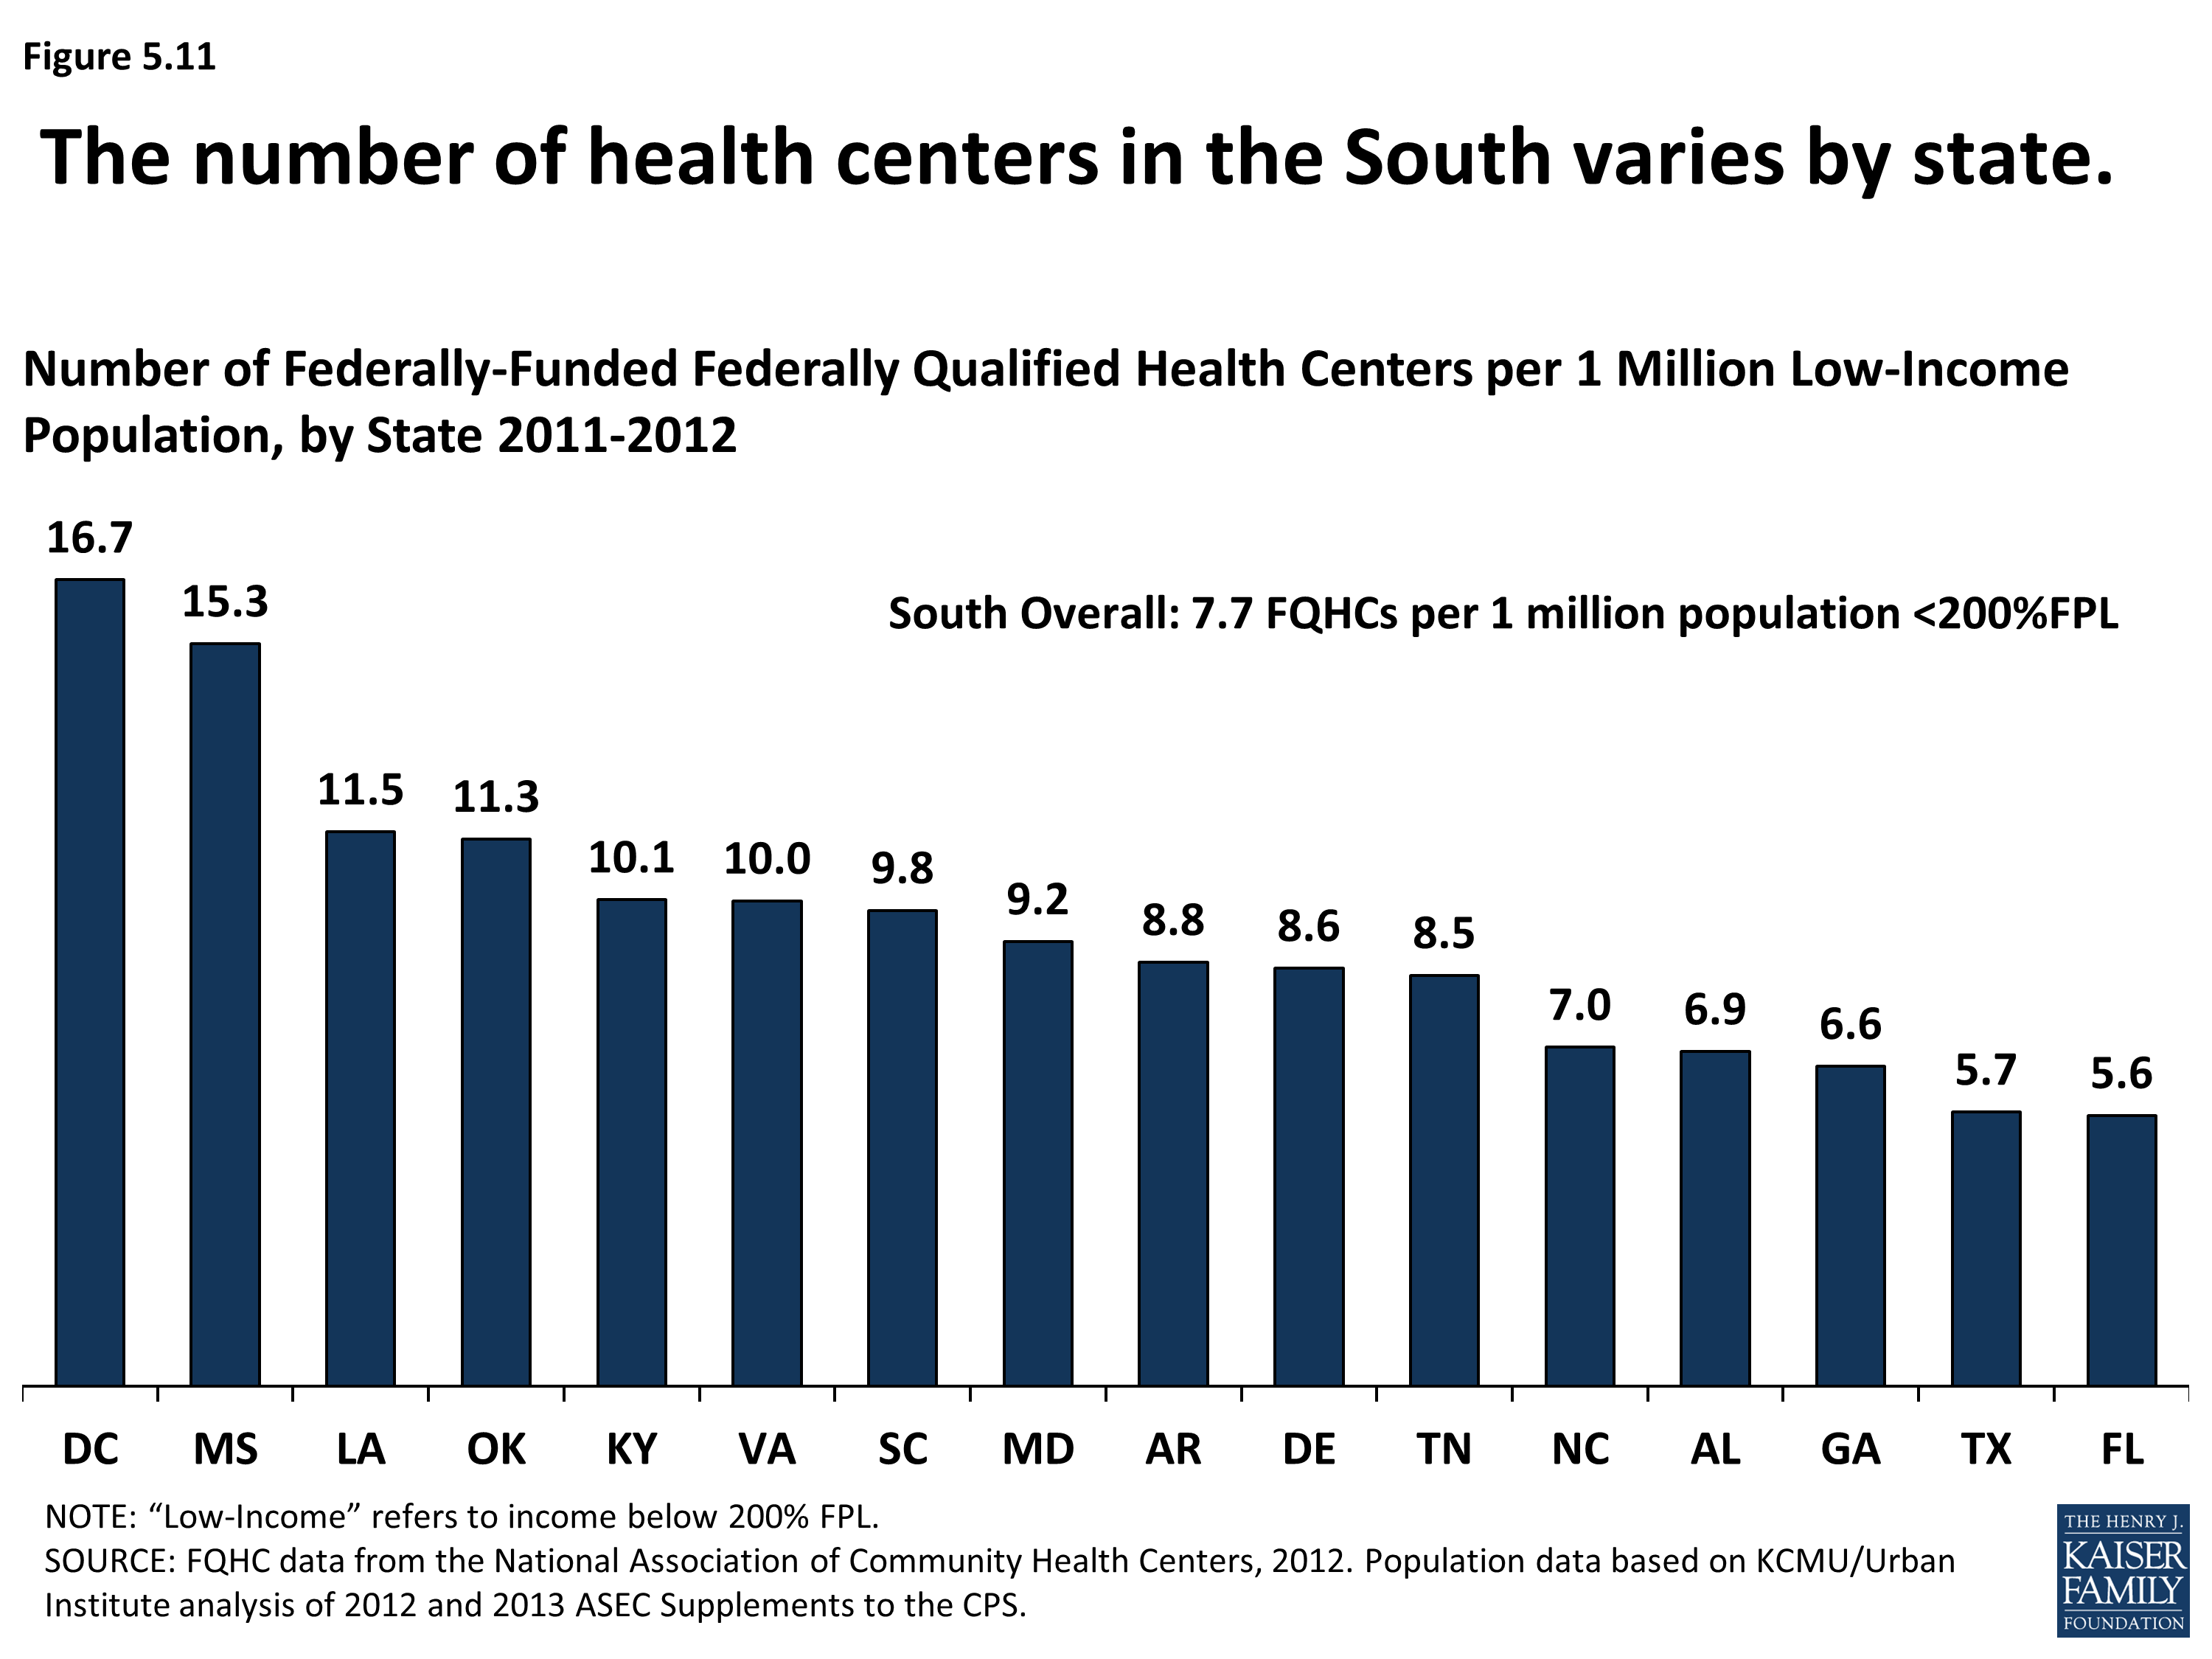
Number of Federally-Funded Federally Qualified Health Centers per 1 Million Low-Income Population, by State 2011-2012
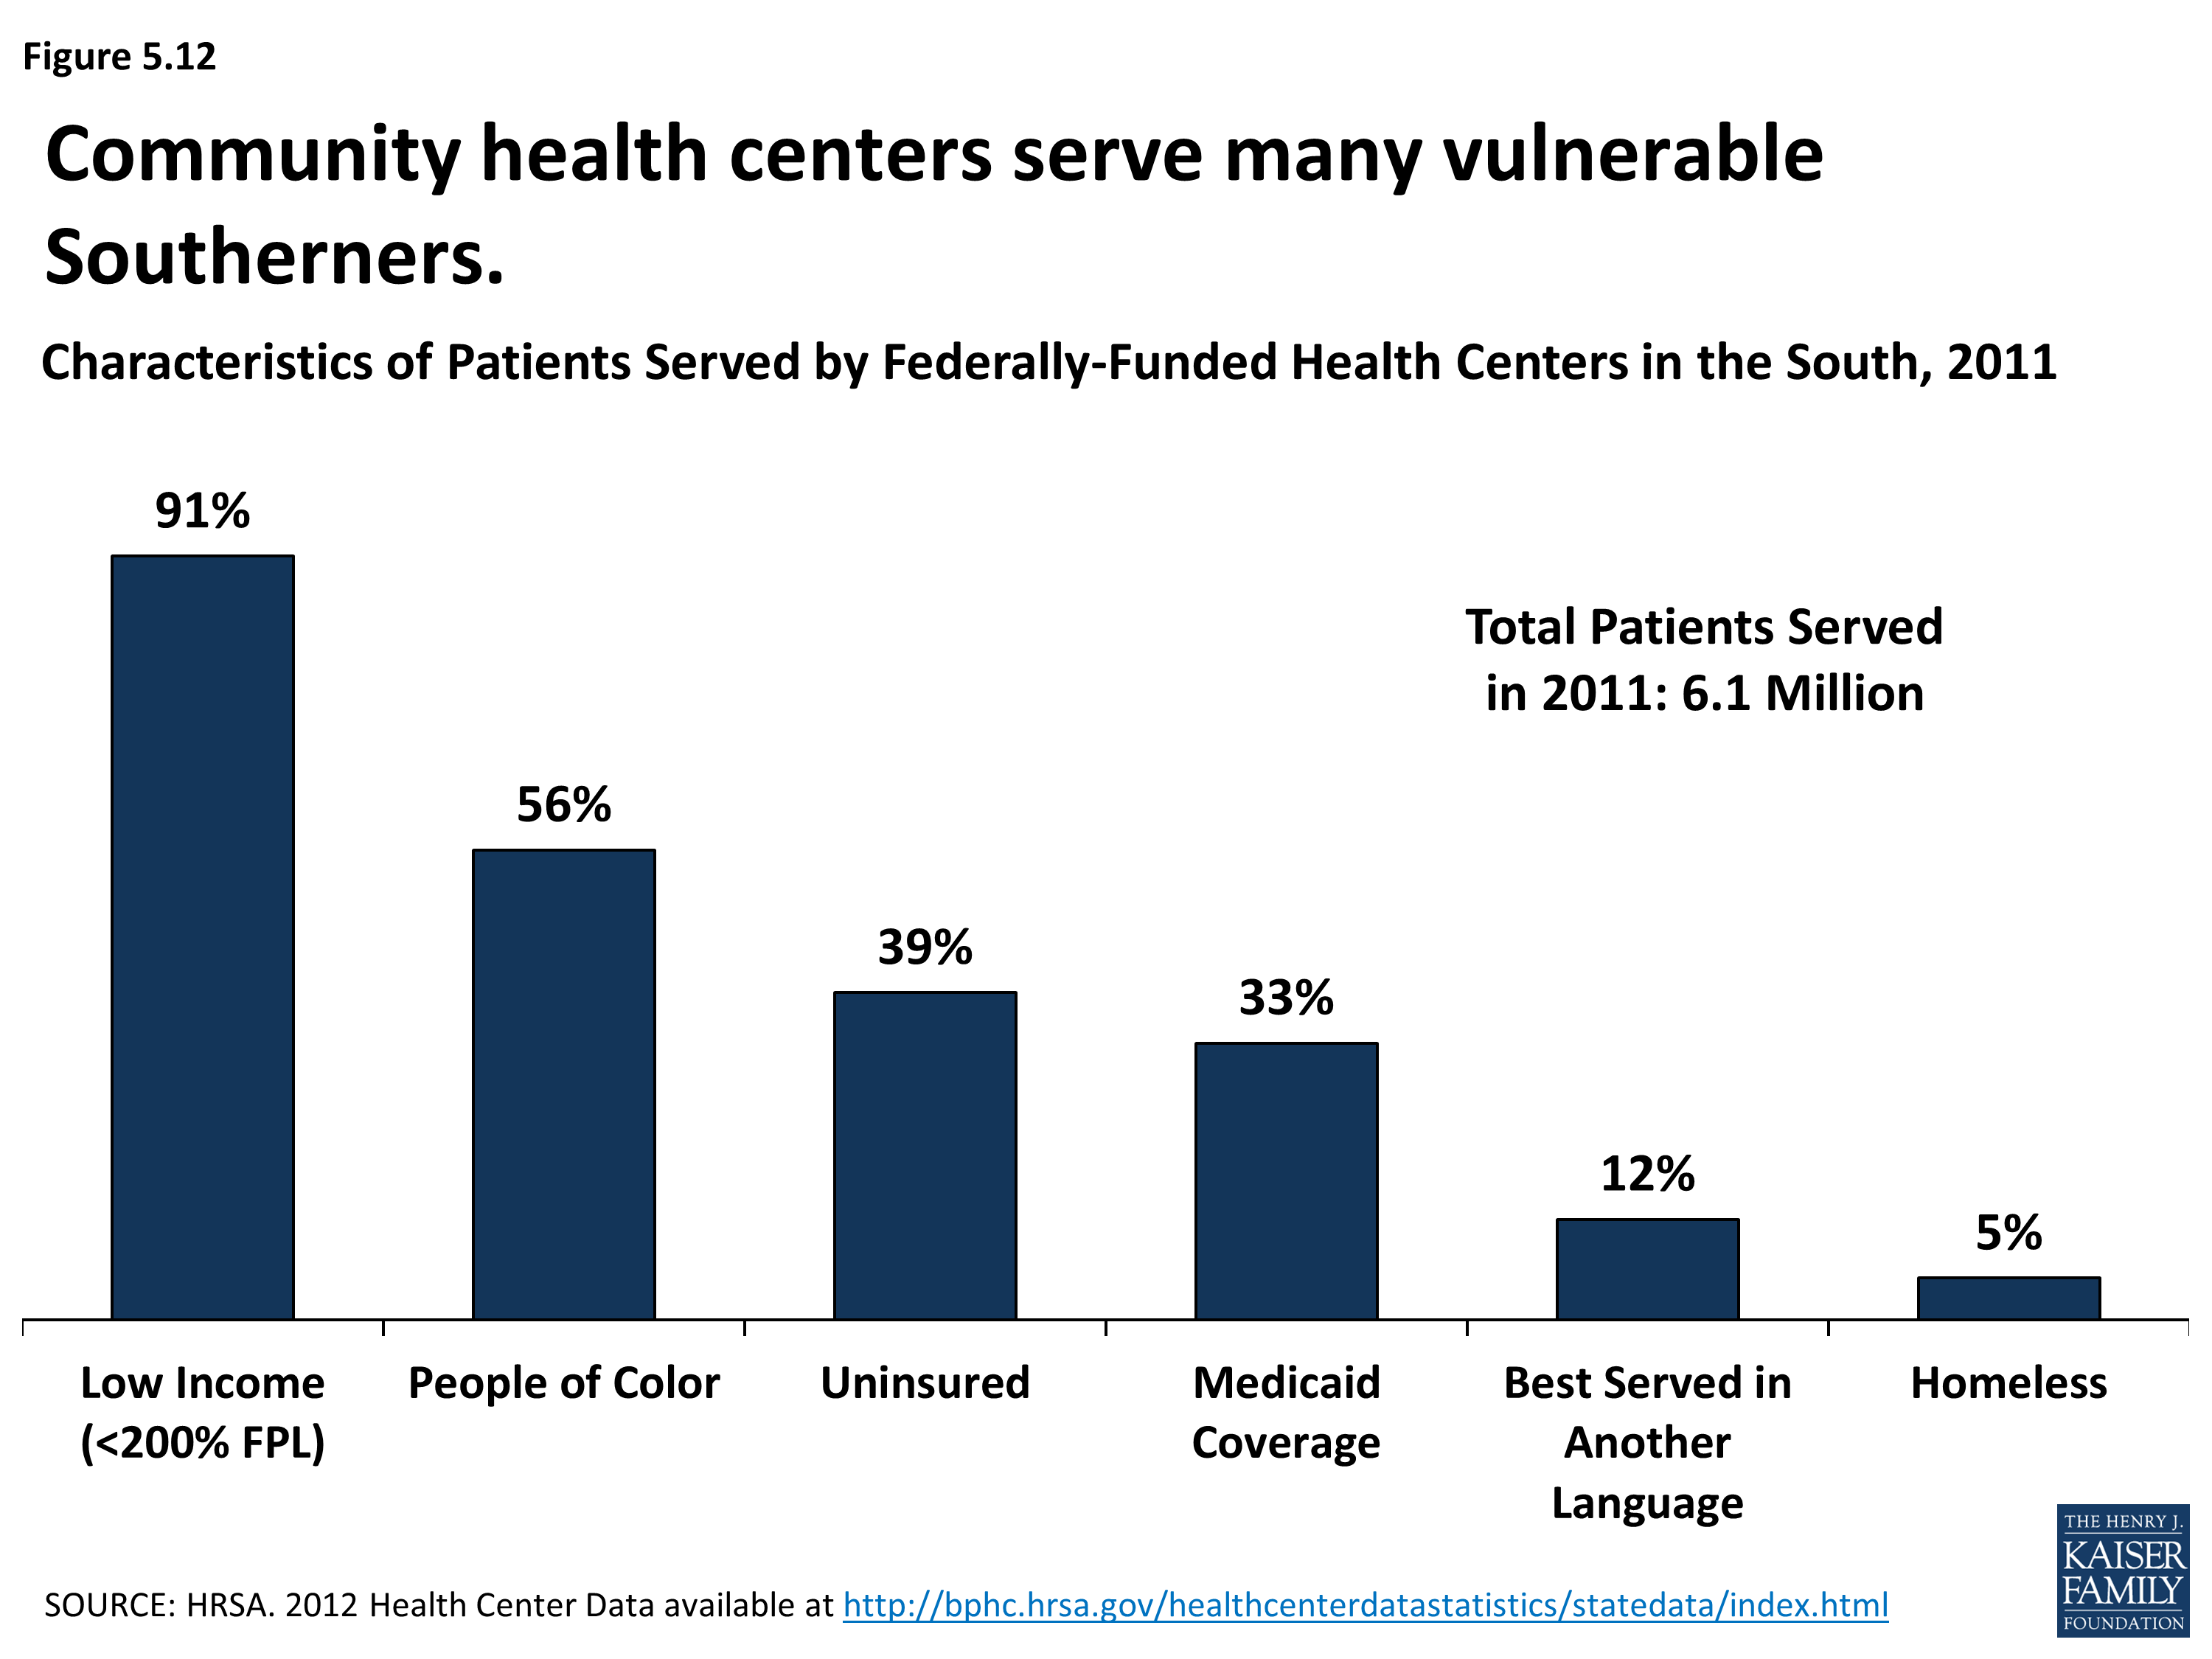
Characteristics of Patients Served by Federally-Funded Health Centers in the South, 2011
Section 6: Medicaid’s Broader Role
Medicaid is both an expenditure and a source of federal revenue in state budgets. The program is funded jointly by states and the federal government through a matching formula based on a state’s personal income, and in many southern states, where per capita personal income is less than the national average, the federal government pays at least two dollars for every dollar states spend on their programs. Overall, the federal government funds the majority of Medicaid costs in the South, although the way in which states finance their share of spending on Medicaid and its impact on their budgets varies by state.
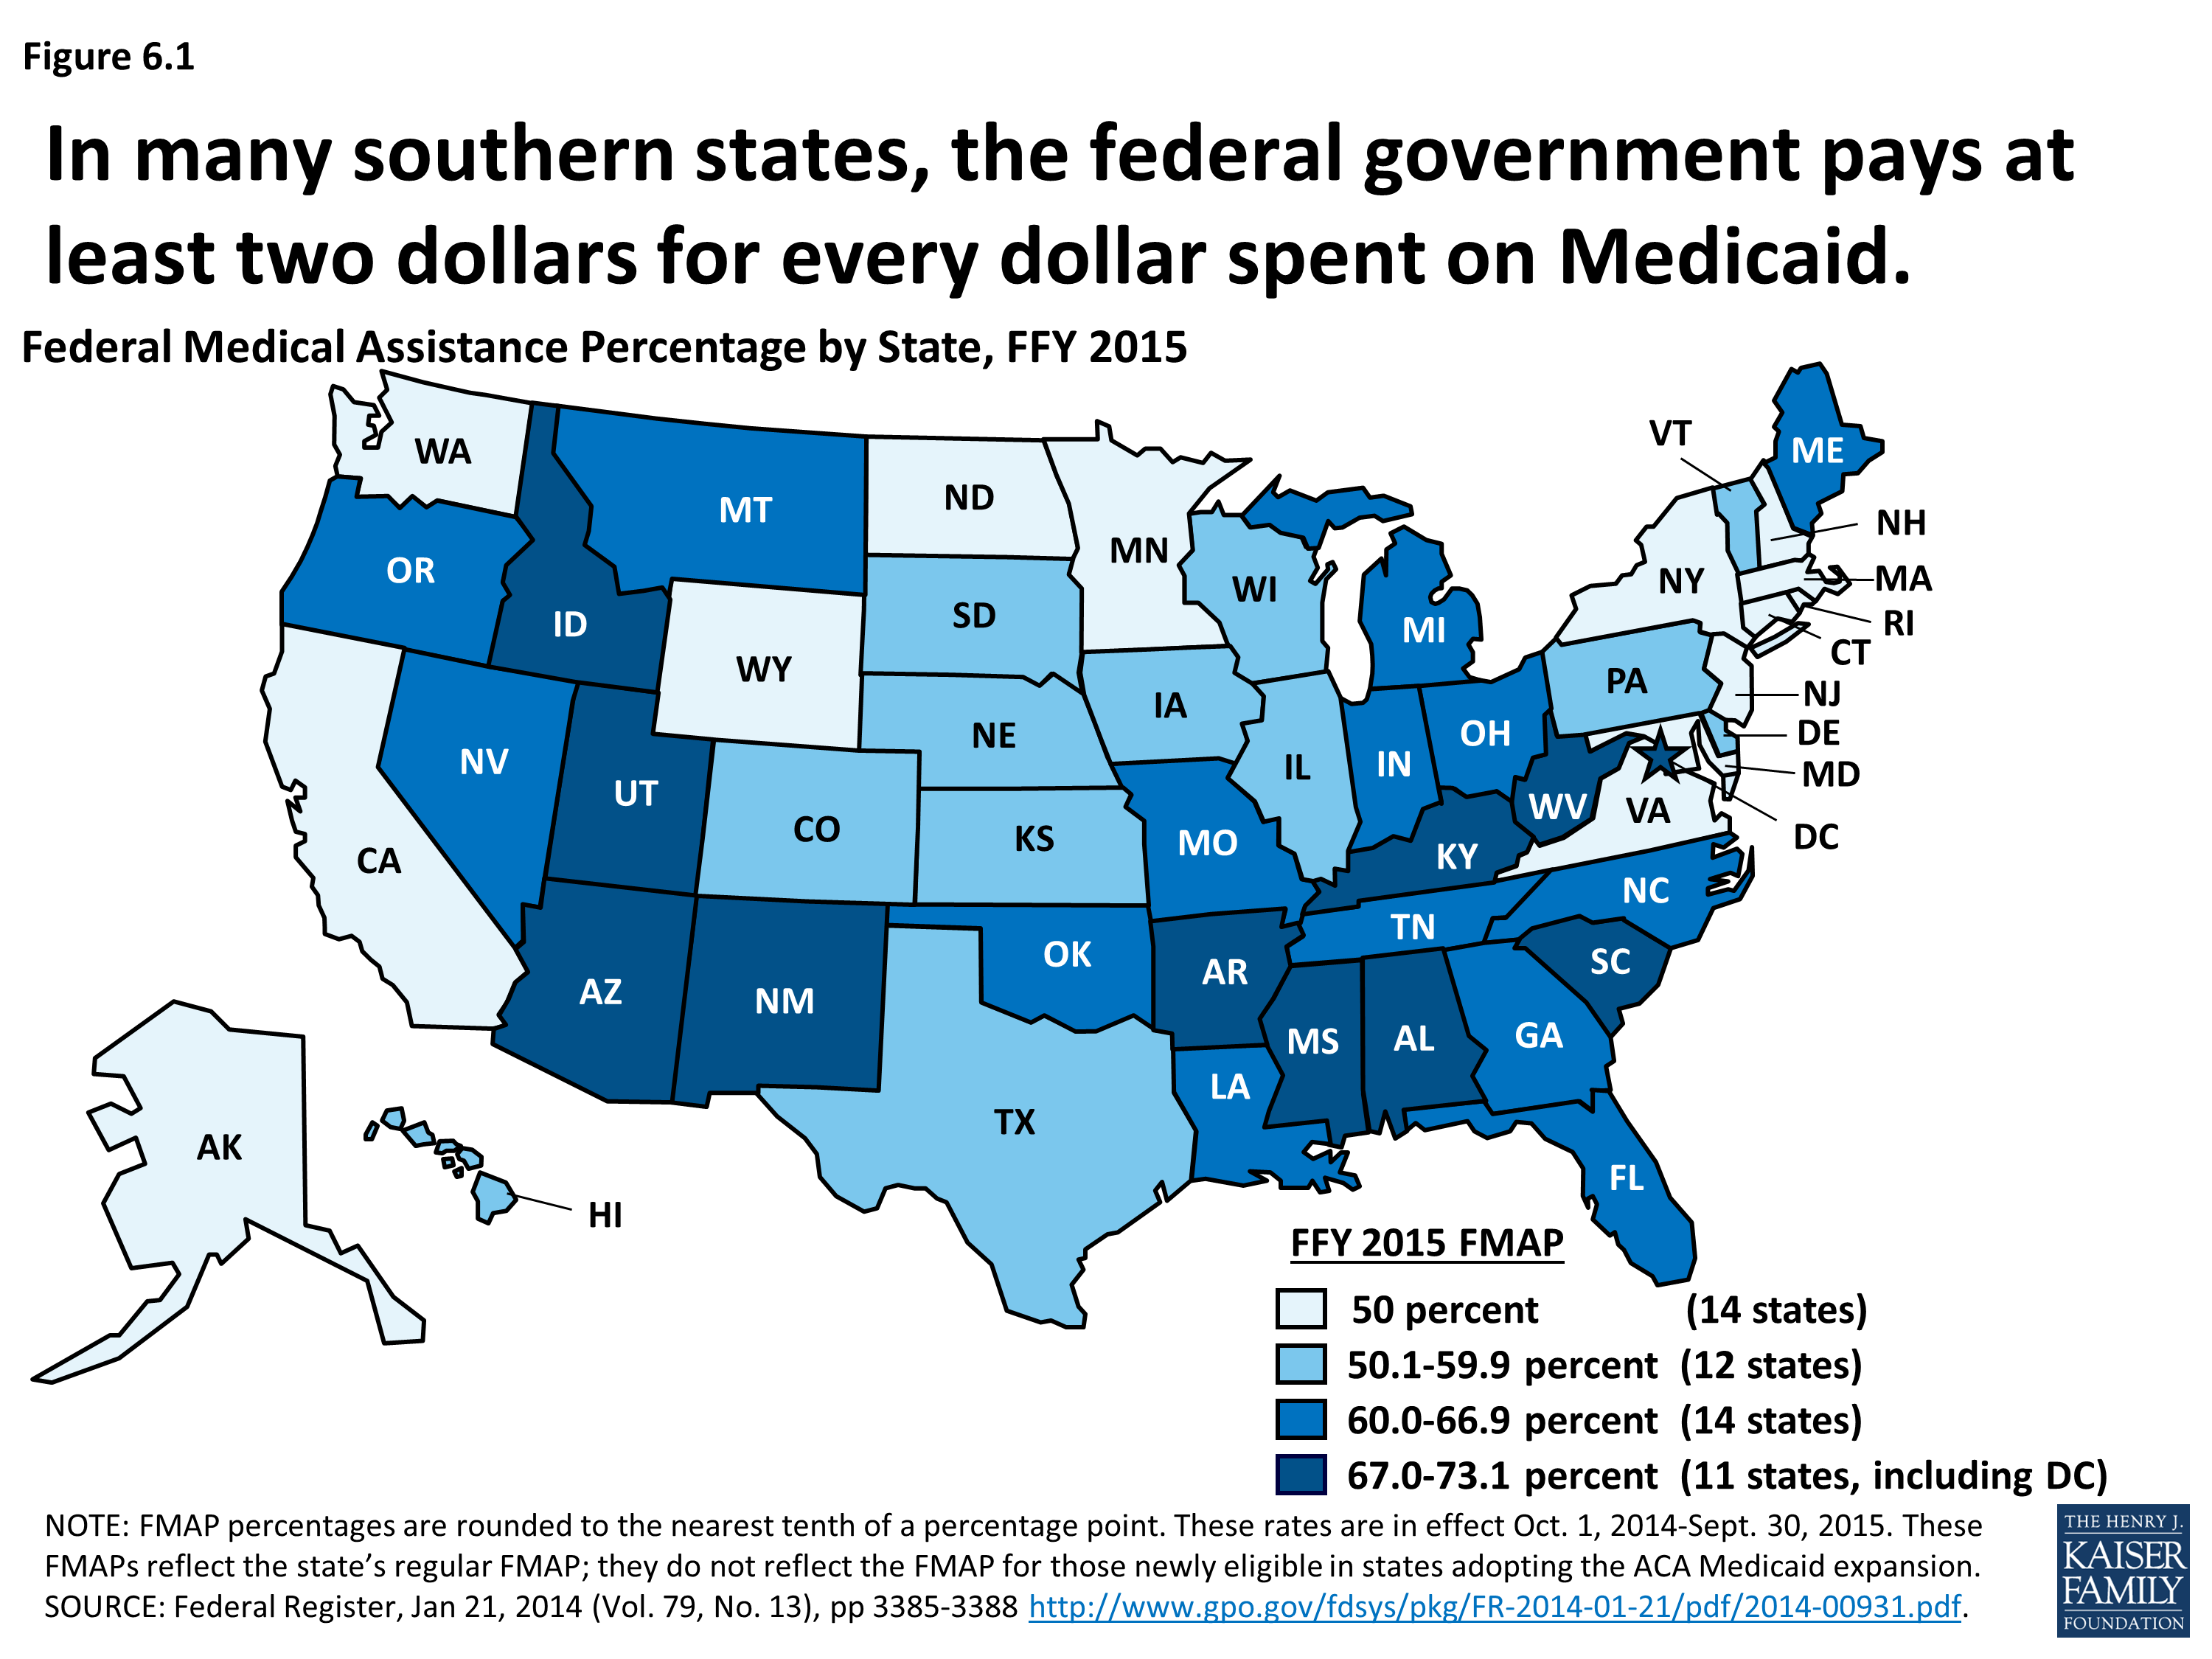
Federal Medical Assistance Percentage by State, FFY 2015
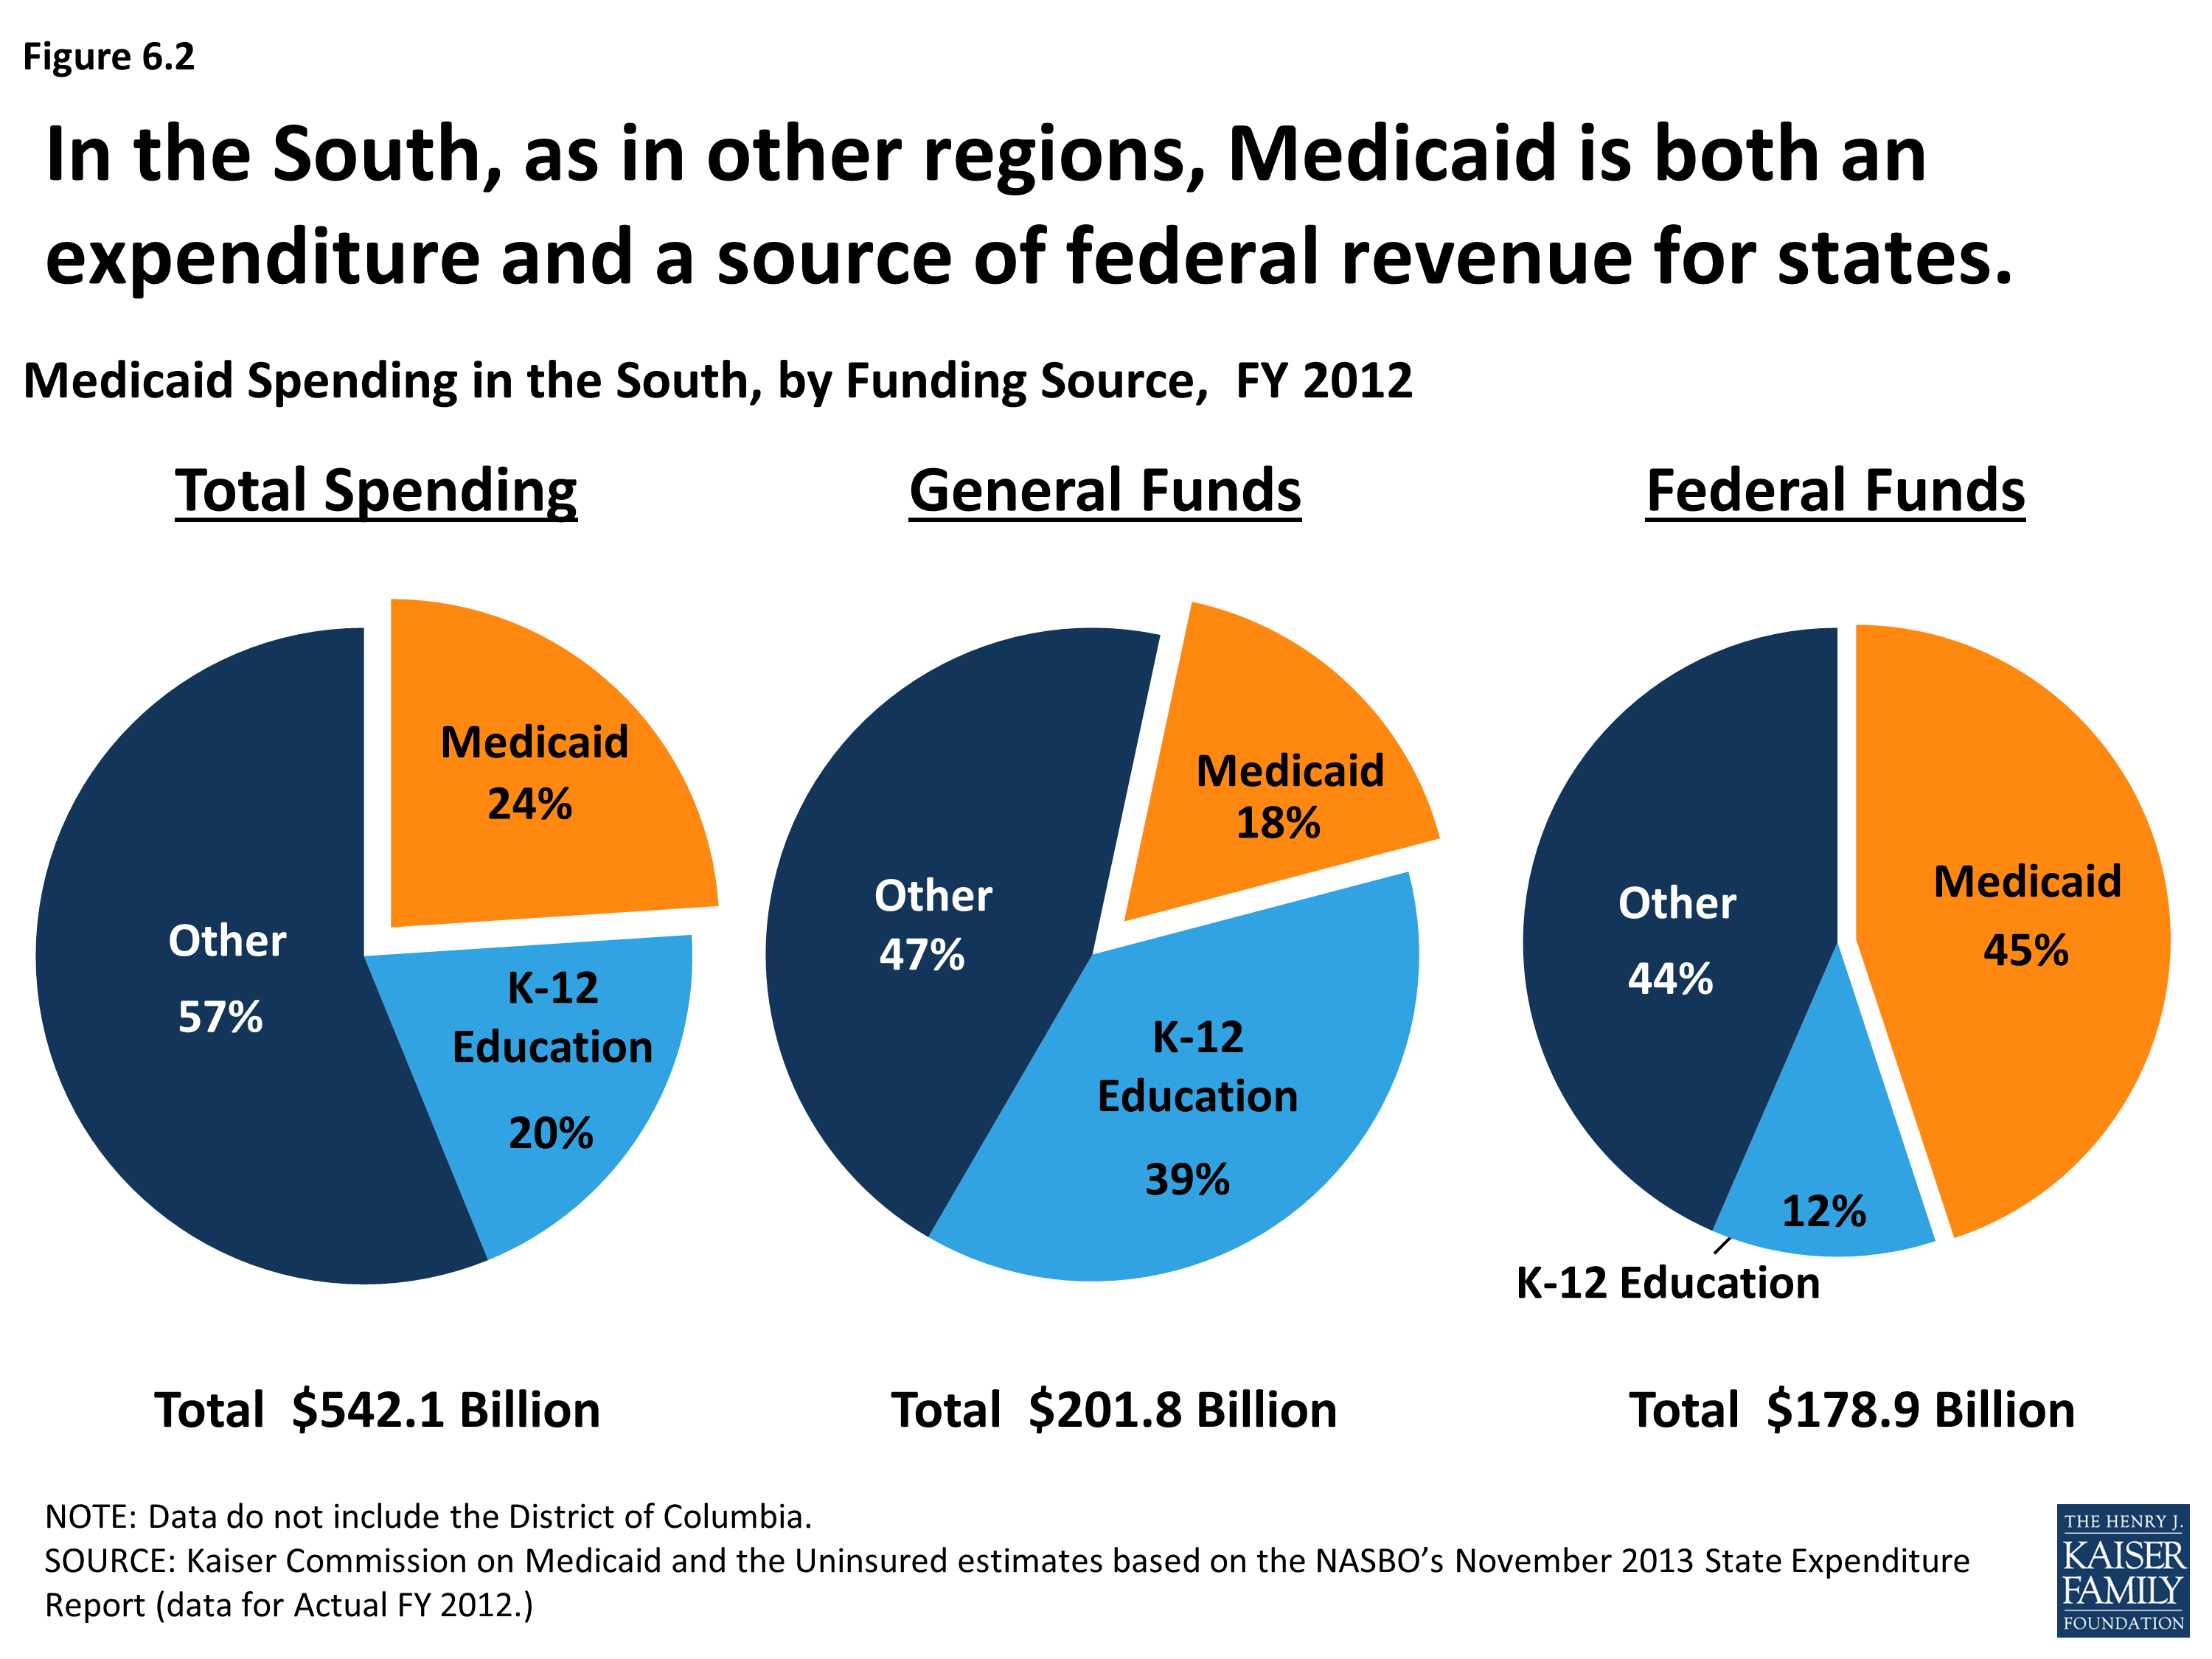
Medicaid Spending in the South, by Funding Source, FY 2012
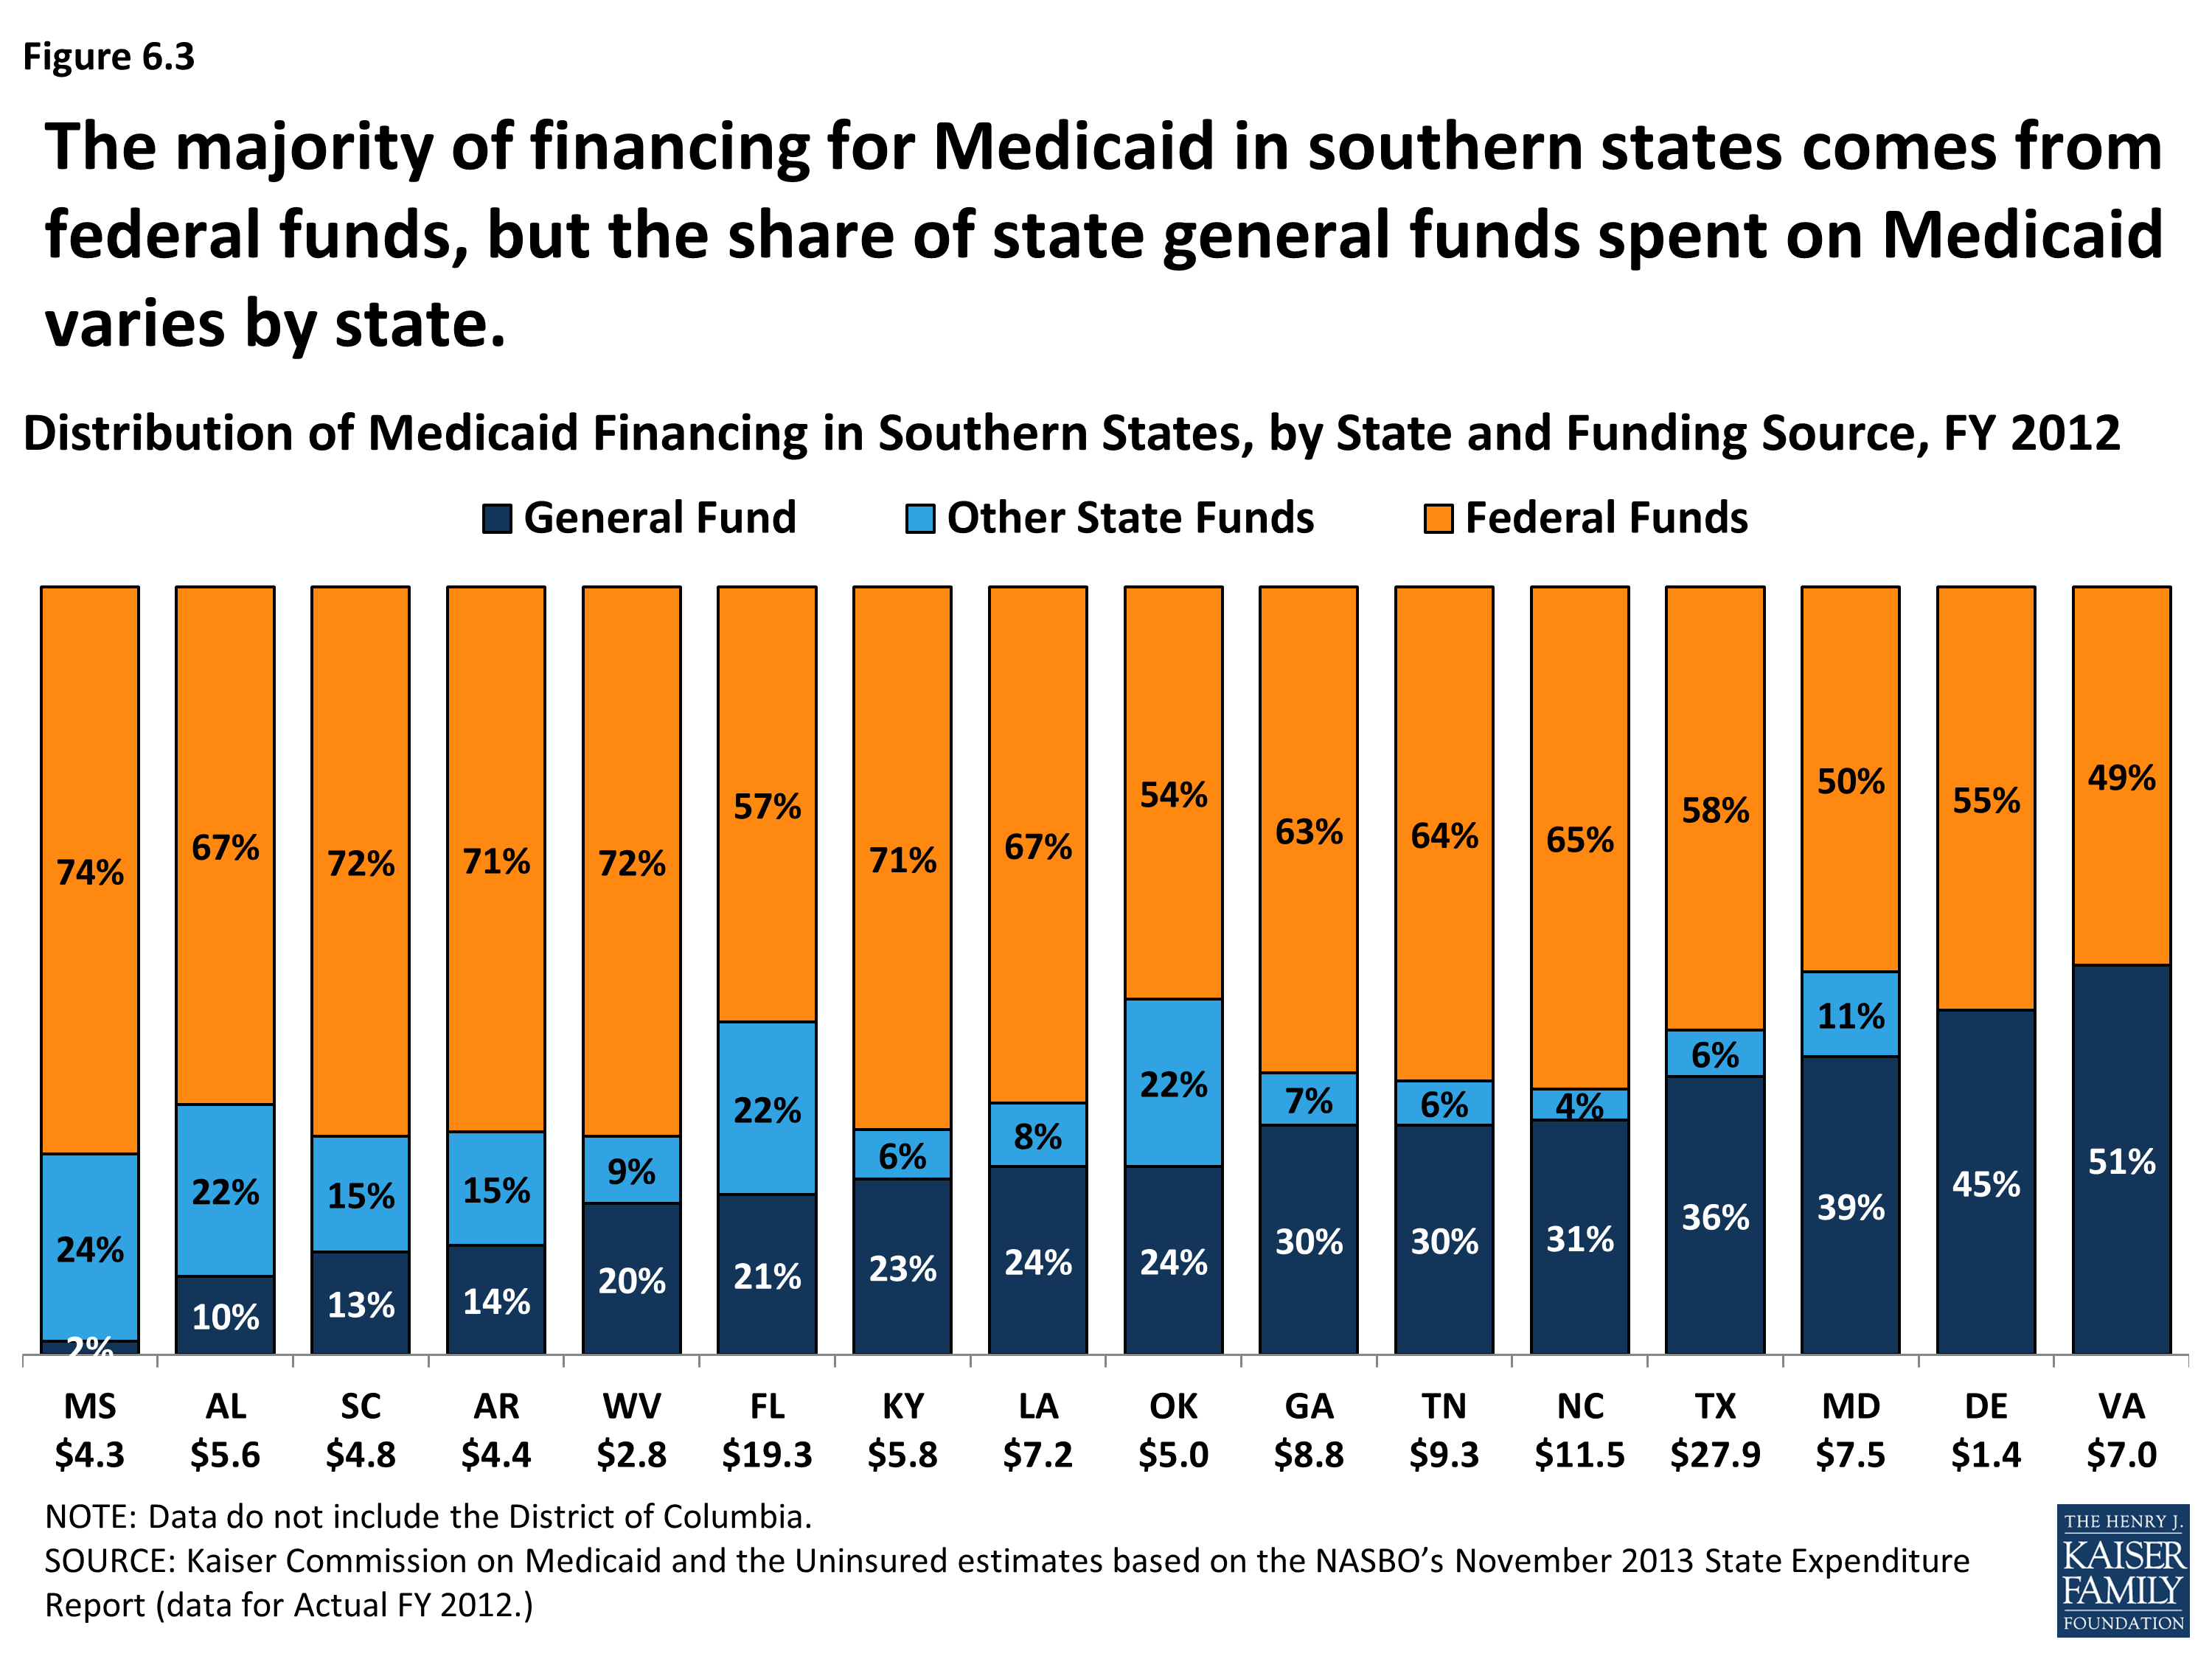
Distribution of Medicaid Financing in Southern States, by State and Funding Source, FY 2012
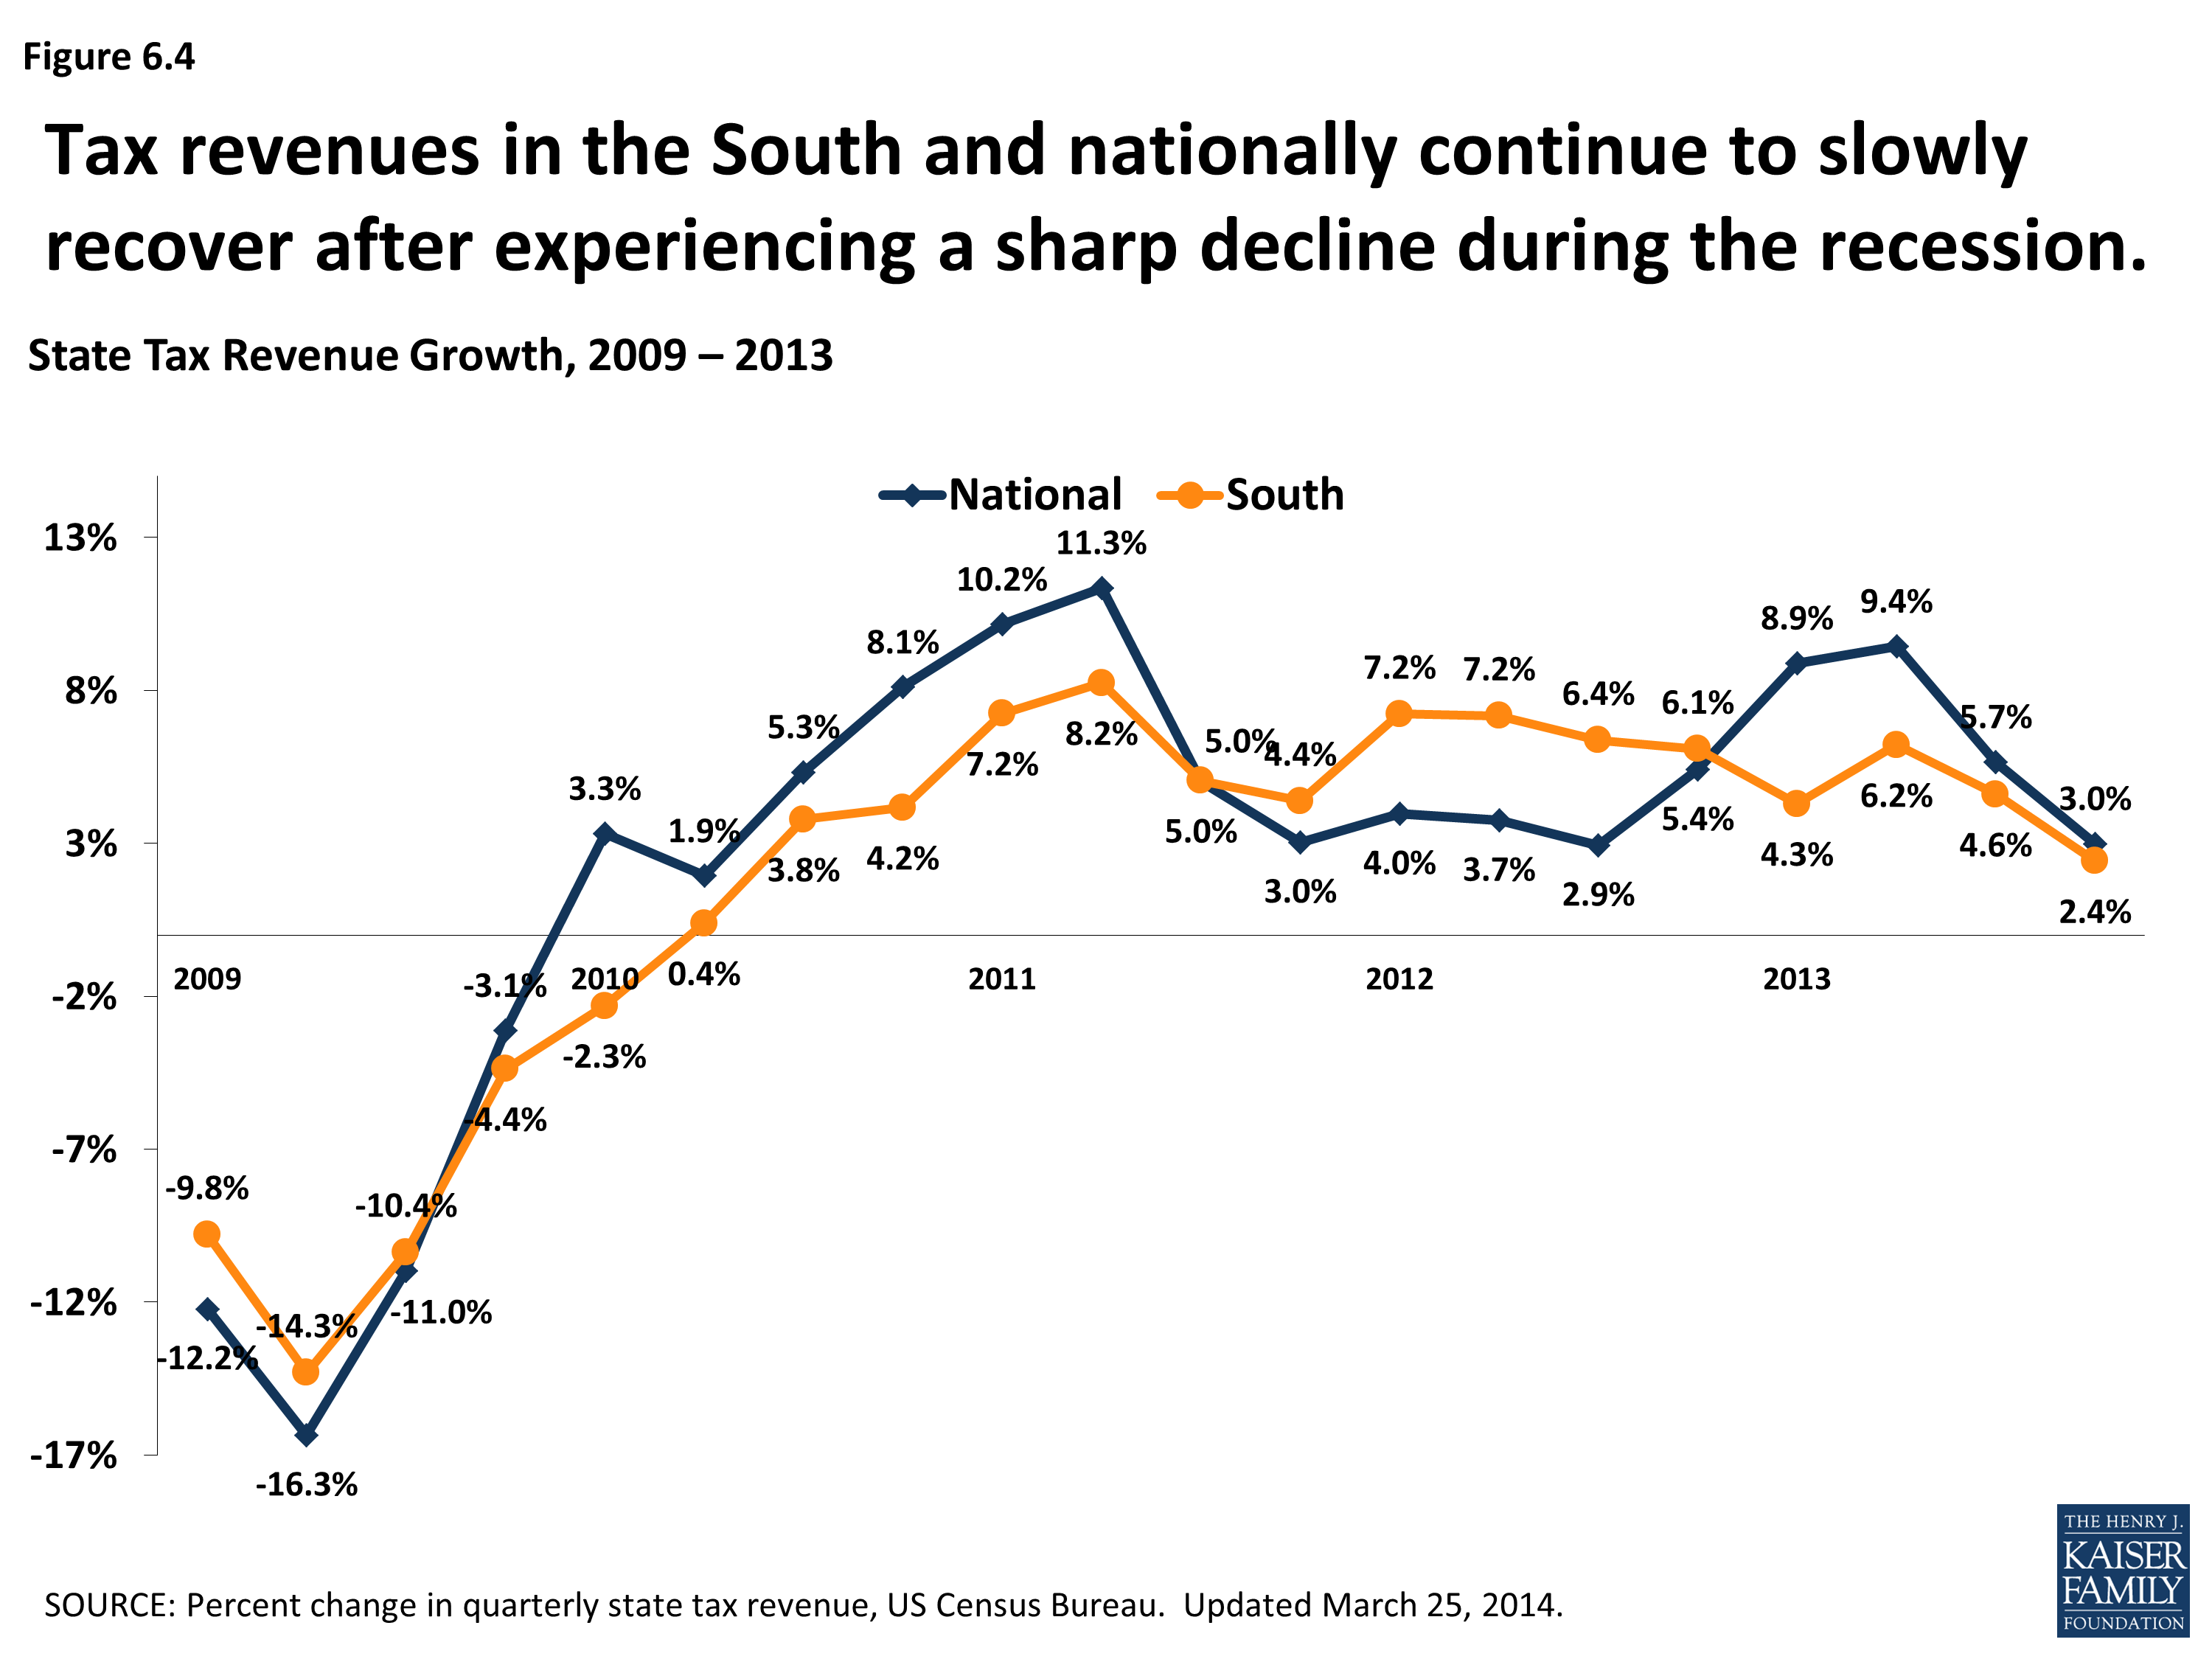
State Tax Revenue, 2009-2013
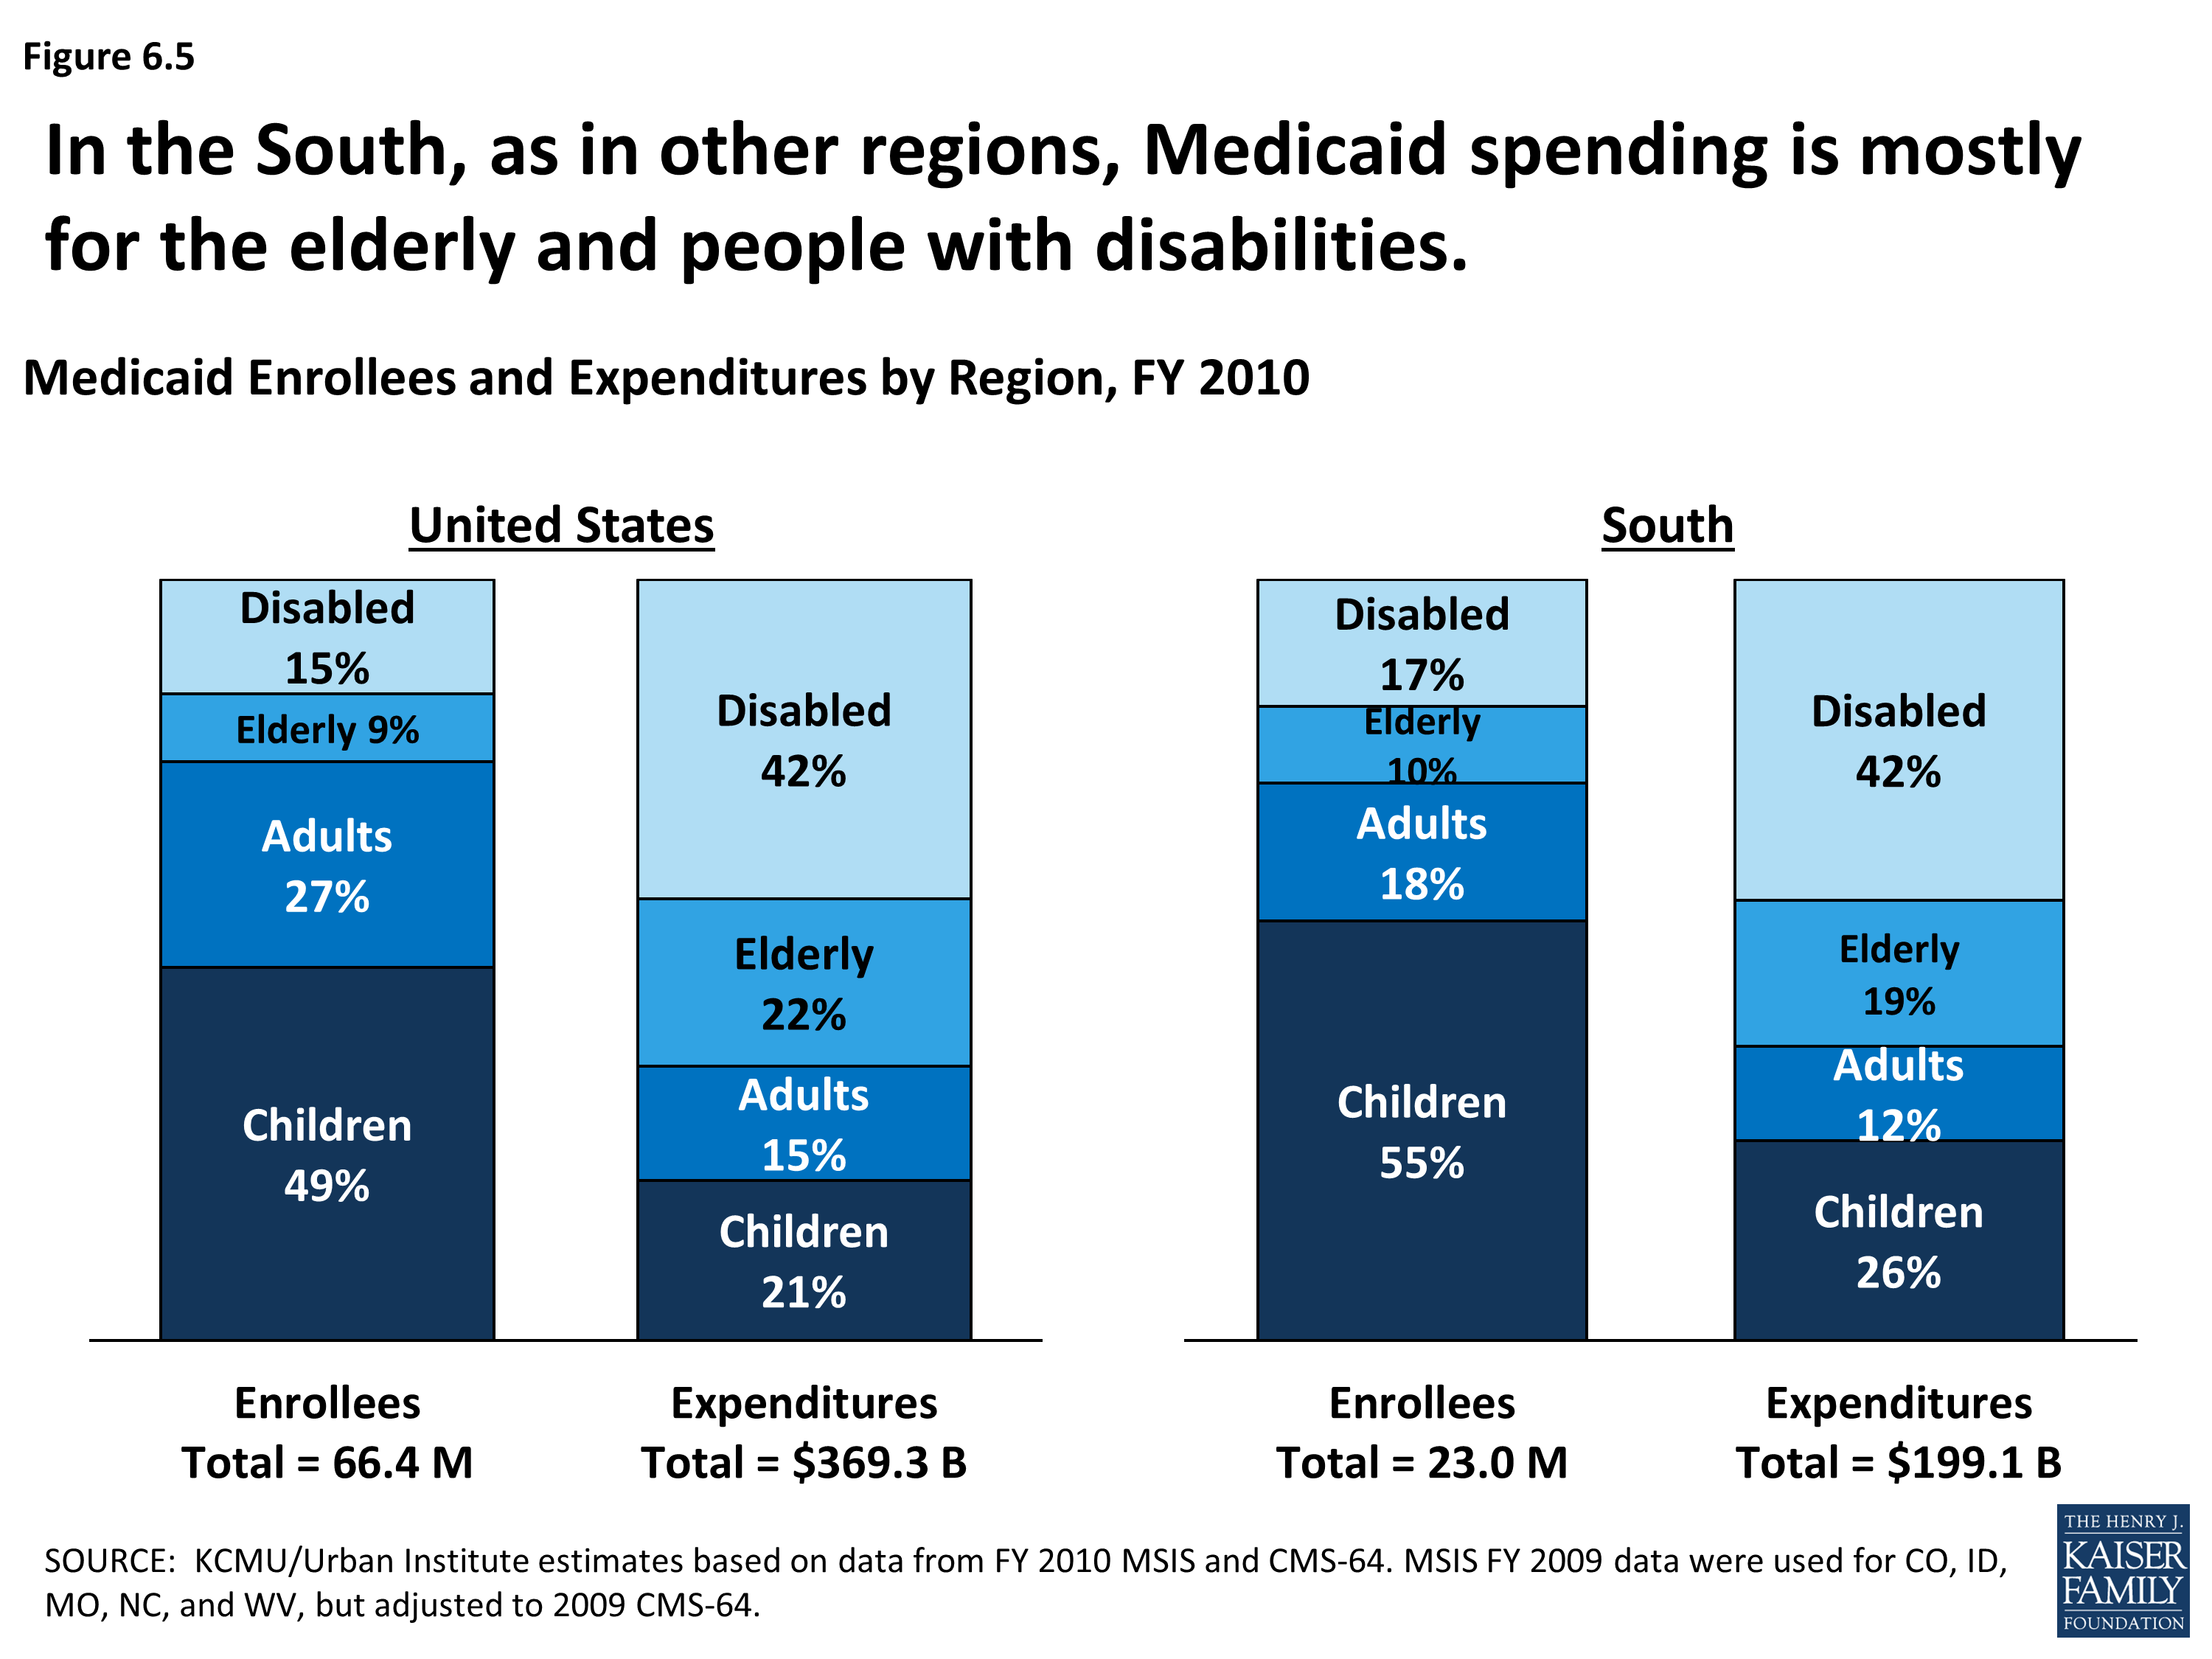
Medicaid Enrollees and Expenditures by Region, FY 2010
Conclusion
Given the growing and diverse population in the South, changing patterns of health coverage and care in the region have important implications nationally and for people of color. As such, continued attention to health coverage and care in the South for those gaining coverage and those remaining uninsured will be important for understanding the impact of the ACA and implications for longstanding efforts to reduce disparities in coverage, care, and health outcomes.