California’s Previously Uninsured After The ACA’s Second Open Enrollment Period
Section 1: Coverage Gains Among The Previously Uninsured
Enrollment
After two rounds of open enrollment under the Affordable Care Act, 68 percent of Californians who were uninsured prior to the first open enrollment period now report that they have health insurance, up from 58 percent after the first open enrollment period in the spring of 2014. About a third (32 percent) report being currently uninsured, a group referred to throughout this report as the “remaining uninsured;” this share is down from 42 percent in the spring of 2014. Excluding those who are likely ineligible for coverage under the ACA due to their immigration status,1 77 percent of California’s eligible remaining uninsured now reports having coverage.
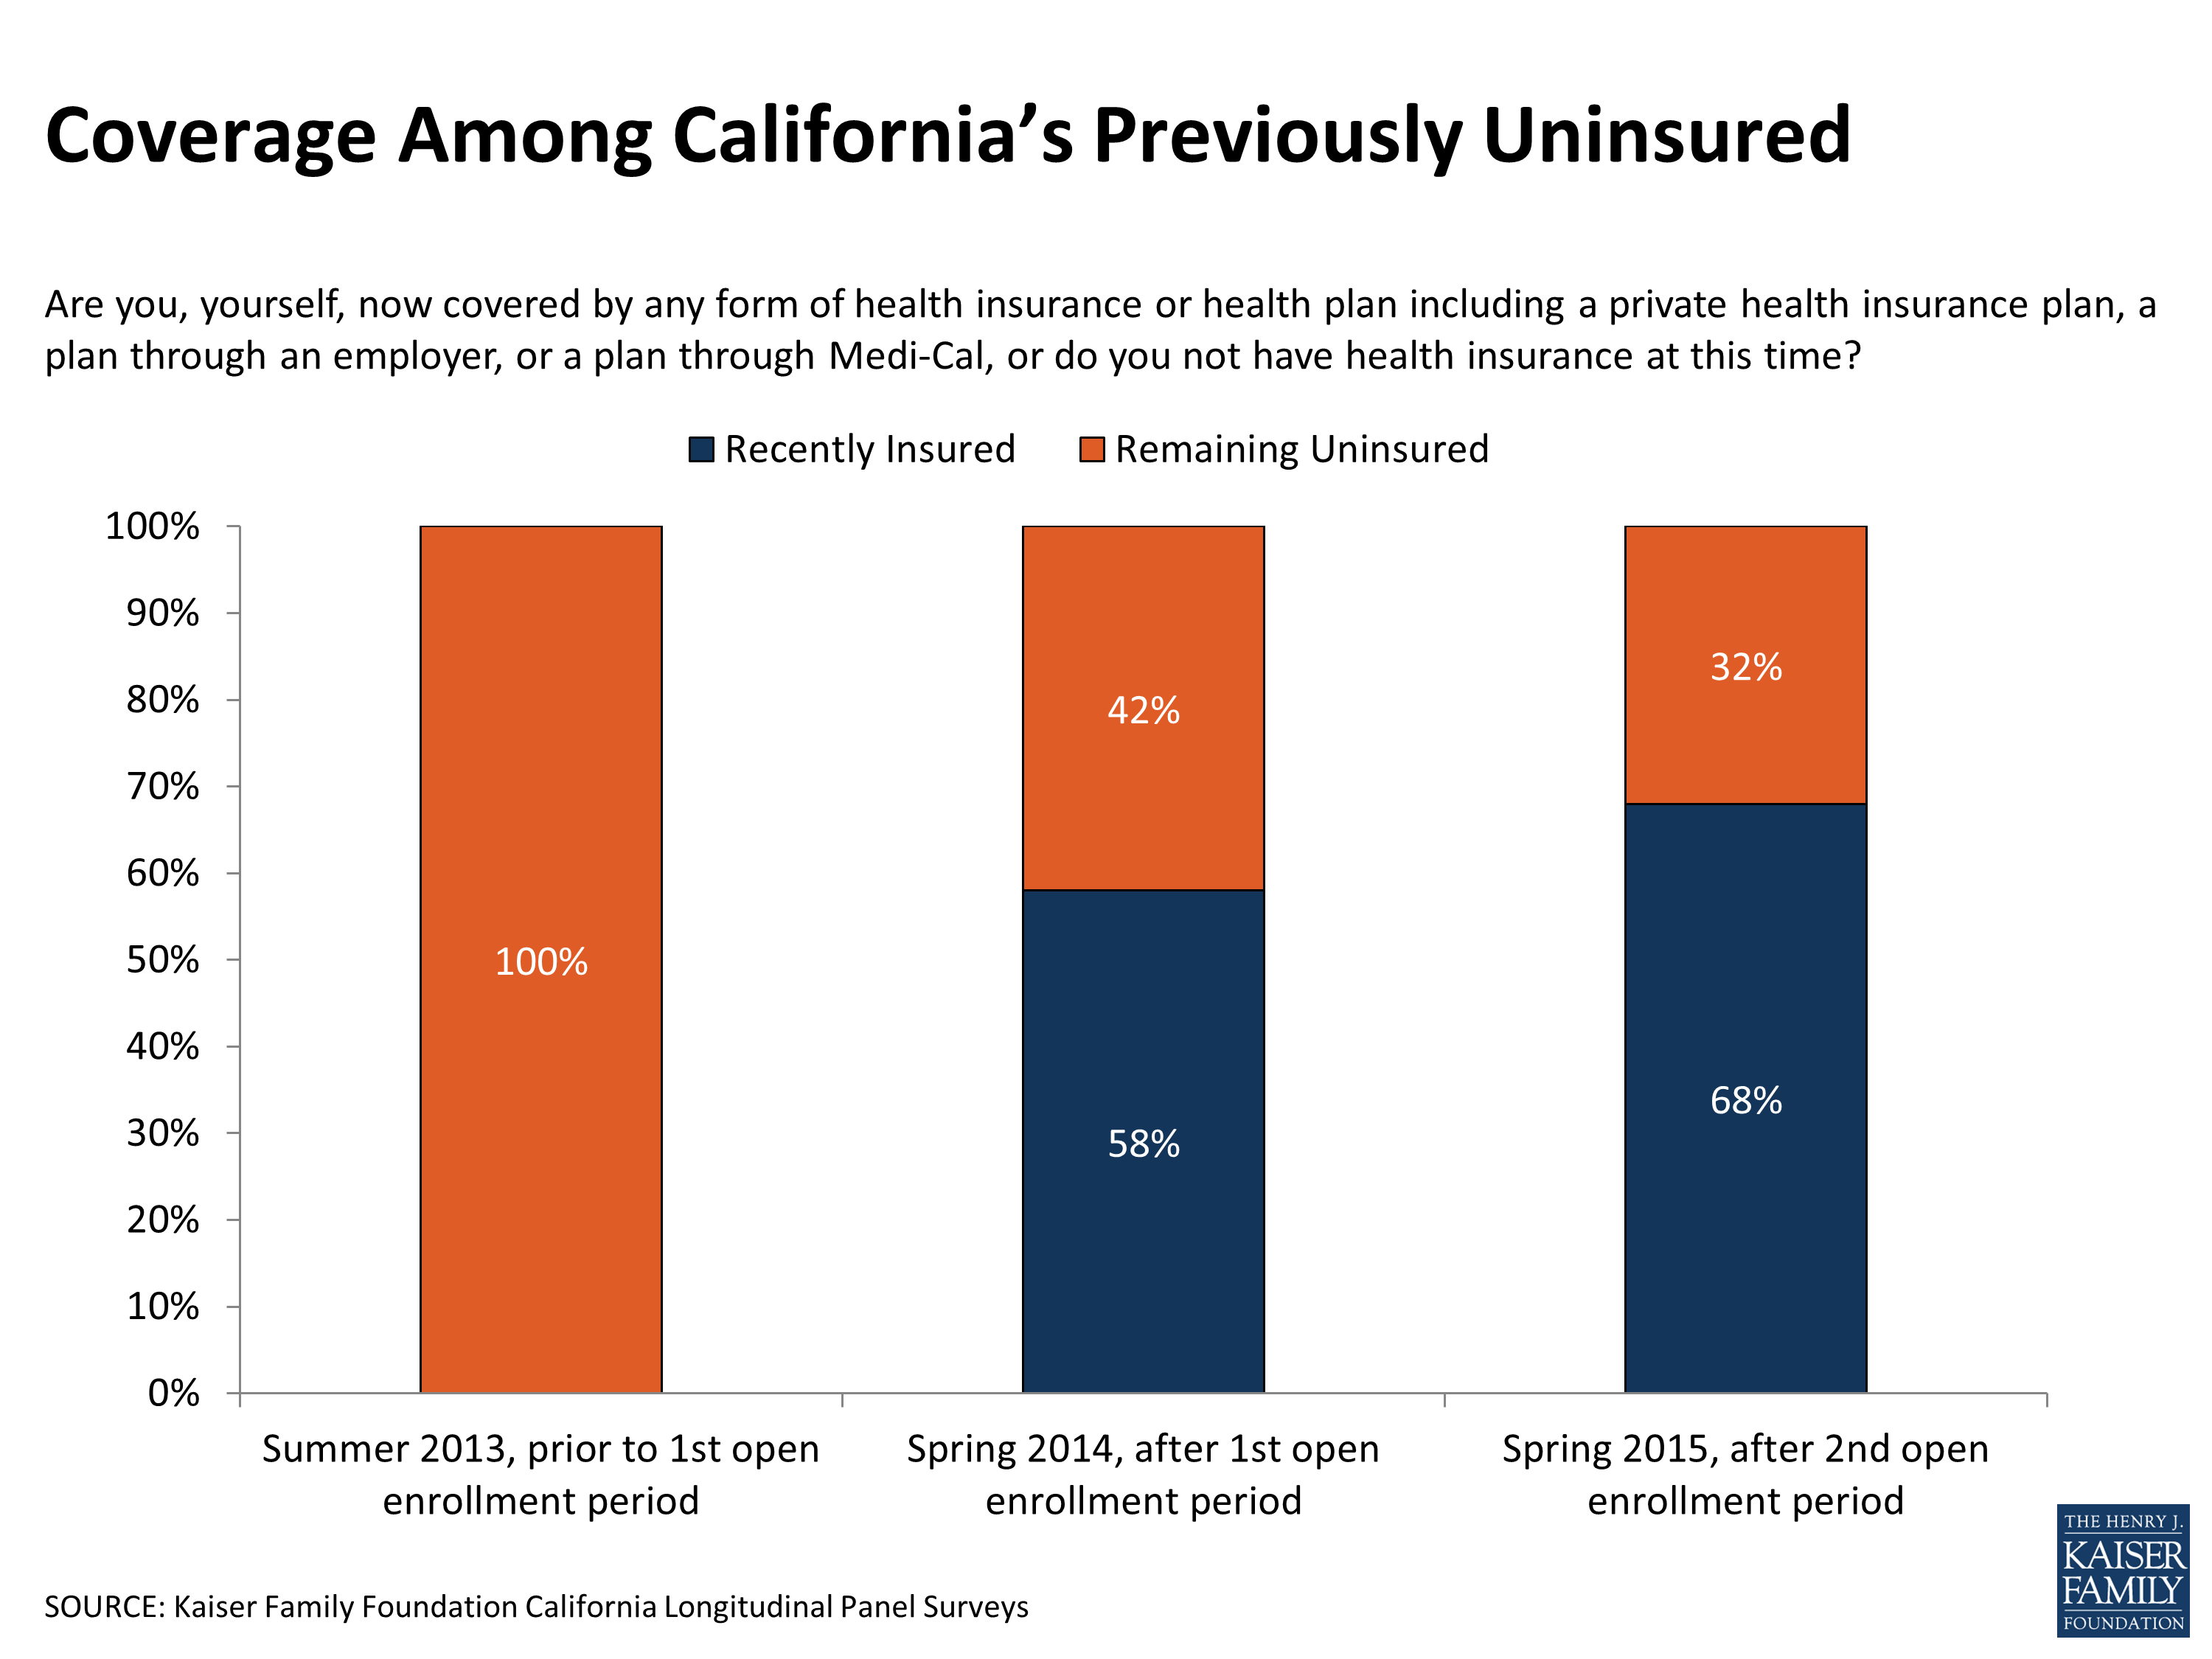
Figure 2
Those previously uninsured Californians who now report after the second open enrollment period that they have health insurance (68 percent), referred to throughout this report as “California’s recently insured,” say they gained coverage from several different sources. The largest share of California’s previously uninsured, a third (34 percent), say they have coverage through the state’s Medicaid program, Medi-Cal, up from 25 percent after the first open enrollment period. In addition, 14 percent currently say they are insured through an employer, 12 percent say they have a plan through Covered California, the state’s health insurance marketplace where people can shop for and compare health insurance plans and access federal subsidies for coverage, and another 7 percent say they have other non-group coverage or insurance through some other source.2
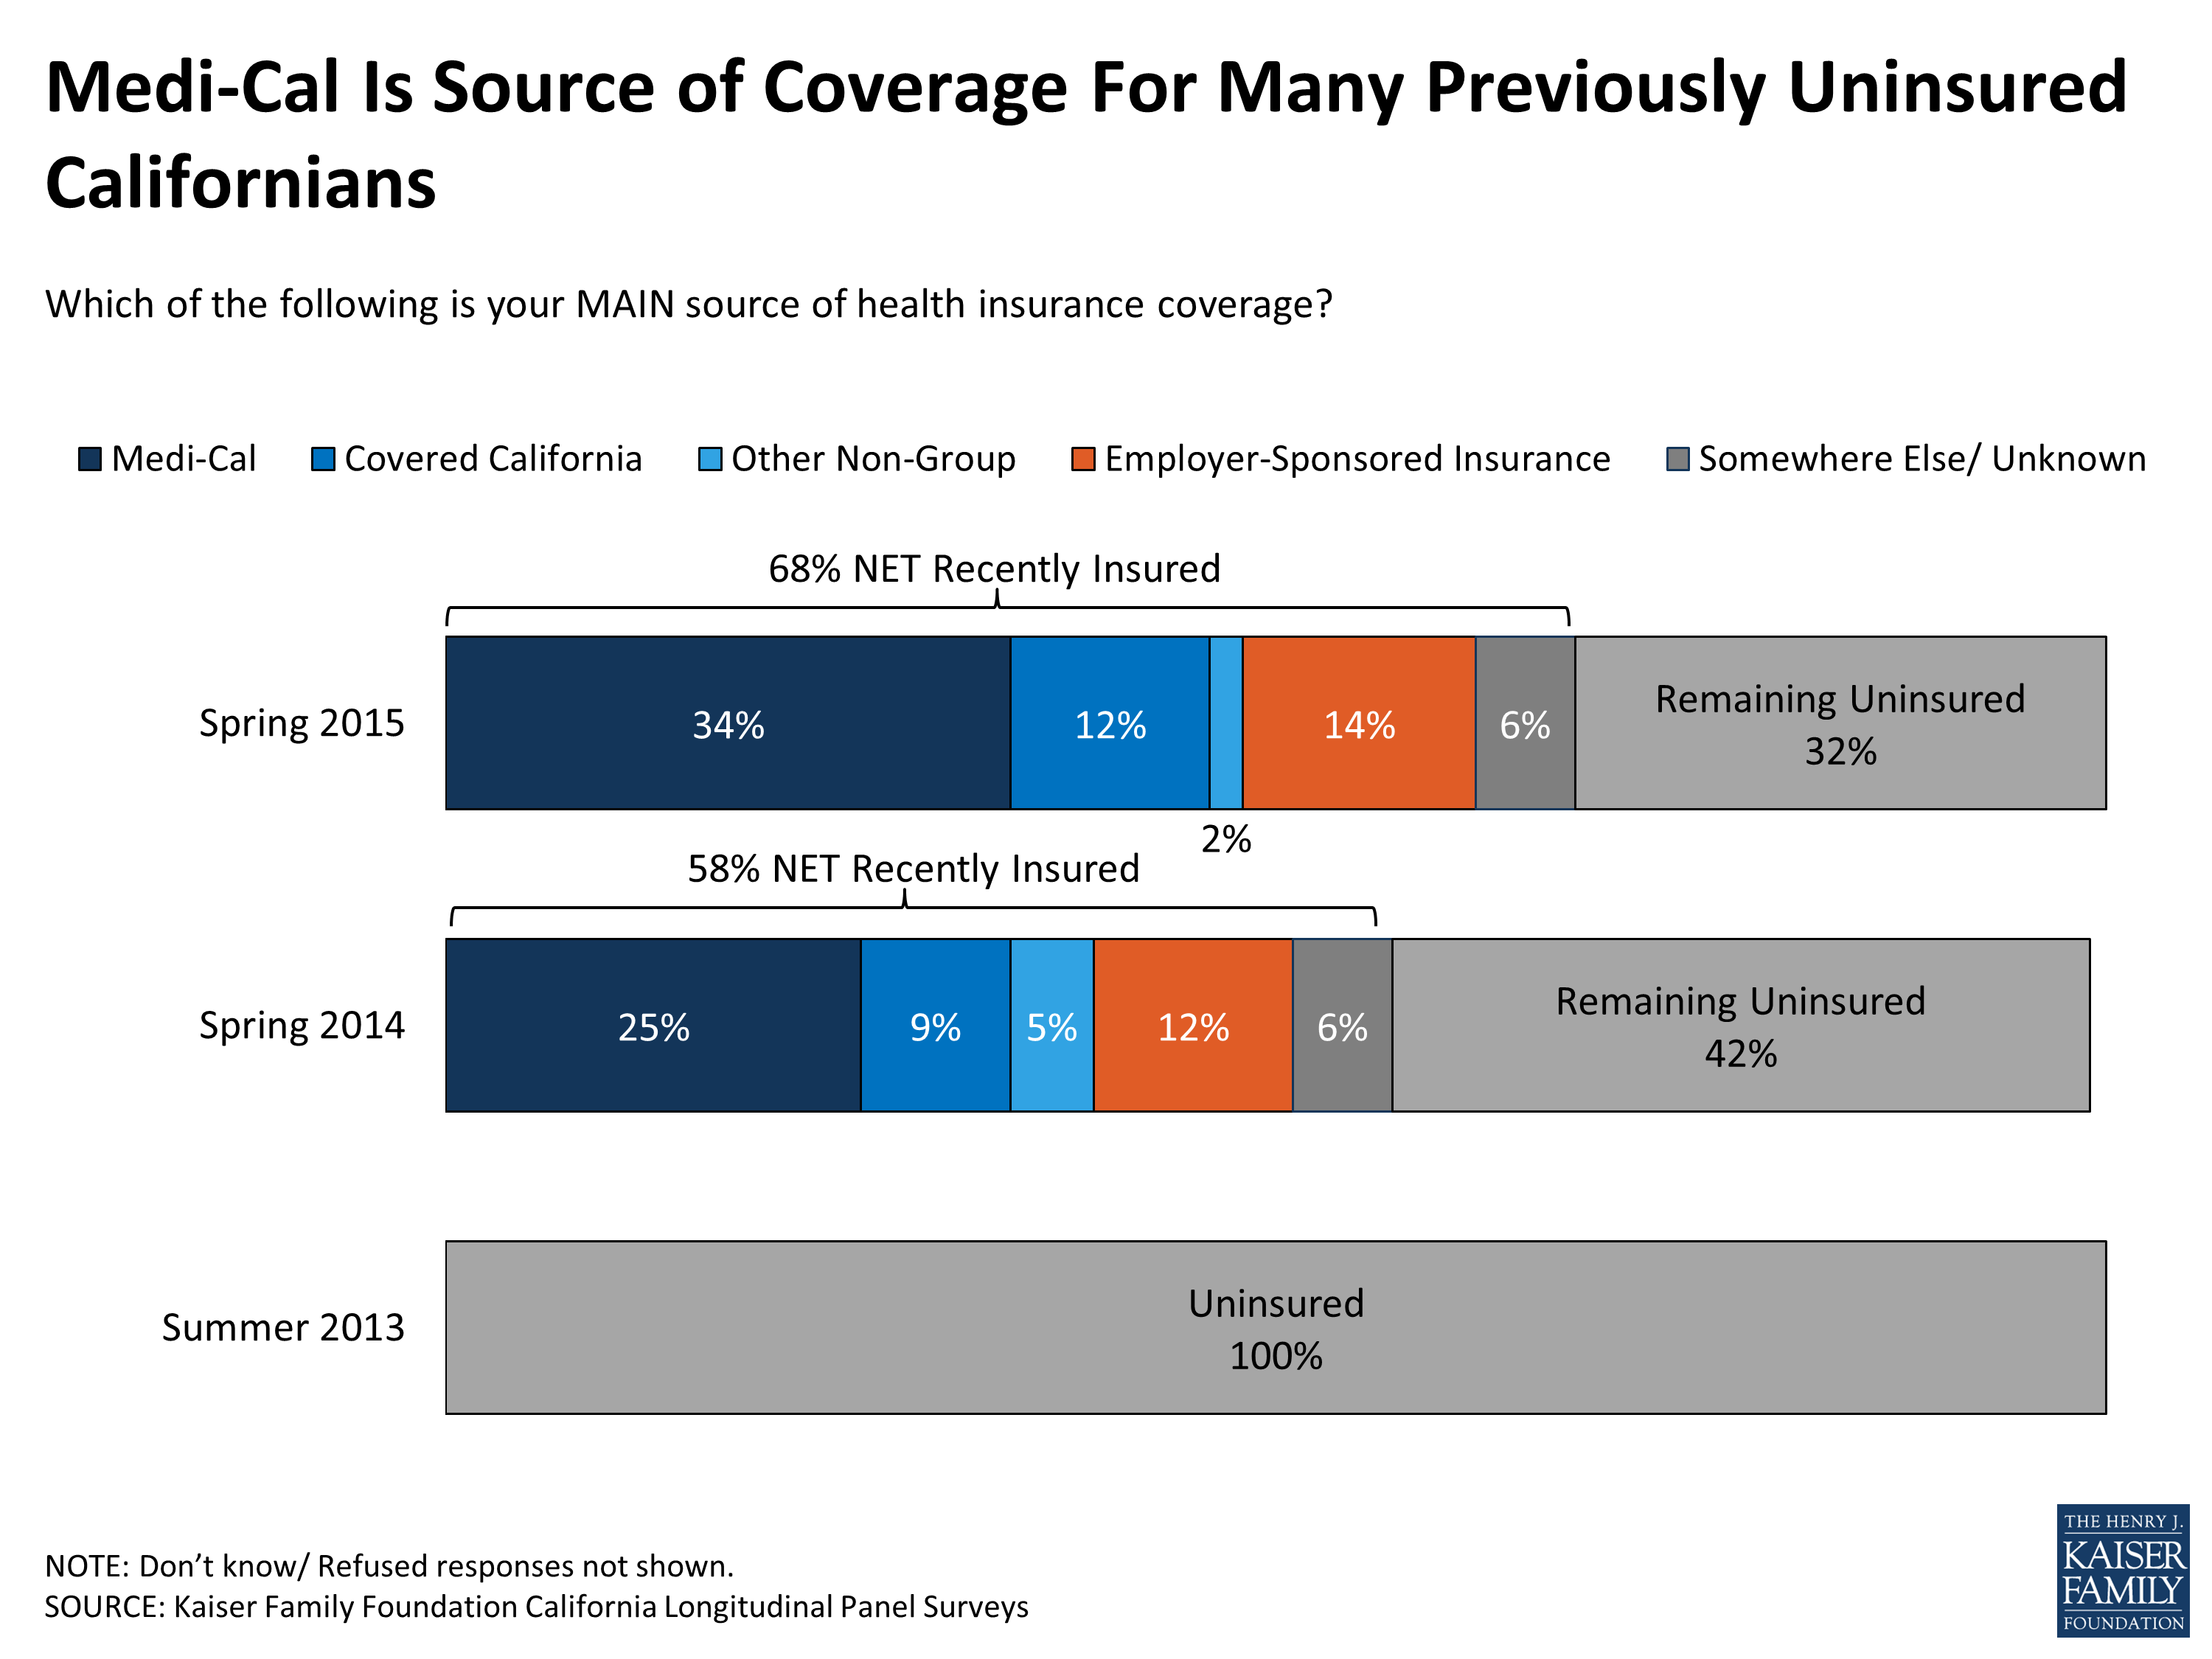
Figure 3
Who Now Has Coverage?
Because Latinos made up over half of the uninsured adult population prior to the ACA’s coverage expansions, particular attention has been paid to enrollment among this group. Currently, roughly 6 in 10 (59 percent) Hispanics who were uninsured prior to the first open enrollment period in summer 2013 report now having coverage, much lower than the 79 percent of previously uninsured whites who say they are insured. However, excluding the 1 in 3 previously uninsured Latinos who are likely to be ineligible for financial assistance through Covered California or Medi-Cal due to their immigration status,3 74 percent of eligible Latinos say they now have coverage, a share nearly equivalent to that for whites.
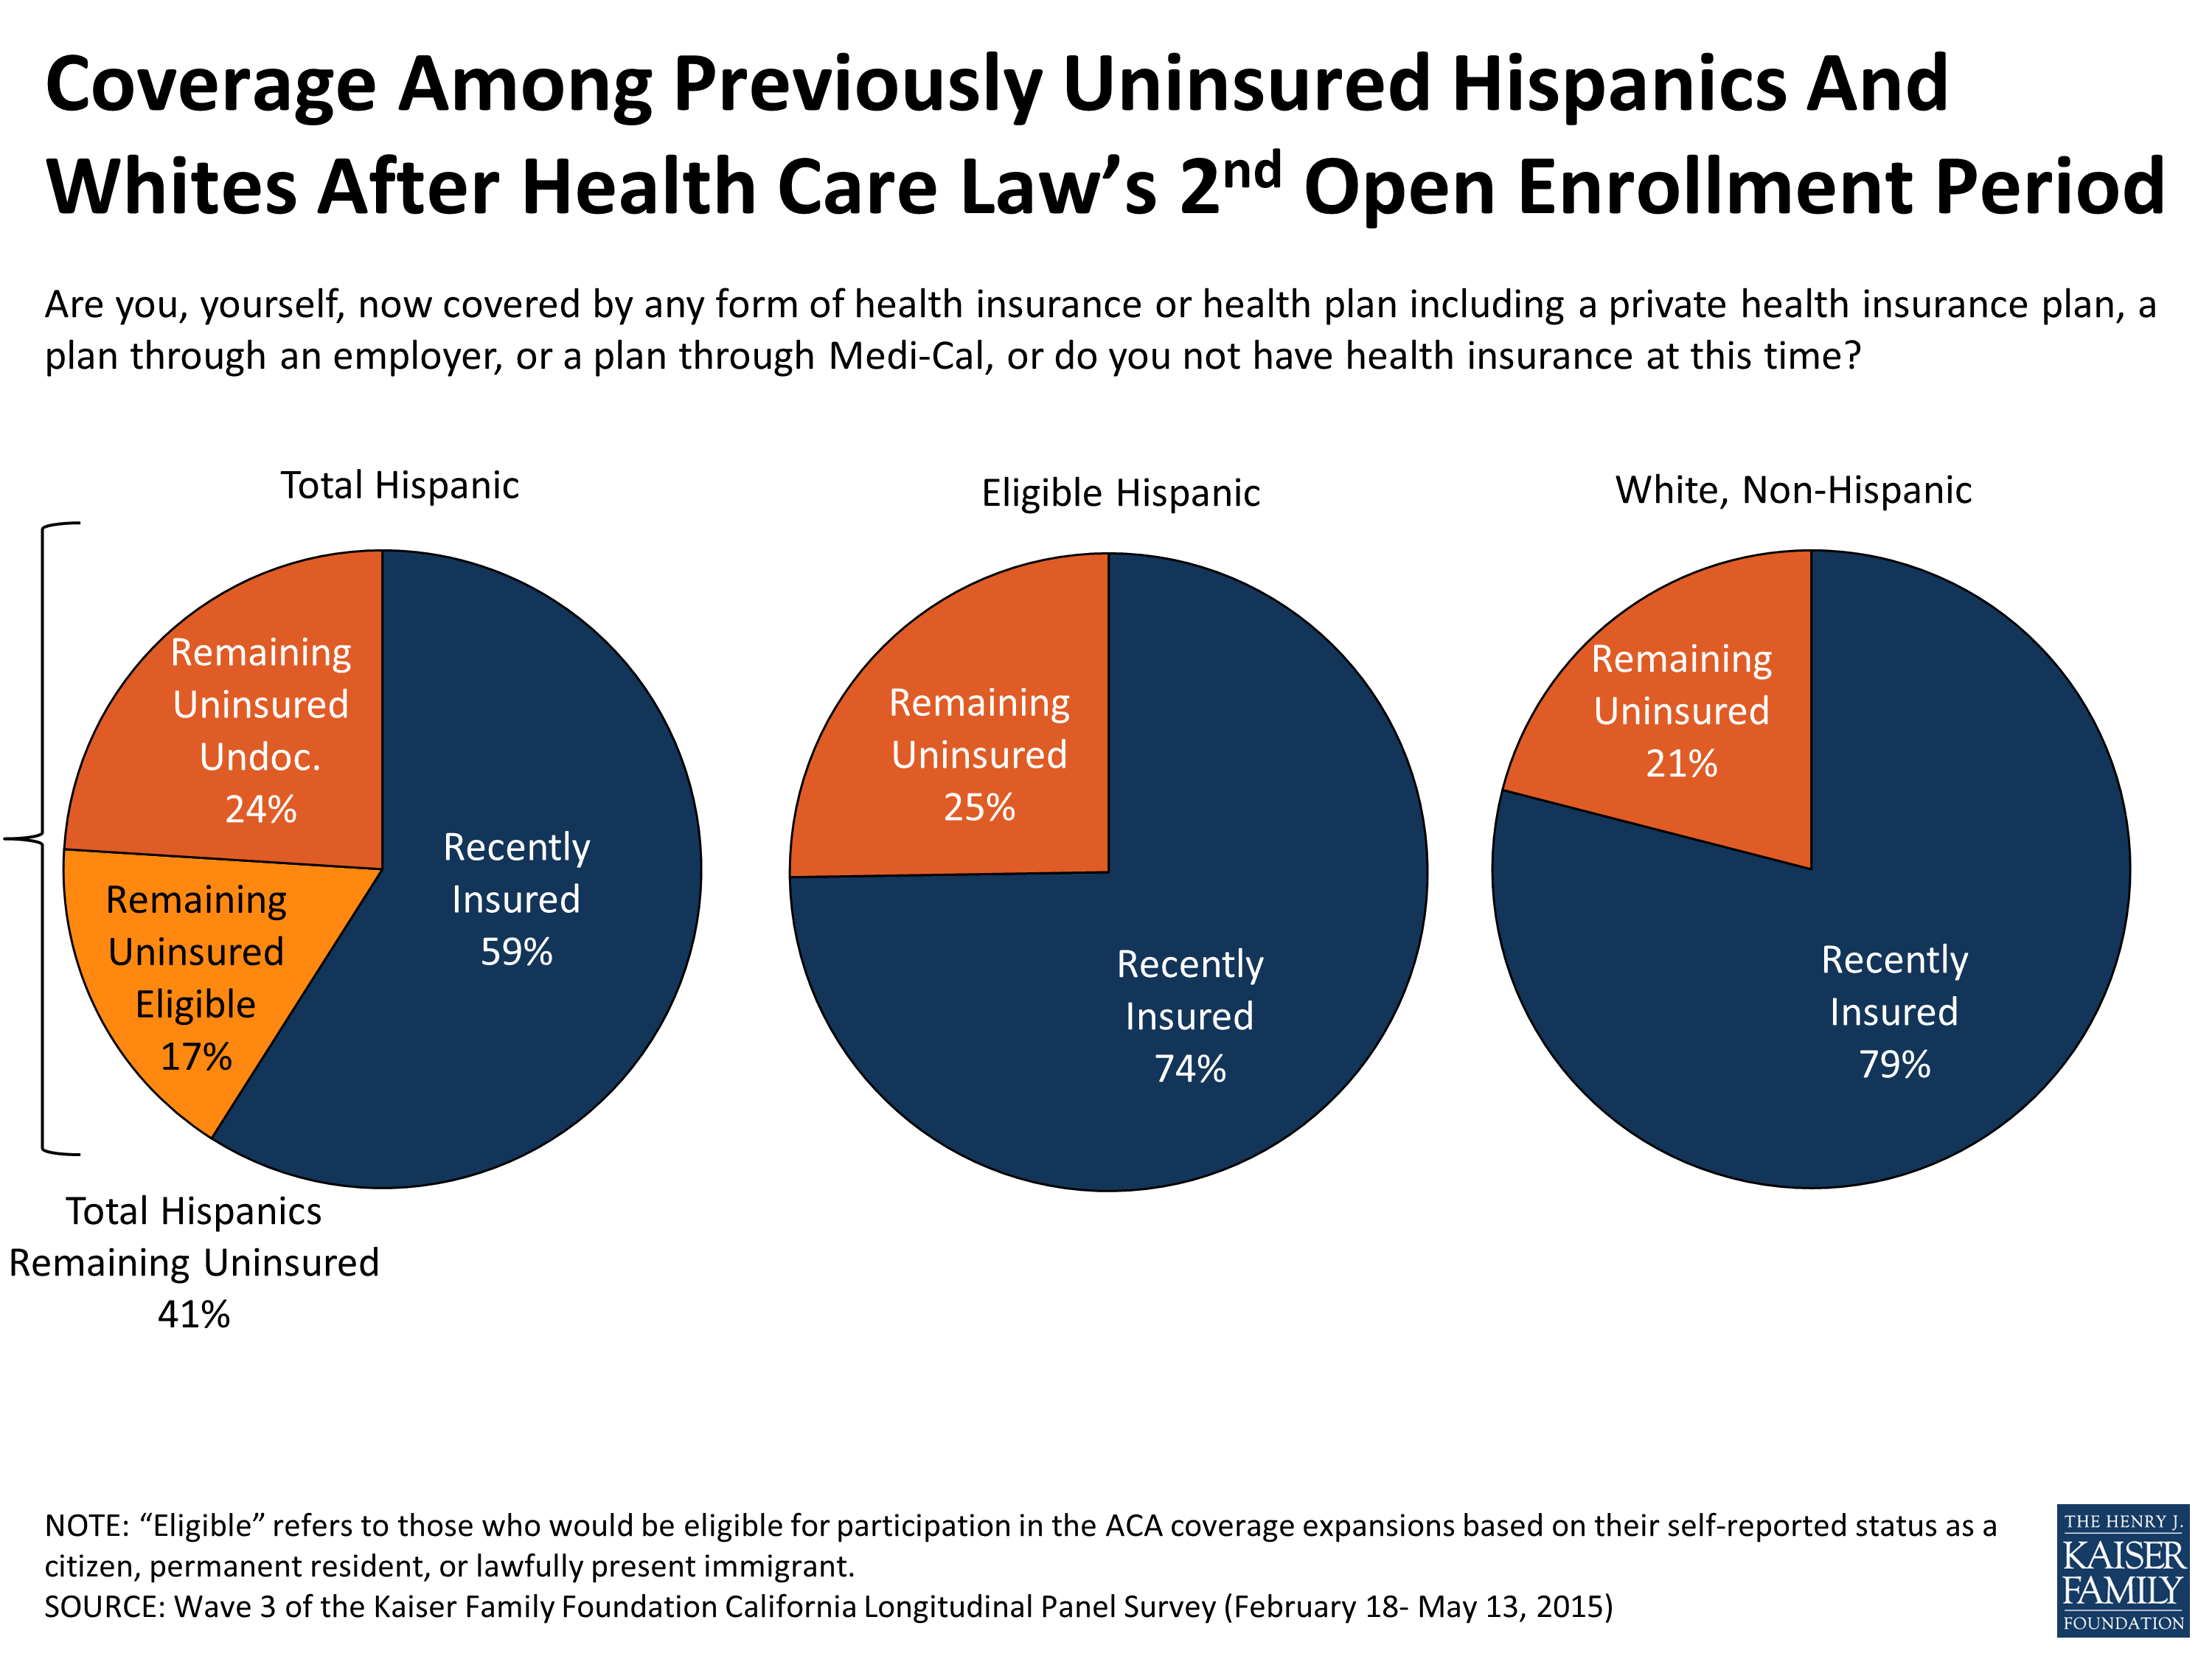
Figure 4
In addition, similar shares of many other demographic groups now report having coverage, such as men and women, people of different ages and people of different employment status. However, some groups have made particular gains in coverage or lagged somewhat behind. For example, previously uninsured people who report being in good health are more likely to say they have coverage than those who report being in fair or poor health (71 percent vs. 62 percent). In contrast, those who report having a debilitating chronic disease that keeps them from fully participating in work or other activities are more likely to say they have coverage now than those without significant chronic disease (78 percent vs. 66 percent). Just over half (53 percent) of those who say they’ve spent their lifetime without insurance now report having coverage, significantly lower than the more than 7 in 10 who said they had insurance at some point in the past who report gaining coverage since the health care law was implemented. Still, the gains in coverage among those who report never having coverage are notable. (Table 1)
| Table 1: Percentage Of Each Group Of Previously Uninsured Reporting That They Are Recently Insured Or Remain Uninsured | |||||||
| TOTAL RECENTLY INSURED IN 2015 | COVERAGE TYPE IN 2015 | TOTAL REMAINING UNINSURED IN 2015 | |||||
| Medi-Cal | Covered California | Other Non-Group | Employer-Sponsored Insurance | ||||
| TOTAL | 68% | 34% | 12% | 2% | 14% | 32% | |
| AGE | 19-34 | 68% | 32% | 11% | 1% | 20% | 32% |
| 35-49 | 62% | 33% | 11% | 2% | 12% | 38% | |
| 50-64 | 71% | 37% | 17% | 2% | 10% | 28% | |
| RACE | White non-Hispanic | 79% | 29% | 21% | 2% | 20% | 21% |
| Hispanic (NET) | 59% | 31% | 7% | 2% | 13% | 41% | |
| Hispanic, Eligible | 74% | 41% | 10% | 2% | 16% | 25% | |
| GENDER | Male | 65% | 28% | 10% | 2% | 18% | 35% |
| Female | 71% | 40% | 15% | 1% | 11% | 29% | |
| LENGTH OF TIME UNINSURED PRIOR TO ACA | 2mo – <1 year | 75% | 32% | 16% | 2% | 22% | 25% |
| 1 year to <2 years | 74% | 47% | 7% | 1% | 15% | 26% | |
| 2 or more years | 72% | 35% | 15% | 2% | 13% | 27% | |
| Never had insurance | 53% | 26% | 9% | 1% | 13% | 47% | |
| EMPLOYMENT | Employed | 65% | 26% | 15% | 1% | 20% | 34% |
| Unemployed | 74% | 47% | 7% | 3% | 5% | 26% | |
| A student, retired, on disability, or stay at home parent | 70% | 45% | 10% | 2% | 5% | 30% | |
| EDUCATION | High school or less | 61% | 37% | 8% | 1% | 11% | 39% |
| Some college | 75% | 34% | 15% | 1% | 18% | 25% | |
| College or more | 82% | 20% | 28% | 3% | 23% | 18% | |
| HEALTH STATUS | Excellent/ Very good/ Good | 71% | 33% | 15% | 2% | 15% | 29% |
| Fair/ Poor | 62% | 34% | 7% | 1% | 13% | 38% | |
| MARITAL STATUS | Married | 69% | 31% | 13% | 2% | 18% | 30% |
| Not married | 67% | 35% | 12% | 1% | 12% | 33% | |
| FAMILY INCOME | Less than 138% FPL | 65% | 48% | 6% | <1% | 7% | 34% |
| Between 138% – 400% FPL | 71% | 18% | 21% | 3% | 21% | 29% | |
| DEBILITATING CHRONIC CONDITION | Yes | 78% | 43% | 14% | 2% | 11% | 21% |
| No | 66% | 32% | 12% | 1% | 15% | 34% | |
Being contacted by phone, email or a door-to-door visit about signing up for health insurance appears to have played a role in some of California’s previously uninsured gaining or keeping coverage. Three-quarters (76 percent) of those who say they were personally contacted since November 15th say they now have coverage, compared to 64 percent of those who report that they were not contacted. At the same time, there is no statistical difference in gains in coverage for those who report seeing commercials in the past 30 days having to do with the health care law, Covered California or Medi-Cal and those who say they didn’t see such ads (70 percent vs. 62 percent).
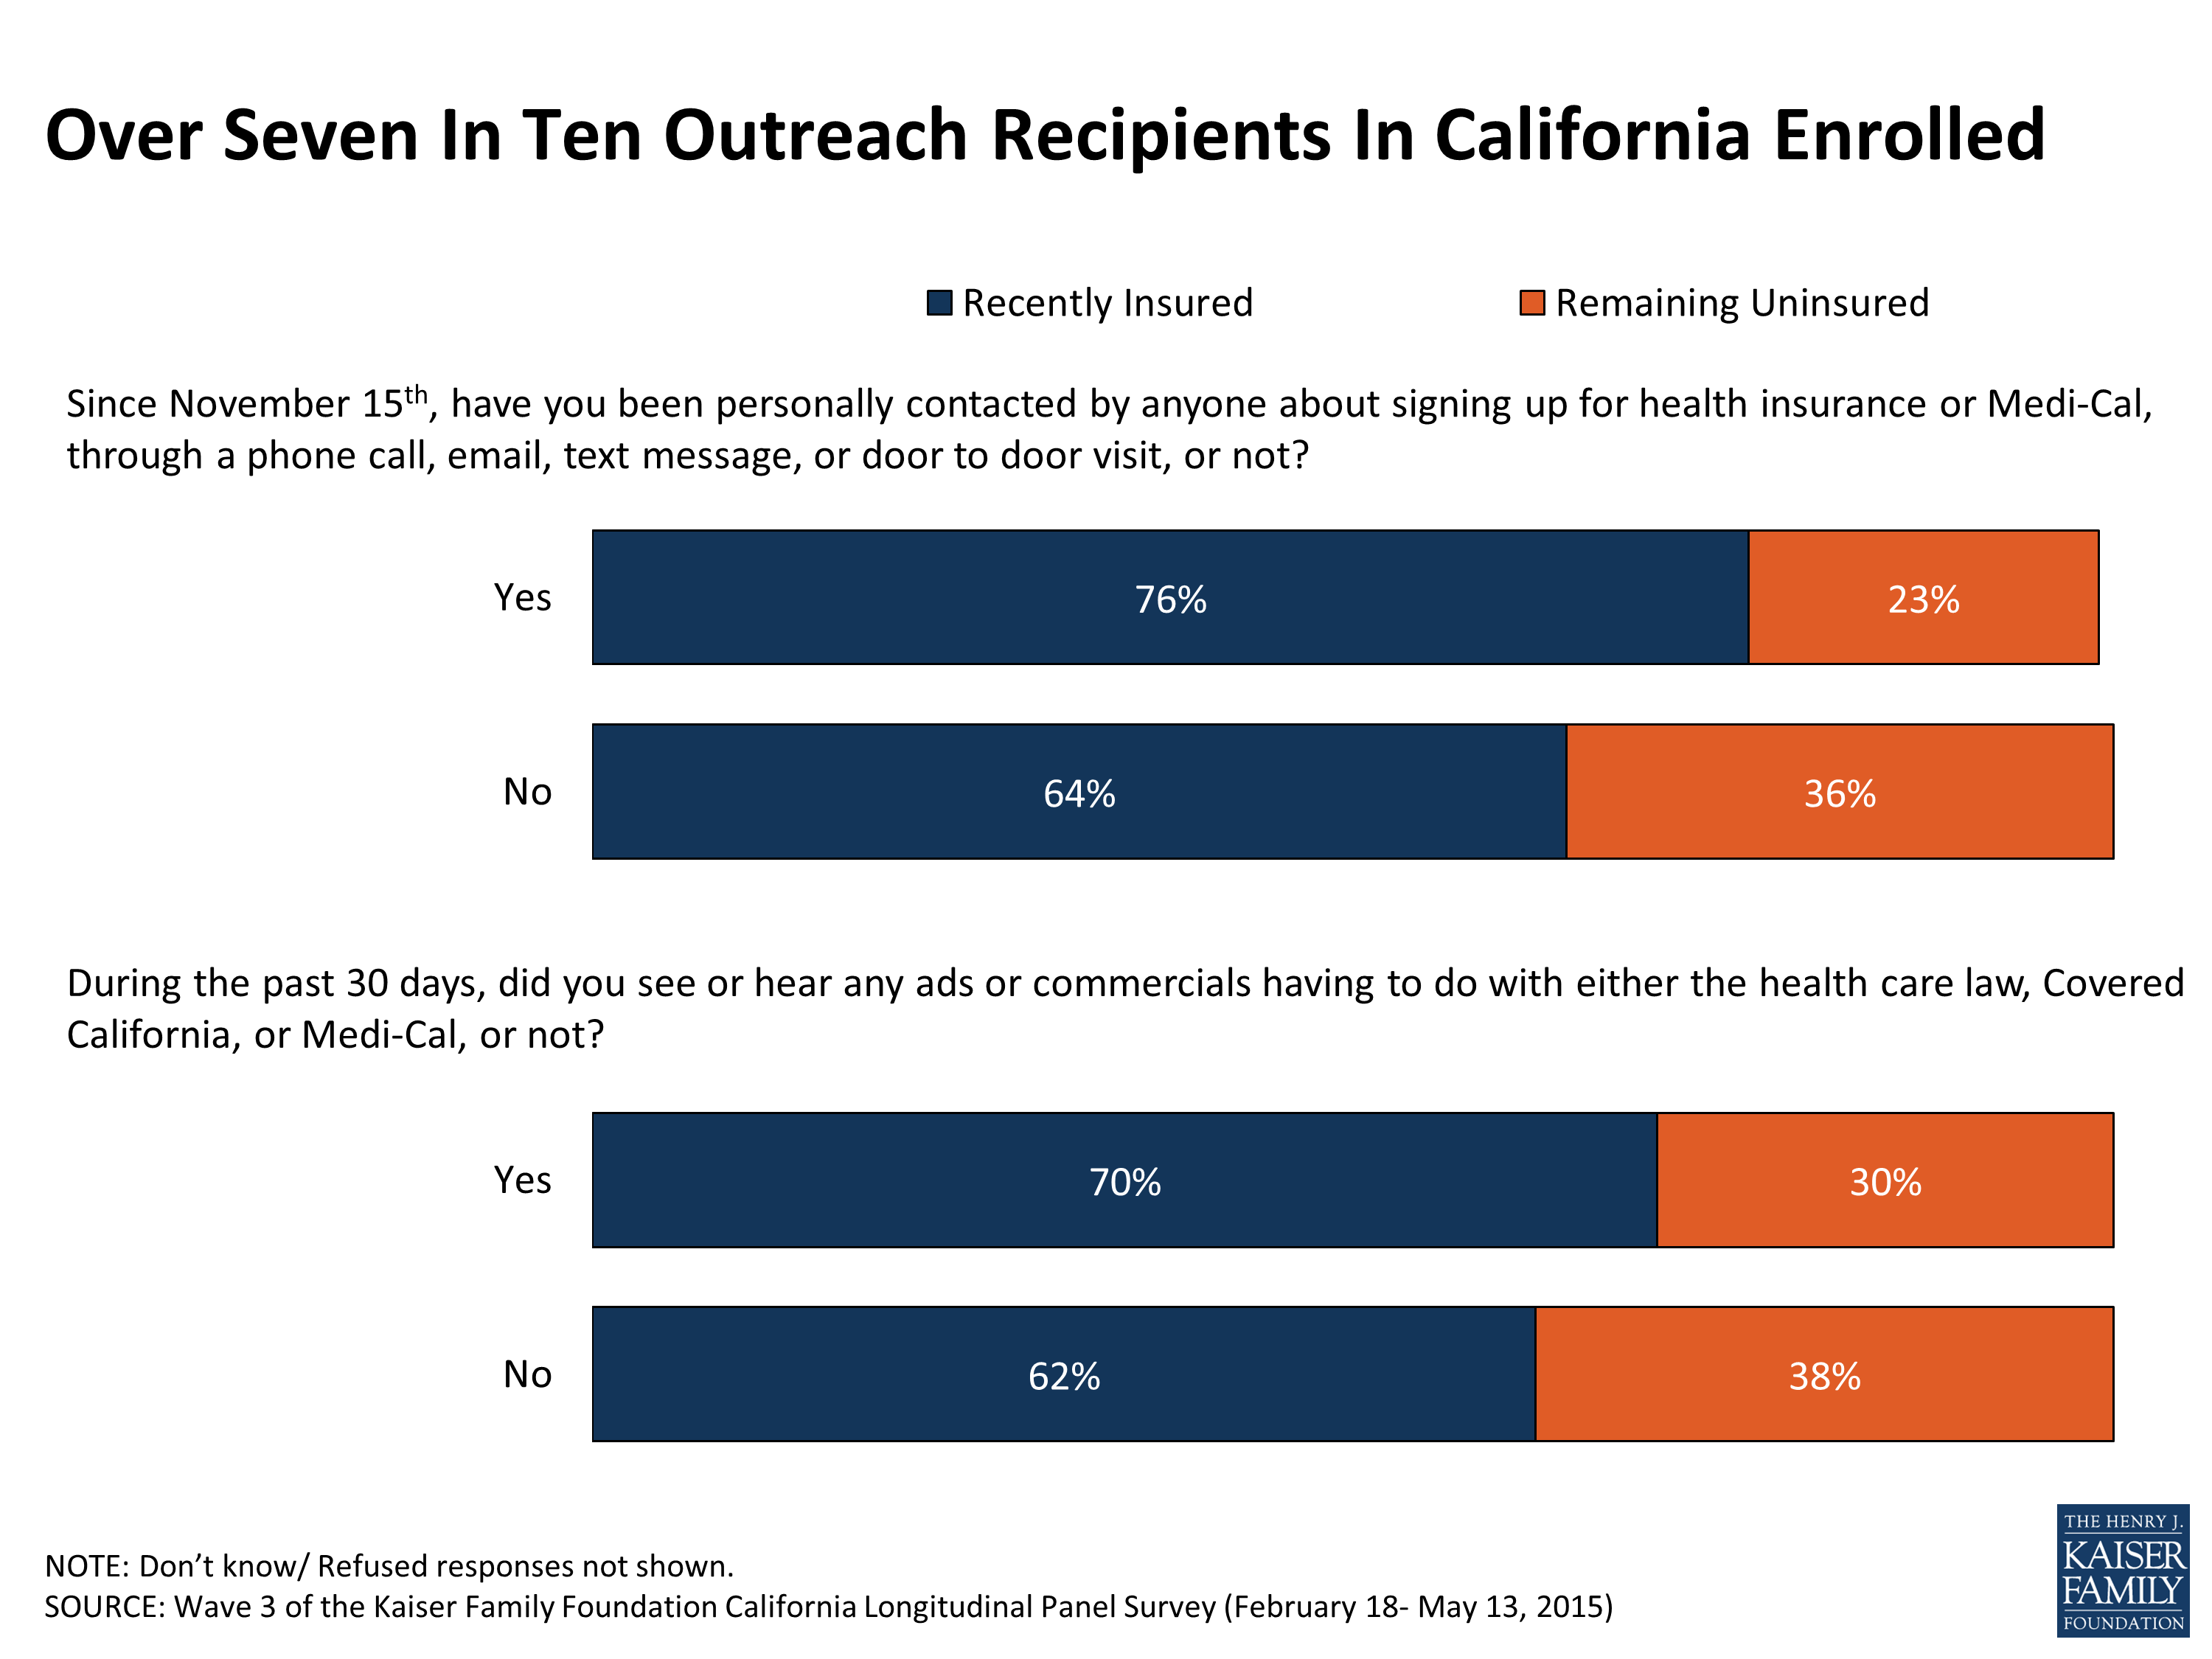
Figure 5
Many of these factors tend to be interconnected so in order to isolate which personal elements best predict who of California’s previously uninsured now has coverage, we conducted a regression analysis with demographic factors and outreach indicators. This analysis showed two factors mattered most. Previously uninsured Californians who say they are still uninsured are more likely to be undocumented immigrants or say they never had insurance, even after accounting for a variety of other demographic factors such as age, race/ethnicity, sex, and education.4
Views Of ACA’s Personal Impact Vary By Coverage Status And Type
Previously uninsured Californians vary in their opinion of the ACA’s impact on their lives. Large shares say the law has had no direct impact on them or their families; however, not surprisingly, the remaining uninsured are more likely to hold this view than those who have recently gained insurance in the two years since the law was implemented (66 percent vs. 44 percent). Additionally, those with recent insurance are more likely to say the ACA has helped them (41 percent) than hurt them (14 percent), while those who remain uninsured are more likely to say the law has hurt them rather than helped them (22 percent vs. 8 percent).
Among the recently insured, perceptions of the ACA’s personal impact vary by plan type. Those who report receiving coverage through Covered California and Medi-Cal are more likely to say the law has helped them than those who report having employer-sponsored insurance. About 6 in 10 (62 percent) of those enrolled through Covered California and about 4 in 10 (43 percent) of those with Medi-Cal coverage say the law has helped them. Most with recent coverage through an employer say they have felt no direct impact (59 percent), and for those who have, they are evenly divided on whether they have been helped or hurt (20 percent vs. 21 percent).
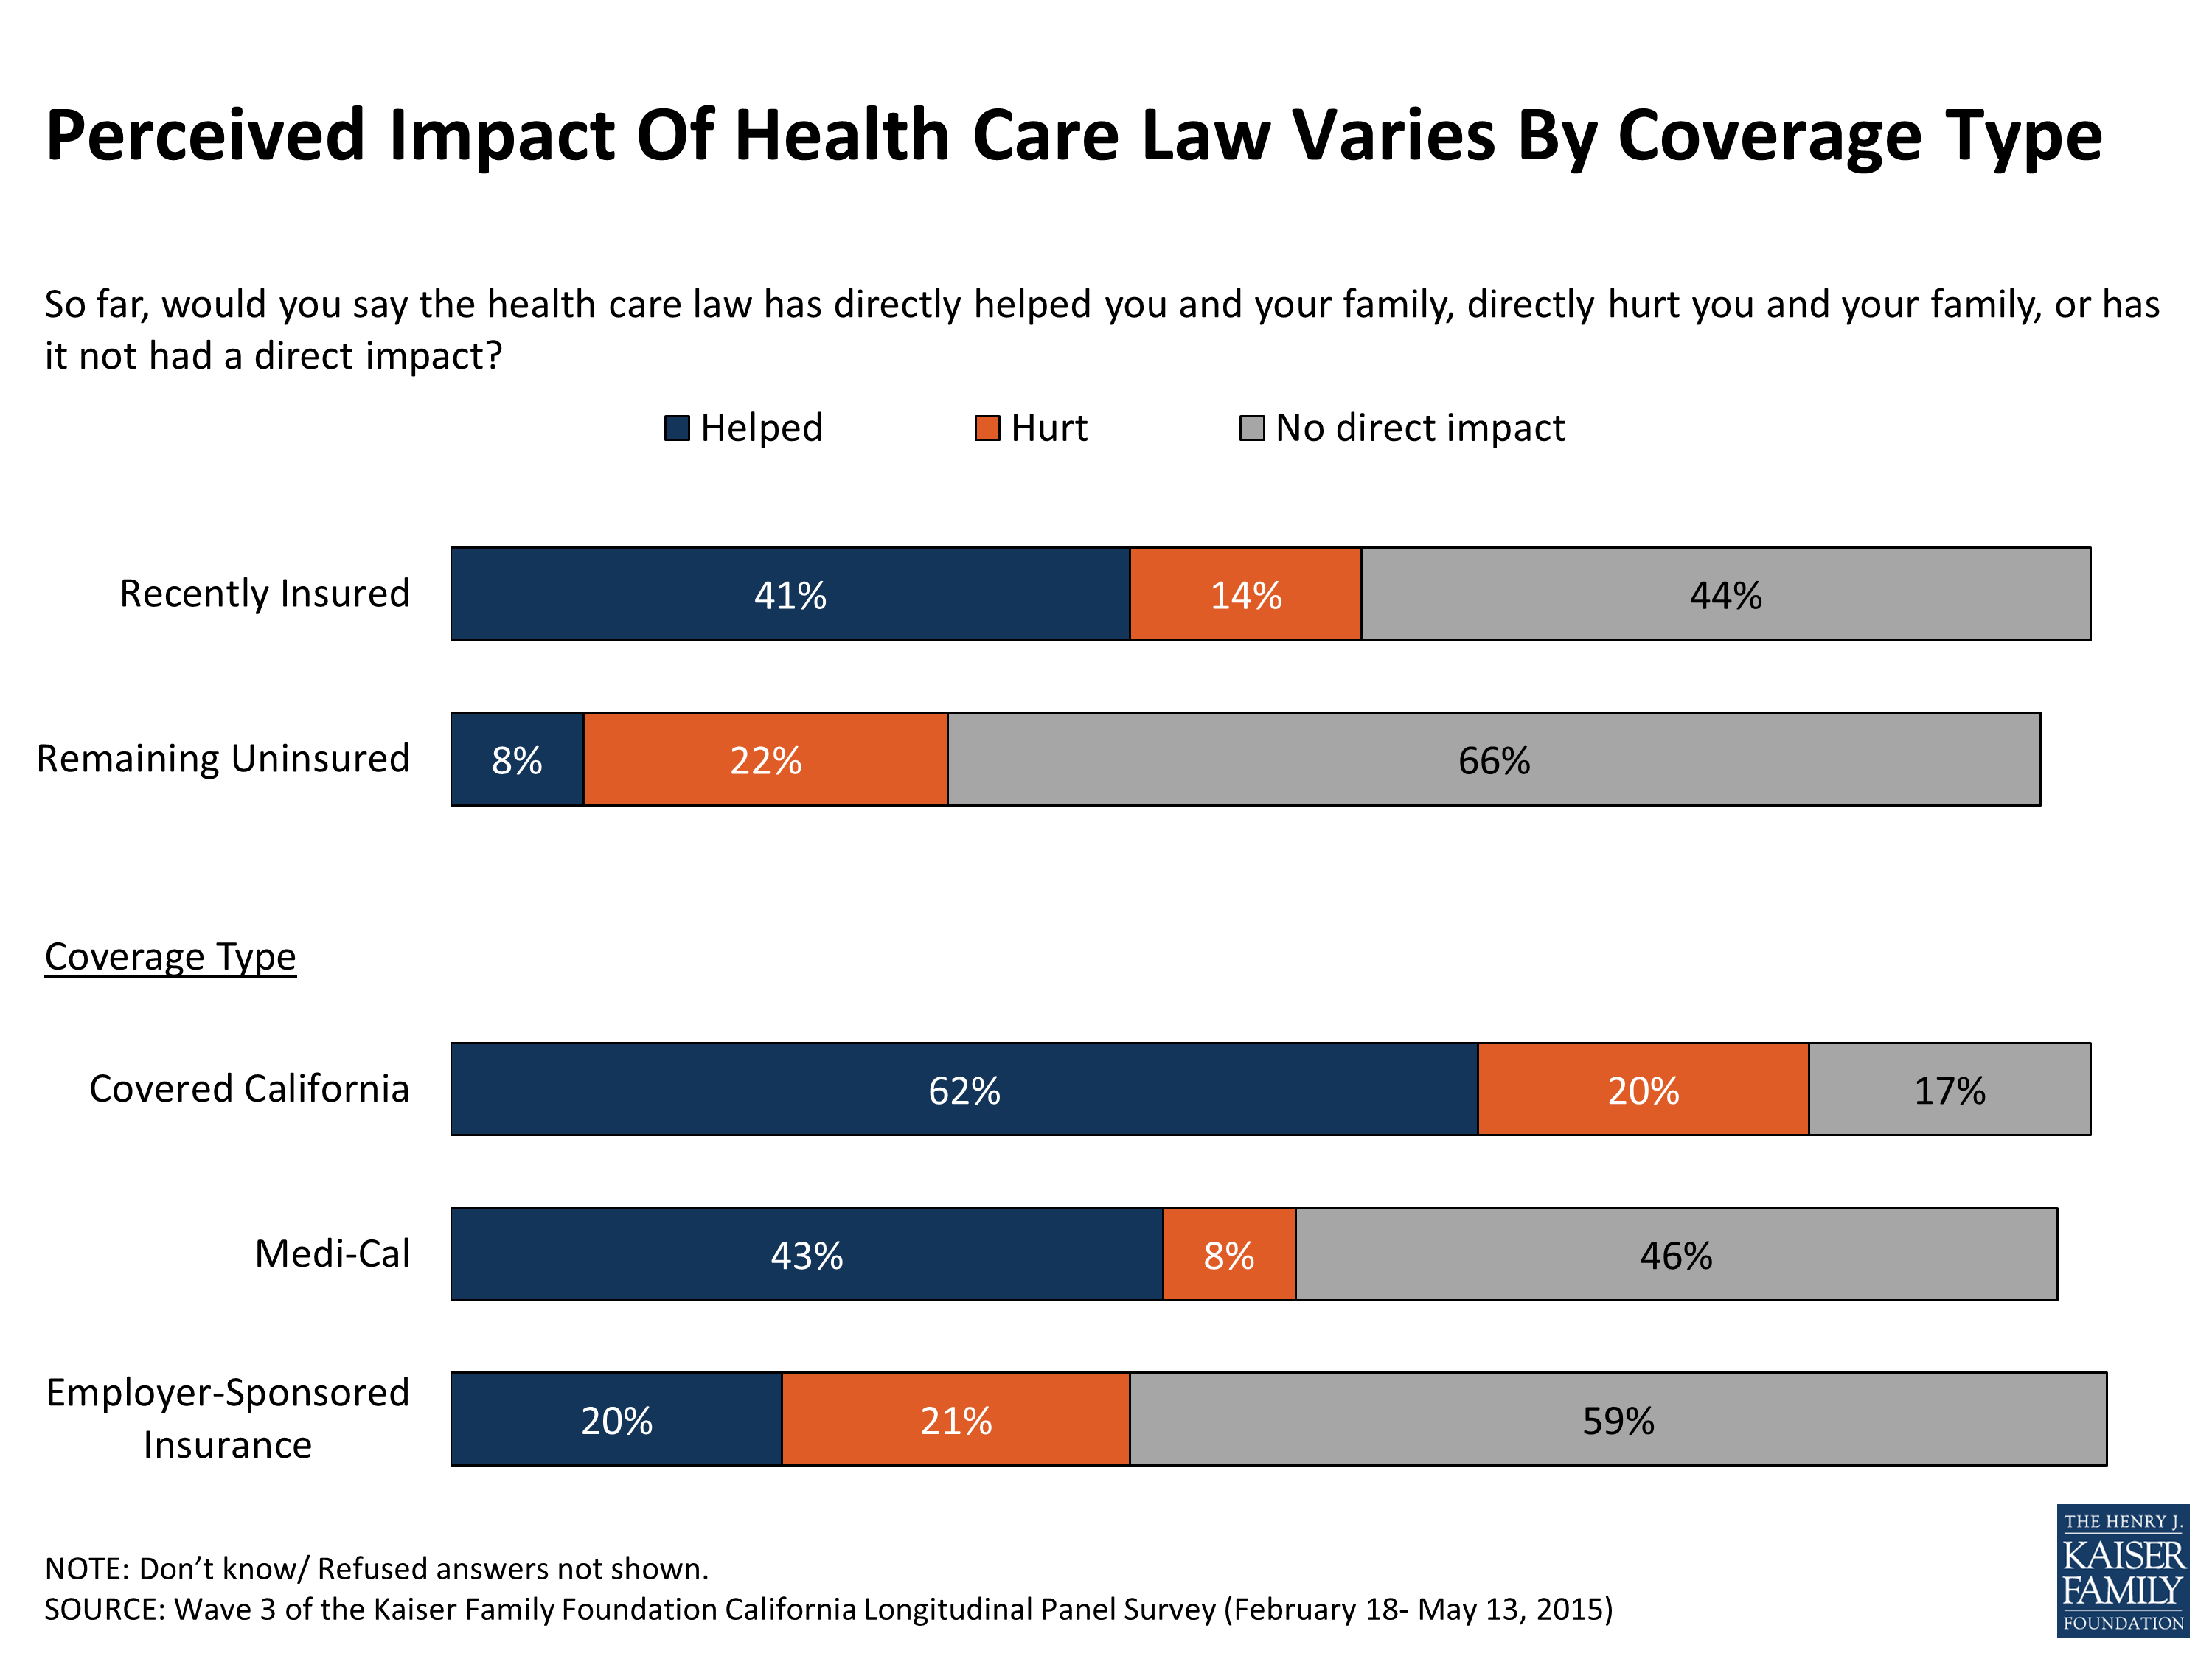
Figure 6
Dynamics In Enrollment And Coverage
People tend to move in and out of coverage as their income, employment status and other life factors change, particularly those with lower-incomes or recent experience being uninsured. One of the primary advantages of a longitudinal panel survey is the ability to examine these movements by following the same group of people over time.
Many (50 percent) Californians who reported being uninsured prior to the ACA’s first open enrollment period, reported gaining insurance in the spring 2014, after the first open enrollment period, and also now say they have coverage after the second open enrollment period in spring 2015, referred to here as those “still insured.”5 While these people may have fluctuated in and out of coverage or changed plans over the course of the year, they are not necessarily new to health insurance. Another 19 percent of California’s previously uninsured are more likely to be new to their coverage because they reported being uninsured after the first open enrollment period in the spring of 2014. This group is referred to here as the “newly insured.”6
In addition, 23 percent of people reported being uninsured after both open enrollment periods and another 8 percent said they had coverage after the first open enrollment period but now say they are without health insurance. These groups combined are referred to here as the “remaining uninsured.”
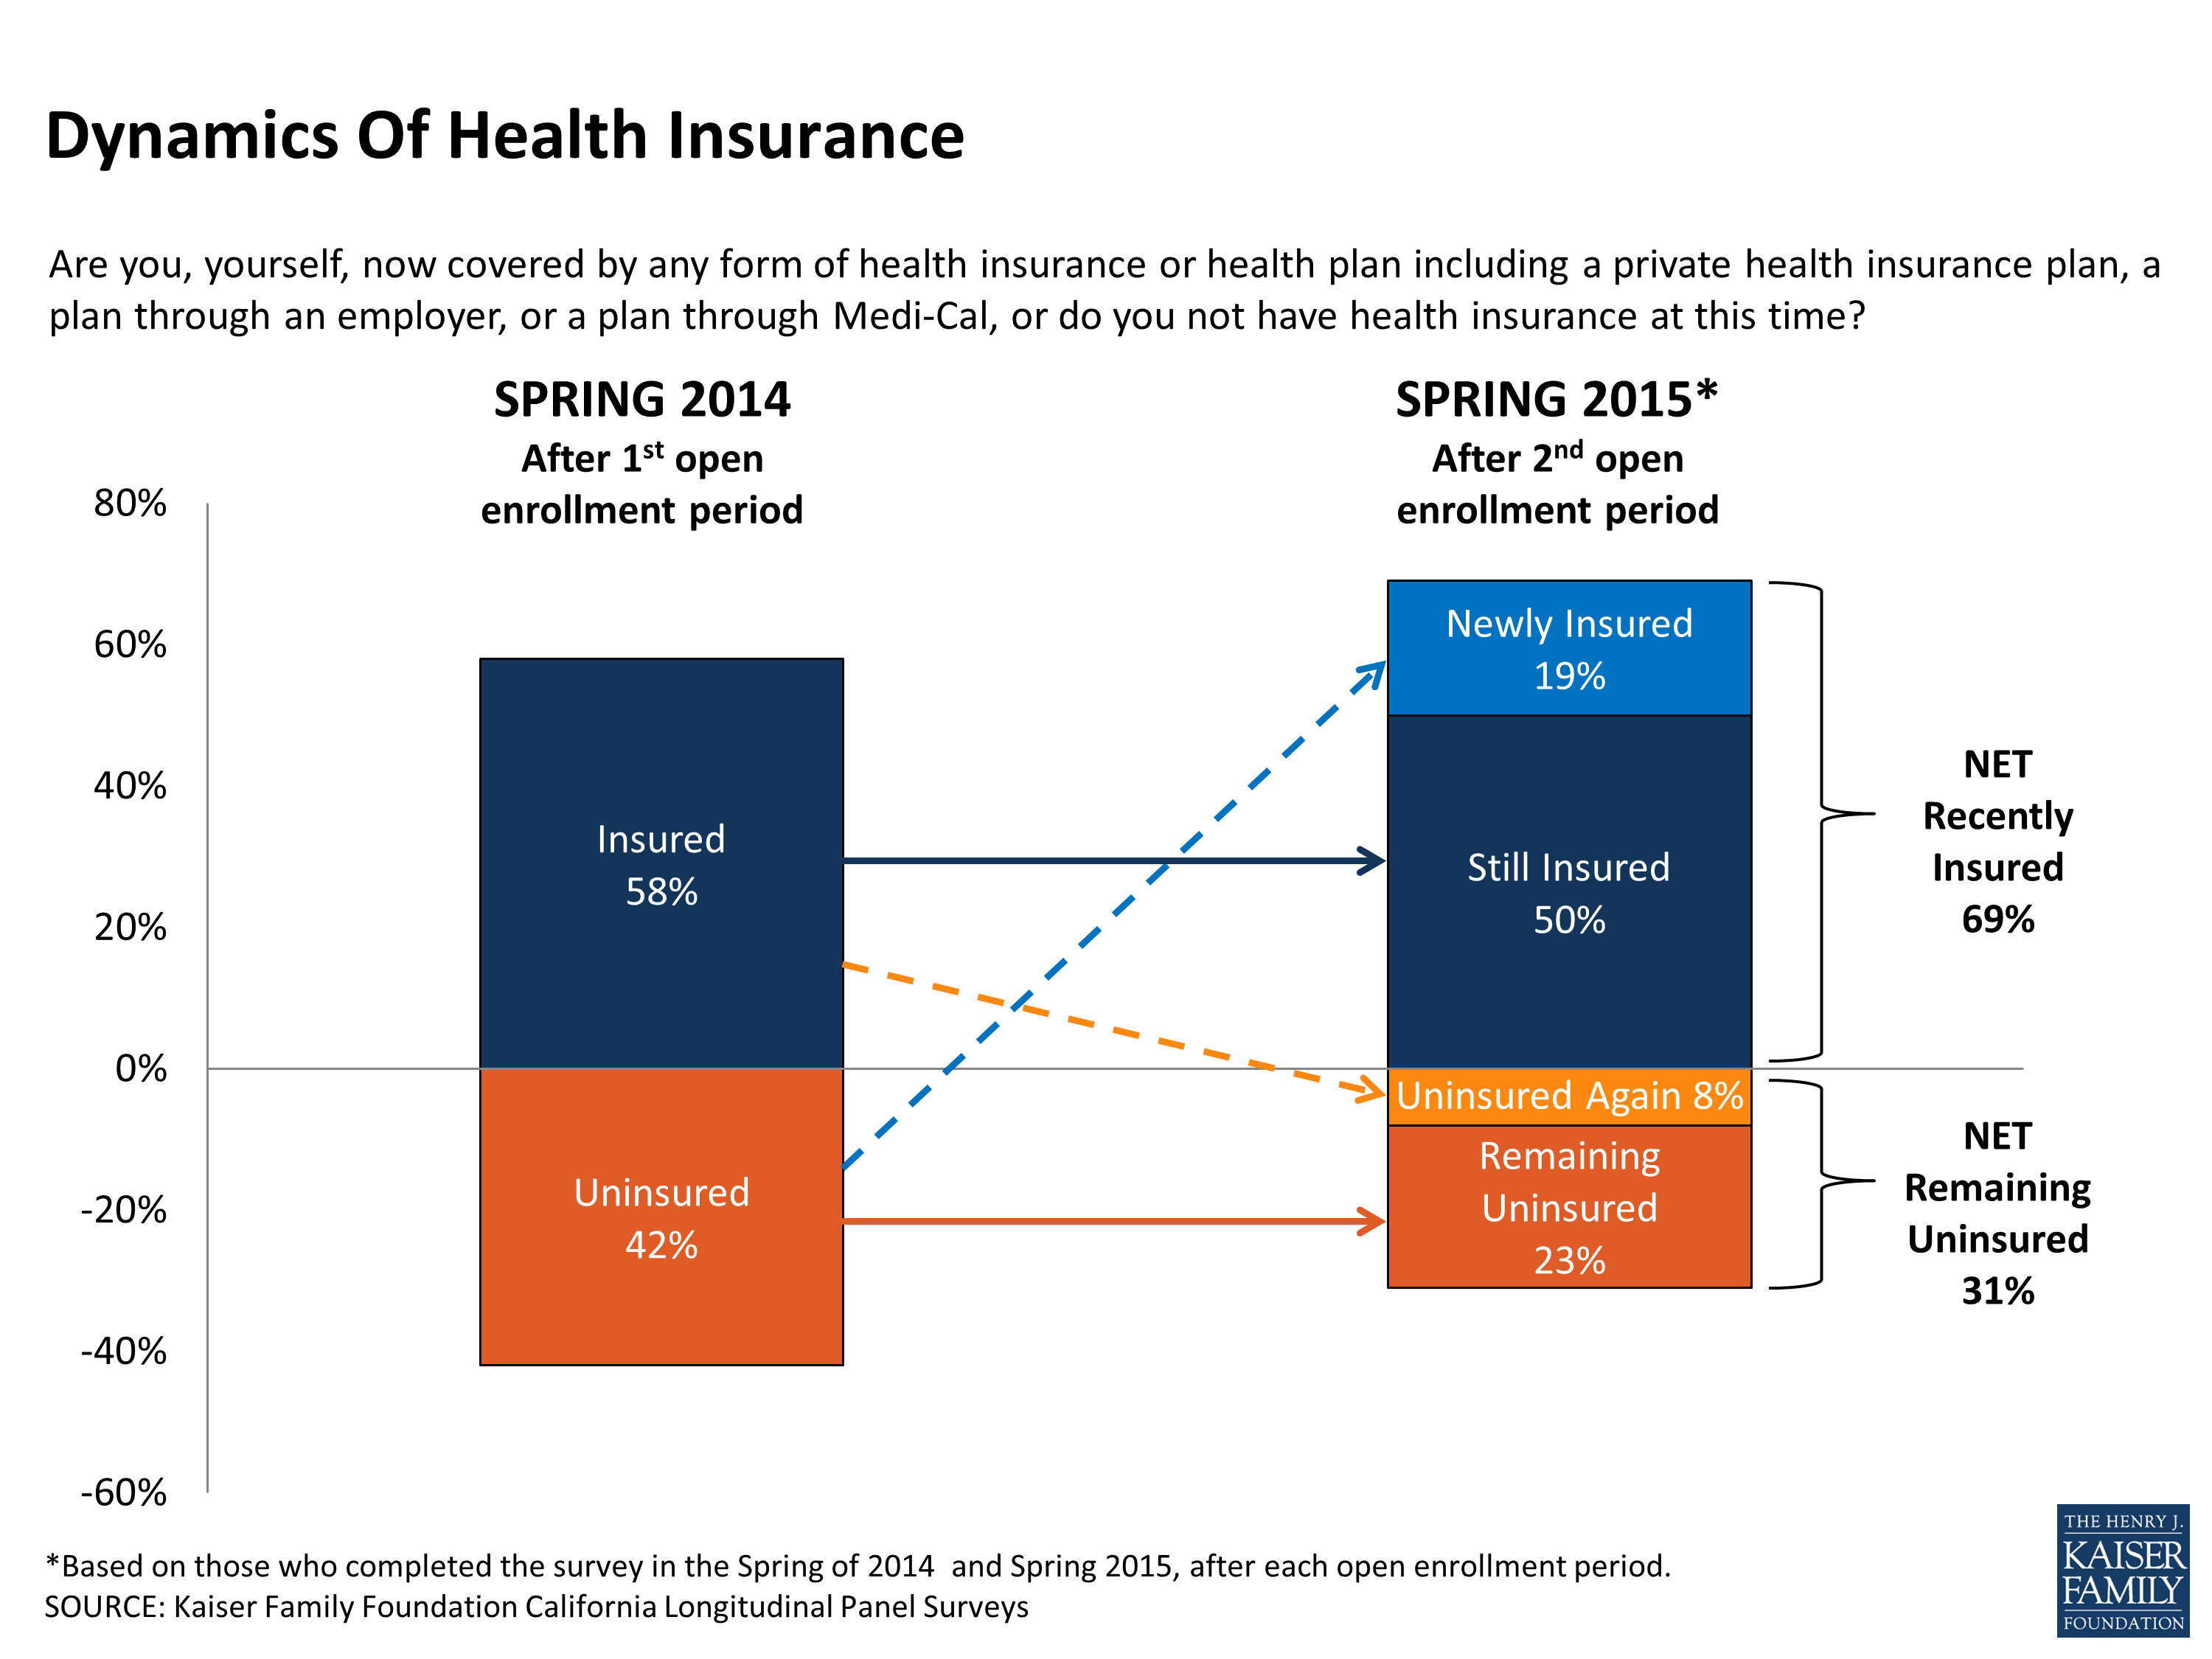
Figure 7
These groups are worth a closer look to better understand who took longer to gain coverage, who went back to being uninsured, who remains without coverage, and who continues to report having coverage. Majorities of the remaining uninsured (69 percent) are Hispanic, compared to 43 percent of those still insured. In addition, the newly insured (59 percent) are more likely to be men than those still insured (44 percent). A striking 40 percent of the remaining uninsured said during the baseline survey prior to the ACA’s first open enrollment period that they have never had insurance, while smaller shares of the newly insured (23 percent) and the still insured (18 percent) say they have never had coverage. Those who are still insured (19 percent) are more likely to say they have a debilitating chronic condition than the newly insured (10 percent) or remaining uninsured (9 percent). (Table 2)
| Table 2: Demographics Of Each Group Of Previously Uninsured Californians* | ||||
| NEWLY INSURED IN 2015 (19%) |
STILL INSURED IN 2015 (50%) |
REMAINING UNINSURED IN 2015 (31%) |
||
| AGE | 19-34 | 32% | 39% | 34% |
| 35-49 | 34% | 26% | 40% | |
| 50-64 | 30% | 31% | 24% | |
| 65+ | 4% | 4% | 1% | |
| RACE | White non-Hispanic | 34% | 34% | 20% |
| Black non-Hispanic | 9% | 6% | 3% | |
| Other non-Hispanic | 2% | 16% | 7% | |
| Hispanic | 53% | 43% | 69% | |
| Hispanic, eligible | 42% | 37% | 26% | |
| Hispanic, undocumented | 11% | 6% | 41% | |
| GENDER | Male | 59% | 44% | 53% |
| Female | 41% | 56% | 47% | |
| LENGTH OF TIME UNINSURED PRIOR TO ACA | 2 months to less than a year | 8% | 18% | 9% |
| 1 year to less than 2 years | 15% | 18% | 11% | |
| 2 years or more | 53% | 46% | 41% | |
| Never had insurance | 23% | 18% | 40% | |
| EMPLOYMENT | Employed | 68% | 56% | 63% |
| Unemployed | 13% | 15% | 14% | |
| A student, retired, on disability, or stay at home parent | 19% | 29% | 23% | |
| EDUCATION | High school or less | 53% | 47% | 70% |
| Some college | 37% | 33% | 23% | |
| College or more | 10% | 19% | 6% | |
| HEALTH STATUS | Excellent/ Very good/ Good | 59% | 69% | 61% |
| Fair/ Poor | 41% | 31% | 39% | |
| MARITAL STATUS | Married | 41% | 38% | 37% |
| Not married | 59% | 62% | 62% | |
| FAMILY INCOME | Less than 138% FPL | 56% | 54% | 61% |
| Between 138% – 400% FPL | 40% | 39% | 34% | |
| Over 400% FPL | 4% | 6% | 5% | |
| DEBILITATING CHRONIC CONDITION | Yes | 10% | 19% | 9% |
| No | 90% | 79% | 90% | |
| SAW OR HEARD ANY ADS | Yes, saw or heard ads | 70% | 70% | 61% |
| No, did not see or hear ads | 30% | 30% | 39% | |
| PERSONALLY CONTACTED | Yes, been contacted | 26% | 34% | 19% |
| No, have not been contacted | 74% | 66% | 81% | |
| *Based on those who completed the survey in spring 2014 and spring 2015, after each open enrollment period. | ||||