A Closer Look at the Final Nursing Facility Rule and Which Facilities Might Meet New Staffing Requirements

Published: May 21, 2024

On April 22, 2024, the Centers for Medicare and Medicaid Services (CMS) released a highly-anticipated final rule that creates new requirements for nurse staffing levels in nursing facilities, settings that provide medical and personal care services for 1.2 million Americans. CMS received nearly 50,000 comments on the proposed rule, ranging from comments that strongly supported the proposed standards to those that strongly opposed them. Among those comments, the nursing home industry suggested the rule was too strict and could lead to nursing facility closures, while resident and family advocates suggested the proposed standards were too weak to address well-documented concerns about substandard facility conditions, unattended residents, and poor patient care. The adequacy of staffing in nursing homes has been a longstanding issue, and the high mortality rate in nursing facilities during the COVID-19 pandemic highlighted and intensified the consequences of inadequate staffing levels.

This analysis discusses the provisions of the final rule, including changes made by the Administration from the proposed rule, and examines the percentage and characteristics of nursing facilities that currently meet the minimum staffing requirements in the final rule, which takes effect beginning in May 2026 for some facilities. The analysis estimates the percentage of facilities that could meet the requirements based on current staffing levels, examining the percent of facilities that meet all requirements—including 3.48 hours per resident day (HPRD), with 0.55 HPRD for RNs and 2.45 HPRD for nurse aides—and the percent that meet each requirement individually. In practice, facilities have several years to comply with the new requirements: the requirement to have overall staffing levels of 3.48 HPRD takes effect in 2026 for urban facilities and in 2027 for rural facilities, and the RN and nurse aide HPRD requirements take effect in 2027 for urban facilities and in 2029 for rural facilities. Facilities will also be allowed to apply for temporary exemptions from part or all of the final requirements if they meet certain conditions. The federal government estimates that a quarter of all 15,000 nursing facilities could end up obtaining an exemption.

This analysis uses Nursing Home Compare data from April 2024, which includes 14,448 nursing facilities (97% of all facilities, serving 1.18 million or 99% of all residents), and reflects staffing levels from October to December 2023. Due to data limitations, the analysis does not evaluate facilities’ ability to comply with other requirements in the final rule, including the requirement to always have a registered nurse on duty 24/7 or the ability to meet the new reporting and assessment requirements (see Methods).

Key takeaways include:

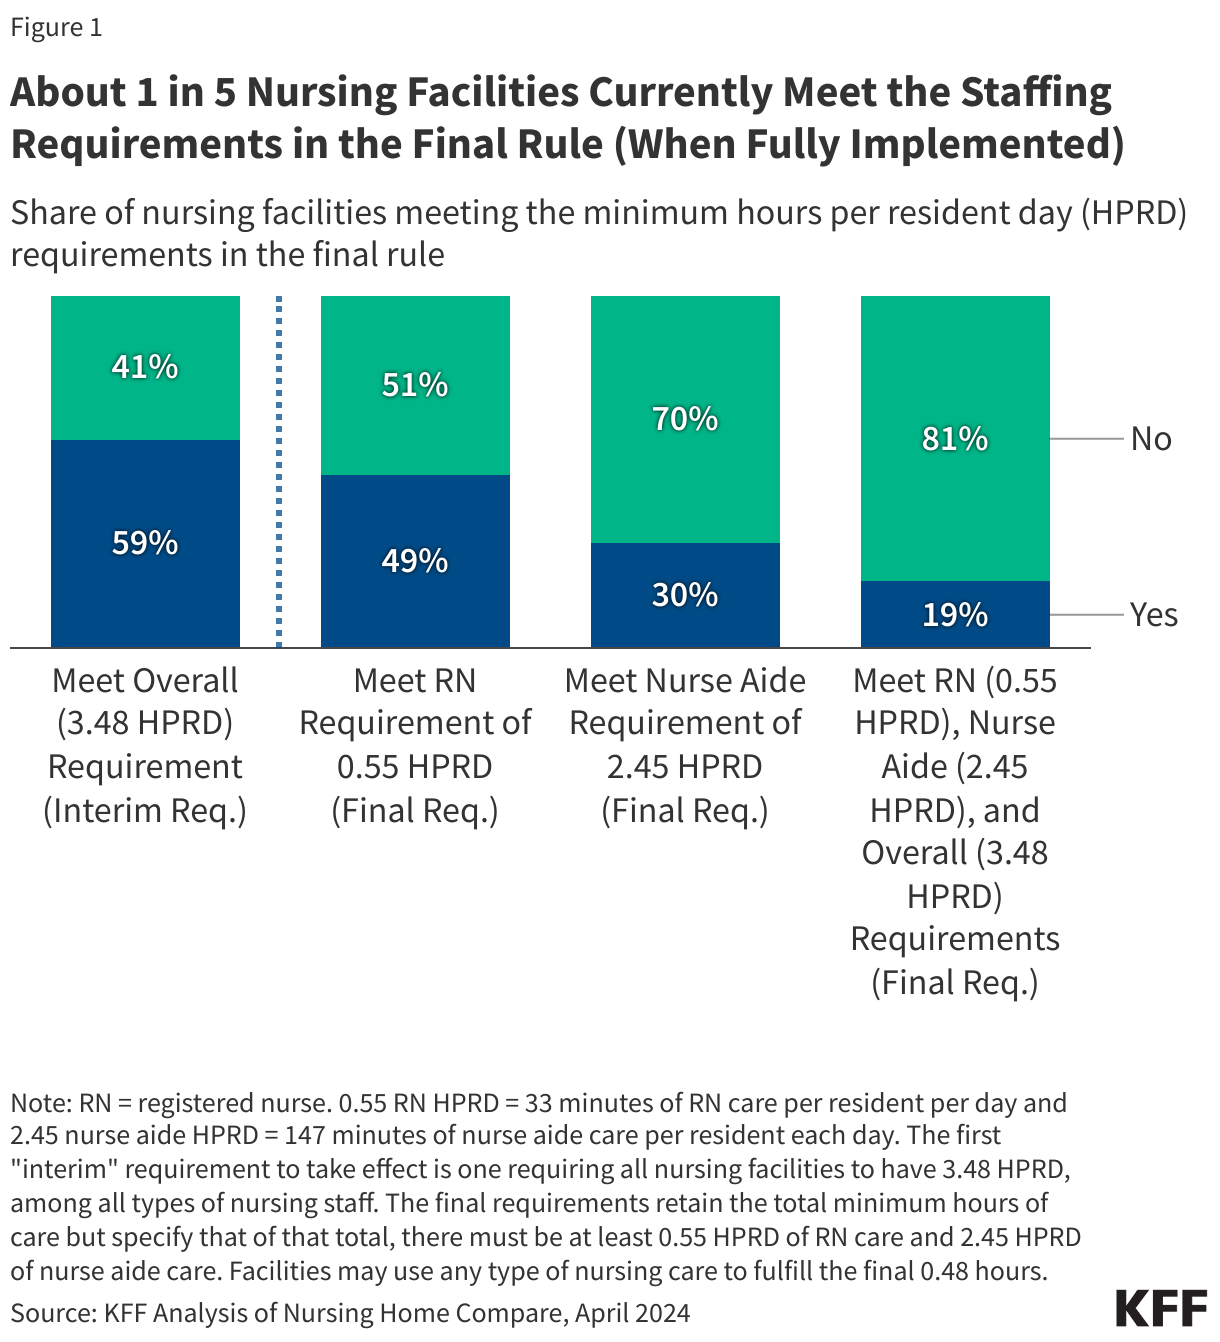
  • Less than one in five (19%) of nursing facilities currently meet all three staffing minimums required in the final rule (Figure 1), which include 3.48 HPRD overall, 0.55 RN HPRD, and 2.45 NA HPRD. Nearly 60% of facilities would meet the interim requirement of an overall requirement of 3.48 HPRD.
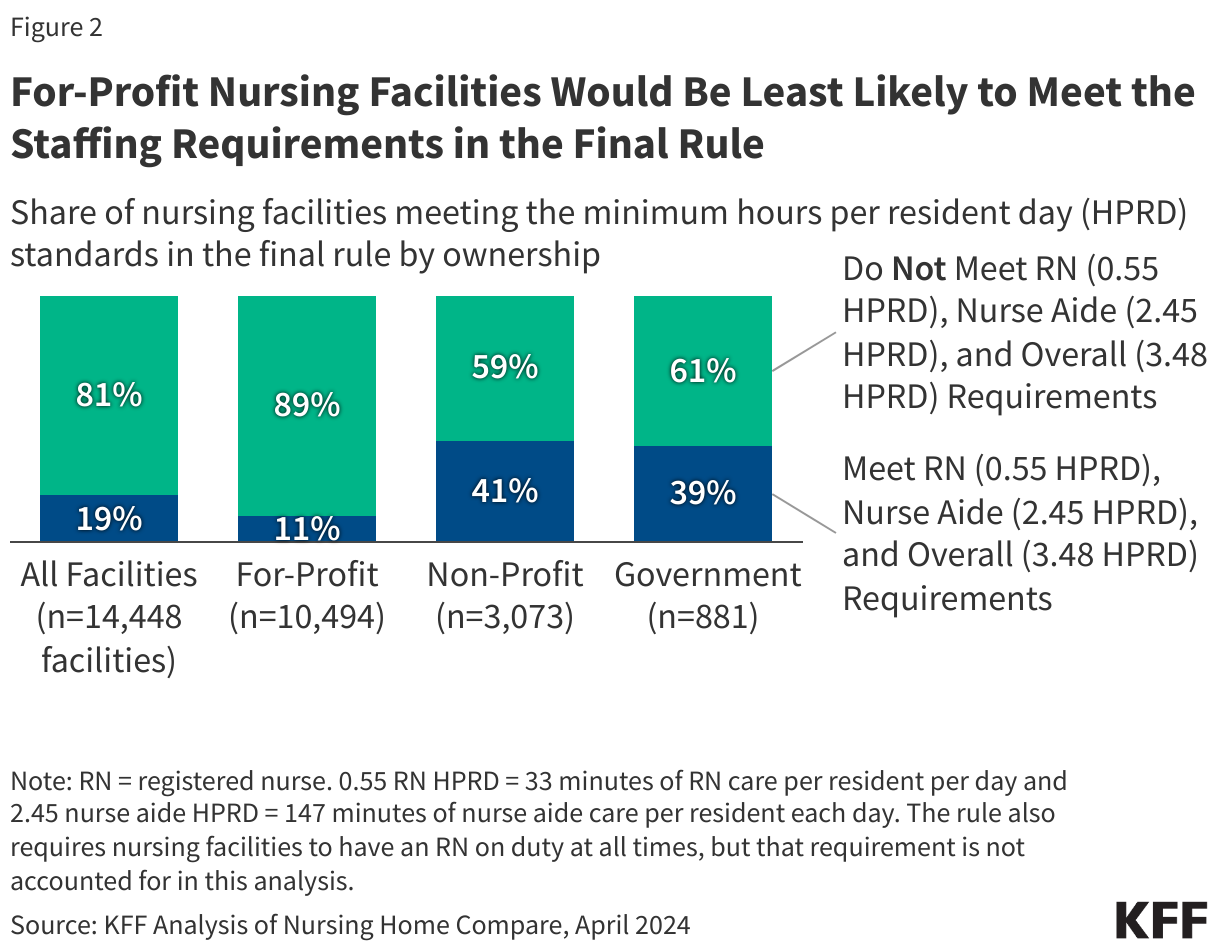
  • A smaller share of for-profit facilities currently meet all requirements in the final rule than non-profit and government facilities (11% versus 41% and 39%, respectively).
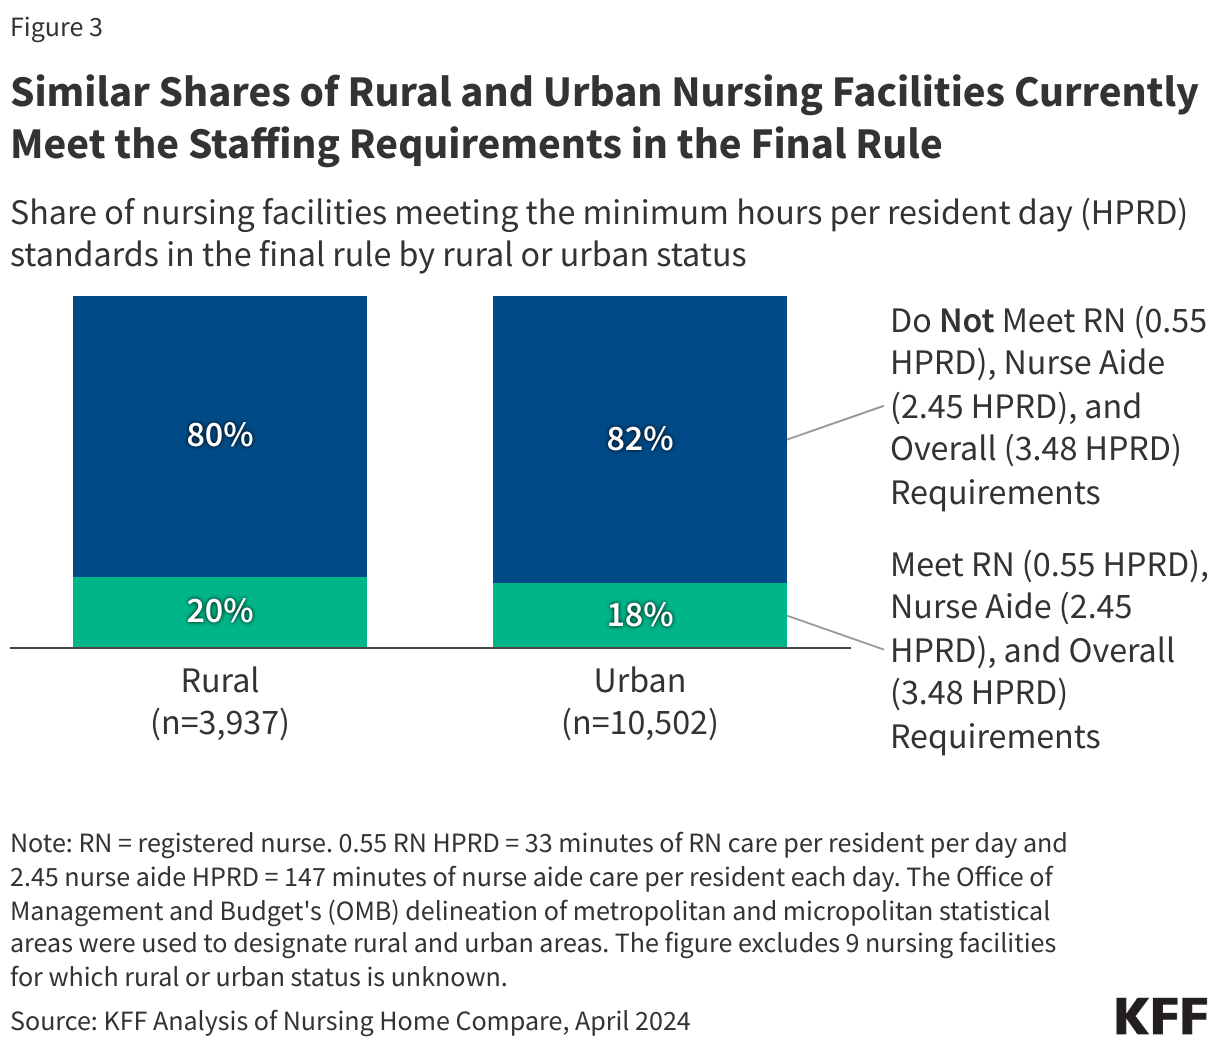
  • Rural nursing homes are as likely as urban facilities to meet the final rule’s requirements based on current staffing levels, but rural facilities will have longer to comply with the new requirements.
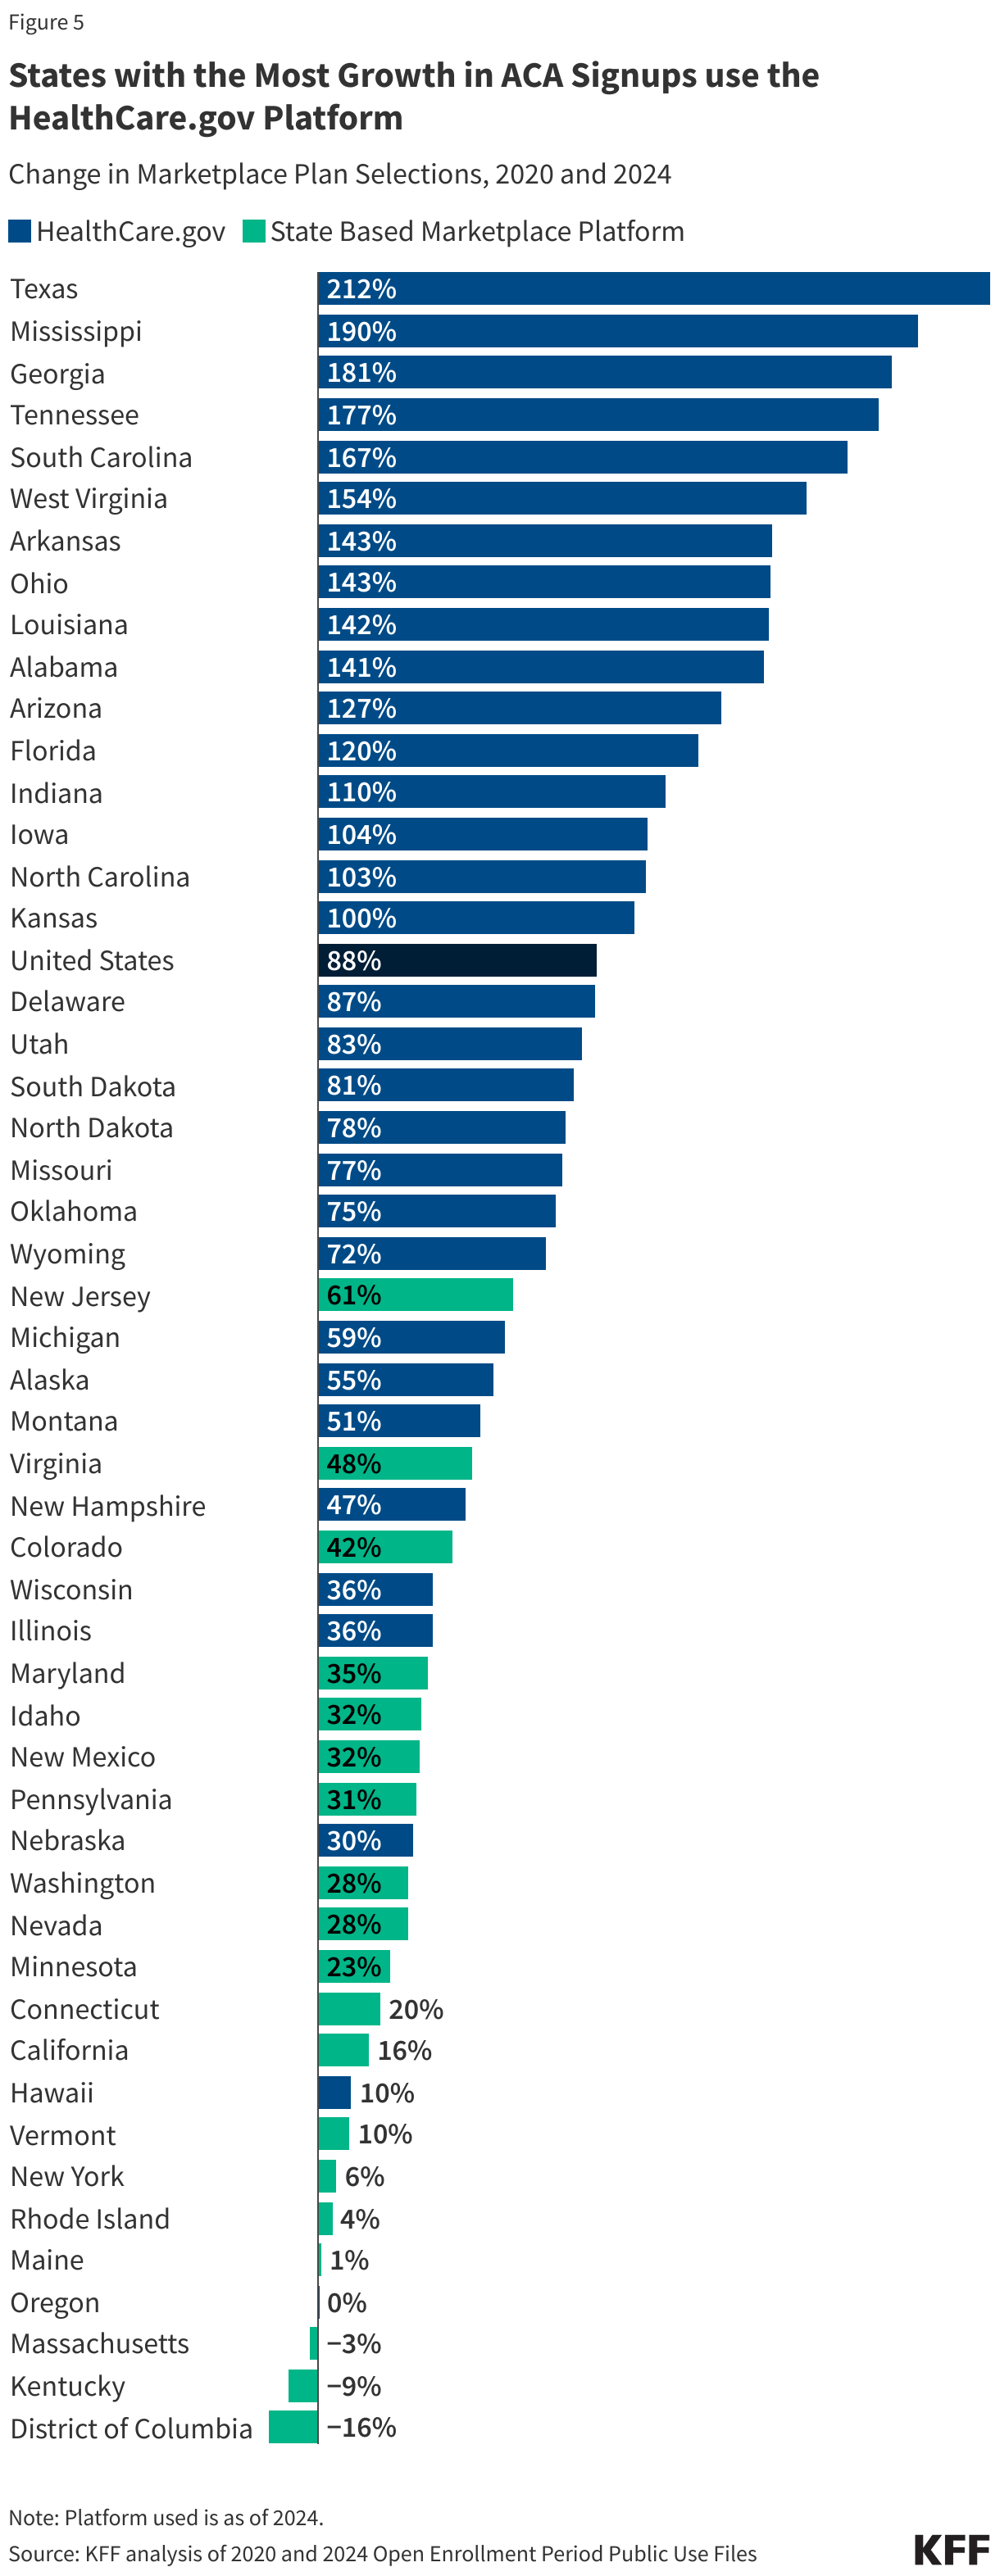
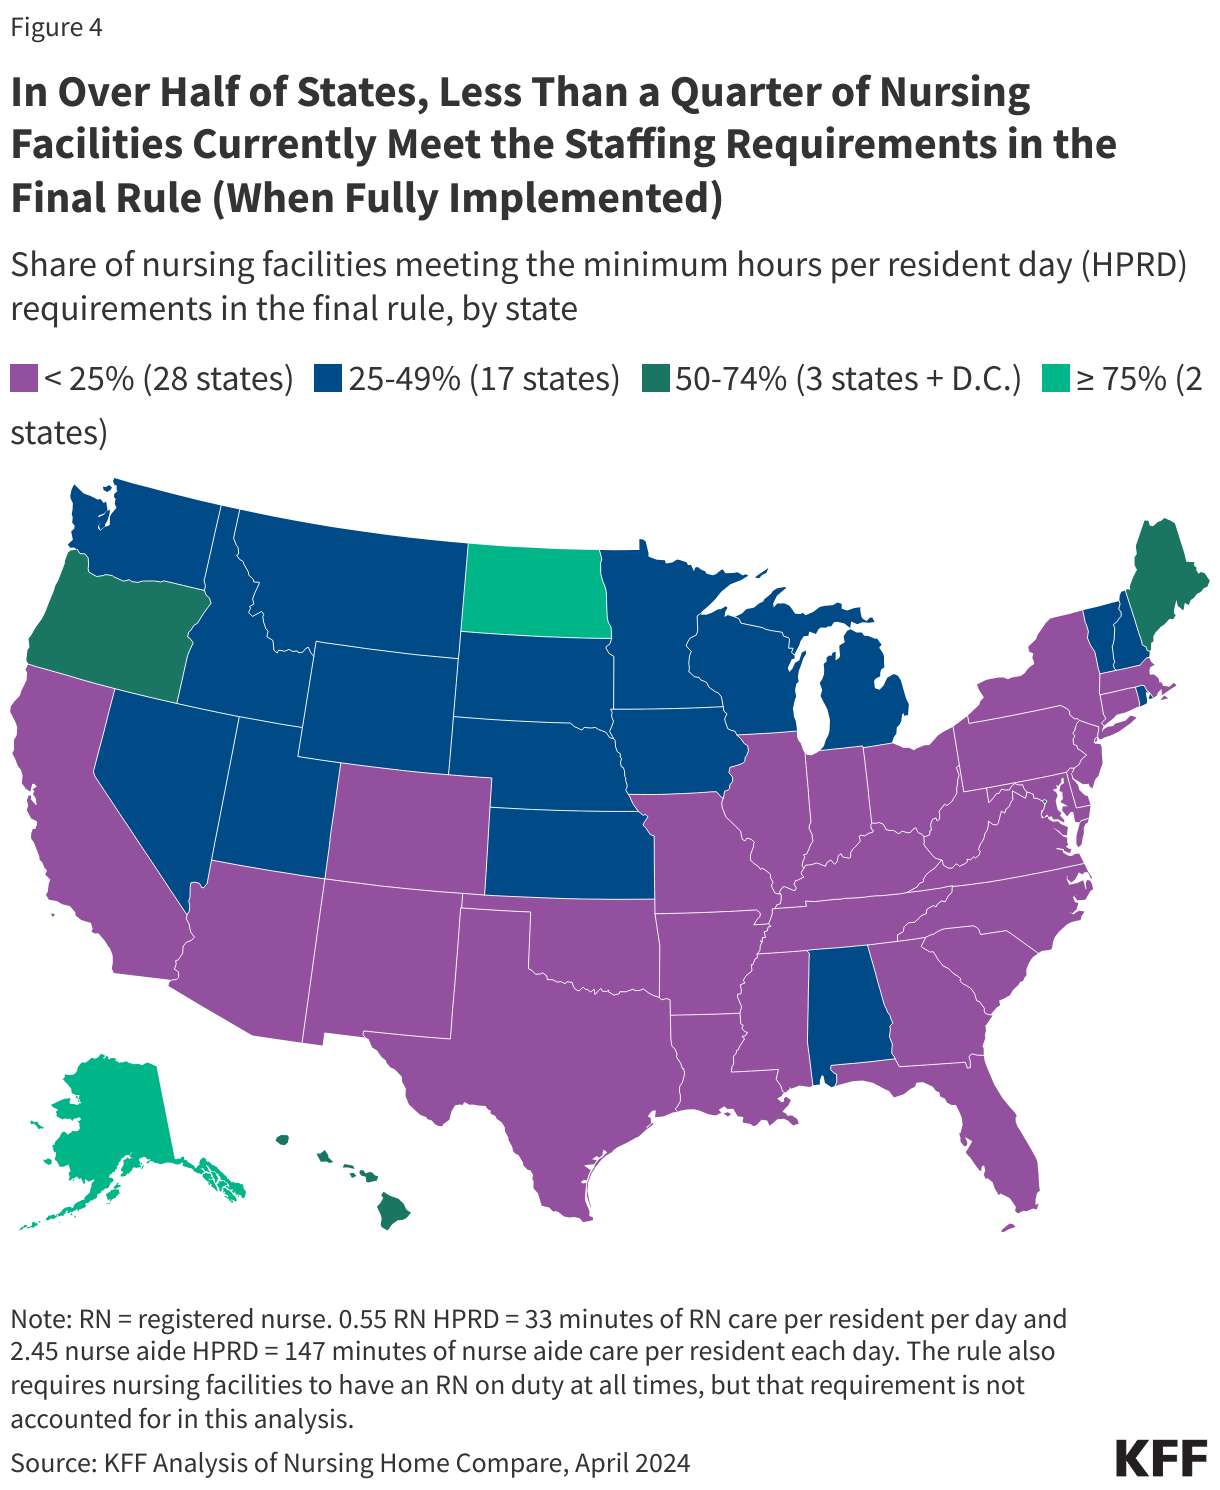
  • In over half of states, fewer than one-quarter of facilities meet all three staffing minimums required in the final rule. The share of facilities that meet the requirements ranges from 5% or lower in four states (AR, TN, TX, and LA) to 50% or higher in five states and D.C. (AK, ND, ME, DC, HI, and OR).
About 1 in 5 Nursing Facilities Currently Meet the Staffing Requirements in the Final Rule (When Fully Implemented)

What are the major requirements in the final rule and how do they differ from the proposed rule?

There are many provisions of the final rule, which will be phased in over time. The first phase requirements are the same as the proposed rule and include enhanced facility-wide staffing assessment requirements, which will strengthen existing requirements by requiring facilities to: assess the needs of each resident, include input from nursing facility staff and residents’ families or legal representatives, and develop a plan to meet required staffing levels given residents’ needs. The final rule adds language to the proposed rule to require the active participation of the nursing home leadership and management and direct care workers in completing the assessments. The first phase will take effect on August 8, 2024, 90 days after publication of the final rule (which is 30 more days than were provided in the proposed rule).

The second phase of implementation requires nursing facilities to have a registered nurse on duty 24 hours a day and 7 days a week (24/7), but the final rule also requires facilities to have at least 3.48 HPRD of nursing care. Like the proposed rule, the second phase would take effect 2 years after publication of the final rule for urban nursing facilities (May 2026) and 3 years after publication of the final rule for rural nursing facilities (May 2027). Unlike the proposed rule, nursing facilities may apply for a hardship exemption from the 24/7 requirement, which would allow them to have a registered nurse on duty for only 16 hours per day. See below for more details about how facilities may apply for a hardship exemption.

The final phase of implementation requires nursing facilities to have a minimum of 0.55 registered nurse (RN) and 2.45 nurse aide HPRD in addition to the overall 3.48 HPRD requirement. Facilities could fulfill the requirement of the additional 0.48 HPRD with any nursing staff type, including nurse aides, RNs, or licensed practical nurses (LPNs). The third phase would take effect 3 years after publication of the final rule for urban nursing facilities (May 2027) and 5 years after publication of the final rule for rural nursing facilities (May 2029).  These requirements are unchanged from the proposed rule.

The final rule includes hardship exemptions that allow nursing facilities to maintain lower staffing levels, but includes additional requirements tied to those exemptions. Nursing facilities may apply for exemptions from any of the minimum staffing requirements if they are located in an area with workforce unavailability (defined as having a provider to population ratio that is at least 20% lower than the national average). The final rule eliminated a provision in the proposed rule that would have allowed nursing facilities to apply for an exemption if they were located at least 20 miles from the nearest nursing facility, regardless of workforce availability. Nursing facilities would also have to demonstrate good faith efforts to hire and retain staff and a financial commitment to staffing by reporting the total amount of money spent on direct care staff. Finally, facilities would be ineligible for an exemption if they had any staffing-related violations including a failure to submit required data, being identified as a Special Focus Facility (a federal designation provided to facilities with a history of serious quality issues – see Box 1), or having violations related to insufficient staffing.

Nursing facilities that receive hardship exemptions will be required to:

  • Post a notice of its hardship exemption status in a “prominent and publicly viewable location,”
  • Share information about its exemption status and the degree to which it is not in compliance with the staffing requirements to current and prospective residents, and
  • Send a copy of the notice to a representative of the Office of the State Long-Term Care Ombudsman.

The final rule also notes that exemption information will be publicly available on Care Compare in an effort to provide transparency and provide additional information that consumers, families, and caregivers may use to compare nursing facilities in their area. The federal government estimates that a quarter of all 15,000 nursing facilities could end up obtaining exemptions for at least some of the requirements.

The final rule includes other requirements as part of a broader efforts to address quality and staffing in nursing facilities. Those requirements are nearly the same as in the proposed rule. The final rule:

  • Requires state Medicaid agencies to report the percent of Medicaid payments for institutional long-term services and supports (LTSS) that are spent on compensation for direct care workers and support staff. This aligns with a similar requirement for home and community-based LTSS that was enumerated in the final rule on access to care in Medicaid in a broader effort to increase transparency.
  • Eliminates a requirement from the proposed rule to report the data by type of delivery system (fee-for-service versus managed care) to reduce the administrative burden on states.
  • Includes $75 million in financial incentives such as scholarships and tuition reimbursement for individuals to enter careers in nursing homes. CMS aims to balance the goal of establishing stronger staffing requirements against the practicalities of implementation and costs.

What share of nursing facilities currently meet minimum staffing requirements in the final rule?

KFF estimates that 19% of nursing facilities currently meet all three staffing hour minimums required in the final rule (3.48 HPRD overall, 0.55 RN HPRD, and 2.45 NA HPRD). (Figure 1). The interim requirement that nursing facilities must meet is 3.48 HPRD, among all types of nursing staff. The final requirements retain the total minimum hours of care but specify that of that total, there must be at least 0.55 HPRD of RN care and 2.45 HPRD of nurse aide care. Facilities may use any type of nursing care to fulfill the final 0.48 hours. Nearly 60% of facilities have staffing levels at least equal to the interim requirement of 3.48 HPRD, but fewer (19%) of facilities currently meet all staffing requirements, including the minimum number of hours of RN and nurse aide care that are required when the rule is fully implemented (49% and 30% respectively). Though higher shares of facilities meet the overall, RN, and nurse aide requirements individually, the share that meet all three requirements is substantially lower since facilities could meet one or two requirements without meeting the other(s). Facilities that need to hire new RNs to comply with the final rule may find it difficult to compete with hospitals, many of which are also trying to increase the number of RNs they employ. The rule estimates that to meet both the 24/7 RN and 0.55 RN HPRD requirements, facilities would need to hire about 16,000 RNs. To meet the 2.45 nurse aide HPRD requirements, CMS estimates that facilities would need to hire 35,306 nurse aides. CMS states that the existing survey, certification, and enforcement processes will be used to assess compliance, with more details to come.

Only 11% of for-profit nursing facilities currently meet all three staffing minimums required in the final rule compared with 41% of non-profit facilities and 39% of government facilities  (Figure 2). There are approximately 10,500 for-profit nursing facilities (73% of all nursing facilities); 3,000 non-profit nursing facilities (21%); and 900 government-owned nursing facilities (6%). When looking at the ownership of facilities that meet the interim requirement of 3.48 HPRD requirement, fewer for-profit facilities would meet the 3.48 overall standard than non-profit and government facilities (52%, 79%, and 71%, respectively; data not shown). Similarly, for-profit facilities are less likely to meet the registered nurse and nurse aide requirements when compared with government and for-profit facilities (data not shown).

For-Profit Nursing Facilities Would Be Least Likely to Meet the Staffing Requirements in the Final Rule

The percentage of nursing facilities that currently meet the final rule’s requirements are similar in rural and urban areas, but rural facilities will have longer to comply with the new requirements (Figure 3). In rural areas, 20% of nursing facilities have staffing levels that would meet the rule’s requirements compared to 18% in urban areas. Despite similar levels of current staffing, nursing facilities in urban areas will need to comply with all of the provisions in the final rule two years earlier than those in rural areas (May 2027 and May 2029 respectively). In the rule, CMS cites that “rural areas face a myriad of challenges ranging from worker housing shortages to severe transportation challenges for remote facilities that are unique to their location.” Both rural and urban facilities face challenges with hiring but perhaps for different reasons. Rural facilities may have difficulty finding staff because there are fewer available workers, while urban facilities may have difficulty because available workers have more low-wage jobs to choose from in urban areas. Despite those different challenges, staffing patterns in urban and rural facilities are remarkably similar (data not shown).

Similar Shares of Rural and Urban Nursing Facilities Currently Meet the Staffing Requirements in the Final Rule

In over half of states, fewer than a quarter of facilities would meet all three HPRD provisions in the final rule (Figure 4). The five states with the most nursing facilities (Texas, California, Ohio, Florida, and Illinois) all fall into this category, skewing the national average down to 19%. In six states, over half of facilities would meet these provisions, and in the remaining 17 states, 25-49% of facilities would meet the provisions. Variation across the states reflects many factors including what percentage of facilities are for-profit, the availability of RNs and nurse aides in the state, and state requirements regarding minimum staffing levels.

In Over Half of States, Less Than a Quarter of Nursing Facilities Currently Meet the Staffing Requirements in the Final Rule (When Fully Implemented)

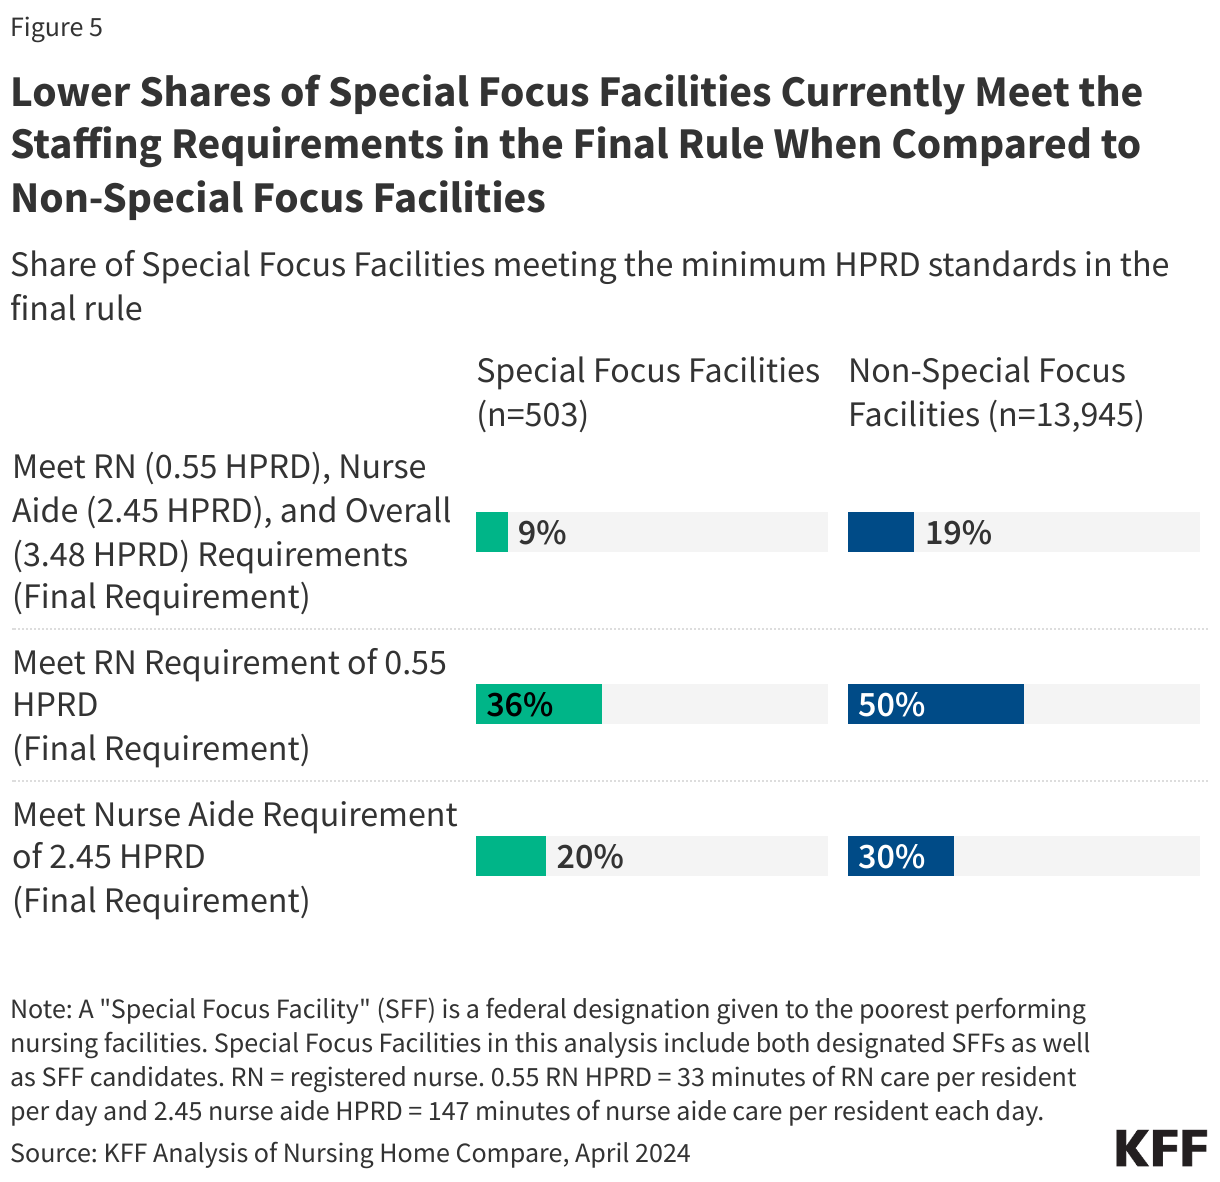
Among the 503 Special Focus Facilities (SFF) & SFF candidates (facilities with a history of serious quality issues), only 9% have staffing levels that would meet the requirements in the final rule (Figure 5). CMS established the Special Focus Facility program in 1998 to improve care in the poorest performing nursing homes that have a history of serious quality issues. To avoid poor-quality facilities receiving exemptions from the staffing minimums, the final rule states that Special Focus Facilities are not eligible for an exemption to the provisions in the final staffing rule. These facilities are described as having a “yo-yo” compliance history, meaning that even when these facilities correct problems identified on one inspection, they often have significant problems by the time the next inspection occurs. These repeated quality issues arise because the facilities rarely address underlying systemic problems, which can lead to cycles of serious deficiencies and pose risks to residents’ health and safety. For SFFs, state agencies conduct a full, onsite inspection of all health and safety requirements every six months, and recommend progressive enforcement (e.g., civil money penalty, denial of federal funds, etc.) until the facility either (1) graduates from the SFF program; or (2) is terminated from the Medicare and/or Medicaid program(s). Due to resource constraints, the SFF designation is limited to a certain number of nursing facilities. States also have the option to designate facilities as SFF candidates, with a maximum of 30 SFF candidates per state. Once an SFF graduates or is terminated, the state selects a new SFF from the list of candidates.

Lower Shares of Special Focus Facilities Currently Meet the Staffing Requirements  in the Final Rule When Compared to Non-Special Focus Facilities

CMS estimates that complying with the final rule will cost $43 billion in the 10 years after the final rule takes effect. Since the rule was released, prominent labor unions have applauded its release while the nursing home industry has issued statements criticizing its finalization and other groups have expressed concerns about the high costs the rule may create for nursing homes and states. Labor unions commended the elements of the rule, noting that it was long overdue and would go a long way in protecting the residents and staff that live and work in nursing facilities. From the industry, there has been criticism related to funding of the rule and workforce shortages. The cost of implementing the staffing requirements has been raised as a major concern by the nursing home industry, among others. For nursing facilities, hiring and retaining sufficient staff will increase their operational costs. Such costs are likely to be passed on to public and private payers for nursing facility services including residents and family members, Medicaid and Medicare. Medicaid is the single largest payer for nursing facilities so increased costs could have implications for state budgets as well as federal spending. The rule also requires state Medicaid agencies to report on the percent of Medicaid payments for institutional long-term services and supports (LTSS) that are spent on compensation for direct care workers and support staff, which is similar to a requirement for home-and-community based LTSS.

The final rule includes few details on enforcement, though CMS states that the existing survey, certification, and enforcement processes will be used to assess compliance. According to the final rule, CMS intends to publish more details on how compliance will be assessed in advance of each implementation date for different components of the rule. Forthcoming decisions about enforcement of the new staffing requirements and the ease with which nursing homes are able to receive hardship exemptions may impact the extent to which the final rule has its desired effect on the quality of care for nursing home residents. The need for nursing facility care is also likely to increase as the population continues to age, which may intensify these unintended consequences.

Methods

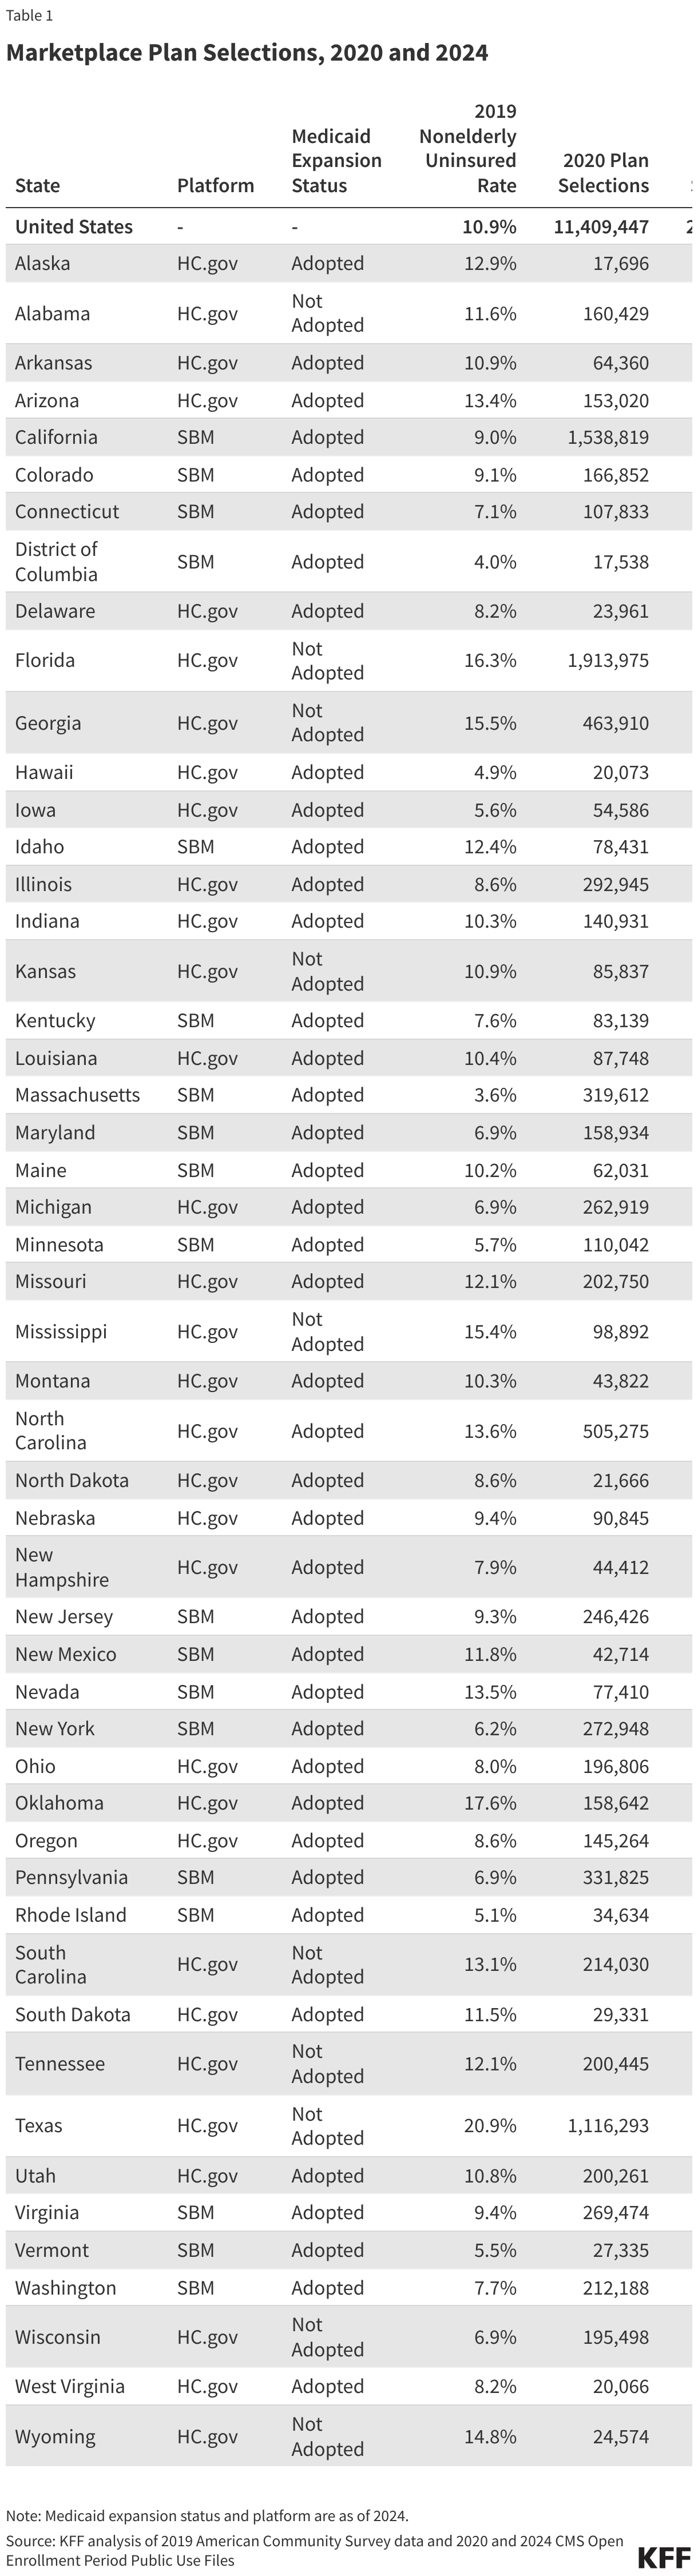
This analysis uses Nursing Home Compare as of April 2024 and reflects staffing levels from October 2023 to December 2023. Nursing Home Compare is a publicly available dataset that provides a snapshot of information on quality of care and key characteristics for approximately 14,900 Medicare and/or Medicaid-certified nursing facilities. This analysis drops about 3% of nursing facilities, including the facilities in Guam and Puerto Rico and nursing facilities for which there was not staffing data available for the fourth quarter of 2023, for a total analytic sample of 14,448 facilities. The number of facilities identified in this analysis as meeting/not meeting requirements may differ from CMS’ estimates due to different years and quarters of data used for estimates.

In Figure 3, the analysis uses the Office of Management and Budget’s (OMB) delineation of metropolitan and micropolitan statistical areas to designate rural and urban areas. Urban and rural facilities have different timelines to come into compliance with the rule, but the analysis reflects compliance rates if the HPRD requirements were in effect now for all facilities.

Due to the limitations of publicly available data, this analysis does not look at facilities that meet the requirement to have an RN on staff 24 hours a day, seven days a week (24/7). Nursing home staffing data is calculated from the Payroll Based Journal (PBJ), which includes data on the total number of RN hours worked per day at a facility, but no data on the timing of shifts. This limits our understanding of whether shifts were worked simultaneously by multiple employees (possibly not fulfilling the 24-hour requirement) or whether those hours were spread out over a 24-hour period (fulfilling the 24-hour requirement). CMS estimates that close to 80% of nursing facilities would already meet the RN 24/7 requirement. It is unclear how the agency estimated whether nursing facilities had RNs on staff 24/7 or what data they used to do so.

How Does Medical Inflation Compare to Inflation in the Rest of the Economy?

Authors: Shameek Rakshit, Emma Wager, Cynthia Cox, Paul Hughes-Cromwick, and Krutika Amin
Published: May 17, 2024

Note: This analysis was updated on May 17, 2024 to include new data.

Inflation in medical care prices and overall health spending typically outpaces inflation in the rest of the economy. However, since 2021, medical prices have grown at a similar rate as in past years while prices in some other parts of the economy grew much more rapidly than in the past.

While medical care prices increased by 2.2% between March 2023 and March 2024, the prices of all goods and services increased by 3.5%, according to an updated analysis. Prices for hospital services and related services (7.7%) – both inpatient (6.9%) and outpatient (8.3%) – as well as for nursing homes (3.9%) rose faster than for prescription drugs and physicians’ services (0.4% and 0.7%, respectively).

KFF uses Bureau of Labor Statistics (BLS) data, including the consumer price index (CPI) and producer price index (PPI) to analyze prices for medical care compared to other goods and services. The analysis can be found on the Peterson-KFF Health System Tracker, an information hub dedicated to monitoring and assessing the performance of the U.S. health system.

Poll Finding

Language Barriers in Health Care: Findings from the KFF Survey on Racism, Discrimination, and Health

Authors: Ana Gonzalez-Barrera, Liz Hamel, Samantha Artiga, and Marley Presiado
Published: May 16, 2024

Findings

In the U.S., there are about 26 million people who have limited English proficiency (LEP), meaning they speak English less than very well, making up about 8% of people ages five and older. Most U.S. adults with LEP speak Spanish (62%), followed by Chinese (7%), Vietnamese (3%), Arabic (2%), and Tagalog (2%), with the remainder speaking a variety of different languages from regions across the world.  Hispanic people account for nearly two-thirds (62%) of the LEP population, while over a fifth (22%) of individuals with LEP are Asian. The remainder of individuals with LEP are White (11%) or Black (4%) or of other racial and ethnic backgrounds. Adults with LEP are also more likely to be low-income—nearly one in five individuals with LEP have family income below 200% of the federal poverty level, compared with one in ten English-proficient individuals. This brief examines health care experiences among U.S. adults with LEP, drawing on findings from the KFF Survey on Racism, Discrimination, and Health.1  For more information about U.S. immigrants with LEP, see this brief. The data identify ongoing barriers and disparities adults with LEP face in accessing health care and suggest that having access to providers who speak their preferred language helps reduce these barriers and may improve certain health care experiences.

Health and Health Care Experiences Among Adults with LEP

Adults with LEP report worse health status and increased barriers in accessing health care compared to English proficient adults.2  Adults who have LEP are more likely to report their physical health as “fair” or “poor” compared with adults who are English proficient (34% vs. 19%). Despite this difference in health status, adults with LEP report less use of care and greater barriers to accessing health care compared to their English proficient counterparts. Adults who have LEP are less likely to say they had a health care visit in the past three years than English proficient adults (86% vs. 95%). In addition, consistent with other analysis, adults who have LEP are more likely than those who are English proficient to report being uninsured (33% vs. 7%). They also are less likely to say they have a usual source of care other than the emergency room (74% vs. 88%). Notably, four in ten adults with LEP (39%) say their usual source of care is a neighborhood clinic or health center, highlighting the importance of community health centers in providing linguistically appropriate and culturally competent care.

Adults With Limited English Proficiency More Likely to Say They Are in Fair or Poor Health Than Those Who Are English Proficien

About half of adults with LEP say they encountered at least one language barrier in a health care setting in the last three years. This includes about a third of LEP adults who say there was a time in the past three years when difficulty speaking or reading English made it hard for them to fill out forms for a health care provider (34%) or communicate with medical office staff (33%), three in ten who report difficulty understanding a health care provider’s instructions (30%), and about a quarter who say language barriers made it difficult to fill a prescription or understand how to use it (27%) or schedule a medical appointment (25%).

About a Third of Adults With Limited English Proficiency Say They Have Faced Language Barriers When Seeking Health Care

Adults with LEP report having positive, respectful interactions with health care providers somewhat less frequently compared to those who are English proficient. Overall, most adults report having mostly positive interactions with health care providers in the past three years, with majorities regardless of English proficiency saying their providers explained things in a way they could understand, spent enough time with them, understood and respected their cultural beliefs, and involved them in decision-making at least most of the time. However, adults with LEP report some of these experiences less frequently compared to those who are English proficient, including a provider explaining things in a way they could understand (81% vs. 89%), spending enough time during visits (68% vs. 76%), and involving them in decision-making about their care (63% vs. 82%).

Adults With LEP Are Somewhat Less Likely Than English-Proficient Adults To Report Certain Positive Interactions With Health Care Providers

Adults with LEP express lower levels of comfort asking questions of their health care providers compared to those who are English proficient. While most adults, regardless of English proficiency, say they have felt at least “somewhat” comfortable asking doctors and other health care providers questions about their health or treatment in the past three year, about half (54%) of adults with LEP say they feel “very comfortable,” which is lower than the two-thirds (66%) of English proficient adults who say the same.

Nearly Half of Adults With Limited English Proficiency Say They Have Prepared for Insults or Been Careful About Their Appearance During Health Care Visits in the Past Three Years

About one in five adults with LEP report a negative experience with a provider, one in eight report being treated unfairly or with disrespect, and about half report practicing vigilant behaviors associated with health care visits. Among adults with LEP, one in five reports experiencing at least one of several negative experiences with a health care provider in the past three years, including a provider ignoring a direct request or question (11%), assuming something about them without asking (8%), suggesting they were personally to blame for a health problem (8%), or refusing to prescribe needed pain medication (8%). In addition, one in eight (13%) adults with LEP say there was a time in the past three years when a health care provider or their staff treated them unfairly or with disrespect because of their race or ethnic background or for some other reason. Reflecting these experiences, about half (48%) of adults with LEP say they feel they have to be very careful about their appearance in order to be treated fairly (44%) and/or prepare for possible insults from a provider or their staff (18%) at least some of the time during health care visits. Adults with LEP do not report these experiences at significantly higher rates compared with those who are English proficient.

Importance of Linguistically Concordant Care

Nearly four in ten adults with LEP say fewer than half of their recent health care visits were with a provider who spoke their preferred language. While six in ten (63%) adults with LEP say at least half of their health care visits in the past three years were with a doctor or health care provider that spoke their preferred language, just 28% say that all of them were. Almost four in ten (37%) say that fewer than half of their visits were with a language concordant provider, including 15% who say they had no health care visits in the past three years with a provider who spoke their preferred language. In addition, among adults with LEP, four in ten say fewer than half of their health care visits in the past year were with a provider who shared their racial and ethnic background.

Nearly Four in Ten Adults With LEP Say Fewer Than Half of Their Recent Health Care Visits Were With a Provider Who Spoke Their Preferred Language

Adults with LEP who have more visits with providers who speak their preferred language are less likely to report facing language barriers while getting health care. Overall, four in ten LEP adults who say at least half of their health care visits in the past three years were with a provider who spoke their preferred language report experiencing at least one language barrier, compared with six in ten among those who had fewer than half of their health care visits with a language-concordant provider. For example, 45% of LEP adults who say less than half of their health care visits were with a provider who spoke their preferred language say they had trouble communicating with medical office staff, compared with 26% of those who had half or more of their health care visits with a language concordant provider.

Adults With LEP Report Fewer Language Barriers in Health Care Settings When They See More Providers Who Speak Their Preferred Language

Adults with LEP who have more visits with a provider who speaks their preferred language are more likely to say they are comfortable asking questions about their health and treatment compared to those with fewer visits with a language concordant provider. Six in ten (61%) LEP adults who had at least half their visits with providers who spoke their preferred language say they have felt very comfortable asking questions compared to four in ten (43%) of those who had fewer visits with a language concordant provider.

Adults With LEP Who Have More Visits With Providers Who Speak Their Language Are More Likely To Feel Very Comfortable Asking Questions About Health or Treatment

Adults with LEP who have more visits with language-concordant providers are more likely to say their providers usually respect their cultural values and beliefs and ask them about social factors like access to work, food, and housing. Among adults with LEP, those who had at least half of their health care visits with a provider who spoke their preferred language are more likely to say their providers understood and respected their cultural values and beliefs most or every time compared with those who had fewer visits with language-concordant providers (87% vs. 76%). While few LEP adults overall say their provider asked them about their work, housing situation or access to food or transportation during recent health care visits, those who had at least half of their visits with language concordant providers are more likely than those who had fewer visits with such providers to say this happened at least most of the time (29% vs. 15%).

Adults With LEP Who Have More Visits With Language-Concordant Providers Are More Likely To Say Providers Respect Their Values and Ask About Social Factors

Methodology

The Survey on Racism, Discrimination, and Health was designed and analyzed by researchers at KFF. The survey was conducted June 6 – August 14, 2023, online and by telephone among a nationally representative sample of 6,292 U.S. adults in English (5,706), Spanish (520), Chinese (37), Korean (16), and Vietnamese (13).

The sample includes 5,073 adults who were reached through an address-based sample (ABS) and completed the survey online (4,529) or over the phone (544). An additional 1,219 adults were reached through a random digit dial telephone (RDD) sample of prepaid (pay-as-you-go) cell phone numbers. Marketing Systems Groups (MSG) provided both the ABS and RDD sample. All fieldwork was managed by SSRS of Glen Mills, PA; sampling design and weighting was done in collaboration with KFF.

Sampling strategy:

The project was designed to reach a large sample of Black adults, Hispanic adults, and Asian adults. To accomplish this, the sampling strategy included increased efforts to reach geographic areas with larger shares of the population having less than a college education and larger shares of households with a Hispanic, Black, and/or Asian resident within the ABS sample, and geographic areas with larger shares of Hispanic and non-Hispanic Black adults within the RDD sample.

The ABS was divided into areas (strata) based on the share of households with a Hispanic, Black, and/or Asian resident, as well as the share of the population with a college degree within each Census block group. To increase the likelihood of reaching the populations of interest, strata with higher incidence of Hispanic, Black, and Asian households, and with lower educational attainment, were oversampled in the ABS design. The RDD sample of prepaid (pay-as-you-go) cell phone numbers was disproportionately stratified to reach Hispanic and non-Hispanic Black respondents based on incidence of these populations at the county level.

Incentives:

Respondents received a $10 incentive for their participation, with interviews completed by phone receiving a mailed check and web respondents receiving a $10 electronic gift card incentive to their choice of six companies, a Visa gift card, or a CharityChoice donation.

Community and expert input:

Input from organizations and individuals that directly serve or have expertise in issues facing historically underserved or marginalized populations helped shape the questionnaire and reporting. These community representatives were offered a modest honorarium for their time and effort to provide input, attend meetings, and offer their expertise on dissemination of findings.

Translation:

After the content of the questionnaire was largely finalized, SSRS conducted a telephone pretest in English and adjustments were made to the questionnaire. Following the English pretest, Cetra Language Solutions translated the survey instrument from English into the four languages outlined above and checked the CATI and web programming to ensure translations were properly overlayed. Additionally, phone interviewing supervisors fluent in each language reviewed the final programmed survey to ensure all translations were accurate and reflected the same meaning as the English version of the survey.

Data quality check:

A series of data quality checks were run on the final data. The online questionnaire included two questions designed to establish that respondents were paying attention and cases were monitored for data quality including item non-response, mean length, and straight lining. Cases were removed from the data if they failed two or more of these quality checks. Based on this criterion, 4 cases were removed.

Weighting:

The combined cell phone and ABS samples were weighted to match the sample’s demographics to the national U.S. adult population using data from the Census Bureau’s 2021 Current Population Survey (CPS). The combined sample was divided into five groups based on race or ethnicity (White alone, non-Hispanic; Hispanic; Black alone, non-Hispanic; Asian alone, non-Hispanic; and other race or multi-racial, non-Hispanic) and each group was weighted separately. Within each group, the weighting parameters included sex, age, education, nativity, citizenship, census region, urbanicity, and household tenure. For the Hispanic and Asian groups, English language proficiency and country of origin were also included in the weighting adjustment. The general population weight combines the five groups and weights them proportionally to their population size.

A separate weight was created for the American Indian and Alaska Native (AIAN) sample using data from the Census Bureau’s 2022 American Community Survey (ACS). The weighting parameters for this group included sex, education, race and ethnicity, region, nativity, and citizenship. For more information on the AIAN sample including some limitations, adjustments made to make the sample more representative, and considerations for data interpretation, see Appendix 2.

All weights also take into account differences in the probability of selection for each sample type (ABS and prepaid cell phone). This includes adjustment for the sample design and geographic stratification of the samples, and within household probability of selection.

The margin of sampling error including the design effect for the full sample is plus or minus 2 percentage points. Numbers of respondents and margins of sampling error for key subgroups are shown in the table below. Appendix 1 provides more detail on how race and ethnicity was measured in this survey and the coding of the analysis groups. For results based on other subgroups, the margin of sampling error may be higher. All tests of statistical significance account for the design effect due to weighting. Dependent t-tests were used to test for statistical significance across the overlapping groups.

Sample sizes and margins of sampling error for other subgroups are available by request. Sampling error is only one of many potential sources of error and there may be other unmeasured error in this or any other public opinion poll. KFF public opinion and survey research is a charter member of the Transparency Initiative of the American Association for Public Opinion Research.

GroupN (unweighted)M.O.S.E.
Total6,292± 2 percentage points
Race/Ethnicity
White, non-Hispanic (alone)1,725± 3 percentage points
Black (alone or in combination)1,991± 3 percentage points
Hispanic1,775± 3 percentage points
Asian (alone or in combination)693± 5 percentage points
American Indian and Alaska Native (alone or in combination)267± 8 percentage points


Endnotes

  1. The KFF Survey on Racism, Discrimination, and Health was conducted in English plus four additional languages: Spanish, Chinese, Vietnamese and Korean. While it is not comprehensive of all adults with LEP, these languages make up about three fourths of the LEP population in the U.S. The survey results may somewhat overrepresent Spanish speakers, who make up 62% of the overall U.S. LEP population but 82% of respondents with LEP from the survey. ↩︎
  2. In this report Adults with Limited English Proficiency (LEP) are adults who responded the survey in a language other than English and self-identified as speaking English less than u201cvery well.u201d English-proficient adults are those who responded the survey in English or responded in another language and self-identified as speaking English u201cvery well.u201d ↩︎

The Implications of the Public’s Pre-existing Condition Amnesia

Published: May 16, 2024

In this JAMA Health Forum column, KFF’s Executive Vice President for Health Policy Larry Levitt discusses waning awareness of the Affordable Care Act’s provisions protecting people with pre-existing conditions and examines the Republican Study Committee’s budget proposal, which proposes to repeal the provisions.

Where ACA Marketplace Enrollment is Growing the Fastest, and Why

Published: May 16, 2024

In 2024, Affordable Care Act (ACA) Marketplace enrollment hit a new record high, reaching over 21 million people, almost double the 11 million people enrolled in 2020. This growth can be largely attributed to enhanced subsidies made available by the American Rescue Plan Act (ARPA) in 2021 and renewed under the 2022 Inflation Reduction Act (IRA). These enhanced subsidies significantly reduced premium payments across the board for ACA Marketplace enrollees – including providing 100% premium subsidies for the lowest-income enrollees – and made some middle-income people who had previously been priced out of coverage newly eligible for financial assistance.

2024 ACA Open Enrollment Hits a New Record

Although the Inflation Reduction Act’s enhanced subsidies are available nationwide, some states have seen faster growth than others. In 15 states, ACA Marketplace enrollment has more than doubled since 2020 (Figure 2). One of these states is Texas, where ACA enrollment has more than tripled since 2020. Meanwhile, 3 states’ Marketplaces have seen enrollment fall since 2020.

In 15 States, Affordable Care Act (ACA) Marketplace Enrollment More than Doubled from 2020 to 2024

The five states with the fastest growth in Marketplace enrollment since 2020 – Texas (212%), Mississippi (190%), Georgia (181%), Tennessee (177%), and South Carolina (167%) – have certain characteristics in common: They all started off with high uninsured rates before the enhanced subsidies rolled out, they have not expanded Medicaid under the ACA, and they all use the Healthcare.gov enrollment platform.

It is difficult to disentangle the effect of each of these factors (uninsured rate, Medicaid expansion, and enrollment platform), as they are correlated and closely connected to one another. Nonetheless, the data suggest that a large number of uninsured people in these southern states with high uninsured rates wanted health insurance coverage, and the recently enhanced subsidies have made it possible for them to afford that coverage. However, these subsidies are temporary and will expire at the end of 2025 if not renewed by Congress.

Uninsured Rate

When considering the varying growth rates of Marketplace enrollment across states in recent years, it is important to keep in mind that states had different starting points before the enhanced subsidies in the ARPA and IRA were rolled out. The nonelderly uninsured rate in 2019 ranged from less than 5% in Massachusetts, the District of Columbia, and Hawaii to over 15% in Mississippi, Georgia, Florida, and Oklahoma, and over 20% in Texas. Generally speaking, states with higher uninsured rates in 2019 saw faster growth in ACA Marketplace enrollment from 2020 to 2024, while those with the lowest uninsured rates saw their market sizes generally grow less or even shrink a bit. On average, states that started out with nonelderly uninsured rates below 10 percent in 2019 saw an average of 31% growth in ACA Marketplace enrollment, while states with uninsured rates of 10 percent or more saw an average growth of 136% from 2020 to 2024.

Since 2020, ACA Marketplaces Have Generally Grown Faster in States that Started off with Higher Uninsured Rates

Medicaid Expansion

Another closely related factor that could explain why some states are seeing faster growth in their ACA markets is Medicaid expansion. On average, non-expansion states have seen their ACA Marketplaces grow by 152% since 2020, compared to 47% average growth in expansion states.

Affordable Care Act Marketplaces have Grown Faster in Medicaid Non-Expansion States

The Inflation Reduction Act subsidies bring premiums for ACA Marketplace silver plans down to as low as $0 per month for people with incomes between 100% and 150% of poverty. Meanwhile, in states that have expanded Medicaid, people with incomes up to 138% of poverty are eligible for Medicaid and are therefore ineligible to purchase ACA Marketplace plans. There are therefore relatively fewer people in Medicaid expansion states who would qualify for one of these “free” silver plans on the ACA Marketplaces. This could explain, in part, why there has been faster Marketplace growth in several non-expansion states. (With North Carolina recently expanding Medicaid, there are now 10 states, primarily in the South, that have chosen not to expand the program).

The unwinding of the pandemic-era Medicaid continuous enrollment policy, which led to millions of people losing Medicaid in 2023 after having their coverage maintained during the pandemic, likely contributed to the steeper increase in Marketplace enrollment during the 2024 open enrollment period. As states unwind the Medicaid continuous enrollment policy, these $0 premium, low-deductible ACA Marketplace plans may make the transition from Medicaid to Marketplace coverage easier, especially for people with incomes just above the poverty level in non-expansion states.

Enrollment Platforms

Growth in ACA Marketplace enrollment in recent years also correlates with enrollment platforms. The 23 states with the fastest growth in ACA Marketplace enrollment from 2020-2024 all use the Healthcare.gov enrollment platform. States using Healthcare.gov saw a weighted average growth of 126% in ACA Marketplace enrollment from 2020 to 2024, compared to 22% growth in states using state-run enrollment websites. All 10 states that have not expanded Medicaid use the Healthcare.gov platform.

States with the Most Growth in ACA Signups use the HealthCare.gov Platform

Another difference is that only Healthcare.gov states have Enhanced Direct Enrollment, which allows health plans and insurance brokers to directly enroll and provide customer service to enrollees throughout the year without the consumer needing to visit the Marketplace website (Healthcare.gov). In recent years, brokers have played a growing role in assisting Marketplace consumers.

However, states that use their own enrollment websites also had different starting points in 2020, ahead of the enhanced subsidies passing in 2021. Some state-based Marketplaces were already using state funds to offer additional health insurance subsidies beyond those offered by the federal government. Additionally, several states with their own Marketplaces had long embraced the ACA and have directed state resources toward outreach and marketing efforts for a decade. By contrast, states that rely on Healthcare.gov had significant cuts to outreach and marketing budgets during the Trump administration, with those investments renewed in 2021 under the Biden Administration.

Marketplace Plan Selections, 2020 and 2024
News Release

States with the Fastest Recent Growth in ACA Marketplace Coverage Started with High Uninsured Rates

Published: May 16, 2024

The states with the fastest recent growth in ACA Marketplace signups also had among the highest uninsured rates previously, as enhanced subsidies helped to make coverage more affordable for many consumers, particularly in southern states that did not expand their Medicaid programs to cover low-income adults, a new KFF analysis finds. The enhanced premium subsidies were first provided in the American Rescue Plan Act in 2021 and then extended through 2025 in the Inflation Reduction Act.

Marketplace enrollment has more than doubled in 15 states since 2020, including in Texas, where signups more than tripled (growing by 212%). On average, states that started out with nonelderly uninsured rates below 10% in 2019 saw an average of 31% growth in ACA Marketplace enrollment, while states with uninsured rates of 10% or more saw an average growth of 136% from 2020 to 2024.None of the five states with the largest growth in recent ACA marketplace enrollment – Texas, Mississippi, Georgia, Tennessee, and South Carolina – have expanded Medicaid. 

States that have not expanded their Medicaid programs under the ACA have seen their Marketplaces grow by 152% on average since 2020, compared to 47% average growth in expansion states. This reflects, in part, that many low-income people who would be eligible for Medicaid if they lived in expansion states are instead able to sign up for Marketplace coverage in non-expansion states without having to pay a premium. Growth in ACA Marketplace enrollment in recent years also correlates with the type of enrollment platform, with states using Healthcare.gov seeing ACA Marketplace enrollment growing by 126% on average from 2020 to 2024, compared to 22% growth in states using state-run enrollment websites. This difference in growth could be explained in part by states’ differing starting points. States that use their own platforms are more likely to have made earlier and more consistent investments in outreach and marketing, and some had state-funded subsidies before the federal government’s enhanced subsidies. Additionally, states using Healthcare.gov have an option for brokers to enroll Marketplace customers directly without visiting the exchange website, which could have helped boost enrollment in states using the federal platform. 

News Release

KFF Examines New Rule Giving LGBTQ+ People More Protections Against Discrimination in Health Care

Published: May 15, 2024

A long-awaited new rule recently finalized by the Biden Administration gives LGBTQ+ people more protections against discrimination when seeking health care and coverage from a range of programs and organizations, including Medicaid, Medicare, Health Insurance Marketplaces, many health insurance plans, and most hospitals and providers. The rule has been subject to a wave of litigation across the Obama, Trump, and Biden Administrations and the Biden Administration’s new rule reinstates protections eliminated by the Trump Administration.

In a new brief, KFF examines the rule and highlights two areas of interest— nondiscrimination protections for pregnancy related decisions, including abortion, and nondiscrimination protections for transgender people, including those related to gender affirming care. The brief also provides a side-by-side comparison of the Obama (2016), Trump (2020), and Biden Administration (2024) rules.

The revised regulations implement Section 1557 of the Affordable Care Act, which prohibits discrimination based on race, color, national origin, age, disability, or sex in covered health programs or activities. The Biden Administration’s interpretation of the ACA’s sex protections also offers protections based on sexual orientation and gender identity, among other considerations.

Beyond those for LGBTQ+ people, the rule also provides a range of other nondiscrimination protections, including those related to abortion; people with disabilities; people with limited English proficiency; and use of telehealth and patient care decision support tools, including clinical algorithms and AI. The rule also extends to include Medicare Part B for the first time.

Poll Finding

5 Charts About Public Opinion on the Affordable Care Act

Published: May 15, 2024

Note: This resource was originally posted on February 22, 2024, and was updated May 15, 2024, to include newer polling data on the public’s views of the ACA.

#1: Attitudes Toward the ACA Continue to Be More Favorable than Unfavorable, Divided Among Partisans

Public opinion of the Affordable Care Act (ACA) has been largely divided along partisan lines since the law was passed in 2010. Following Republican efforts to repeal the ACA in the summer of 2017, KFF Health Tracking Polls show an uptick in overall favorability towards the law, and since then, a larger share has held a favorable than an unfavorable view. The May 2024 Health Tracking Poll shows that about six in ten U.S. adults (62%) hold a favorable opinion of the ACA while about four in ten (37%) hold a negative opinion of the law. Views of the ACA are still largely driven by partisanship; nearly nine in ten Democrats (87%) along with two-thirds of independents (65%) view the law favorably, while two-thirds of Republicans (66%) hold unfavorable views. Explore more demographic breakdowns using KFF’s interactive: The Public’s Views on the ACA.

Clear Majority Of Public View The ACA Favorably

The ACA has been the subject of both legal challenges and Congressional actions aimed at overturning the 2010 health care law. However, many of the specific provisions included in the law are popular and the public would like them to remain.

For example, the 2020 California v. Texas case challenged the legality of the individual mandate and brought special attention to the law’s protections for people with pre-existing medical conditions. These provisions prohibit insurance companies from denying coverage based on a person’s medical history (known as guaranteed issue) and prohibit insurance companies from charging those with pre-existing conditions more for coverage (known as community rating). As of February 2024, two-thirds of the public say it is “very important” for the guaranteed issue (67%) and community rating (65%) provisions to remain law, including majorities of Democrats and independents. About half of Republicans say each of these protections for people with pre-existing conditions are “very important.” Historically, majorities also say it is very important for many of the other ACA provisions to be kept in place, even if the Supreme Court ruled the ACA unconstitutional and no longer the law of the land.

Though majorities say it is very important for guaranteed issue to remain law, knowledge that this provision is part of the ACA has dropped over the past 14 years. As of February 2024, about four in ten (39%) adults are aware that the ACA prohibits insurance companies from denying coverage based on a person’s medical history, compared to seven in ten adults in June 2010, shortly after the ACA’s inception.

Majorities Across Partisans Say It Is Very Important Pre-Existing Condition Protections Stay In Place, Remain Among The Most Popular ACA Provisions

#3: Pre-Existing Condition Protections Affect Large Shares of the Public

One reason why majorities across partisans may support the ACA’s protections for people with pre-existing medical conditions is that large shares of the public, regardless of age, gender, racial or ethnic identity, and income report having someone with a pre-existing condition in their household. A KFF analysis estimates that 27% of adults ages 18-64 have a pre-existing condition that would have led to a denial of insurance in the individual market prior to the implementation of the ACA. An even larger share of the public believes they or someone in their family may belong in this category. According to the KFF polling data from 2020, about half of the public say they or someone in their household suffers from a pre-existing medical condition, such as asthma, diabetes, or high blood pressure.1 

About Half Of Adults Say They Or Someone In Their Household Has A Pre-Existing Health Condition

#4: Those Who Say the ACA Has Helped Them Cite Increasing Access

KFF polling from March 2022 shows about a quarter of the public says the ACA has helped them and their family in some way, while one in five say the law has hurt them. About half of those who say the ACA helped them say allowing someone in their family to get or keep their health coverage has been the main way the health care law has helped them (48%, or 12% of total adults). Three in ten say the law has made it easier for them to get the health care they need (7% of total) and one in five say it has lowered the cost of their health care or health insurance (5% of total).

Half Of Those Who Say ACA Helped Them And Their Families Say It Allowed Them To Get Health Coverage

The February 2024 Health Tracking Poll also reveals four in ten (39%) adults say the ACA has made it easier for people like them to get health insurance, while about one in four (23%) say it has made it more difficult. However this perception varies by partisanship, as Democrats are almost three times as likely as Republicans (60% v. 22%) to say the ACA has helped them in this way.

#5: Those Who Say the ACA Has Hurt Them Cite Costs

Among the one in five U.S. adults who say the ACA has hurt them and their families, most say the law has increased costs of health care or health insurance (59%, 12% of total). Smaller shares say it has made it more difficult to access care (22%, 5% of total), or caused someone in their family to lose coverage (11%, 2% of total). The high costs of health care in this country continue to be a major burden for many families.

Most Of Those Who Say ACA Hurt Them And Their Families Say It Increased Their Health Care Costs
  1. This estimate is a household measure of all groups and does not classify pre-existing conditions by whether they are or not a “deniable” condition. See the KFF Health Tracking Poll October 2020 topline for full question wording and details. ↩︎

The Biden Administration’s Final Rule on Section 1557 Non-Discrimination Regulations Under the ACA

Published: May 15, 2024

This brief provides an overview of the Biden Administration 2024 final rule implementing Section 1557 of the ACA, which is home to the law’s major nondiscrimination provisions. While Section 1557’s protections took effect when the ACA was enacted in 2010, much of its reach has been determined by implementation guidance issued across different Presidential administrations, often reflecting conflicting views. The final rule reinstates and expands upon many of the 2016 regulations from the Obama Administration and is a reversal from much of the 2020 Trump Administration rule. We provide a brief background on 1557 rulemaking and identify key differences between this rule and the 2020 rule. We also highlight two areas of growing interest impacted by the rule – nondiscrimination protections for pregnancy related decisions, past, present and future, including abortion, and for transgender people. Despite the issuance of the final rule, debates about 1557’s protections, and ensuing litigation, continue and will be particularly dependent on the outcome of the 2024 Presidential election.

Introduction

On April 27, 2024, the Biden Administration’s Department of Health and Human Services (HHS) finalized long-awaited revised regulations implementing Section 1557 of the Affordable Care Act (ACA). Section 1557 prohibits discrimination on the basis of race, color, national origin, age, disability, or sex and applies to health programs and activities receiving federal financial assistance (referred to as covered entities). In broad terms, it prevents covered entities from discriminating against certain protected groups in providing health care services, insurance coverage and program participation. The rule has staggered effective dates starting on July 5, 2024. In broad terms, 1557 provides nondiscrimination health care protections to individuals in protected groups, including prohibiting denial of benefits, coverage, program participation, and otherwise unequal treatment based on these factors

The administration also released a FAQ and press release. Section 1557 houses the law’s major nondiscrimination provisions by incorporating protections from existing civil rights laws. These laws include Title VI of the Civil Rights Act of 1964 (race, color, and national origin), Title IX of the Education Amendments of 1972 (sex), the Age Discrimination Act of 1975, and Section 504 of the Rehabilitation Act of 1973 (disability). Notably, Section 1557 is the first federal civil rights law to prohibit discrimination on the basis of sex in health care.

Section 1557’s protections took effect when the ACA was enacted on March 23, 2010, but much of the law’s reach has been determined by implementation guidance issued by different Presidential administrations, reflecting different interpretations  and  priorities. Across the Obama, Trump, and Biden administrations, the 1557 implementing regulations have volleyed back and forth in their interpretations, particularly related to the scope of entities covered by the law and the law’s ability to provide nondiscrimination protections based on sexual orientation and gender identity and pregnancy related conditions. These debates, and ensuing litigation, are likely to continue, and will be particularly dependent on the outcome of the 2024 Presidential election.

Key Dates in the Evolution, Implementation, and Interpretation of the ACA's Section 1557

Most of the implementing regulations in the new rule are effective 60 days (July 5, 2024) after publication in the Federal Register (May 6. 2024). Some provisions impacting health insurance plan design won’t become effective until the plan year beginning after January 1, 2025, and other provisions where entities might need additional time to amend current practices also have later effective dates. (The rule and the FAQ provide a table of these dates.)

The FAQ accompanying the rule states it was necessary to issue this guidance “to restore and strengthen civil rights protections for individuals consistent with…the statutory text,” noting that the 2020 Trump Administration rule “covers fewer programs and services and limited nondiscrimination protections for individuals.”

Section 1557 has been subject to a wave of litigation across administrations. Litigation has both centered on rulemaking and on the statue itself. In some cases (e.g. Franciscan Alliance v. Azar), courts have found narrowly in favor of plaintiffs who have asserted that the requirement to cover or provide certain services, such as those related to termination of pregnancy or gender affirming care, violated their sincerely held religious beliefs and thus religious freedom protections. In other cases, courts have found that Section 1557 protects access to these same services, such as by requiring state Medicaid programs to cover gender affirming care (e.g. Flack v. Wisconsin). Courts have also weighed in on the legality of aspects of rulemaking (e.g. Whitman-Walker Clinic v. HHS) and litigation has already been filed in the state of Florida by the attorney general and a Catholic hospital group challenging the new rule (see State of Florida et al v. HHS et al.)  In addition, litigation related to other civil rights protections (Bostock v Clayton County, Georgia) has implications for Section 1557 and, in particular, this regulation’s interpretation of nondiscrimination based on sex. (Box 1)

Box 1: Impact of Bostock v Clayton County, Georgia on Section 1557

In June 2020, just three days after the Trump Administration rule was finalized, the Supreme Court ruled in Bostock v Clayton County, Georgia that in the context of employment, discrimination based on sex encompasses sexual orientation and gender identity. The Bostock ruling does not directly apply to 1557 because it was based on interpretation of sex protections under Title VII and the 1557 sex protections are pulled in through Title IX. However, courts have historically looked to Title VII in interpreting Title IX, including in cases where plaintiffs challenged the Trump-era rule. As such, prior to issuing the new regulation, the Biden Administration issued guidance in May 2021 stating it would interpret and enforce 1557’s sex nondiscrimination provisions to include protections on the basis of sexual orientation and gender identity in light of and consistent with Bostock.

Summary of Major Changes

The final rule closely mirrors a proposed rule issued by the Biden administration in July of 2022 and is, in many ways, a reversal of the final rule issued by the Trump Administration in June of 2020, which itself was a significant departure from the Obama Administration regulations issued in 2016. This  final  rule reinstates and expands upon much of those 2016 regulations. Compared to the previous rules, key changes in the Biden Administration final rule include:

  • Section 1557 applies to health programs or activities that receive direct or indirect federal financial assistance from HHS, health programs and activities administered by HHS, and Therefore, covered entities include state Medicaid agencies, Medicare, many health insurance plans, and most hospitals and providers, among others. The new rule expands on the types of entities subject to 1557 compared to the Trump rule, including by determining that 1557 protections apply to products sold by issuers with plans on the marketplaces (not just the marketplace plans themselves) and by considering Medicare Part B as receiving Federal financial assistance for the first time;
  • Provides nondiscrimination protections for those who experience discrimination on the basis of multiple protected characteristics. (A new protection compared to both the Obama and Trump rules);
  • Explicitly provides for nondiscrimination protections based on gender identity and sexual orientation, sex characteristics (including intersex traits), and pregnancy related conditions including pregnancy termination, as well as related specific health insurance coverage protections, expanding these moderately compared to the Obama rule and completely compared to the Trump rule;
  • Provides specific nondiscrimination protections for transgender people’s access to care and coverage, expanding moderately on those in the Obama rule and completely compared to the Trump rule. The rule requires people be treated consistently with their gender identity, prohibits the denial of gender affirming care when provided for other purposes, if the denial is on the basis of sex, and the categorical exclusion of gender affirming care. (See box 3 for additional details related to this provision);
  • Protects patients from discrimination on the basis of actual or perceived abortions but states it is not a violation of Section 1557 if providers do not provide abortions unless the provider does not do so based on an individual’s protected status (e.g. race, age, etc.) (See box 2 for additional details related to this provision);
  • Removes explicit blanket abortion and religious freedom exemptions which the Trump rule incorporated through Title IX’s religious exemptions, stating instead that robust religious freedom protections exist outside of Section 1557 and that incorporation of Title IX exemptions through the rule is not necessary;
  • Adopts a new religious freedom and conscience protections exemptions process;
  • The new rule reinstates explicit prohibitions on discrimination based on gender identity and sexual orientation that had existed in ten other federal regulations outside Section 1557. The protections were put in place through Obama Administration regulations and related to coverage, access, and marketing, in Medicaid, private insurance, and the Marketplaces but were eliminated in the Trump Administration’s 1557 rule.;
  • Expands protections for those with limited English proficiency (including in telehealth) compared to both prior rules;
  • Includes new provisions for services requirements and notices related to language access and access to auxiliary aids and services, and adopts new policies and staffing requirements for 1557 compliance;
  • Reaffirms most requirements related to disability discrimination from the 2016 rule, which complement a new rule on web accessibility for public entities under the Americans with Disabilities Act and major updates to regulations implementing Section 504 of the Rehabilitation Act, which were last updated in 1977. Section 504 prohibits recipients of federal funding, including publicly-subsidized health payers and health care providers who accept Medicare or Medicaid, from discriminating against people on the basis of disability. Among other changes, the Section 504 health provisions address discrimination in medical treatment, create enforceable standards for medical equipment, address accessible web content and mobile apps, and codify the Olmstead requirement to serve people with disabilities in the most integrated setting that is appropriate.
  • Reflecting emerging technologies, for the first time, addresses and applies Section 1557 nondiscrimination protections to the use of telehealth and patient care decision support tools, including in addressing bias in clinical algorithms and other tools and in the use of AI.

Box 2: Abortion – Protections from Sex Discrimination Includes Pregnancy Termination

The ACA protects providers and programs based on their willingness to provide, pay for, cover, or refer for abortion or to provide or participate in such trainings. The new final Section 1557 rule includes protections for patients on discrimination on the basis of having had actual or perceived abortions. OCR explains that a covered provider’s decision not to provide an abortion is not a violation of Section 1557 unless the provider chooses not to provide abortion for a particular individual based on a protected ground such as race. Some commenters “expressed concern that Dobbs created tension between health providers, and patients, increasing distrust in providers and that it has created chaos in the health care system. They state this has increased the risk that patients will experience discriminatory care and suffer delays in lifesaving treatment as a direct result of legal and medical uncertainty. These commenters said that discrimination in care propagates more distrust, which is a significant barrier for individuals seeking care and is precisely what section 1557 was designed to protect against.” OCR responded to these concerns noting that it is considering revisions to the HIPAA Privacy Rule to strengthen privacy protections for individuals’ protected health information related to reproductive health care.

Box 3: Care and Access for Transgender People – Protections from Sex Discrimination Include Gender Identity

Section 1557’s regulatory treatment of sexual orientation and gender identity has changed considerably over time. The 2016 Obama Administration rule interpreted sex nondiscrimination protections to include gender identity and sex stereotyping (among other identities) but not sexual orientation. At that time, HHS stated it would “evaluate complaints alleging sex discrimination … sexual orientation” on a case-by-case basis and anticipated that case law would evolve as to clarify whether sexual orientation could be covered. The Trump Administration did not define sex in the regulatory text but in the preamble suggested it would interpret sex to mean only biological sex assigned at birth. The Biden Administration interpreted sex to include sexual orientation and gender identity (among other identities), reaffirming its earlier guidance which took the same approach, in light of Bostock (see Box 1). It also extends these protections to include intersex people for the first time.

As noted above, the new rule also reinstates explicit prohibitions on discrimination based on gender identity and sexual orientation in regulations outside of Section 1557 that had been put in by the Obama Administration but eliminated through the Trump Administration’s 1557 rule.

***

In addition, the rule, in text and preamble, spells out specific protections for transgender people and access to gender affirming care including that entities cannot refuse gender affirming care services that would be provided to an individual for other purposes, if the limitation is based on sex or gender and that the categorical exclusions of gender affirming care is prohibited. It does not prohibit nondiscriminatory denial of services with the preamble noting “OCR has a general practice of deferring to a clinician’s judgment about whether a particular service is medically appropriate for an individual, or whether the clinician has the appropriate expertise.” OCR states any investigations will not focus on clinical judgment per se but rather whether that judgment reflects unlawful bias, The rule also does not prevent a covered entity from availing itself of religious freedom and creates new pathways for asserting such protections. (Additional details in Table 1.)

***

Some commenters had specific concerns regarding the rule’s application to “State laws that prohibit access to gender-affirming care…” OCR responded that “some States may have laws…that are contrary to the final rule’s nondiscrimination protections, and…section 1557 preempts those laws.” The conflict between state and federal law in this case is unresolved and the Florida Attorney General, along with a Catholic medical group, has filed suit alleging that the rule requires providers to provide gender affirming care and violates protections.

Table 2 summarizes the major provisions of HHS’s new final rule and provides a side-by-side comparison to the Obama (2016) and Trump (2020) administration rules.

Key Changes to HHS Regulations Implementing ACA Section 1557


News Release

New KFF Poll Finds that Many Older Voters Are Unaware of Medicare Drug Price Negotiation, But Awareness Has Grown

Among Independent Voters, President Biden Has a Trust Advantage Over Former President Trump on Many Areas of Health Care

Published: May 15, 2024

A new KFF poll finds that many older voters are unaware of the provision in the Inflation Reduction Act that for the first time requires the federal government to negotiate the price of some prescription drugs in the Medicare program, a key campaign issue for President Joe Biden.

The 48% of voters ages 65 and older who are aware of the landmark change represents a 12 percentage point increase from November, the poll shows. 

Fifty-two percent of older voters are aware of another provision in the IRA, signed into law by Biden in 2022, that has received attention, capping the out-of-pocket cost of insulin for people on Medicare at $35 per month. And 40% are aware of another less widely discussed but significant provision that places an annual limit on out-of-pocket costs for people on Medicare, up from 27% in November.

The poll probed voters’ views of major health policy issues and how they line up with the presidential candidates’ approaches, both in office and on the campaign trail.

“It is commonly believed this is not a health care election because there is no national health reform debate,” said KFF President and CEO Drew Altman. “But in a close election voter concerns about a variety of health care issues, including abortion, prescription drugs and health care costs, could add up and make a difference in key states.”

The poll also finds that large majorities of voters overall, and across political identification, support extending to all adults with health insurance several of the IRA’s Medicare drug provisions – echoing what Biden has proposed. That includes the monthly insulin cost cap, favored by 88% of Democratic voters and 89% of Republican voters, and the annual drug spending limit, backed by 85% of Democrats and 87% of Republicans. Three-quarters of voters (75%) want to expand the number of Medicare drugs covered by price negotiations, including 79% of Democrats and 68% of Republicans.

 Trust on health issues 

On health care issues overall, partisans predictably put more trust in their own party’s candidate, but the poll shows that Biden has a clear trust advantage over former President Donald Trump with independent voters, a key voting group, on many areas of health care.

The poll finds that independent voters tilt toward Biden over Trump when it comes to whom voters trust more to determine the future of the ACA (49% v. 23%); ensure access to affordable health insurance (47% v. 22%); maintain protections for people with pre-existing health conditions (47% v. 23%); and determine the future of Medicare (44% v. 23%) and Medicaid (44% v. 24%).

On the issue of health care costs, which rises to the top of many voters’ concerns, Biden has a somewhat smaller advantage over Trump with independent voters (39% v. 26%) — although about a third (34%) of independent voters say they trust neither candidate on this issue.

At the same time, among all voters – not specifically independents — most are pessimistic about what either candidate would accomplish in addressing the issue of prescription drug costs. Fewer than half of voters say it is “very” or “somewhat” likely that Biden’s policies would lower prescription drug costs for people on Medicare (47%) or for everyone (43%) if he were re-elected. About four in ten voters say the same about Trump (41% for people with Medicare, 40% for everyone).

Abortion policy

The poll examined voter support for two broad approaches to abortion policy, among the most contentious issues in the election. Most voters (62%) support guaranteeing a federal right to abortion, as advocated by Biden. Fewer (42%) support leaving it up to individual states to decide the legality of abortion, as advocated by Trump.

While partisans divide, the share of Democratic voters who support a federal guarantee (89%) is larger than the share of Republican voters who support leaving the matter up to the states (60%). About six in ten (62%) independent voters favor a federal right to abortion. (For a deeper look at abortion in the election, see KFF’s March 2024 Health Tracking Poll.)

Future of the ACA

Although a majority of voters have favorable views of the ACA, attitudes towards the law continue to be marked by partisanship, with Democrats expressing more favorable views of the ACA than Republicans.

Nevertheless, the poll shows majority support (72%) for extending enhanced federal financial assistance for people who purchase ACA marketplace coverage. That includes large majorities of Democratic (90%) and independent voters (73%) and a smaller majority of Republican voters (57%). The enhanced subsidies are scheduled to expire at the end of 2025.

A large majority of voters say they think Trump – who tried to repeal the ACA when he was president – would either try to repeal the ACA (50%) or scale back what the law does (30%) if he is re-elected. Republican voters are less likely than Democratic voters to say Trump would attempt to repeal the entire ACA (37% v. 67%). Previous KFF polling has found that few voters think Trump has a plan to replace the ACA.

Future of Medicare, Medicaid, and Social Security

Majorities of voters are worried that, in the future, people covered by Medicare, Social Security, and Medicaid won’t be able to get the same level of benefits that are available today, with at least three in four saying they are at least somewhat worried about this when it comes to Social Security (83%), Medicare (78%), and Medicaid (73%). A recent report by the Medicare and Social Security trustees projects both programs will have insufficient funds to pay full benefits in about a decade.

When it comes to determining the future of these programs, voters overall are mixed in terms of which candidate they trust more, but older voters give a clear advantage to Biden. For example, about half of voters ages 65 and older say they trust Biden more to determine the future of Social Security (49%), Medicare (49%), and Medicaid (50%), while about a third of older voters say they trust Trump more on each. 

Regarding Medicaid, the poll finds most voters across gender, age, and racial and ethnic groups are opposed to the idea of capping the federal government’s contribution to the states in paying for the program. However, while large shares of Democratic voters (87%) and independent voters (74%) say they want Medicaid to continue as it is today, Republican voters are evenly divided, with 50% preferring Medicaid to stay as it is today and 49% saying the federal government should limit how much it pays states and give them greater flexibility to administer their Medicaid programs.

Designed and analyzed by public opinion researchers at KFF. The survey was conducted April 23-May 1, 2024, online and by telephone among a nationally representative sample of 1,243 registered voters in English and in Spanish. The margin of sampling error is plus or minus 4 percentage points for registered voters. For results based on other subgroups, the margin of sampling error may be higher.