VOLUME 3

Anti-Vaccine Disinformation Campaign, Sunscreen Myths, and Counterfeit Ozempic on Social Media

This is Irving Washington and Hagere Yilma. We direct KFF’s Health Misinformation and Trust Initiative and on behalf of all of our colleagues across KFF who work on misinformation and trust we are pleased to bring you this edition of our bi-weekly Monitor. 

This edition focuses on intentionally false or misleading information online and its potential impact on public trust in health care. We share a recent report that exposed a covert U.S. military social media disinformation campaign in the Philippines that may have undermined public confidence in vaccines. We also examine how false claims about sunscreen and non-FDA-approved “miracle cures” may be discouraging people from taking important preventative measures and seeking legitimate medical treatment. Finally, we explore the rise of counterfeit diabetes and weight-loss drugs like Ozempic and the potential impact on trust in the pharmaceutical supply chain.


Recent Developments

US Military’s Covert Anti-Vaccine Disinformation Campaign in the Philippines

A photograph of a person holding a vaccine and a syringe
Tetra Images/Getty Images

In June, a Reuters investigation revealed that the U.S. military conducted a covert anti-vaccine disinformation campaign in the Philippines between 2020 and 2021. As a part of the campaign, U.S. military officials used fake social media accounts to spread false information to people in the Philippines about COVID-19 equipment from China. This included masks, test kits, and the Chinese Sinovac vaccine, which is the first COVID-19 vaccine that was available in the Philippines. Health experts said these actions put  lives at risk and undermined confidence in public health systems. The Philippines, a long-time ally of the U.S., had one of the highest COVID-19 death rates in the region and some of the lowest vaccination rates. Reuters was unable to determine the reach and impact of the disinformation campaign, but it likely hindered vaccination efforts in the Philippines. Studies suggest that any anti-vaccine campaign can potentially undermine overall public trust in vaccines.

Sunscreen Misinformation is Spreading on TikTok

A photograph of a person sitting on a beach applying sunscreen
RuslanDashinsky/Getty Images

A recent rise in false or misleading social media posts claiming sunscreen causes cancer is discouraging people from using it. These claims, often linked to past sunscreen recalls involving benzene, confuse consumers about the safety of oxybenzone. Unlike benzene, oxybenzone is a common sunscreen ingredient that experts say does not cause cancer and is important for protecting against UV rays that do.

Sunscreen is an important tool for protecting people from harmful UV rays and skin cancers like melanoma. Despite its proven benefits, these claims reflect concerns that young adults have about sunscreen’s safety. According to a nationally representative survey conducted for the Orlando Health Cancer Institute, one in seven (14%) adults under 35 mistakenly believe that daily sunscreen use is more damaging to the skin than direct sun exposure. Health professionals can work to debunk or refute these claims, as skin cancer is the most common form of cancer in the U.S. and consistent sunscreen use remains one of the most effective ways to prevent it.

Unproven Health Remedies and Supplements Promoted on Social Media

A photograph depicting bottles with organic remedies
Iryna Veklich/Getty Images

Social media users have seen an increase in “miracle cures” and detoxes for cancer, but many of these remedies lack scientific support and may even be harmful. Memorial Sloan Kettering Cancer Center has debunked several of these unproven treatments, such as cannabis oil, which is often marketed as a cancer treatment despite the lack of clinical trials supporting its efficacy. Similarly, Sloan Kettering debunked the effectiveness of detox diets, explaining that the body naturally detoxifies itself and that these diets can lead to nutrient deficiencies and other health problems.

Social media has also fueled the popularity of unproven supplements marketed to manage menopause symptoms. Concerns and misconceptions about hormone therapy have led some women to seek natural alternatives to relieve hot flashes, night sweats, and other disruptive symptoms. However, experts caution that these menopause supplements are not FDA-approved and usually contain unregulated herbal blends that make them ineffective or dangerous. This trend highlights both the gaps in public knowledge about menopause and the prevalence of misinformation about hormone therapy, which is a safe and effective treatment for moderate-to-severe symptoms. 

Polling Insights:

The KFF Health Misinformation Tracking Poll Pilot (June 2023) found that about one in four adults (24%) say they use social media at least once a week to find health information and advice, including larger shares of Hispanic (49%) and Black adults (35%) compared to White adults (15%), and younger adults compared to older adults (32% of those ages 18-29 compared to 14% of those ages 65+).

The poll also found that social media use is correlated with being exposed and inclined to believe health misinformation. For example, the survey found that a majority of those who use social media for health information and advice at least weekly say that they have heard at least one of the false COVID-19 or vaccine claims tested in the survey and think it is definitely or probably true, compared to four in ten of those who don’t use social media for health advice (Figure 1).

Adults Who Use Social Media Weekly For Health Information Are More Likely To Have Heard Pieces Of Health Misinformation And Say They Are Probably Or Definitely True

Emerging Misinformation Narratives

WHO Issues Warning on Rise of Counterfeit Semaglutides Like Ozempic

Iuliia Burmistrova/Getty Images

Fake weight-loss drugs are on the rise, potentially eroding trust in legitimate healthcare providers and pharmaceutical supply chains. In June, The World Health Organization (WHO) issued a warning about a rise in counterfeit versions of Ozempic and other semaglutides, a class of GLP-1 drugs intended for diabetes management and weight-loss.

The FDA had warned about counterfeits in the U.S. last year, but this is the WHO’s first formal warning. The new warning resurfaces a false claim that Ozempic contains lizard venom. This claim comes from a misunderstanding of Ozempic’s origins. In the 1990s, researchers studied a hormone in the venom of the Gila monster that helps the lizard regulate its blood sugar during hibernation. These researchers then created a synthetic version of the hormone, ushering in a new class of diabetes drugs, including Ozempic. The Gila monster’s venom is not present in those drugs. 

One conspiracy news article promoting the false lizard venom claims was originally published on June 9 and later republished on another conspiracy news website on June 23. The author wrote, “…by labeling reptile venom peptides as ‘FDA-approved medications,’ the western medicine system has quite literally figured out a way to get people to voluntarily maim or kill themselves, even while paying for the privilege of doing so.” 

Conversation about the WHO’s warning on Ozempic represents only a slight bump in overall online conversations about the medication over the past two months, accounting for 4.5% of Ozempic-related posts between June 19 and June 26. It’s expected that preexisting false claims about the safety and effectiveness of Ozempic may continue to reemerge—however, these false claims won’t necessarily gain traction.

Polling Insights:

The May 2024 KFF Health Tracking Poll finds that 12% of adults say they have ever used GLP-1 drugs, including 6% who say they are currently using them. The share who report ever taking these drugs rises to about four in ten (43%) among adults who have been told by a doctor that they have diabetes, a quarter (26%) of adults who have been told they have heart disease, and one in five (22%) adults who have been told by a doctor that they are overweight or obese in the past five years (some of whom also have diabetes or heart disease; Figure 2).

One in Eight Adults Say They Have Ever Used GLP-1 Drugs, Rising to Four in Ten Among Adults Who Have Been Diagnosed With Diabetes

While most adults who have ever taken a GLP-1 drug say they got a prescription from their primary care doctor or specialist (79%), some report getting them from an online provider or website (11%), a medical spa or aesthetic medical center (10%), or from some other source (2%; Figure 3).

Most Adults Who Have Taken GLP-1 Drugs Say They Got Them From Their Primary Doctor or Specialist, About One In Four Say They Got Them From Another Source

Health Discussions to Watch

COVID-19 Vaccine Safety: On June 17, the Kansas attorney general filed a lawsuit against Pfizer for allegedly covering up COVID-19 vaccine risks, specifically pregnancy complications and heart inflammation. Social media posts in both English and Spanish used the allegations in the suit to falsely claim that COVID-19 vaccines are unsafe and ineffective. A video of the Kansas attorney general announcing the lawsuit was shared by several social media accounts on X. The single most popular post sharing the video received 782,500 views, 26,000 likes, 5,000 shares, and 459 comments as of June 26. Most comments on the post express support for the lawsuit and distrust in COVID-19 vaccine safety.

Bird Flu: As H5N1 bird flu continues infecting animals in the U.S., false claims about the origins of the outbreak are appearing on social media platforms, primarily on X. Some recent viral posts on X falsely claim that the bird flu outbreak is a “plandemic” created by the government to sway election results, increase profits for pharmaceutical companies, and harm farmers. One social media post on X shared a news clip about a bird flu outbreak on an Australian farm. The text of the post read, “More sinister Globalist tactics to attack farmers, reduce food production & bring back more experimental vaccines.” That post received 319,800 views, 7,200 likes, 4,700 shares, and 1,400 comments as of June 26.


Research Updates

Fact-Checking and Media Literacy Efforts Reduce Misinformation Belief, but Heighten Skepticism Toward Accurate Information

A study published in Nature Human Behaviour looked at how fact-checking and media literacy interventions affect people in the US, Poland, and Hong Kong. The study found that while these efforts were effective in reducing belief in false information, they also increased skepticism about accurate information. This unintended consequence highlights the challenge of maintaining trust in reliable health information amid efforts to combat misinformation. Health professionals may need to adopt nuanced strategies that minimize distrust while effectively addressing health misinformation in public communication.

Source: Hoes, E., Aitken, B., Zhang, J., Gackowski, T., & Wojcieszak, M. (2024). Prominent misinformation interventions reduce misperceptions but increase scepticism. Nature Human Behaviour, 1-9.

Impact of Misinformation Concerns on News Choices

A study from the Harvard Misinformation Review looked at how concerns about misinformation affect people’s news choices. The study found that that people who are more worried about false information tend to choose news that matches their political views. For example, liberals who are worried about misinformation tended to favor sources like MSNBC or the Huffington Post. Democrats were especially likely to favor news that matched their political views when worried about misinformation. Feeling confident about spotting false information did not change this behavior. These findings show how concerns about misinformation can lead people to only read news that aligns with their beliefs. This can deepen political divisions and make it more challenging to address false or misleading information in public discussions.

Source: Harris, E. A., DeMora, S. L., & Albarracín, D. (2024). The consequences of misinformation concern on media consumption. Harvard Kennedy School (HKS) Misinformation Review. https://doi.org/10.37016/mr-2020-149


AI and Emerging Technologies

A photograph of a person typing at a keyboard - with a search box overlaid on top of the photo
Chadchai Ra-ngubpai/Getty Images

Google’s AI Overviews Feature

In May, Google unveiled its AI Overview feature, which is designed to help consolidate and streamline searches for users. Now, when you search for something on Google, a short answer summarizing results from reliable sources will appear at the top of that Google search. However, ABC notes concerns that these summaries may prioritize convenience over accuracy. The system pulls from a variety of web sources, including blogs and satirical sites, and has had some early challenges with inaccurate answers that were difficult for users to verify. To address this, Google is limiting how frequently AI Overviews draws its information from these unreliable sources and will begin providing links to the original sources. The potential for AI Overviews to provide users with accurate and reliable health information depends on its ability to adapt to evolving disinformation tactics and improve transparency around information sources.

About The Health Information and Trust Initiative: the Health Information and Trust Initiative is a KFF program aimed at tracking health misinformation in the U.S., analyzing its impact on the American people, and mobilizing media to address the problem. Our goal is to be of service to everyone working on health misinformation, strengthen efforts to counter misinformation, and build trust. 


View all KFF Monitors

The Monitor is a report from KFF’s Health Information and Trust initiative that focuses on recent developments in health information. It’s free and published twice a month.

Sign up to receive KFF Monitor
email updates


Support for the Health Information and Trust initiative is provided by the Robert Wood Johnson Foundation (RWJF). The views expressed do not necessarily reflect the views of RWJF and KFF maintains full editorial control over all of its policy analysis, polling, and journalism activities. The Public Good Projects (PGP) provides media monitoring data KFF uses in producing the Monitor.


Poll Finding

Polling Insight: Republican Women Voters on Abortion

Published: Jul 10, 2024

Ahead of the 2024 Republican National Convention, the party has softened its language around access to abortion in a draft version of the party platform, mirroring the stance of the former president and Republican nominee, Donald Trump. Many major media outlets report that this platform change is likely a move to reduce vulnerability on the issue of abortion in the run up to the election. In fact, this will be the first time in 40 years that the Republican Party’s platform does not call for a federal ban on abortion.

While a majority of rank-and-file Republicans oppose a law guaranteeing a nationwide right to abortion, many support laws allowing access to abortion in certain situations. For example, most Republican and Republican-leaning independent women voters say they support leaving it up to the states to decide whether abortion is legal (60%) or a law establishing a nationwide ban on abortion after 15 weeks of pregnancy (57%). But large majorities of Republican women also support laws protecting access to abortion for patients who are experiencing pregnancy-related emergencies (79%) and a federal law protecting access to abortions in the case of rape or incest in all states even where abortion is banned (69%).

Republican women of reproductive age, ages 18 to 49, hold slightly less conservative views on abortion policies and a slim majority support a law guaranteeing a nationwide right to abortion (53%). Similar shares of younger Republican women voters support leaving it up to the states to decide whether abortion is legal (54%) or support a nationwide ban on abortion at 15 weeks (53%). With about half of younger Republican women voters supporting each of these three policy proposals, it is clear that there is some uncertainty among these voters on how abortion access should be addressed at the federal level. Still, most younger Republican women support access to abortion in certain cases, most notably in instances where patients are experiencing pregnancy-related emergencies.

Republican Women Voters Support Laws Protecting Abortion Access in Certain Cases, Younger Republican Women Also Support Nationwide Access

Republican women voters’ views on abortion are not monolithic. While most (58%) Republican women voters identify as “pro-life,” many (40%) say on the issue of abortion they are more “pro-choice.” In addition, half of Republican women voters think abortion should be legal in all or most cases, the same as the share who say abortion should be illegal. Just 13%, or about one in eight, Republican women voters say abortion should be illegal in all cases.

Once again, views differ slightly by age, with similar shares of Republican women voters of reproductive age (ages 18 to 49) saying they identify as “pro-life” (49%) and “pro-choice” (51%), while two-thirds of older Republican women voters identify as “pro-life.” In addition, a majority (56%) of younger Republican women voters say abortion should be legal in at least most cases, including one in five who say abortion should be legal in all cases.

Many Republican Women Voters, Especially Younger Women, Say Abortion Should Be Legal, Identify as Pro-Choice

While two-thirds of Republican women voters say they trust former President Trump to do a better job deciding abortion policy in this country compared to President Biden, a quarter of Republican women say they trust neither presidential candidate to do a better job on this issue. Additionally, one in three Republican women voters (34%) say neither political party does a better job of looking out for the interests of women. In fact, 16% of Republican women of reproductive age say they think the Democratic Party does a better job of looking out for the interests of women than the Republican Party.

Most Republican Women Say the Republican Party Does a Better Job of Looking out for Women, but Younger Republican Women Are Divided

Once a cornerstone issue for the Republican Party – with most single-issue abortion voters being pro-life and Republican prior to the Dobbs decision – abortion is no longer a top voting issue for Republican voters since Roe v. Wade was overturned. Fewer than one in ten Republican women (7%) say abortion is the most important issue to their vote (compared to 13% of Democratic women voters), well behind issues such as inflation (47%) and immigration (26%). Abortion also ranks lower than inflation for independent women (10%) alongside immigration and threats to democracy as their most important voting issue. The dashboard shows how abortion ranks as a voting issue for the different groups of women voters including partisans, across age groups, and race and ethnicity.

While the issue may not be motivating Republican women to go to the polls (just 3% of Republican women voters say they would only vote for a candidate who agrees with them on abortion), the party’s overall stance – which had been largely seen as anti-abortion – may be disenchanting some voters.

The KFF Survey of Women Voters, conducted earlier this summer, shows many women voters, including Republican women, are not satisfied with their choices of presidential candidates. While Republican women report being slightly more motivated to vote compared to Democratic women, younger Republican women largely feel like the Republican Party doesn’t share their views on reproductive health issues and want abortion to be legal in most cases. While many early reports about the drafted changes to the Republican National Convention party platform speculate that they are written to appease the Republican nominee for President, these changes also, perhaps coincidentally, could help the party appeal to a key voting base – Republican women.

The Growing Role of Foreign-Educated Nurses in U.S. Hospitals and Implications of Visa Restrictions

Published: Jul 10, 2024

Registered Nurses (RNs) play a key role in the health care workforce and contribute to the health and well-being of millions of Americans, working in hospitals, nursing homes, physician’s offices, and home health services. The profession has been experiencing shortages, which were exacerbated by the COVID-19 pandemic and are predicted to continue over the next decade as the 65 and older population in the U.S. grows, increasing health care needs. Demand for nurses will also likely increase to meet new requirements for nurse staffing levels in nursing facilities.

Immigrant workers could help address these needs. As of 2022, there were about 500,000 immigrant nurses in the U.S., accounting for about one in six of the close to 3.2 million RNs.1  However, immigration remains a hot-button political issue with ongoing anti-immigrant rhetoric and recent actions and proposals to limit immigration and immigrants’ role in the workforce. These actions include the federal government extending its pause on the processing of new visa applications for international nurses in June 2024. The pause has been in place since April 2023 and, at this time, the government is only processing applications submitted on or before December 2021. Legislation has been proposed to increase employment-based visas for nurses, although it has remained stalled since 2023. Visa opportunities for nurses could also potentially be expanded through administrative action, for example via H-1B visas, though they would have limitations.

These visa restrictions could exacerbate existing shortages in the nursing workforce and negatively impact the U.S. labor market and economy more broadly, particularly given the growing role of foreign-educated nurses in U.S. hospitals. KFF analysis of data from the American Hospital Association (AHA) Annual Survey shows that the overall share of hospitals reporting hiring foreign-educated RNs has nearly doubled between 2010 and 2022, and a growing share of hospitals report hiring an increasing number of foreign-educated RNs to fill vacancies over time.

Overall, 32% of hospitals accounting for nearly half (45%) of all hospital beds say they hired foreign-educated RNs in 2022, twice the share in 2010, when 16% of hospitals accounting for about a quarter (23%) of all hospital beds said they hired foreign-educated RNs (Figure 1). In addition, between 2010 and 2022, the share of hospitals saying they hired more foreign-educated nurses to help fill RN vacancies compared to the previous year rose from 2% of hospitals representing 3% of hospital beds to 14% of hospitals representing 22% of hospital beds (Figure 2).

The Share of Hospitals That Have Recruited Any Foreign-Educated Nurses Has Nearly Doubled Between 2010-2022
The Share of Hospitals Saying They Recruited More Foreign-Educated Nurses Compared to the Prior Year Has Grown Over Time
  1. KFF analysis of 2022 American Community Survey. ↩︎

House Committee on Appropriations Releases FY 2025 Labor, Health and Human Services, Education, and Related Agencies (Labor HHS) Appropriations Bill & Accompanying Report

Published: Jul 9, 2024

The House Committee on Appropriations released its FY 2025 Labor, Health and Human Services, Education, and Related Agencies (Labor HHS) appropriations bill on June 26, 2024 and accompanying report on July 9, 2024. The Labor HHS appropriations bill includes funding for U.S. global health programs provided to the Centers for Disease Control and Prevention (CDC) and funding for global health research activities provided to the National Institutes of Health (NIH). Total global health funding at CDC and NIH through the Labor HHS bill is not yet known, as funding for some programs at NIH is determined at the agency level rather than specified by Congress in annual appropriations bills. Funding for global health programs at CDC totals $564 million, which is $129 million (-19%) below both the FY24 enacted level and President’s FY25 request ($693 million). The bill would eliminate all funding for global HIV programs at CDC; all other program areas would be flat funded compared to enacted and request levels. Also, the report includes a provision requesting an update in the FY 2026 congressional budget justification on how agencies “jointly coordinate global health research activities with specific metrics to track progress and collaboration toward agreed upon health goals.” See the table below for additional detail on global health funding. See other budget summaries and the KFF budget tracker for details on historical annual appropriations for global health programs.

KFF Analysis of Global Health Funding in the FY25 House Labor Health & Human Services (Labor HHS) Appropriations Bill

10 Things About Long-Term Services and Supports (LTSS)

Published: Jul 8, 2024

Long-term services and supports (LTSS) encompass the broad range of paid and unpaid medical and personal care services that assist with activities of daily living (such as eating, bathing, and dressing) and instrumental activities of daily living (such as preparing meals, managing medication, and housekeeping). They are provided to people who need such services because of aging, chronic illness, or disability, and include services such as nursing facility care, adult daycare programs, home health aide services, personal care services, transportation, and supported employment. These services may be provided over a period of several weeks, months, or years, depending on an individual’s health care coverage and level of need.

More than 6 million people use paid long-term services and supports (LTSS) delivered in home and community settings and more than 2 million people use LTSS delivered in institutional settings, according to CBO estimates. An unknown, but likely larger number of people, use unpaid LTSS provided by family, friends, or neighbors. Virtually all people ages 65 and older and about 8 million people under age 65 with disabilities have Medicare, but Medicare generally does not cover LTSS. (See Box 1 for more information.) Most people who use paid LTSS either pay for it directly or have services covered under Medicaid. State Medicaid programs must cover LTSS provided in nursing homes, while coverage for most home and community-based services (HCBS) is optional. Eligibility for Medicaid LTSS is complex and varies widely by state. To qualify for coverage of LTSS under Medicaid, people must meet state-specific eligibility requirements regarding their levels of income, wealth, and functional limitations.

In addition to long-standing questions about the costs, affordability, and coverage of LTSS, there are also longstanding challenges finding enough workers to provide LTSS for people who need such services, and the COVID-19 pandemic exacerbated those issues considerably. As of January 2024, employment levels in most LTSS settings remained 4% below pre-pandemic levels. The Biden Administration finalized two rules intended to address the LTSS workforce and access to services. To address workforce shortages in nursing facilities, the Administration finalized a rule that would create new staffing requirements in nursing facilities, require state Medicaid agencies to report on the percent of Medicaid payments for institutional long-term services and supports that are spent on compensation for direct care workers and support staff, and provide funding for individuals to enter careers in nursing facilities. The Administration also finalized a rule aimed at ensuring access to Medicaid services, which included several provisions aimed specifically at LTSS provided in people’s homes and the community, including requiring states to spend least 80% of total payments for certain HCBS on compensation for direct care workers. In addition to federal action, many states have adopted payment rate increases for nursing facilities and HCBS providers with the goal of boosting staffing levels, as reported to KFF in a 2023 survey.

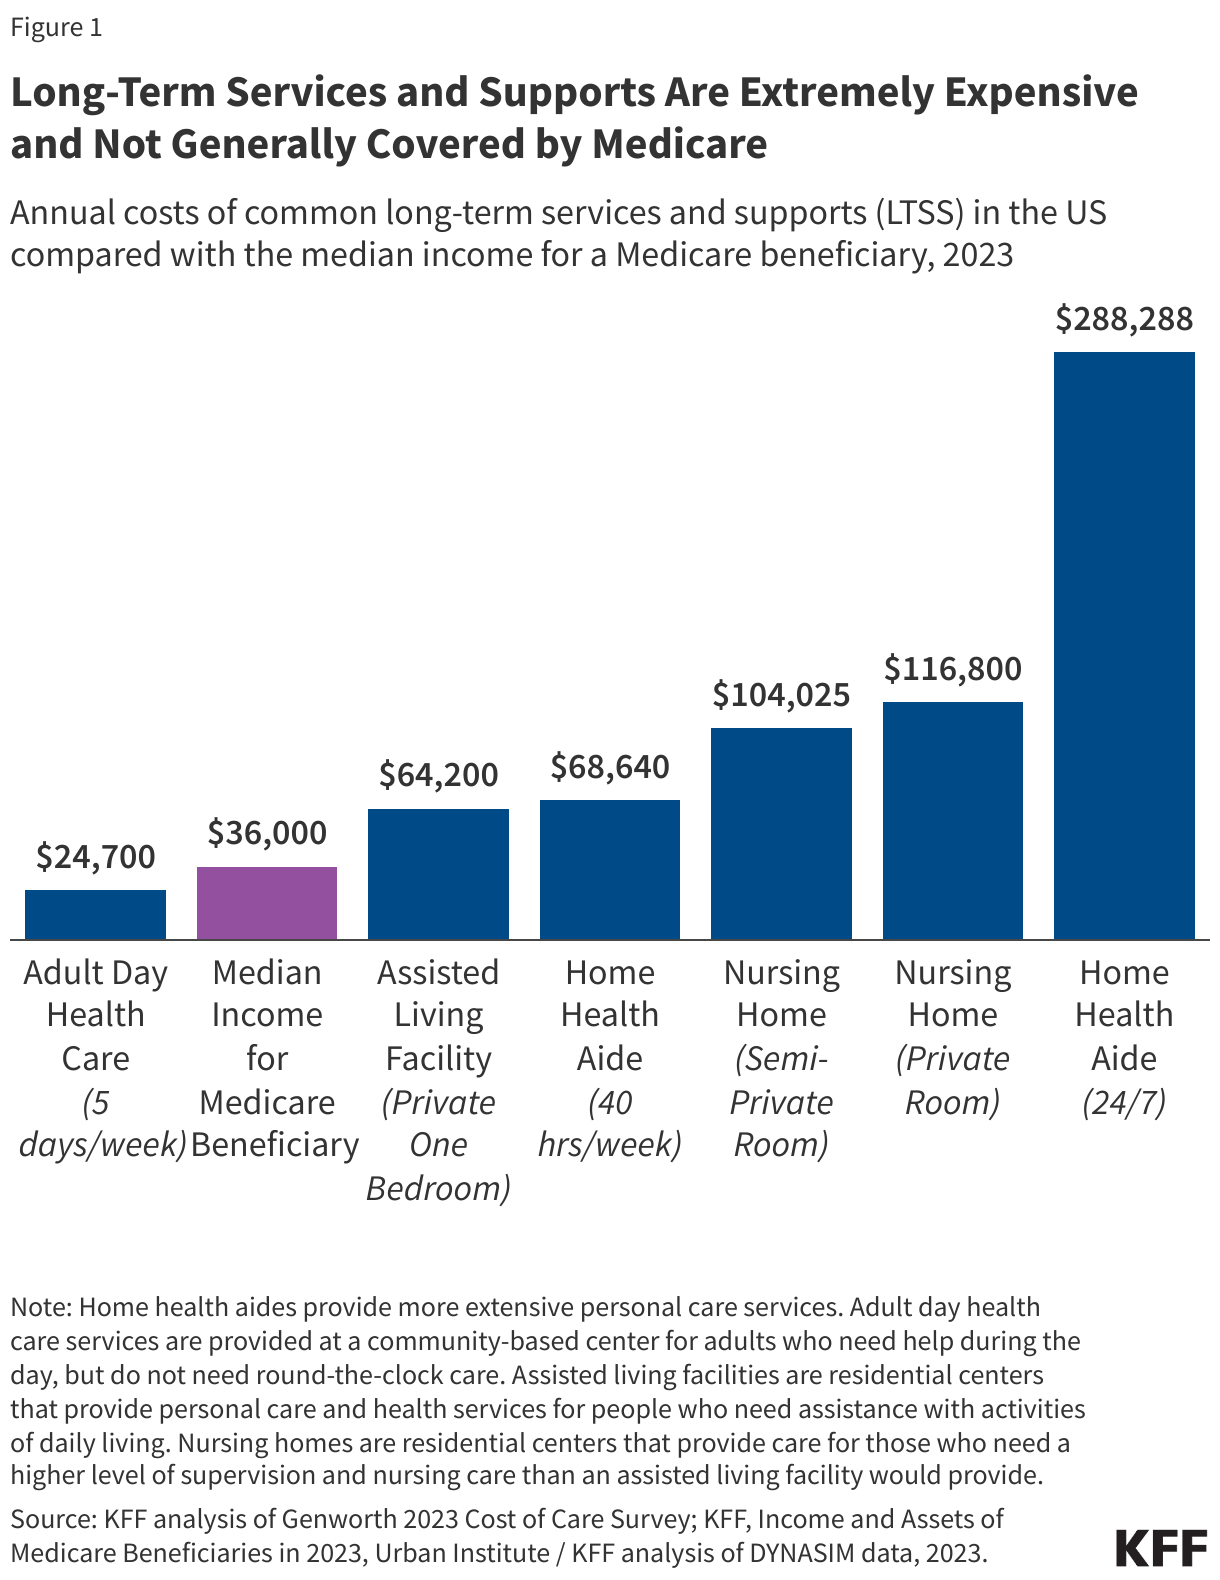
1. Long-term services and supports are extremely expensive and not generally covered by Medicare or health insurance.

The prices of health care services are quite high, but a greater percentage of people who use LTSS pay full price for that care when compared to other health care services. The difference between LTSS and other health care spending stems from the fact that private health insurance generally does not cover ongoing LTSS and Medicare’s coverage is limited to specific circumstances (see Box 1). The Department of Health and Human Services estimates that an average American turning 65 today will incur $120,900 in future LTSS costs, with families paying for over one-third of that themselves. This is higher than the 17% of overall LTSS expenses paid for out-of-pocket shown in Figure 2 because overall LTSS expenses include expenses for those who are under 65.

In 2023, the median annual costs of care in the U.S. were $62,400 for full-time homemaker services (people who help with instrumental activities of daily living such as preparing meals and doing laundry), $68,640 for full-time home health aide care, $116,800 for a private room in a nursing home, and $288,288 for round-the-clock home health aide services, all of which far exceed the median income for Medicare beneficiaries (about $36,000 in 2023, Figure 1). Such costs would also quickly exhaust the median savings for Medicare beneficiaries in 2023 ($103,800). Although nursing facility costs may be higher than the costs of some home-based services, nursing facility costs include round-the-clock monitoring and the costs of room and board. For people living in residential settings, the costs of maintaining a home such as rent, a mortgage, and other household expenses are paid separately from the costs of LTSS. The average costs of an assisted living facility ($64,200) only include the costs of room and board, so any LTSS expenses would be added to that total. Many people may use multiple services simultaneously, so their total annual costs may be like those of nursing facility or round-the-clock care.

Long-Term Services and Supports Are Extremely Expensive and Not Generally Covered by Medicare

Box 1: Does Medicare Cover LTSS?

Medicare is the federal health insurance program established in 1965 for people ages 65 or older, regardless of income or medical history, and later expanded to cover people under age 65 with long-term disabilities. Today, Medicare provides health insurance coverage to 66 million people, including 58 million people age 65 or older and 8 million people under age 65. Medicare covers a comprehensive set of health care services, including hospitalizations, physician visits, and prescription drugs.

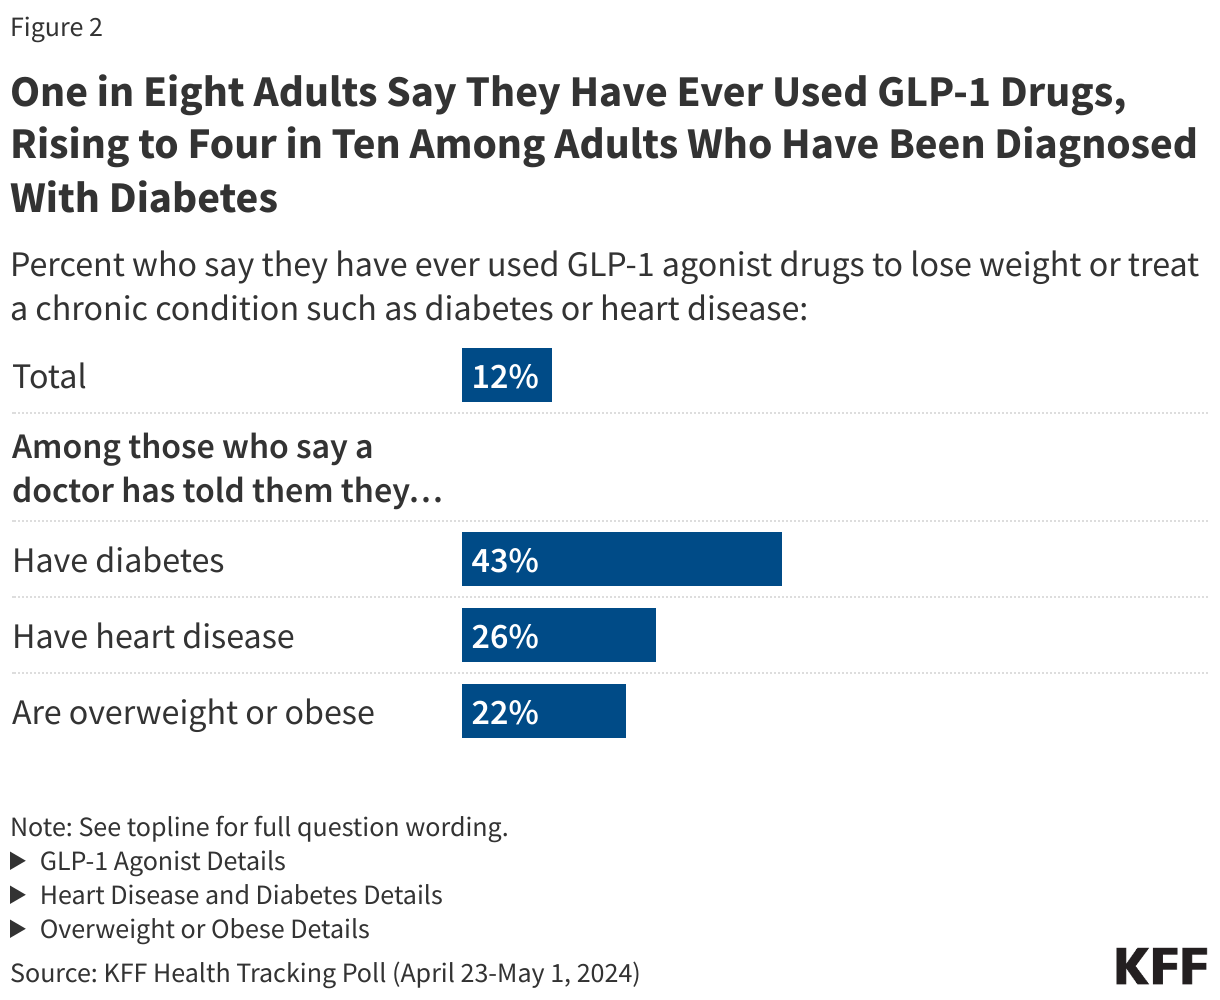
Medicare does not generally cover long-term care services but does cover up to 100 days of skilled nursing facility care following a qualifying hospital stay and covers home health services for people who need part-time or intermittent skilled services. As part of the home health benefit, Medicare covers nursing, physical, speech and occupational therapy, and also covers home health aide services, but only for people getting skilled nursing care at the same time, and not on a full-time basis. KFF polling shows that four in ten adults overall incorrectly believe that Medicare is the primary source of insurance coverage for low-income people who need nursing facility care or home care over a long period of time.

  • Medicare covers skilled nursing care for up to 100 days each benefit period in a certified SNF after a qualifying hospitalization.
  • For those who are ”homebound,” Medicare will pay for nurses and therapists to provide services in the home if the beneficiary needs skilled services. Being homebound does not mean that Medicare beneficiaries are unable to leave their homes, but rather that leaving the home is difficult or not recommended because of illness or injury; or that one is normally unable to leave the home because doing so is a major effort. Under those circumstances, Medicare will cover home health care services provided through a certified home health agency for up to 28 hours a week, with more intense care permissible for a short time period when determined necessary by a doctor.
  • Historically, home health and skilled nursing services had been denied in Medicare for beneficiaries when the purpose was for maintenance rather than for rehabilitation, but the Jimmo settlement in 2013 clarified that coverage of skilled nursing and home health care in Medicare was contingent upon beneficiaries demonstrating a need for skilled care rather than a requirement that beneficiaries show potential for their condition to improve.

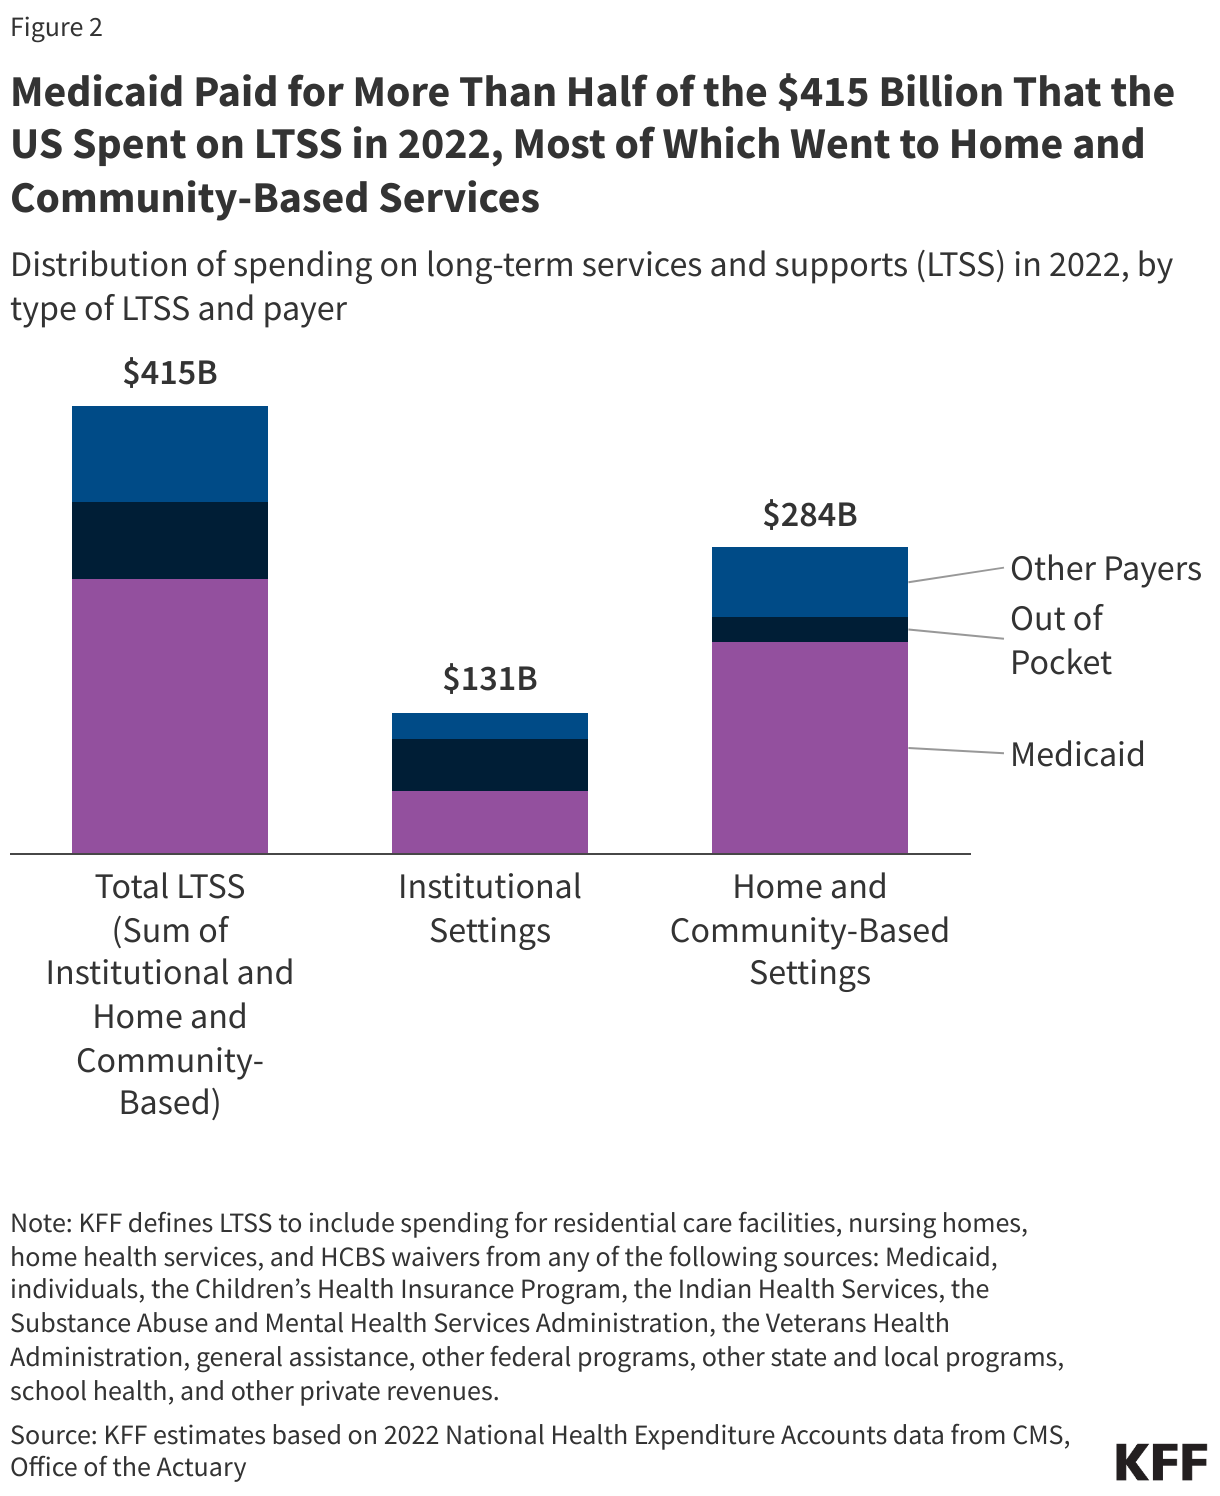
2. Medicaid paid for more than half of the $415 billion that the US spent on LTSS in 2022, most of which went to home and community-based services.

In 2022, the U.S. spent over $400 billion on LTSS, most of which went to home and community-based services (HCBS), based on KFF estimates of annual National Health Expenditure (NHE) data. Spending on home and community-based services was $284 billion and the remaining $131 billion was spent on institutional LTSS such as nursing facility care (Figure 2). Medicaid paid more than half (61%) of total US spending on all LTSS, followed by out-of-pocket spending (17%), and other public and private payers paid the remaining 21%. (See Box 2 for a description of what services and payers are included and excluded from LTSS spending in the KFF analysis.)

Medicaid Paid for More Than Half of the $415 Billion That the US Spent on LTSS in 2022, Most of Which Went to Home and Community-Based Services

Box 2: How does KFF define LTSS in the NHE data?

Unlike other sources of information on health care spending, the NHE use an accounting structure that captures all expenditures of health care goods and services and investment in the health care sector. Expenditures are classified into high-level service categories and by source of payment. Data sources include federal administrative data, household and individual surveys, surveys of businesses, and economic data from the Bureau of Labor Statistics and the Bureau of Economic Analysis.

KFF defines LTSS to include spending for residential care facilities, nursing homes, home health services and HCBS waivers. HCBS waivers may include a wide range of services such as adult daycare, home health, personal care, transportation, and supported employment. Under the NHE methodology, assisted living services are in both HCBS and institutional categories. Payments made to the assisted living facilities themselves are counted as institutional care unless they are paid for by Medicaid, in which case they are considered HCBS. For services such as home health and personal care that are provided to people in assisted living facilities, they would be considered institutional care if provided through the facility, but HCBS if provided through another provider such as an affiliated home health agency.

KFF’s definition of LTSS includes spending from any of the following sources: Medicaid, individuals, the Children’s Health Insurance Program, the Indian Health Services, the Substance Abuse and Mental Health Services Administration, the Veterans Health Administration, general assistance, other federal programs, other state and local programs, school health, and other private revenues. Medicaid expenditures may include some home health spending that is rehabilitative and not LTSS.

KFF excludes spending from certain payers. Within the excluded spending is $94 billion in Medicare spending, most of which is post-acute care, but some of which is home health spending that might be considered LTSS (see Box 1). KFF also excludes spending from private insurance because much of those expenditures are for rehabilitation and not LTSS. In most cases, private long-term care insurance reimburses people for the expenses they pay out-of-pocket and would be classified as out-of-pocket spending in the NHE data. KFF’s approach would exclude private long-term care spending in cases where private plans make payments directly to an organization, which is most likely for individuals using nursing facility care. Such situations are expected to be uncommon given few individuals receive benefits from long-term care insurance in any given year (see Figure 6).

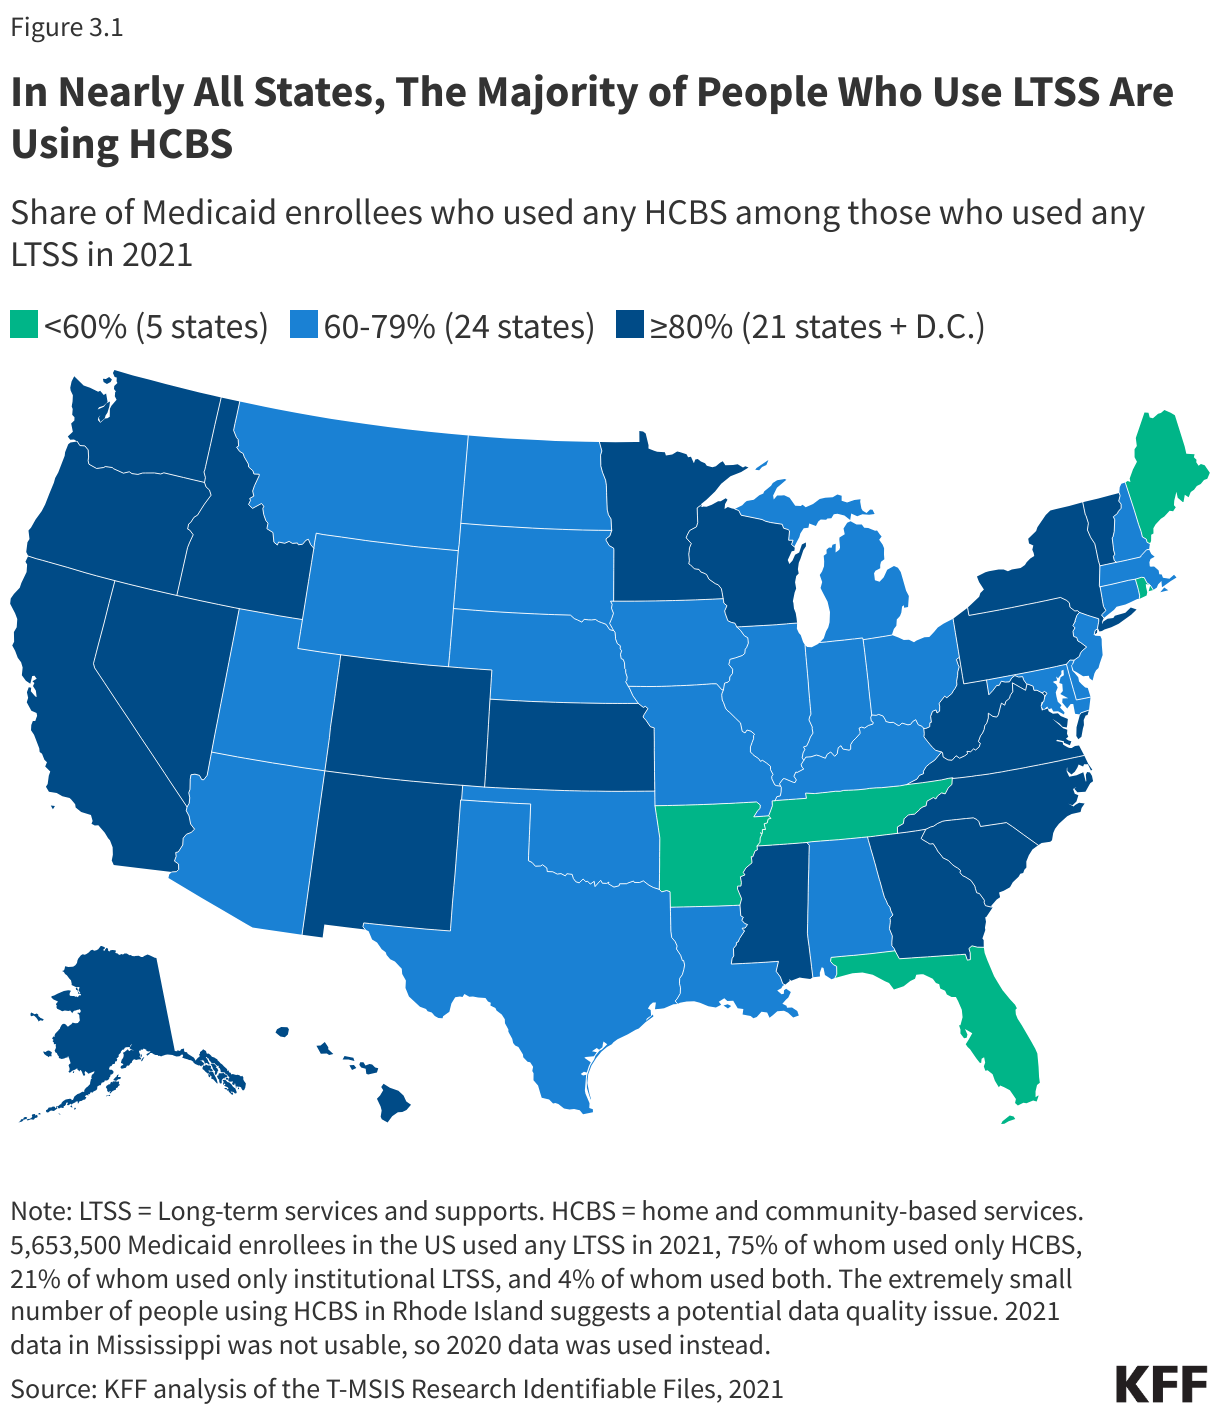
3. Among the 6 million people who use Medicaid LTSS in the U.S., most are using HCBS and over half are under 65.

In 2021, three-quarters of the 5.7 million people who used Medicaid LTSS were receiving HCBS, but this ranged from 49% in Florida to 98% in Oregon (Figure 3.1). The larger share of people receiving care in the community as opposed to in an institution reflects initiatives to make home and community-based care more widely available in recent years and to remove what has been referred to as the “institutional bias” in Medicaid. Analyses of Medicaid spending on LTSS show that the percentage of LTSS spending that pays for HCBS has increased from only 10% in 1988 to 62% in 2020. While the number of people using Medicaid HCBS exceeds the number who use institutional care nationally, Florida still provides services to more people exclusively in nursing facilities and other institutional settings than in home and community-based settings.

In Nearly All States, The Majority of People Who Use LTSS Are Using HCBS

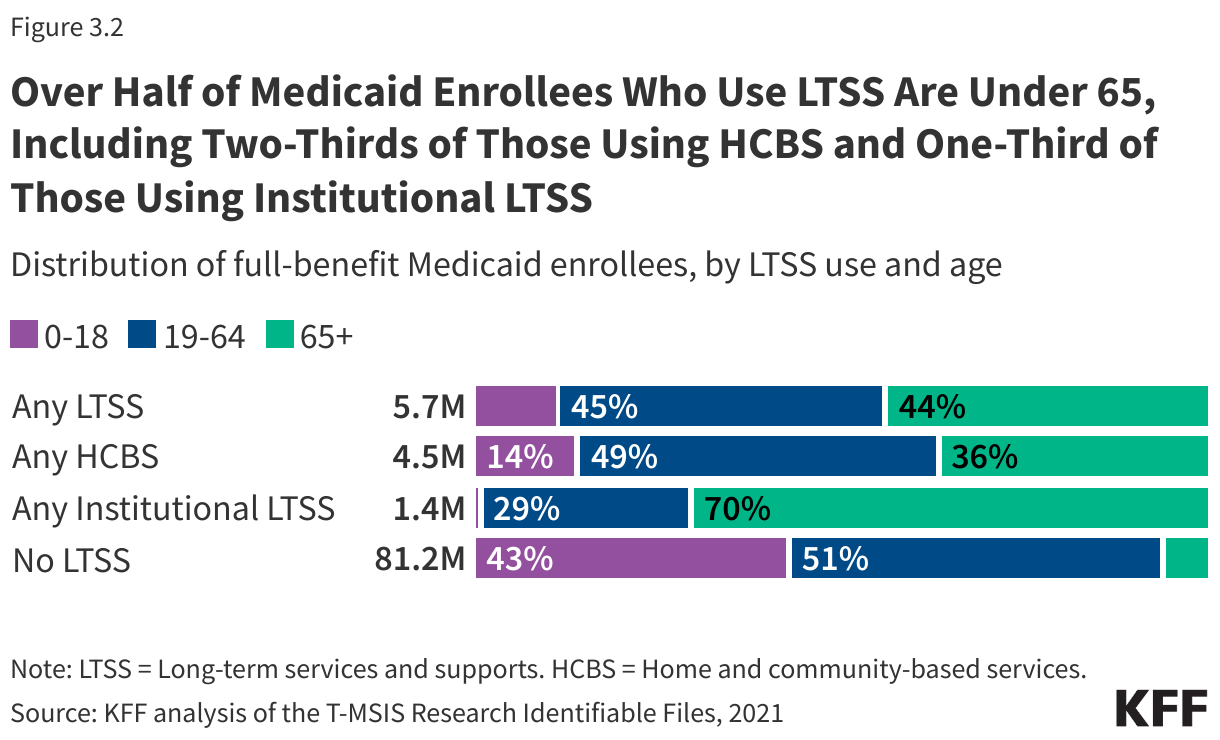
Over half (57%) of Medicaid enrollees who use LTSS are under 65: Among Medicaid enrollees who use HCBS, 63% are under age 65 compared with 30% of those who use institutional LTSS (Figure 3.2). LTSS are commonly associated with people ages 65 and older, but many younger enrollees use LTSS because of chronic illness or disability. The remaining 44% of enrollees who use LTSS are 65 and older. In comparison, only 6% of Medicaid enrollees who do not use LTSS are ages 65 and older. Among people who use HCBS, 14% are under age 19, and 49% are ages 19-64, whereas over two-thirds of people who use institutional LTSS are ages 65 and older.

Over Half of Medicaid Enrollees Who Use LTSS Are Under 65, Including Two-Thirds of Those Using HCBS and One-Third of Those Using Institutional LTSS

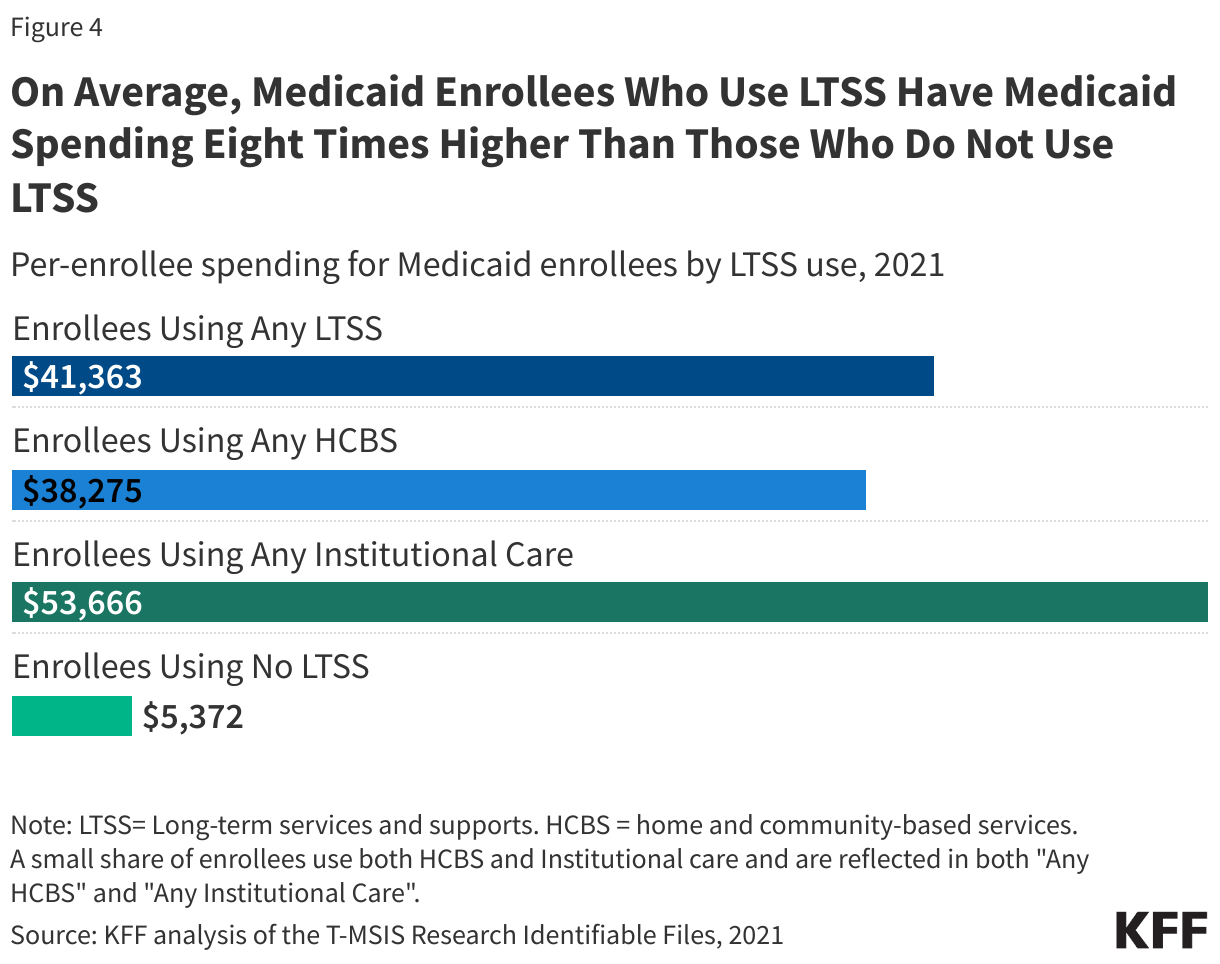
4. On average, Medicaid enrollees who use LTSS have Medicaid spending eight times higher than those who do not use LTSS.

In 2021, Medicaid per person spending was substantially higher for enrollees who used institutional care ($53,666), than for enrollees who used HCBS ($38,275), which was about 8-times greater than average Medicaid spending for enrollees who did not use any LTSS ($5,372) (Figure 4). Per-enrollee spending for those who don’t use any LTSS includes children who comprise 40% of Medicaid enrollees and tend to have much lower per-person spending. Children who use LTSS have spending ten times higher than children who don’t use LTSS ($30,933 versus $3,300). People who used Medicaid LTSS comprised 6% of Medicaid enrollment but 34% of federal and state Medicaid spending which includes the costs of LTSS, managed care premiums, and other services such as hospital care and prescription drugs. (It is not possible to say what share of Medicaid spending pays for LTSS because total spending includes payments to managed care plans, and the split of managed care payments by type of care is unknown). In 2021, Medicaid spending for the 5.7 million enrollees who used Medicaid LTSS, totaled nearly $234 billion. High per-person Medicaid spending among enrollees who use LTSS likely reflects the generally high cost of LTSS and more extensive health needs among such groups that lead to higher use of other health care services and drugs as well.

On Average, Medicaid Enrollees Who Use LTSS Have Medicaid Spending Eight Times Higher Than Those Who Do Not Use LTSS

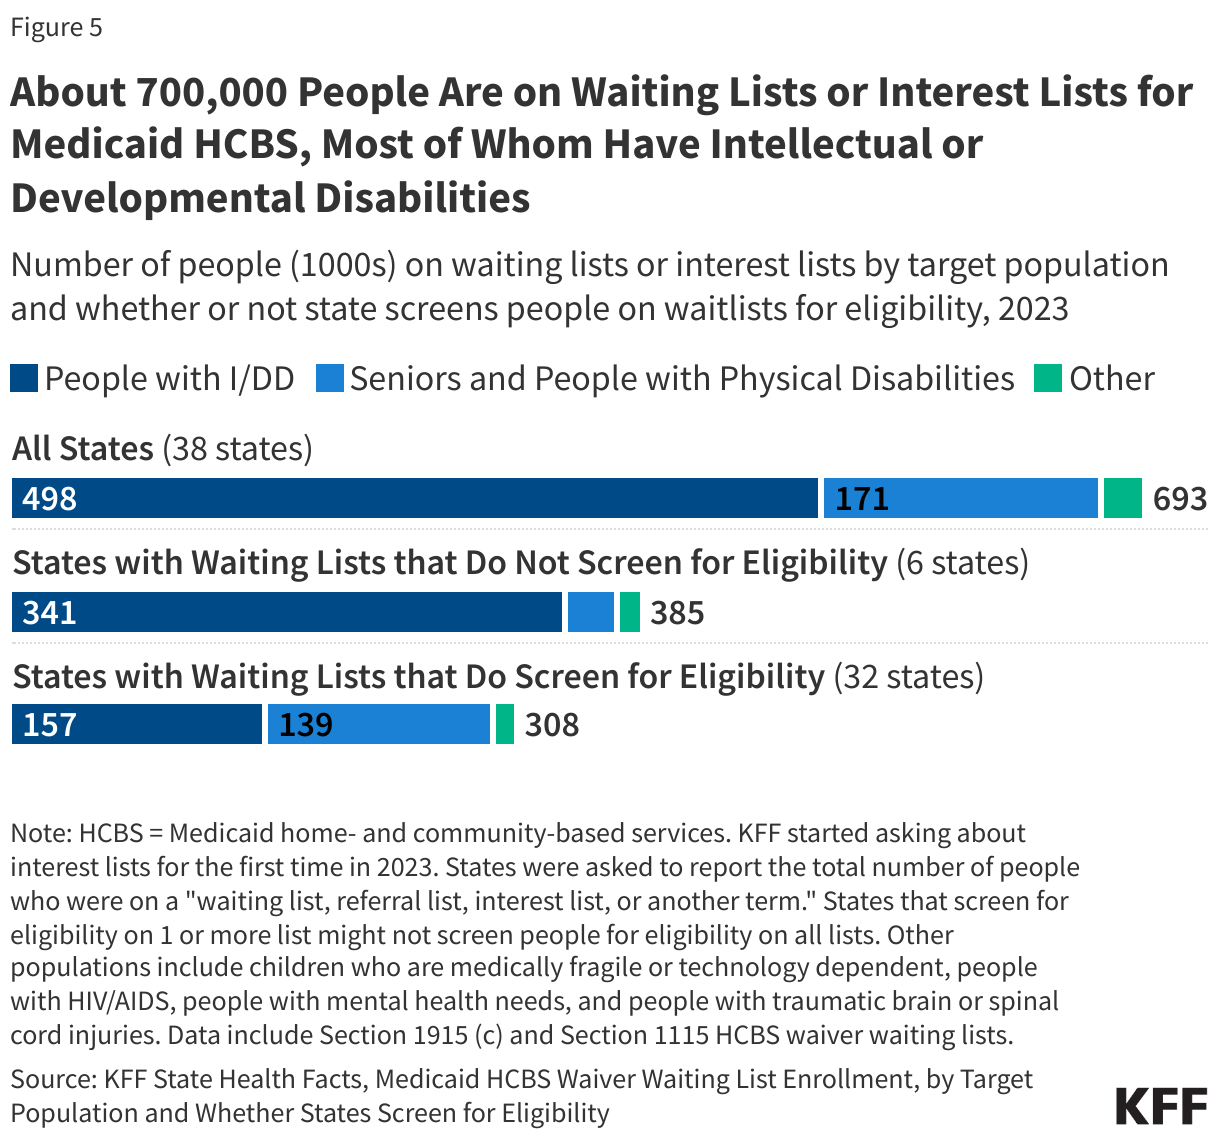
5. About 700,000 people are on waiting lists or interest lists for Medicaid HCBS, most of whom have intellectual or developmental disabilities.

Home- and community-based services (HCBS) waivers allow states to offer a wide range of benefits and to choose—and limit—the number of people who receive services. The only HCBS that states are required to cover is home health, but states may choose to cover personal care and other services such as private duty nursing through the Medicaid state plan. Benefits offered through a state plan are generally available to all Medicaid enrollees who need them. States may also use HCBS waivers to offer expanded personal care benefits or to provide additional services such as adult day care, supported employment, and non-medical transportation, though they can limit the number of people who receive these services. States’ ability to cap the number of people enrolled in HCBS waivers can result in waiting lists when the number of people seeking services exceeds the number of waiver slots available. Waiting lists reflect the populations a state chooses to serve, the services it decides to provide, the resources it commits, and the availability of workers to provide services. A new rule on Medicaid access will require states to start reporting the number of people on certain types of Medicaid waivers known as “1915(c)” in 2027.

In 2023, a 50-state survey of Medicaid HCBS programs found that there were over 692,000 people on waiting lists or interest lists, and most people on waiting lists have intellectual or developmental disabilities (I/DD), particularly in states that do not screen for waiver eligibility before placing someone on a waiting list (Figure 5). People with I/DD comprise 88% of waiting lists in states that do not screen for waiver eligibility, compared with 51% in states that do determine waiver eligibility before placing someone on a waiting list. People with I/DD comprise almost three-quarters (72%) of the total waiver waiting list population. Seniors and adults with physical disabilities account for one-quarter (25%), while the remaining share (3%) includes children who are medically fragile or technology dependent, people with traumatic brain or spinal cord injuries, people with mental illness, and people with HIV/AIDS. People who are on HCBS waiting lists are generally not representative of the Medicaid population or the population that uses HCBS. Most people on waiting lists have I/DD, but KFF analysis shows that people with I/DD comprise fewer than half of the people served through 1915(c) waivers (the largest source of Medicaid HCBS spending).

About 700,000 People Are on Waiting Lists or Interest Lists for Medicaid HCBS, Most of Whom Have Intellectual or Developmental Disabilities

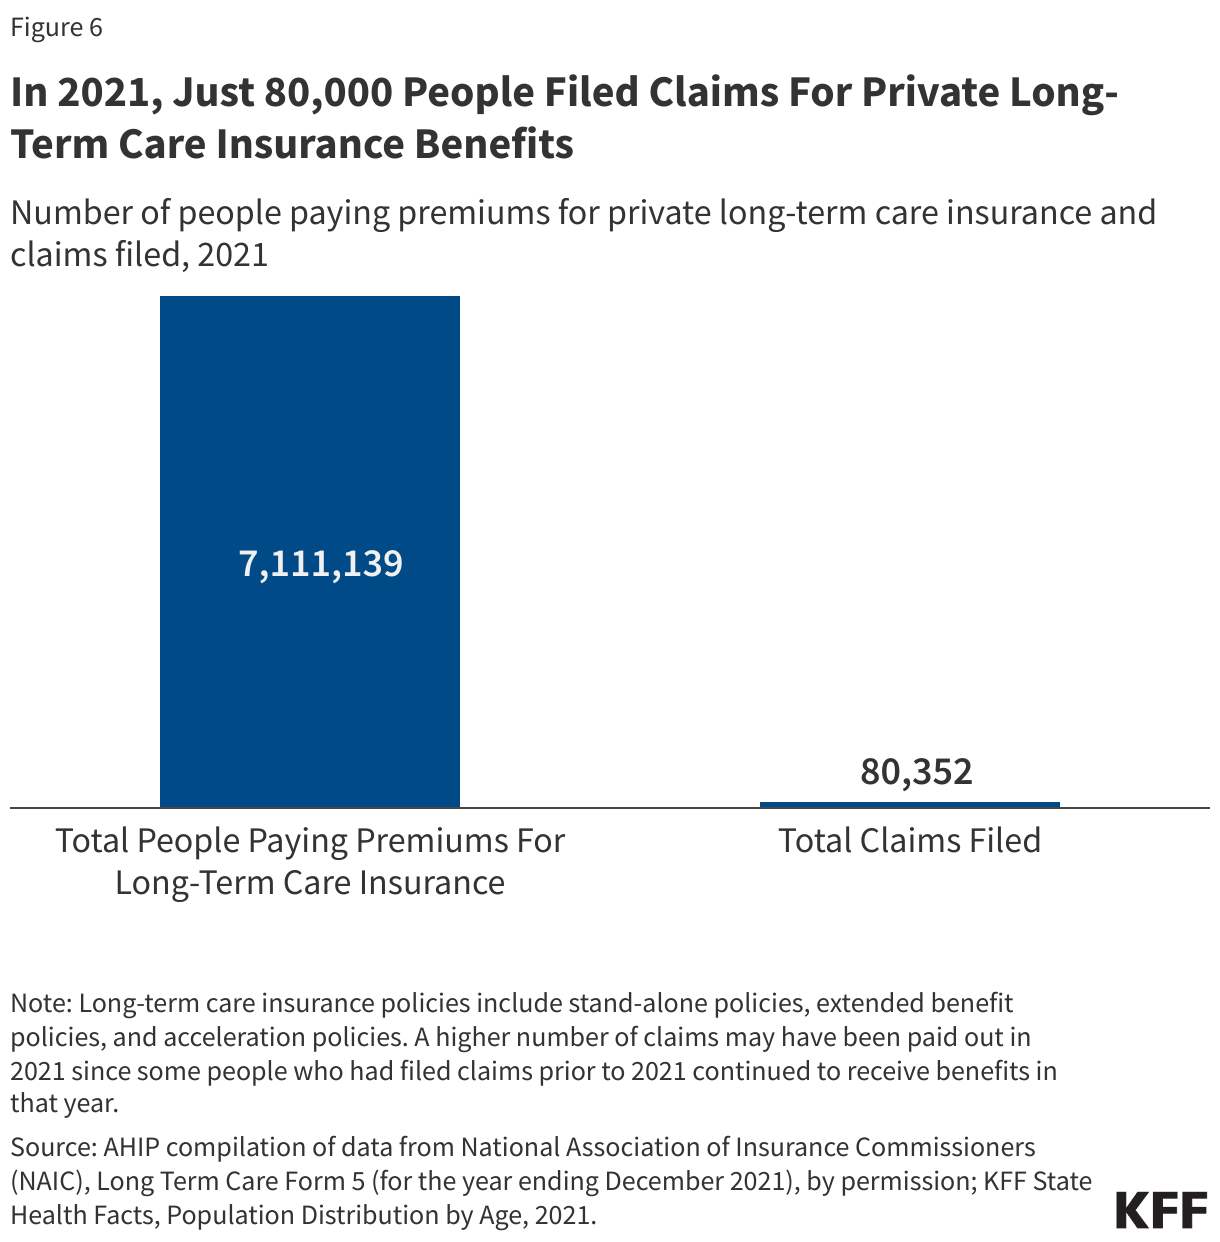
6. In 2021, just 80,000 people filed claims for private long-term care insurance benefits.

In 2021, about 7.1 million people nationwide paid premiums for private long-term care insurance (LTCI), including standalone LTCI and also an array of products that pair life insurance or an annuity with some long-term care coverage (Figure 6). The age and other demographics of those people are unknown. In 2021, premiums for LTCI averaged $1,860 for the year. While those premiums may sound low relative to private health insurance premiums or to the costs of LTSS, LTCI is purchased before a person develops a need for LTSS and most people pay premiums for many years without using any benefits. That is one of the reasons that only around 80,000 people filed a claim for LTCI benefits in 2021. (Some people who had filed claims prior to 2021 continued to receive benefits in that year. In total, 1.5 million people have filed claims for LTCI benefits since companies started selling LTCI polices.) It is not uncommon for people to die without using benefits or to let their coverage lapse in response to rising premiums (or other factors) before they qualify for the benefits. Those are some of the motivating factors for products that mingle life insurance with LTCI, although in 2021, most of the people with LTCI still had standalone policies (6.3 million).

Unlike private health insurance, it is fairly uncommon for employers to offer and/or subsidize LTCI for their employees. A KFF survey showed that among firms offering health benefits in 2023, 25% offered LTCI and among those, only 39% contributed to the costs of coverage. There are a number of limitations of LTCI. Many policies don’t have inflation protection, limit eligibility for services, do not cover all expenses, and have lifetime limits. Some LTCI policies also don’t offer non-forfeiture benefits, meaning people who pay premiums for years may not get the premiums they have paid back if they let their policy lapse in the event of nonpayment (which may happen due to increased premiums after a rate increase). These unused premium payments can be especially considerable for people who sign up when relatively young. Insurers could also go out of business before coverage is needed.

In 2021, Private Long-Term Care Insurance Paid Out Just 80,000 Claims

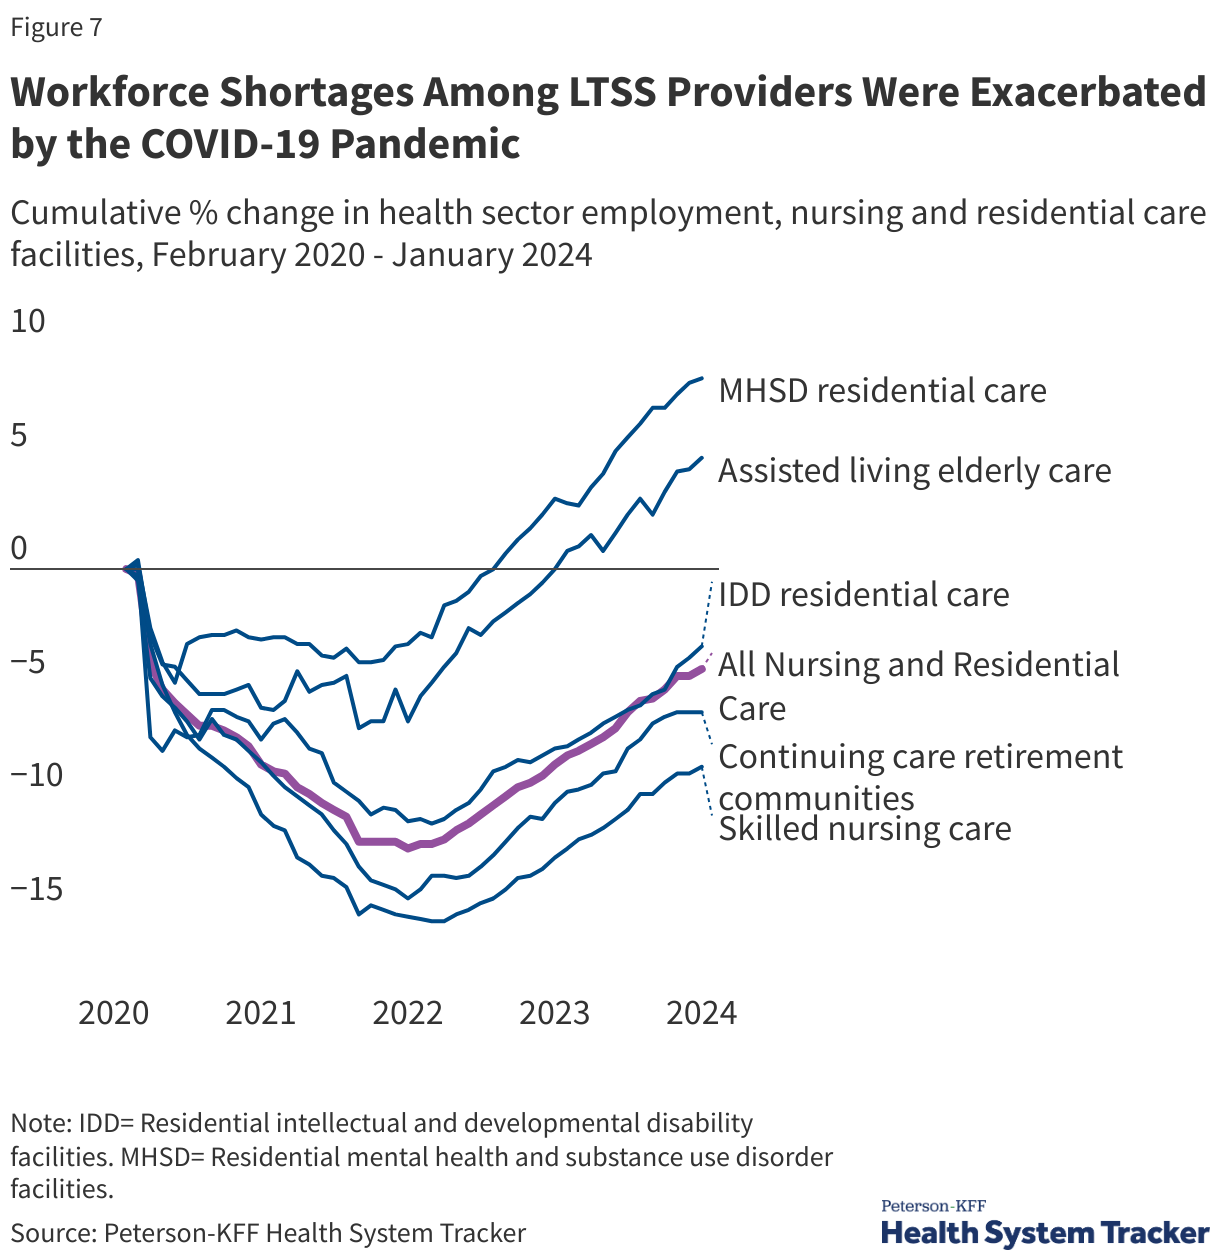
7. Longstanding workforce shortages among LTSS providers were exacerbated by the COVID-19 pandemic.

The pandemic greatly exacerbated longstanding shortages of LTSS workers. Employment levels in all health care jobs dropped sharply at the start of the pandemic, but for most health care sectors, including hospitals, employment started to rebound as early as spring 2020. However, employment in the LTSS sectors continued to fall well into 2021 and for nursing facilities, into the beginning of 2022. Recent analysis on the Peterson-KFF Health System Tracker shows that the number of workers in the LTSS sector (all nursing and residential care in Figure 7) was 4% lower in January 2024 than in February 2020. The reduction in workers is largest in the skilled nursing care settings, where the workforce remains 9% lower than in February 2020. Additionally, a 50-state survey of Medicaid HCBS programs found that all states reported shortages of HCBS workers, most frequently among direct support professionals, personal care attendants, nursing staff, and home health aides. Most states (43) also reported permanent closures of HCBS providers within the last year, with some closures reflecting provider shortages. These jobs are mentally and physically demanding, and direct care workers generally agree that the wages are low and do not reflect the demands of the work.

Beyond the formally paid workforce, there are also millions of family caregivers (most of whom are unpaid) who play an important role in filling care needs for older adults and people with disabilities. In 2021, about 38 million family caregivers provided, on average, 18 hours of care per week. Family caregivers deal with high levels of stress, often juggling work and school on top of their caregiving, as well as struggle with consequences of lost income including housing and food insecurity. Families may provide care out of love or a sense of responsibility, but many provide care because they can’t access paid care or are providing more care than they feel able to give based on their training and other life responsibilities.

Workforce Shortages Among LTSS Providers Were Exacerbated by the COVID-19 Pandemic

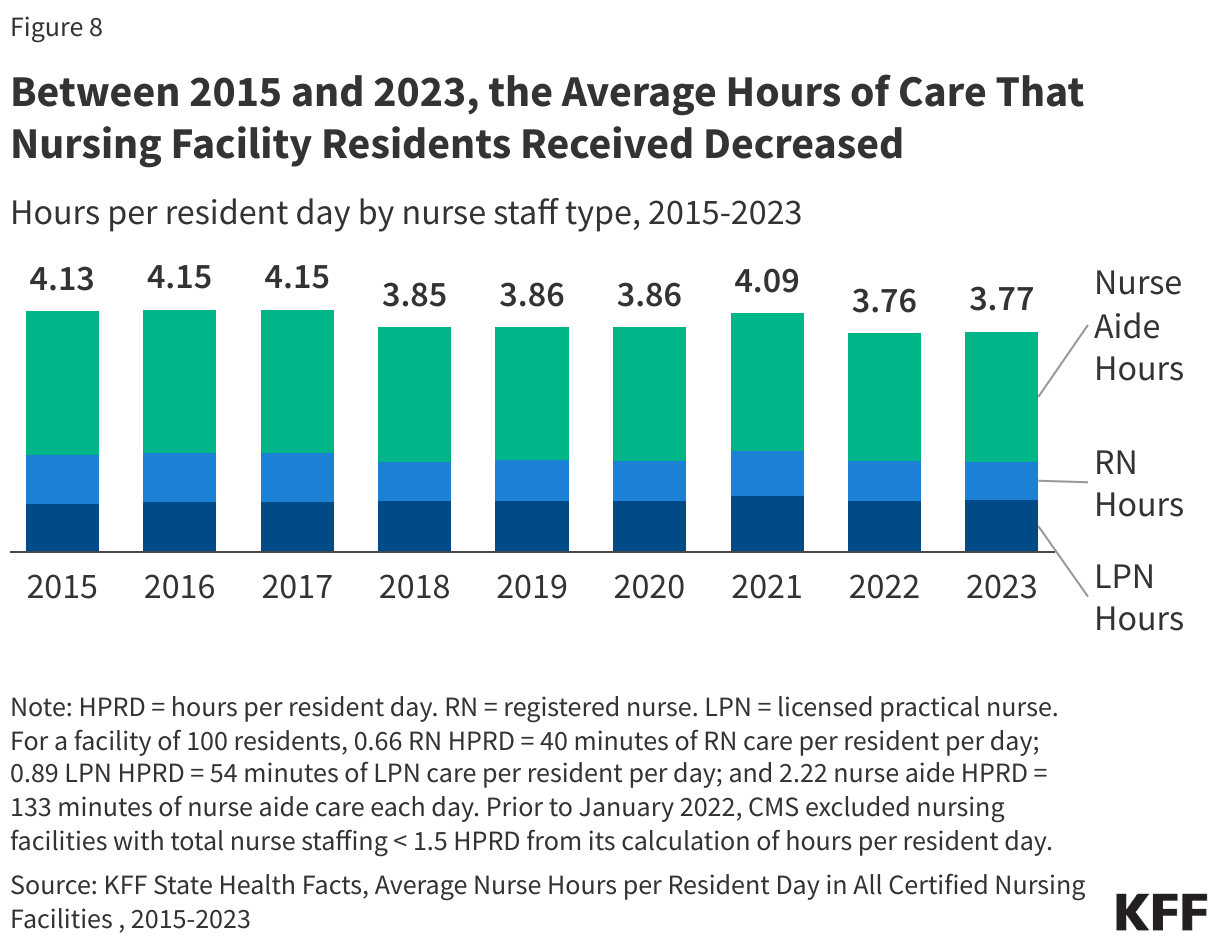
8. Between 2015 and 2023, the average hours of care that nursing facility residents received decreased.

The adequacy of staffing in nursing homes has been a longstanding issue, and the high mortality rate in nursing facilities during the COVID-19 pandemic highlighted and intensified the consequences of inadequate staffing levels. Between July 2015 and July 2023, the average hours of care that nursing facility residents received declined by 9%, from 4.13 hours to 3.77 hours (Figure 8). The decline occurred over the entire period but the number of hours of care per resident increased briefly in the year 2021. The relatively higher staffing hours in 2021 reflected the fact that the number of residents declined more quickly than the number of staff hours did between 2020 and 2021. Both the average number of deficiencies and the share of facilities with serious deficiencies increased over the same time period, which may in part reflect lower staffing levels.

On April 22, 2024, the Centers for Medicare and Medicaid Services (CMS) released a highly-anticipated final rule that created new requirements for nurse staffing levels in nursing facilities. The final rule requires facilities to have at least 3.48 hours of nursing care per resident per day starting in 2026 for urban facilities and in 2027 for rural facilities. In later years (2027 for urban facilities and 2029 for rural facilities), 0.55 of those hours must be provided by a registered nurse and 2.45 hours from a nurse aide. The remaining 0.48 hours may be provided by any nurse staff type, including LPNs. The rule also requires facilities to have a registered nurse on staff 24 hours per day, 7 days per week; strengthens staffing assessment and enforcement strategies; creates new reporting requirements regarding Medicaid payments for institutional long-term services and supports (LTSS); and provides $75 million for training for nurse aides. KFF estimates that only 19% of nursing facilities would currently meet the three staffing hour minimums required in the final rule if it took effect immediately (3.48 hours overall, 0.55 RN hours, and 2.45 nurse aide hours).

Between 2015 and 2023, the Average Hours of Care That Nursing Facility Residents Received Decreased

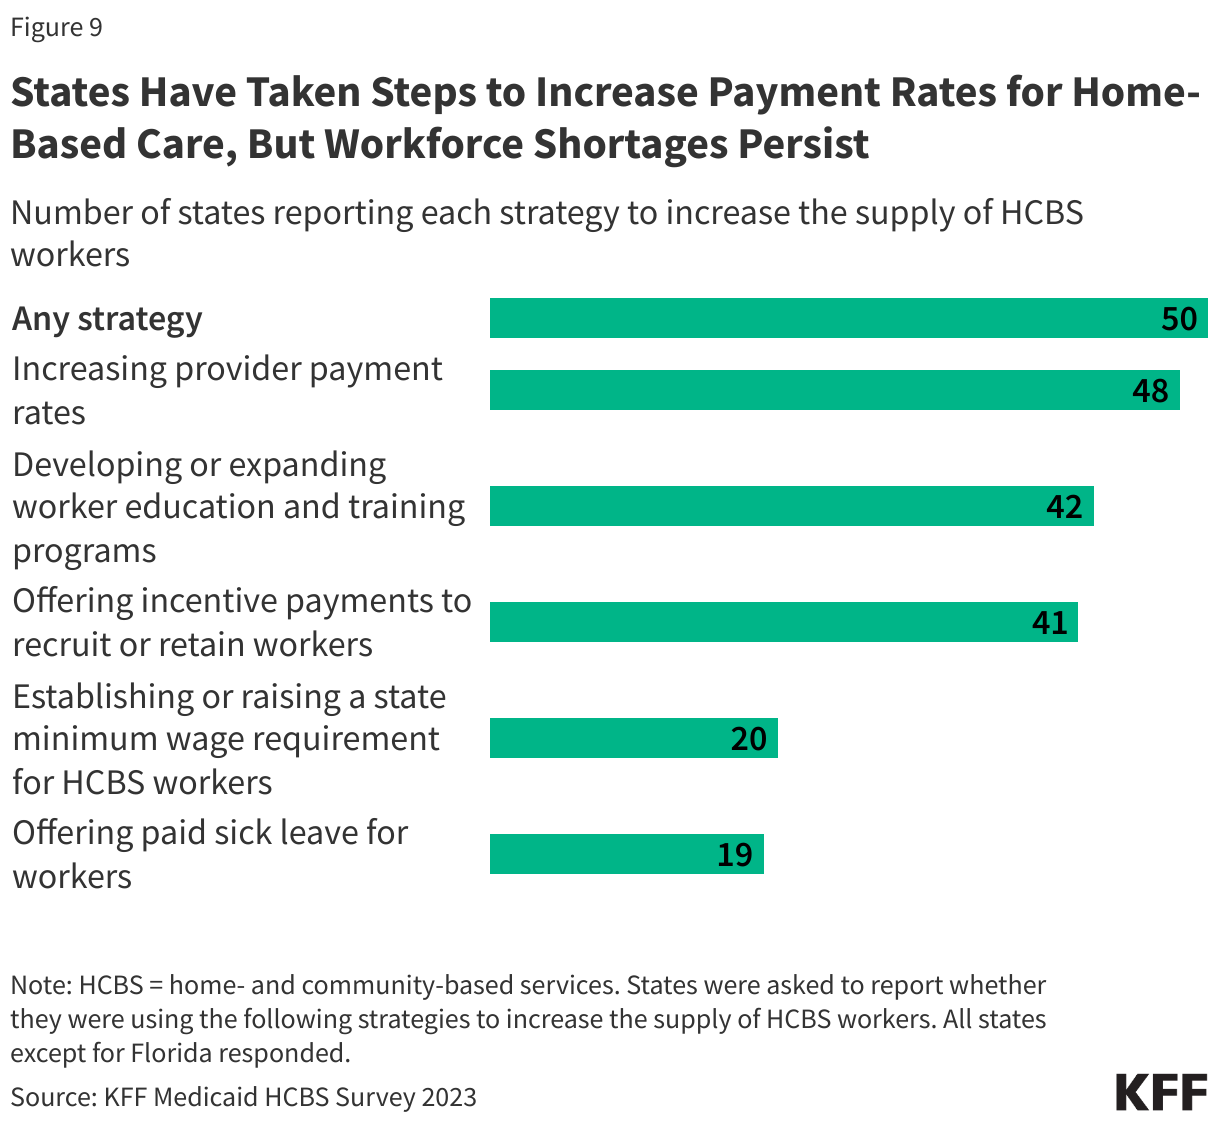
9. States have taken steps to increase payment rates for home-based care, but workforce shortages persist.

In KFF’s survey of states’ HCBS programs, all responding states reported taking actions to address workforce shortages (Figure 9). The most common strategy reported was increasing payment rates to HCBS providers (48 states). However, even with the higher payment rates, among the states that were able to report time-based payment rates for personal care providers, most pay under $20 per hour. Some states implemented a permanent payment rate increase, but other states reported that payment rate increases for at least some of the workers were temporary. Other strategies reported include developing or expanding worker education and training programs (42 states) and offering incentive payments to recruit or retain workers (41 states). Less common strategies included establishing or raising the state minimum wage (20 states) and offering paid sick leave for workers (19 states). States also reported several other types of initiatives to strengthen the workforce, including creating platforms or support systems to connect job seekers with employers and positions, launching a social media campaign, and providing outreach to prospective employees. In another survey of states, most states reported increasing payment rates for nursing facilities and HCBS in 2023 and 2024.

Beyond state efforts, the Biden Administration has also taken steps to increase payment rates for the direct care workforce. A final rule on access to Medicaid services would require states to demonstrate that HCBS payment rates are adequate to ensure a sufficient direct care workforce and that at least 80% of total payments for specified HCBS are compensation to direct care workers. In a parallel vein, the final nursing facility staffing rule will require state Medicaid agencies to report the percent of Medicaid payments for institutional long-term services and supports (LTSS) that are spent on compensation for direct care workers and support staff.

States Have Taken Steps to Increase Payment Rates for Home-Based Care, But Workforce Shortages Persist

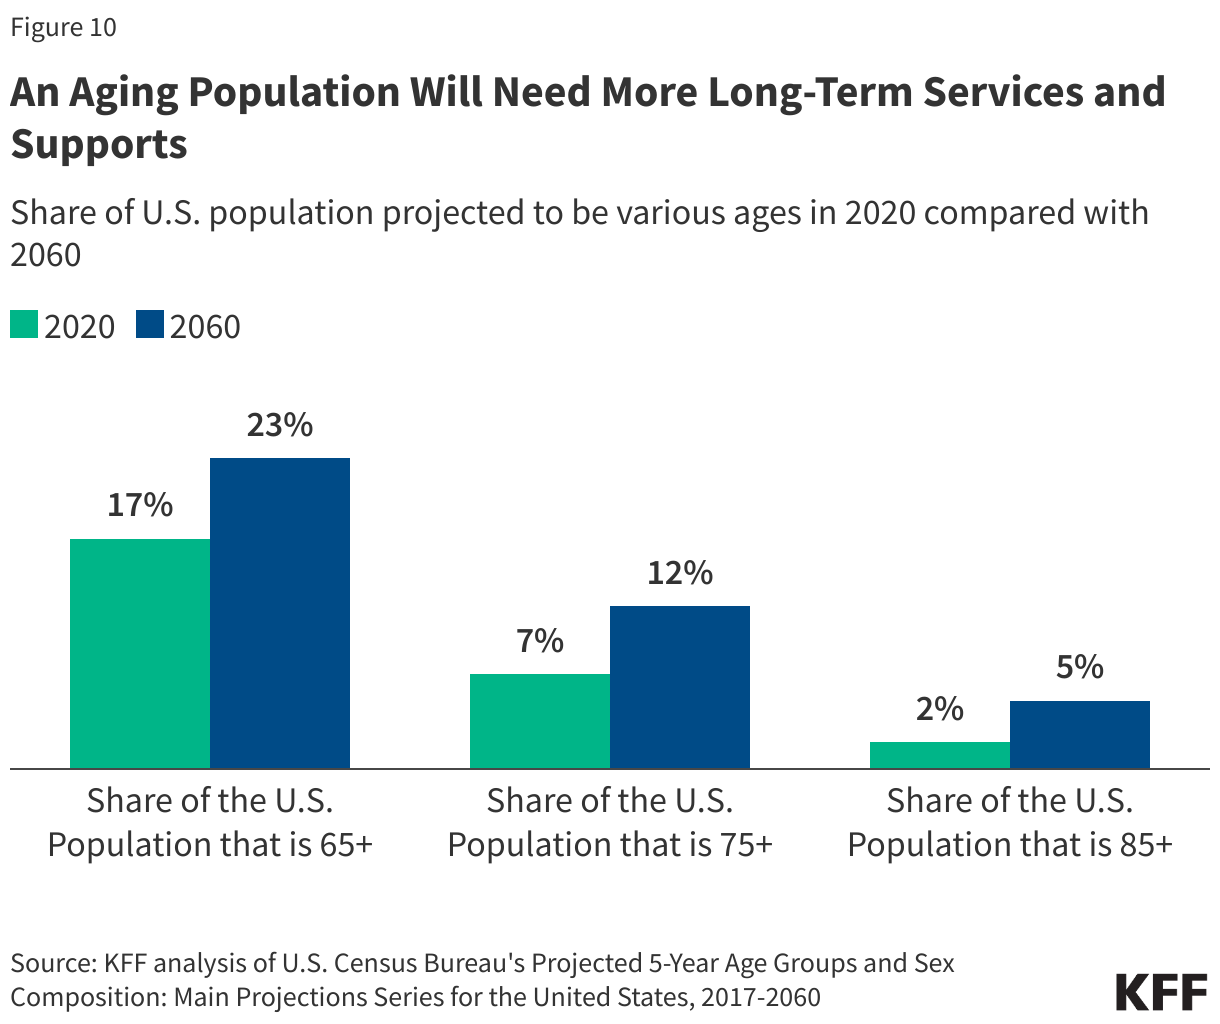
10. An aging population will need more long-term services and supports.

A KFF interactive on the aging population shows that the percent of the United States population that is ages 65 and older is projected to grow from 17% in 2020 (56 million people) to nearly 25% in 2060 (95 million people) (Figure 10). During this period, the share of older adults who are in their 80s, 90s, and older will also grow. One in twenty of all people in the U.S. is projected to be 85 or older by 2060, a group that is likely to have the highest rates of LTSS needs and utilization as a quarter of them are frail. Advances in assistive and medical technology that allow people with disabilities to be more independent and to live longer, together with the aging of the baby boomers, will likely result in increased need for LTSS over the coming decades. An HHS report found that after age 65, over half of people would at some point need help with at least two activities of daily living, over half would use any type of paid LTSS, and over one-third would use some nursing home care. Expected rates of LTSS need and use are highest among people with lifetime earnings in the bottom income quintile, who have the fewest resources to pay for such care. Other research shows that among people ages 65 and older, those who are Black or Hispanic are much more likely to develop a moderate or severe LTSS than those who are White and have substantially lower financial resources to pay for LTSS. Racial and economic disparities among individuals experiencing LTSS needs may also have long-term intergenerational effects that can disproportionately affect people of color. The aging of the population raises difficult questions about how to address the challenges of coverage, affordability, financing, and workforce shortages to meet the needs of a growing population in need of LTSS.

An Aging Population Will Need More Long-Term Services and Supports
Poll Finding

Polling Insight: 4 Takeaways About Black Women Voters in the 2024 Election

Published: Jul 3, 2024

For decades, Black women have consistently been a reliable voting base for the Democratic Party, and in recent elections Democrats have garnered support from large majorities of Black women.1  However, the KFF Survey of Women Voters shows that many Black women do not feel either political party is looking out for their interests, and express dissatisfaction with their candidate options. Black women experienced disproportionate economic setbacks during the pandemic, with their unemployment rate outpacing that of men and women of other racial and ethnic groups. While pandemic-related unemployment has receded, rising inflation rates have created a scenario in which many families across the country struggle to afford basic household expenses, and Black women are more likely than White or Hispanic women to cite these struggles. This poll shows that, while Black women still largely support President Biden in 2024, some of his previous supporters say they don’t plan to vote for him this fall. Among Black women voters, one quarter of those who voted for Joe Biden in 2020 now say they either plan to vote for Trump in 2024 (8%) or say they will not vote (14%). This analysis highlights the deciding factors and motivations for Black women fewer than six months before the 2024 election.

The analysis presented below is from a multi-mode probability based survey of women voters from state-level voter files, fielded May 23-June 5, 2024. The KFF Survey of Women Voters Dashboard includes more data from the survey, as well as the topline and full methodological details.

#1: Black Women Continue to Identify with the Democratic Party, Though Some Say Neither Party Does a Better Job Looking Out for People Like Them

Black women voters largely identify as Democrats (67%) or lean toward the Democratic Party (10%) and a majority say that the Democratic Party does a better job than the Republican Party looking out for people like them (56%), but about one in three Black women (35%) say neither party looks out for people like them. Fewer Black women voters identify as Republicans (7%) or say that the Republican Party does a better job looking out for their interests (8%).

About One-Third of Black Women Voters Say Neither Political Party Does a Better Job Looking Out for People Like Them

#2: Inflation Is the Most Important Issue for Black Women Voters, and Most Disapprove of Biden’s Handling of It

About half of Black women voters say that inflation, including the rising cost of household expenses (53%) is the most important issue determining their vote in the 2024 presidential race. Ranking far behind this issue are threats to democracy (18%), abortion (12%) and gun policy (6%). Families across the U.S. have been hit hard by the rising cost of household expenses, and Black women voters especially report worrying about affording basic household items for themselves and their families, with about half or more saying they worry “a lot” about affording food (59%), utilities (53%), health care (51%), and housing costs (48%).

At Least Half of Black Women Voters Say They Worry "A Lot" About Affording Groceries, Utilities, and Health Care

Reflecting on the past two presidencies, about one in four Black women voters say they have been better off financially while President Biden is in office (27%) and a similar share say they were better off under President Trump (22%). Half (50%) of Black women voters say which president is in office has made no difference in their financial situation.

Half of Black women say, regardless of who they intend to vote for, the Democratic Party does a better job addressing the cost of household expenses (51%), while few (8%) say the Republican Party does a better job, and four in ten (41%) say neither party does a better job. However, assessing Biden’s handling of the issue of inflation, a majority (55%) of Democratic Black women voters disapprove, including one in four (25%) who say they disapprove “strongly.” By contrast, majorities of Democratic Black women voters approve of Biden’s handling of most other issues, including immigration, abortion and reproductive health care, student loan repayment, and the affordability of health care.

Majorities of Democratic Black Women Voters Approve of Biden's Handling of Most Issues, Majorities Disapprove of His Handling of Inflation and U.S. Involvement in the Israel-Hamas War

#3: Black Women Voters Say Candidates’ Personal Qualities Are More Important than Issues to their 2024 Vote

When deciding who to vote for this fall, Black women voters put a lot of emphasis on the candidates’ personal characteristics and experience. Two-thirds (64%) of Black women voters nationally say a candidates’ personal characteristics, including their leadership ability, character, values, and experience will make the biggest difference to their vote, more than twice the share who say the candidates’ stance on the issues matters most (29%). Reflecting on one of these personal characteristics, a majority of Black women voters say that President Biden respects women generally (57%) and the women he interacts with “a lot” (61%). Very few (4% and 2% respectively) say the same of former President Trump, while majorities say Trump respects women “not at all.”

Black Women Voters Overwhelmingly Say Joe Biden Respects Women He Interacts With and Women Generally, Few Say the Same of Donald Trump

Partisanship may play a larger role in some state specific contexts. Along with the national poll of women voters, the KFF Survey of Women Voters included a representative sample of women voters in Michigan, a key battleground state. While just 6% of Black women nationally say that the candidates’ political party will make the biggest difference to their 2024 vote, this rises to one in five Black women voters in Michigan. On par with Black women nationally, Black women voters in Michigan give the Democratic Party the edge on their assessment of which political party does a better job looking out for people like them, the interests of women, addressing the cost of health care and the cost of household expenses.

#4: Young Black Women Are Less Likely to Say They Will Vote in This Election Than Older Black Women; Many Say Their Dissatisfaction Is Due to Unfulfilled Promises

Similar majorities of Black women across age say they are dissatisfied with their options for president, but views of the candidates may be impacting younger Black women’s decision to turn out more than older Black women. About three in four Black women ages 50 and older (77%) say they are “absolutely certain” to vote. Fewer Black women under age 50 say they are certain to vote (49%), while one-third say there is a 50-50 chance (32%). Seven percent of Black women ages 18 to 49 say they probably or certainly will not vote in November.

This age difference among Black women reflects a broader pattern among women voters who identify as Democrats. Overall, younger Democratic women voters are more likely than their older counterparts to say they disapprove of the president’s handling of issues and are less likely to say they plan to vote.

About Three in Four Black Women Voters Ages 50 and Older Say They Will Certainly Vote in November; Fewer Younger Black Women Say the Same

When asked why they are not satisfied with President Biden as the Democratic nominee for president, many Democratic Black women voters cite answers related to Biden’s age and ability to act as president, and cite unfulfilled campaign promises of the Biden administration.

What is the main reason why you aren’t satisfied with Joe Biden as the Democratic nominee for president?

“President Biden is not in sync with the overwhelming majority of the country on issues that directly affect economic security, housing, over policing, women’s right to health autonomy and international relations that directly influence the safety of non-white identifying Americans.” – 47-year-old Black woman voter, Democratic-leaning independent, California

“Promises he made fell to wayside, feels like too little too late from him.” – 38-year-old Black woman, Democrat, Georgia

“Concerned about longevity. I feel like a younger Democratic candidate could fight for more and harder for our community.” – 28-year-old Black woman, Democrat, New York

“I realize that at his age, he is not the aggressive VP he once was. I don’t think he is as sharp as he will need to be.” – 66-year-old Black woman, Democrat, Illinois

With pollsters forecasting a close presidential election, even slight advantages could tip the electoral balance in favor of either candidate. Black women voters have long been a strong base to the Democratic Party, and this poll finds their continued support for the party. However, if Black women do not feel adequately represented by the current leadership of the Democratic Party, including on issues most salient to them, they may not vote for Joe Biden in the fall. Young Black women are especially frustrated and dissatisfied with the current administration, which may tip the scales in favor of a Trump presidency.

  1. 94% of Black women voters voted for Hilary Clinton in the 2016 Presidential Election; 96% of Black women voted for Barack Obama in 2008 and 2012; 90% of Black women voted for Joe Biden in 2020. ↩︎

Key Facts About Medicare Part D Enrollment, Premiums, and Cost Sharing in 2024

Authors: Juliette Cubanski and Anthony Damico
Published: Jul 2, 2024

The Medicare Part D program provides an outpatient prescription drug benefit to more than 50 million older adults and people with long-term disabilities in Medicare who enroll in private plans, including stand-alone prescription drug plans (PDPs) to supplement traditional Medicare and Medicare Advantage prescription drug plans (MA-PDs) that include drug coverage and other Medicare-covered benefits. This brief analyzes Medicare Part D enrollment and costs in 2024 and trends over time, based on data from the Centers for Medicare & Medicaid Services (CMS).

This analysis highlights the continuing growth of Medicare Advantage drug plans as a source of Part D drug coverage, with enrollment overall concentrated in a handful of large plan sponsors. Average premiums for drug coverage are much lower in MA-PDs than in stand-alone PDPs, mainly because most MA-PD enrollees are in zero-premium plans, which is in turn related to the ability of Medicare Advantage plan sponsors to use rebates to buy down the Part D premium. Median cost-sharing amounts for drugs covered on some formulary tiers are the same or similar in PDPs and MA-PDs, but PDP enrollees are more likely than MA-PD enrollees to face coinsurance for preferred brands and non-preferred drugs, while MA-PD enrollees face higher median coinsurance for specialty tier drugs.

These trends in Medicare Part D drug coverage and the costs that people with Medicare pay for drug plans and for their prescriptions are worth watching as provisions of the Inflation Reduction Act to improve the Part D benefit roll out, including a $35 insulin copay cap and a new out-of-pocket drug spending cap (set at $2,000 in 2025). Such changes will help to lower out-of-pocket costs for Part D enrollees but could also make it harder for some Part D plan sponsors to offer low-priced coverage, particularly sponsors of stand-alone drug plans. This could mean fewer affordable PDP plan choices for Medicare beneficiaries in traditional Medicare and further tilt Medicare enrollment towards Medicare Advantage, which has broader implications for Medicare program spending.

Medicare Advantage drug plans continue to attract more enrollees compared to stand-alone drug plans

Well over half (57%) of Part D enrollees in 2024 are in Medicare Advantage drug plans, continuing a trend of increasing enrollment in Medicare Advantage plans and declining or relatively static enrollment in stand-alone prescription drug plans (Figure 1).

More Medicare Part D Enrollees Are in Medicare Advantage Drug Plans Than in Stand-alone Prescription Drug Plans

Low-Income Subsidy enrollment is tilted even more towards Medicare Advantage drug plans than overall Part D enrollment

Two-thirds of LIS enrollees – 9 million out of 13.7 million – are enrolled in Medicare Advantage drug plans in 2024 (Figure 2). Nearly 6 million LIS enrollees are in Medicare Advantage Special Needs Plans (SNPs), nearly all of which (95%) are in plans designed specifically for dual-eligible individuals (Table 1). On average, LIS enrollees can choose from substantially more MA-PDs than PDPs in their area that have drug premiums below the regional low-income subsidy premium benchmark amount – 15 MA-PDs versus 3 PDPs – meaning they can enroll in these plans for zero premium.

Two-Thirds of Beneficiaries Receiving the Part D Low-Income Subsidy Are Enrolled in Medicare Advantage Drug Plans

The top 5 firms cover more than three-fourths of Part D enrollees in 2024

Part D enrollment is concentrated in a handful of top plan sponsors, with 5 firms covering 77% of all Part D enrollees in 2024, or 40.1 million out of 53.1 million enrollees (Figure 3). Nearly 1 in 4 enrollees (12.4 million) are in Part D plans sponsored by UnitedHealth, including both stand-alone PDPs and MA-PDs. CVS, Humana, and Centene each have around 15% of the Part D market, with enrollees in both types of Part D plans.

The Top 5 Firms Cover More than Three-Fourths of Part D Enrollees in 2024

Enrollment among beneficiaries without low-income subsidies declined in 11 of the 14 national PDPs in 2024

Most of the national PDPs available in 2024 lost enrollment among beneficiaries without low-income subsidies (Figure 4). Only Wellcare Value Script saw substantial enrollment gains among enrollees without LIS – from 2.6 million to 3.7 million – likely due to having a median monthly premium of less than $1, substantially lower than all other national PDPs.

11 of the 14 National PDPs Lost Enrollees Without Low-Income Subsidies in 2024

The average monthly premium for Part D coverage is nearly 5 times larger for PDPs than for MA-PDs

On average, PDP enrollees pay substantially more each month for their Part D drug coverage than enrollees in Medicare Advantage drug plans. The average monthly PDP premium is $43, nearly 5 times higher than the $9 average monthly premium for drug coverage in MA-PDs (weighted by enrollment) (Figure 5; Table 2). (The total average premium for MA-PDs, including all Medicare-covered benefits, is $14 per month in 2024.)

The difference between average monthly premiums for drug coverage offered by PDPs and MA-PDs has been growing larger, with the PDP average rising and the MA-PD average falling. The average premium for drug coverage in MA-PDs is heavily weighted by zero-premium plans because MA-PD sponsors can use rebate dollars from Medicare payments to lower or eliminate their Part D premiums. Rebates to Medicare Advantage plans have more than doubled since 2018 and now exceed $2,000 per year per beneficiary.

The $43 weighted average PDP premium, based on current enrollment after the end of the open enrollment season for 2024, is lower than the estimated $48 monthly PDP premium for 2024, which was based on enrollment in June 2023 and did not account for plan switching by current enrollees or plan choices by new enrollees during the open enrollment period. Taking into account plan switching and new enrollment into lower premium plans resulted in the lower enrollment-weighted average monthly premium for 2024. Rather than an estimated increase of 21% over the 2023 average premium (from $40 to $48), the actual increase is 5% (from $40 to $43).

The Average Monthly Premium for Part D Drug Coverage is Nearly 5 Times Larger for Stand-Alone Drug Plans Than for Medicare Advantage Drug Plans in 2024

Most Medicare Advantage drug plan enrollees pay no premium for their drug coverage, while more than half of PDP enrollees pay $30 per month or more

Three-fourths of MA-PD enrollees without low-income subsidies pay no monthly premium for Part D coverage in 2024, while more than half of PDP enrollees without LIS (56%) pay $30 or more – including 1 in 7 PDP enrollees without the LIS who pay at least $100 per month for their Part D plan (Figure 6). For 2024, all Medicare beneficiaries had access to zero-premium MA-PD plans – 27 on average – whereas only 1 PDP was available for zero premium for non-LIS enrollees in only 14 out of 34 PDP regions.

Three-Fourths of MA-PD Enrollees Pay No Monthly Premium for Part D Coverage, While More Than Half of PDP Enrollees Pay $30 or More

PDP enrollees are more likely than MA-PD enrollees to face coinsurance for preferred brands and non-preferred drugs, while MA-PD enrollees face higher median coinsurance for specialty tier drugs

As in previous years, Part D enrollees face low copayments for generic drugs and higher cost-sharing amounts for preferred brands, non-preferred drugs, and specialty drugs, regardless of whether they are in PDPs or MA-PDs (Figure 7). Median cost-sharing amounts for drugs covered on some formulary tiers are the same or similar in PDPs and MA-PDs, but PDP enrollees are much more likely than MA-PD enrollees to pay coinsurance, or a percentage of a drug’s price, for preferred brands and non-preferred drugs. Whereas nearly all MA-PD enrollees face a median copay of $47 for preferred brands, most PDP enrollees face median coinsurance of 22%; for non-preferred drugs, MA-PD enrollees face a median copay of $100 while PDP enrollees face coinsurance of 47%.

Median coinsurance for specialty tier drugs (those that cost over $950 in 2024) is higher for MA-PD enrollees than PDP enrollees – 33% vs. 25%. Plans that waive some or all of the standard deductible – which is the case for most MA-PDs – are permitted to set the specialty tier coinsurance rate above 25%.

These cost-sharing amounts apply when beneficiaries fill prescriptions in the initial coverage phase of the Part D benefit. As of 2024, through a provision in the Inflation Reduction Act, beneficiaries no longer face cost sharing in the catastrophic coverage phase of the Part D benefit, which translates to a cap of about $3,300 out of pocket for brand-name drugs. In 2025, Medicare beneficiaries will pay no more than $2,000 out of pocket for prescription drugs covered under Part D.

Part D Enrollees Face Similar Cost-Sharing Amounts for Some Covered Drugs in PDPs and MA-PDs in 2024, But a Larger Share of PDP Enrollees Face Coinsurance for Preferred Brands and Non-Preferred Drugs

Juliette Cubanski is with KFF. Anthony Damico is an independent consultant.

Medicare Part D and Part D Low-Income Subsidy Program Enrollment, by Plan Type, 2006-2024
Weighted Average Medicare Part D Monthly Premiums, by Plan Type, 2006-2024