Policy Options to Sustain Medicare for the Future
Introduction
Preface and Introduction
.
Preface
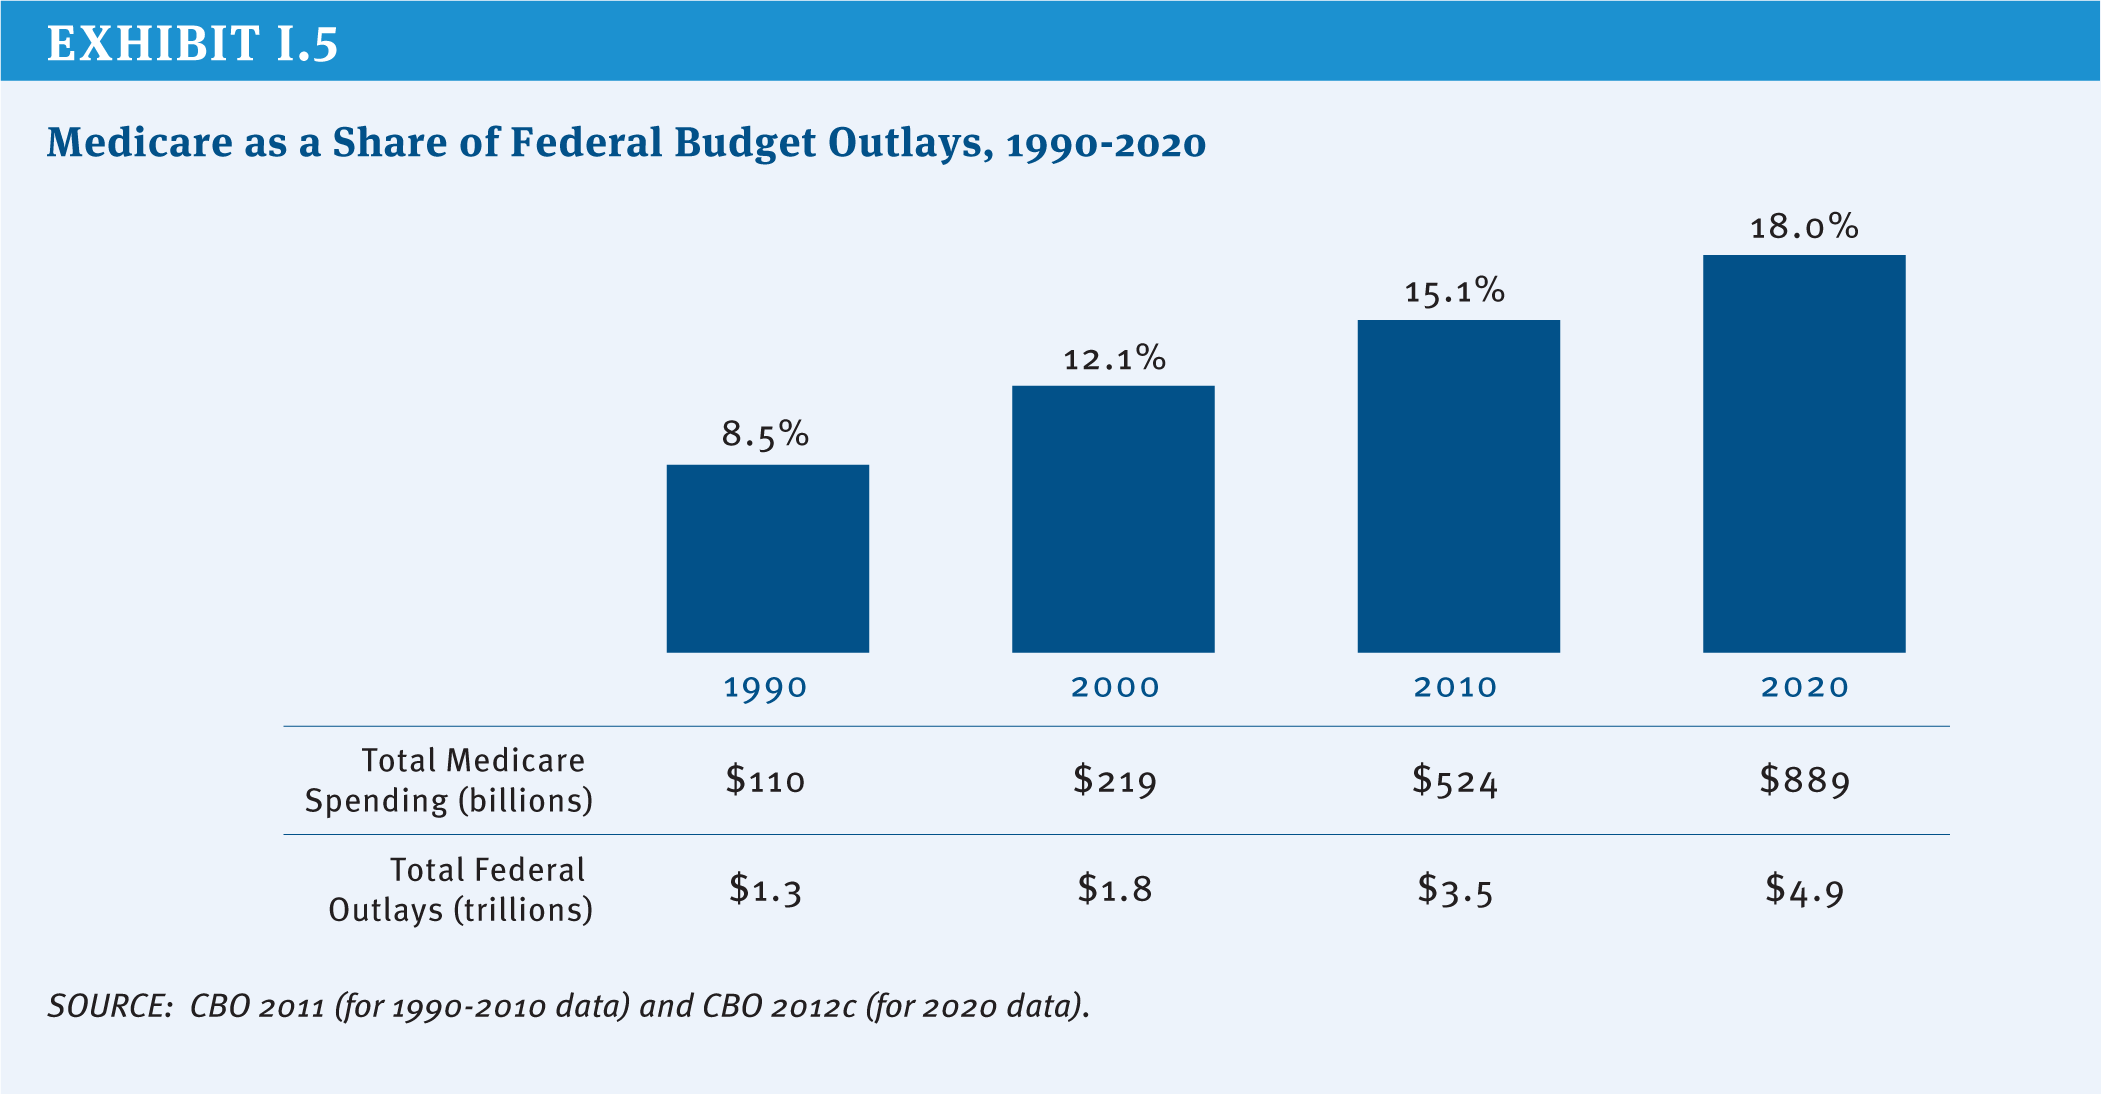
Policymakers are engaged in an historic effort to stimulate economic growth and reduce the Federal budget deficit and debt. Medicare, the nation’s health insurance program for adults ages 65 and over and non-elderly people with permanent disabilities, is a key part of these discussions, principally because the program accounts for 15 percent of the Federal budget and program spending is rising as a share of the budget and the nation’s gross domestic product. President Obama, Congressional leaders in both parties, and other policymakers and stakeholders have proposed changes to Medicare as part of comprehensive approaches to deficit reduction. Important differences are reflected in the various proposals in terms of the magnitude and scope of proposed changes and how program savings would be achieved. Over the next decade, Medicare is projected to grow more slowly than private health care spending on a per capita basis, but the retirement of the Baby Boom generation and rising health care costs pose fiscal challenges for the nation. How these challenges are addressed has important implications for the Federal budget, the nation’s health care system, health care providers, taxpayers, and people with Medicare.
To inform ongoing and future policy discussions, this report presents a compendium of policy ideas that have the potential to produce Medicare savings. The report discusses a wide range of options and lays out the possible implications of these options for Medicare beneficiaries, health care providers, and others, as well as estimates of potential savings, when available. Of note, this report does not attempt—nor is it intended—to endorse or recommend a specific set of Medicare program changes or reach a specific target for savings. The report also does not include options that would be likely to require additional Federal spending, such as improving benefits or strengthening financial protections for beneficiaries with low incomes. And while it is clear that health care costs in the public and private sector are interrelated and that changes in each sector directly affect spending in the other, the report does not include options to address health care costs more broadly, including public health improvement efforts that would undoubtedly affect Medicare spending, such as reducing obesity.
There are many potential pathways and policy options that could be considered to sustain Medicare for the future. For example, one approach would leave the current program structure largely intact but make modifications to features of it, for example, by adjusting existing payment rules for providers and plans or raising beneficiary cost-sharing requirements for specific services. Another approach would attempt to leverage Medicare’s significant role in the health care marketplace to create stronger incentives to promote value over volume, for example, by accelerating the implementation of delivery system reforms, promoting models of care that improve the management of care for high-cost, high-need beneficiaries, and introducing new mechanisms to constrain excess payments and utilization. And yet another approach would change the fundamental structure of Medicare from a defined benefit program to one that instead provides an entitlement to a government contribution for the purchase of coverage. Each of these pathways could accommodate some specific savings and revenue options for Medicare that have been discussed, including raising the age of eligibility, increasing the payroll tax or raising other revenues, and capping annual program spending.
To produce this report, The Henry J. Kaiser Family Foundation spent several months in 2012 consulting some of the nation’s top experts in Medicare and health care policy, including individuals with a wide variety of perspectives who have served in senior positions on Capitol Hill and in the Executive Branch, academia, and the health care industry. We asked for their input on defining the problem, as well as their suggestions for options, pathways, and priorities.
These experts were very generous with their thoughts, ideas, and time, for which we are extremely thankful. A list of these experts and their affiliations at the time of the interview on page iii, with the exception of a few people who requested that they not be listed. The inclusion or exclusion of specific policy options and the related discussion in this report cannot and should not be attributed to any of these experts individually or collectively.
We also conducted an extensive review of existing literature to identify potential options to sustain Medicare for the future. The report includes many options described or endorsed by the National Commission on Fiscal Responsibility and Reform (the Simpson-Bowles commission), the Bipartisan Policy Center Task Force on Deficit Reduction, the Medicare Payment Advisory Commission (MedPAC), the Congressional Budget Office (CBO), and many others. We also worked with a team of seasoned policy experts who fleshed out these concepts and ideas for inclusion in this report to present a thorough explanation of the context, impacts, and, when available, potential savings. In particular, we would like to acknowledge Robert Berenson for making significant contributions to several parts of this report, and Leslie Aronovitz, Randall Brown, Judy Feder, Jessie Gruman, Jack Hoadley, Andy Schneider, and Shoshanna Sofaer for their contributions to specific topic areas. We also would like to acknowledge Chad Boult, Susan Bartlett Foote, Richard Frank, Joanne Lynn, Robert Mechanic, Diane Meier, Peter Neumann, Joseph Ouslander, Earl Steinberg, George Taler, and Sean Tunis for their participation in small-group discussions related to specific topics covered in this report, and Actuarial Research Corporation (ARC) for providing cost estimates and distributional analysis of several options. Technical support in the preparation of this report was provided by Health Policy Alternatives, Inc. We are indebted to Richard Sorian for bringing to this project his keen policy insight and skillful editorial assistance.
This report would not have been written were it not for a few exceptionally talented and dedicated staff of the Kaiser Family Foundation. In particular, Zachary Levinson worked tirelessly and enthusiastically on nearly every aspect of this project, and Rachel Duguay helped get the project up and running. Gretchen Jacobson was instrumental in developing several areas of the report, and Jennifer Huang lent her creative talents to the exhibits and production process. We also would like to thank Carene Clark, Anne Jankiewicz, and Evonne Young for their work on the report design and layout. Lastly, we would like to acknowledge The Atlantic Philanthropies for financial support for this project.
We hope this report provides valuable information in ongoing efforts to sustain Medicare for the future.
Sincerely,
Patricia Neuman, Sc.D
Senior Vice President
Director, Program on Medicare Policy
Director, Kaiser Project on Medicare’s Future
Kaiser Family Foundation
Juliette Cubanski, Ph.D.
Associate Director
Program on Medicare Policy
Kaiser Family Foundation
.
Experts Interviewed for this Project
Joseph Antos
American Enterprise Institute
Scott Armstrong
Group Health Cooperative
Katherine Baicker
Harvard University
Donald Berwick
Center for American Progress
Jonathan Blum
Centers for Medicare & Medicaid Services
David Blumenthal
Partners HealthCare
Sheila Burke
Baker, Donelson, Bearman, Caldwell & Berkowitz, PC
Christine Cassel
American Board of Internal Medicine
Michael Chernew
Harvard University
David Cutler
Harvard University
Duane Davis
Geisinger Insurance Operations
Karen Davis
The Commonwealth Fund
Ezekiel Emanuel
University of Pennsylvania
Judith Feder
Georgetown University
Elliot Fisher
Dartmouth College
Patricia Gabow
Denver Health and Hospital Authority
Richard Gilfillan
Center for Medicare & Medicaid Innovation
Sherry Glied
Columbia University
Thomas Graf
Geisinger Health System
Jonathan Gruber
Massachusetts Institute of Technology
Karen Ignagni
America’s Health Insurance Plans
Mark McClellan
The Brookings Institution
Marilyn Moon
American Institutes for Research
Joseph Newhouse
Harvard University
Len Nichols
George Mason University
Robert Reischauer
The Urban Institute
John Rother
National Coalition on Health Care
John Rowe
Columbia University
Earl Steinberg
Geisinger Health System
Glenn Steele
Geisinger Health System
Simon Stevens
UnitedHealth Group
Janet Tomcavage
Geisinger Health Plan
Bruce Vladeck
Nexera, Inc.
Gail Wilensky
Project HOPE
.
Introduction
Medicare’s History of Coverage and Care for Seniors and People with Disabilities
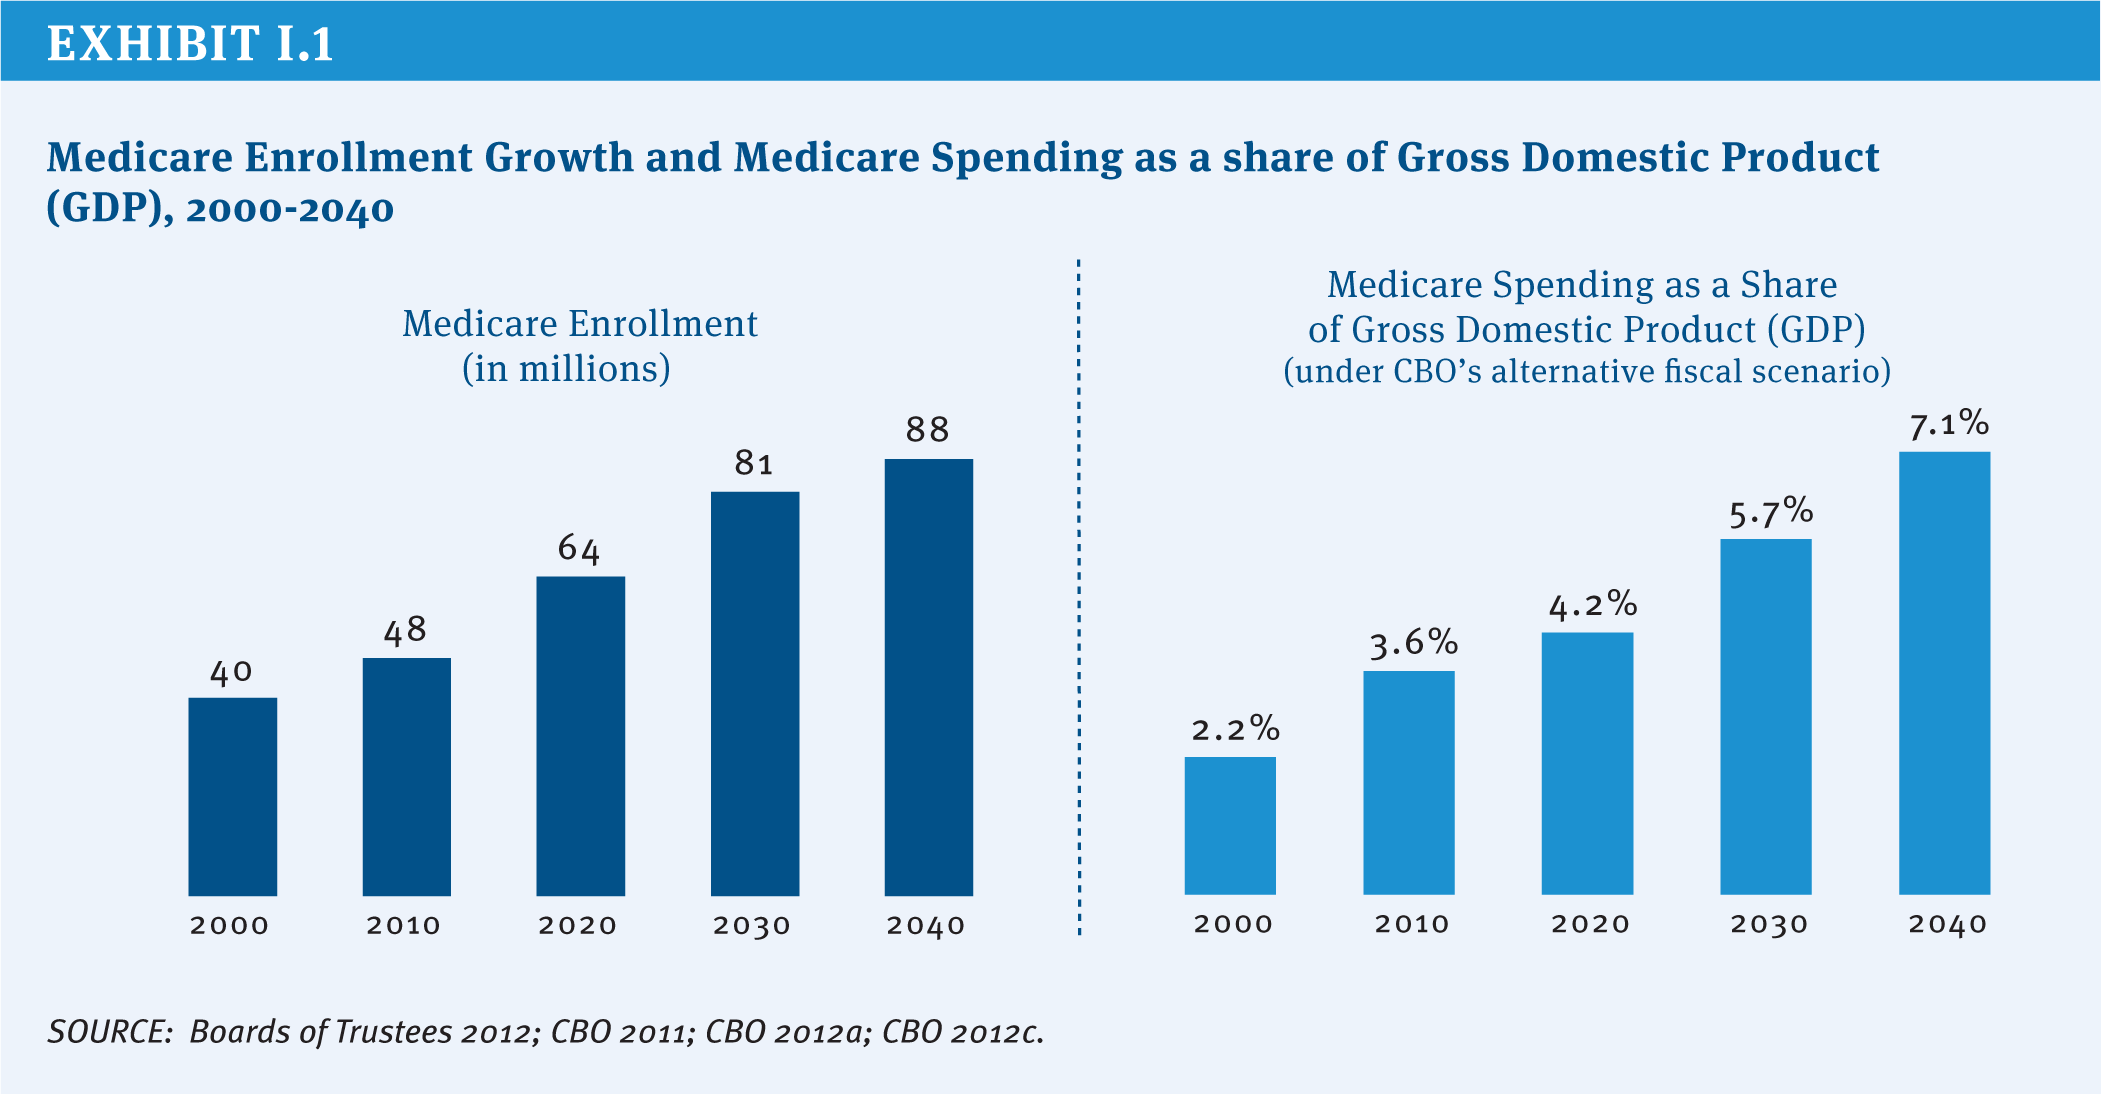
Medicare was signed into law July 30, 1965, and went into effect one year later. Since then, Medicare has provided health insurance coverage for more than 130 million Americans, including adults ages 65 and over and younger people living with permanent disabilities (HHS 2012). Medicare is a Federal entitlement program that provides a guaranteed set of benefits to all Americans who meet the basic eligibility requirements, without regard to medical history, income, or assets. In 2012, Medicare provided health insurance coverage to 50 million people. With total Medicare expenditures estimated to rise as a share of the Federal budget and the nation’s economy, Medicare is once again at the forefront of policy discussions (Exhibit I.1).
Medicare has made a significant contribution to the lives of older Americans and people with disabilities by bolstering their economic and health security and helping to lift millions of older Americans out of poverty. Prior to Medicare, more than half of all Americans over age 65 were uninsured (De Lew 2000), and nearly a third of seniors were in poverty; today virtually all seniors have Medicare coverage and the official poverty rate among those ages 65 and older is just under 9 percent (U.S. Bureau of the Census 2012). For younger people living with disabilities, Medicare has provided life-saving and life-sustaining access to care and treatment that would otherwise be out of reach for many and has allowed millions to stay in their homes rather than be institutionalized.
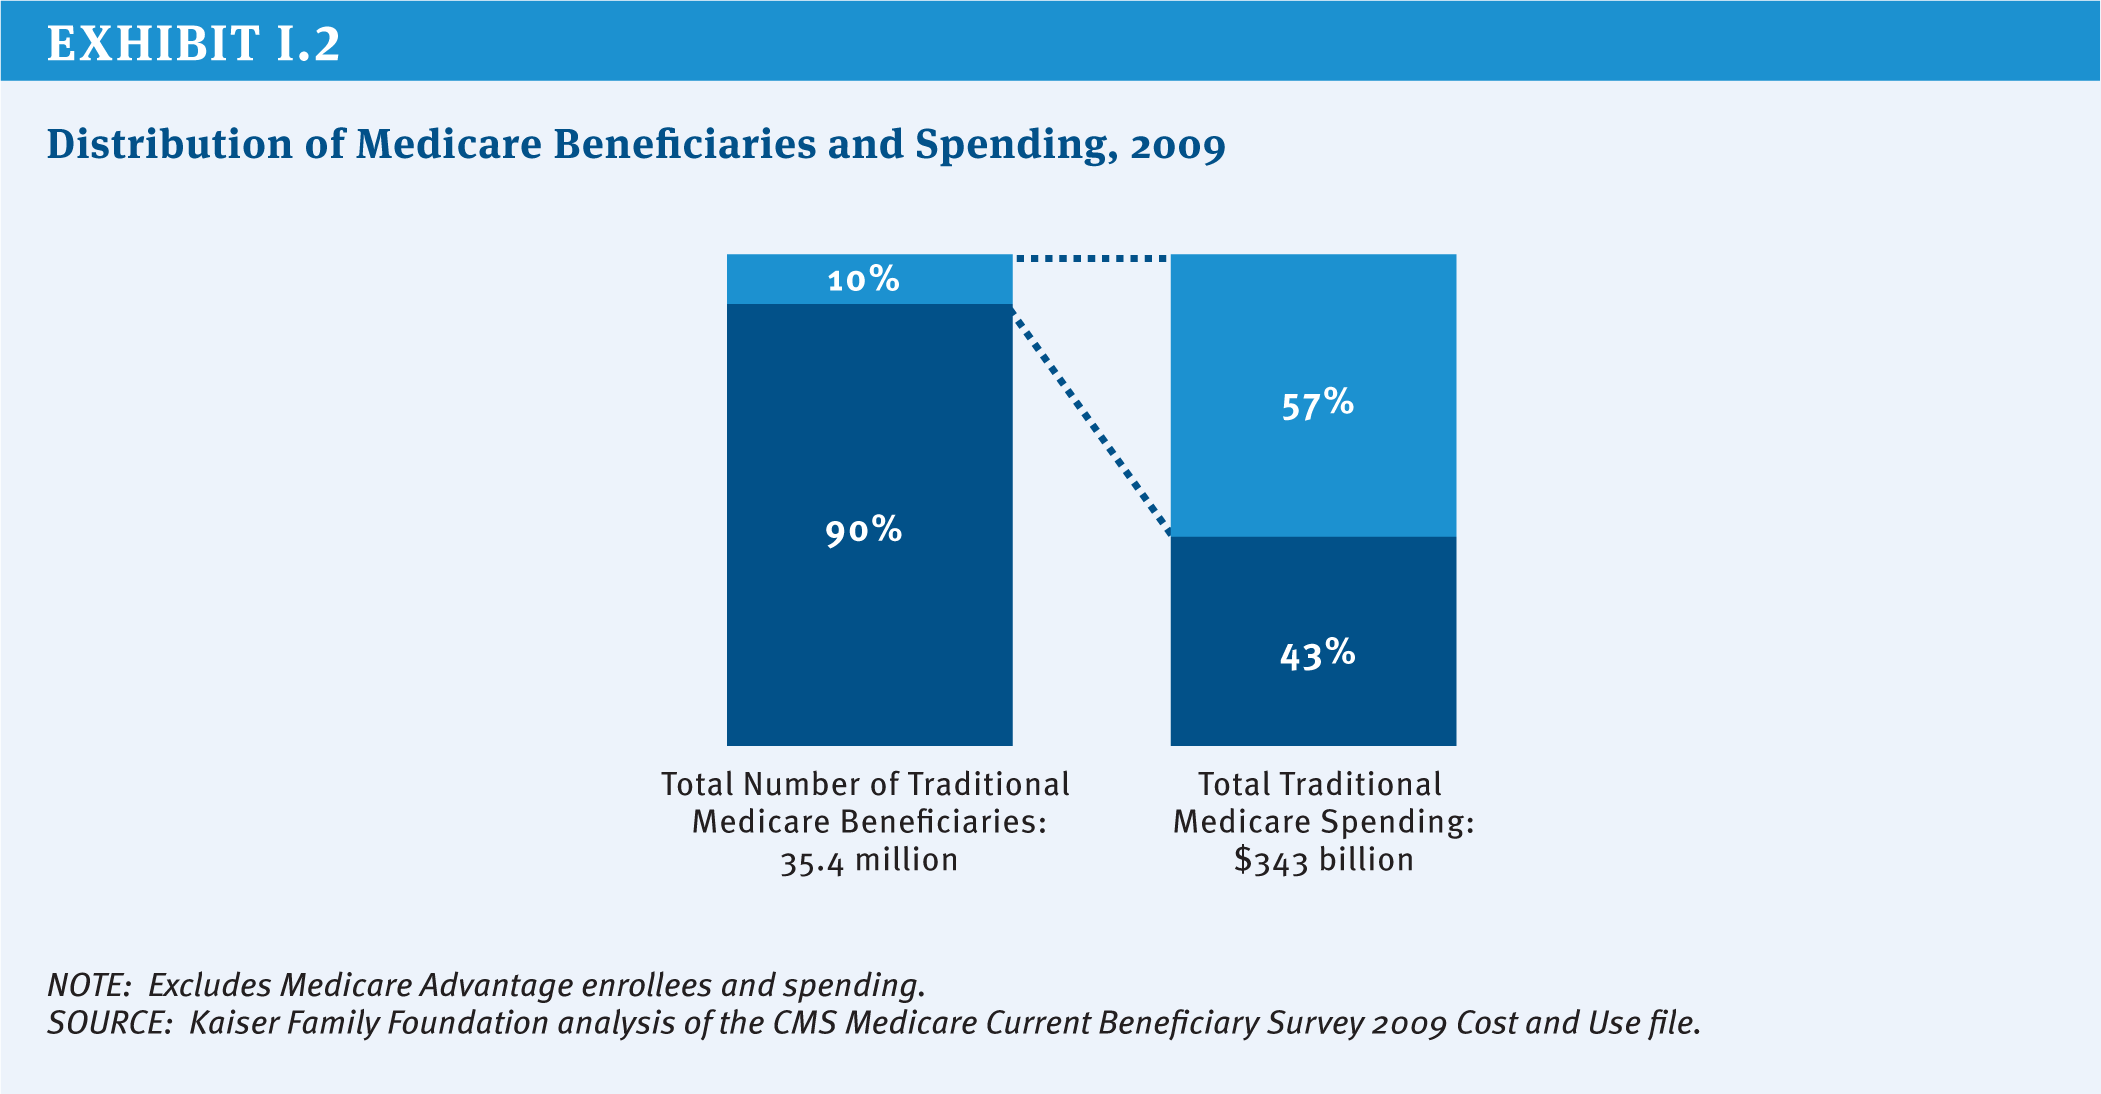
Health insurance coverage is important to people of all ages, but especially important for seniors and adults with disabilities who are significantly more likely than others to need costly medical care. Medicare pays for health care services, including, but not limited to, hospitalizations, physician services, medical devices, and prescription drugs. Each year, more than three-quarters of people with Medicare have at least one physician office visit; more than one in four go to an emergency department one or more times; nearly one in five beneficiaries are admitted to a hospital; and nearly one in 10 have at least one home health visit. In 2013, average per capita Medicare spending is projected to exceed $12,000 (Boards of Trustees 2012). While most people with Medicare use some amount of medical care in any given year, a majority of spending is concentrated among a relatively small share of beneficiaries with significant needs and medical expenses (Exhibit I.2).
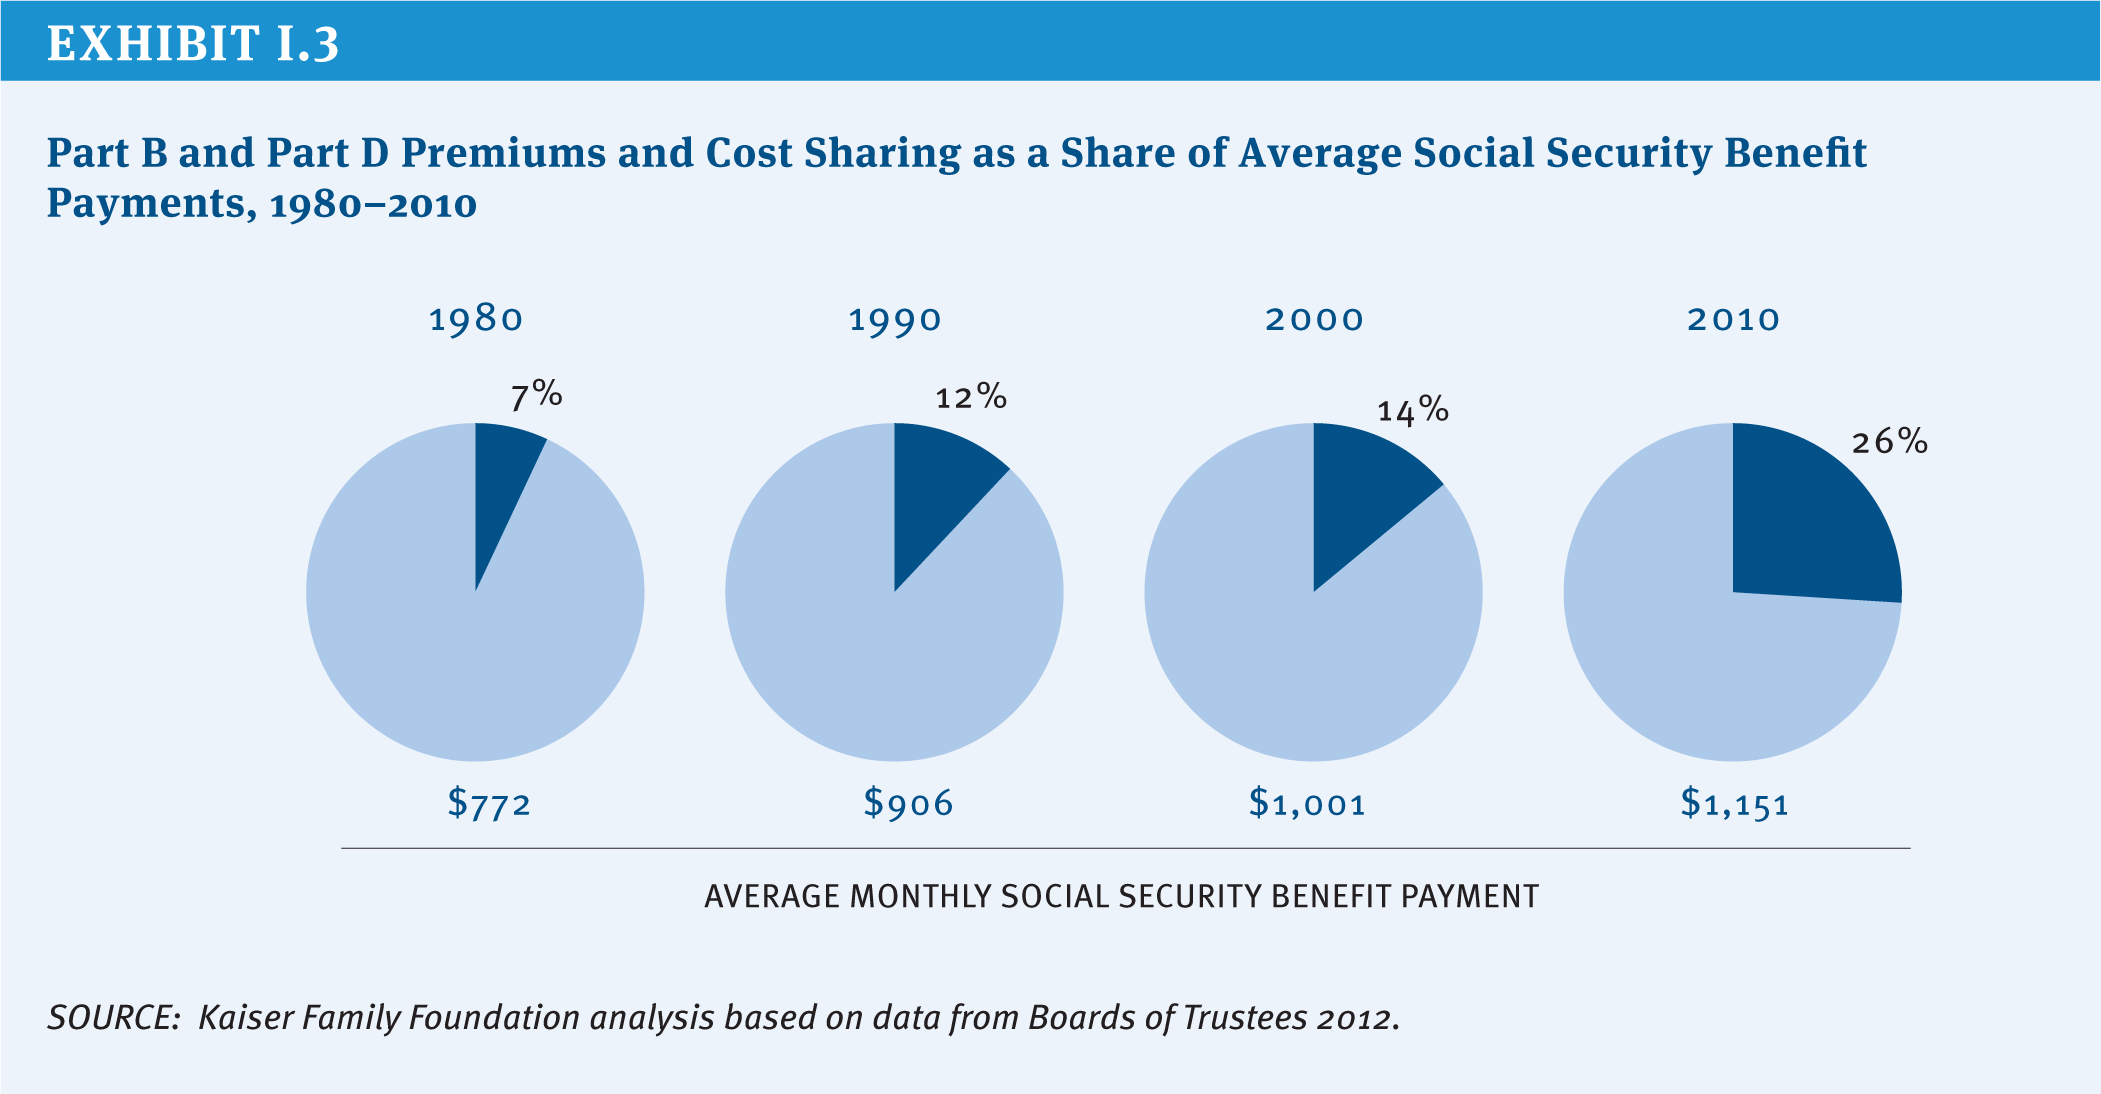
Despite the important role that Medicare plays in providing health and economic security for beneficiaries of the program, it does not cover all the costs of health care. Medicare cost sharing is relatively high and, unlike most private health insurance policies, Medicare does not place an annual limit on the costs that people with Medicare pay out of their own pockets. Many Medicare beneficiaries have supplemental coverage to help pay for these costs, but with half of beneficiaries having an annual income of $22,500 or less in 2012, out-of-pocket spending represents a considerable financial burden for many people with Medicare. Cost sharing and premiums for Part B and Part D have consumed a larger share of average Social Security benefits over time, rising from 7 percent of the average monthly benefit in 1980 to 26 percent in 2010 (Exhibit I.3). Medicare beneficiaries spend roughly 15 percent of their household budgets on health expenses, including premiums, three times the share that younger households spend on health care costs. Finally, Medicare does not cover costly services that seniors and people with disabilities are likely to need, most notably, long-term services and supports and dental services.
Medicare’s Future Challenges
Persistently high rates of growth in health care spending combined with demographic trends pose a serious challenge to the financing of Medicare in the 21st century. The number of people eligible for Medicare is projected to rise sharply from 50 million today to nearly 90 million by 2040, with a particularly high rate of growth in enrollment between now and 2030 (Exhibit I.1). According to the Congressional Budget Office (CBO), the aging of the population is expected to account for 60 percent of the growth in Federal health spending over the next 25 years, while “excess cost growth”1 accounts for 40 percent (CBO 2012a). As such, the long-run fate of Medicare depends on solving the larger problem of rising health care costs, which pose a similar challenge to all payers, including employers, individuals, and other government programs.
The aging of the Baby Boom generation not only makes millions of Americans newly eligible for Medicare, it also reduces the number of workers paying the Medicare payroll tax, a primary source of revenue for the Medicare Part A Hospital Insurance (HI) trust fund. The HI trust fund currently is projected to be solvent through 2024, but will have insufficient funds to pay full benefits beyond that point (Boards of Trustees 2012). In the past, Congress has taken steps to maintain and extend the solvency of the HI trust fund by restraining growth in Medicare spending and increasing payroll tax revenue, and will need to take action to extend the life of the trust fund at some point in the future to fully fund current benefits.
Over the course of the past five decades, Congress has made changes to Medicare on numerous occasions to address emergent issues, benefit gaps, financing challenges, spending growth, and policy priorities (See Textbox “Major Amendments to Medicare” beginning on page xi). For example, Medicare’s benefit package has been updated to include hospice benefits, outpatient prescription drugs, and more comprehensive coverage of preventive services. Medicare also has expanded the role of private entities, not only the contractors that help administer the program and process claims, but also the private health plans that provide benefits under Medicare Advantage and Part D (prescription drug coverage). Medicare payment systems have evolved over time, shifting from cost-based fee-for-service reimbursement systems to prospective and bundled payments to providers, a shift that has helped to constrain the growth in program spending.
The most recent sweeping changes to Medicare were enacted as part of the Affordable Care Act (ACA) of 2010. While the ACA retained Medicare’s structure as an entitlement to a set of defined benefits, the law contains several provisions designed to reduce provider payment growth, increase revenues, improve certain benefits, reduce fraud and abuse, and invest in research and development to identify alternative provider payment mechanisms, health care delivery system reforms, and other changes intended to improve the quality of health care and reduce Medicare spending. According to CBO, these changes reduced projected Medicare spending by $716 billion over 10 years (2013–2022) (Elmendorf 2012).
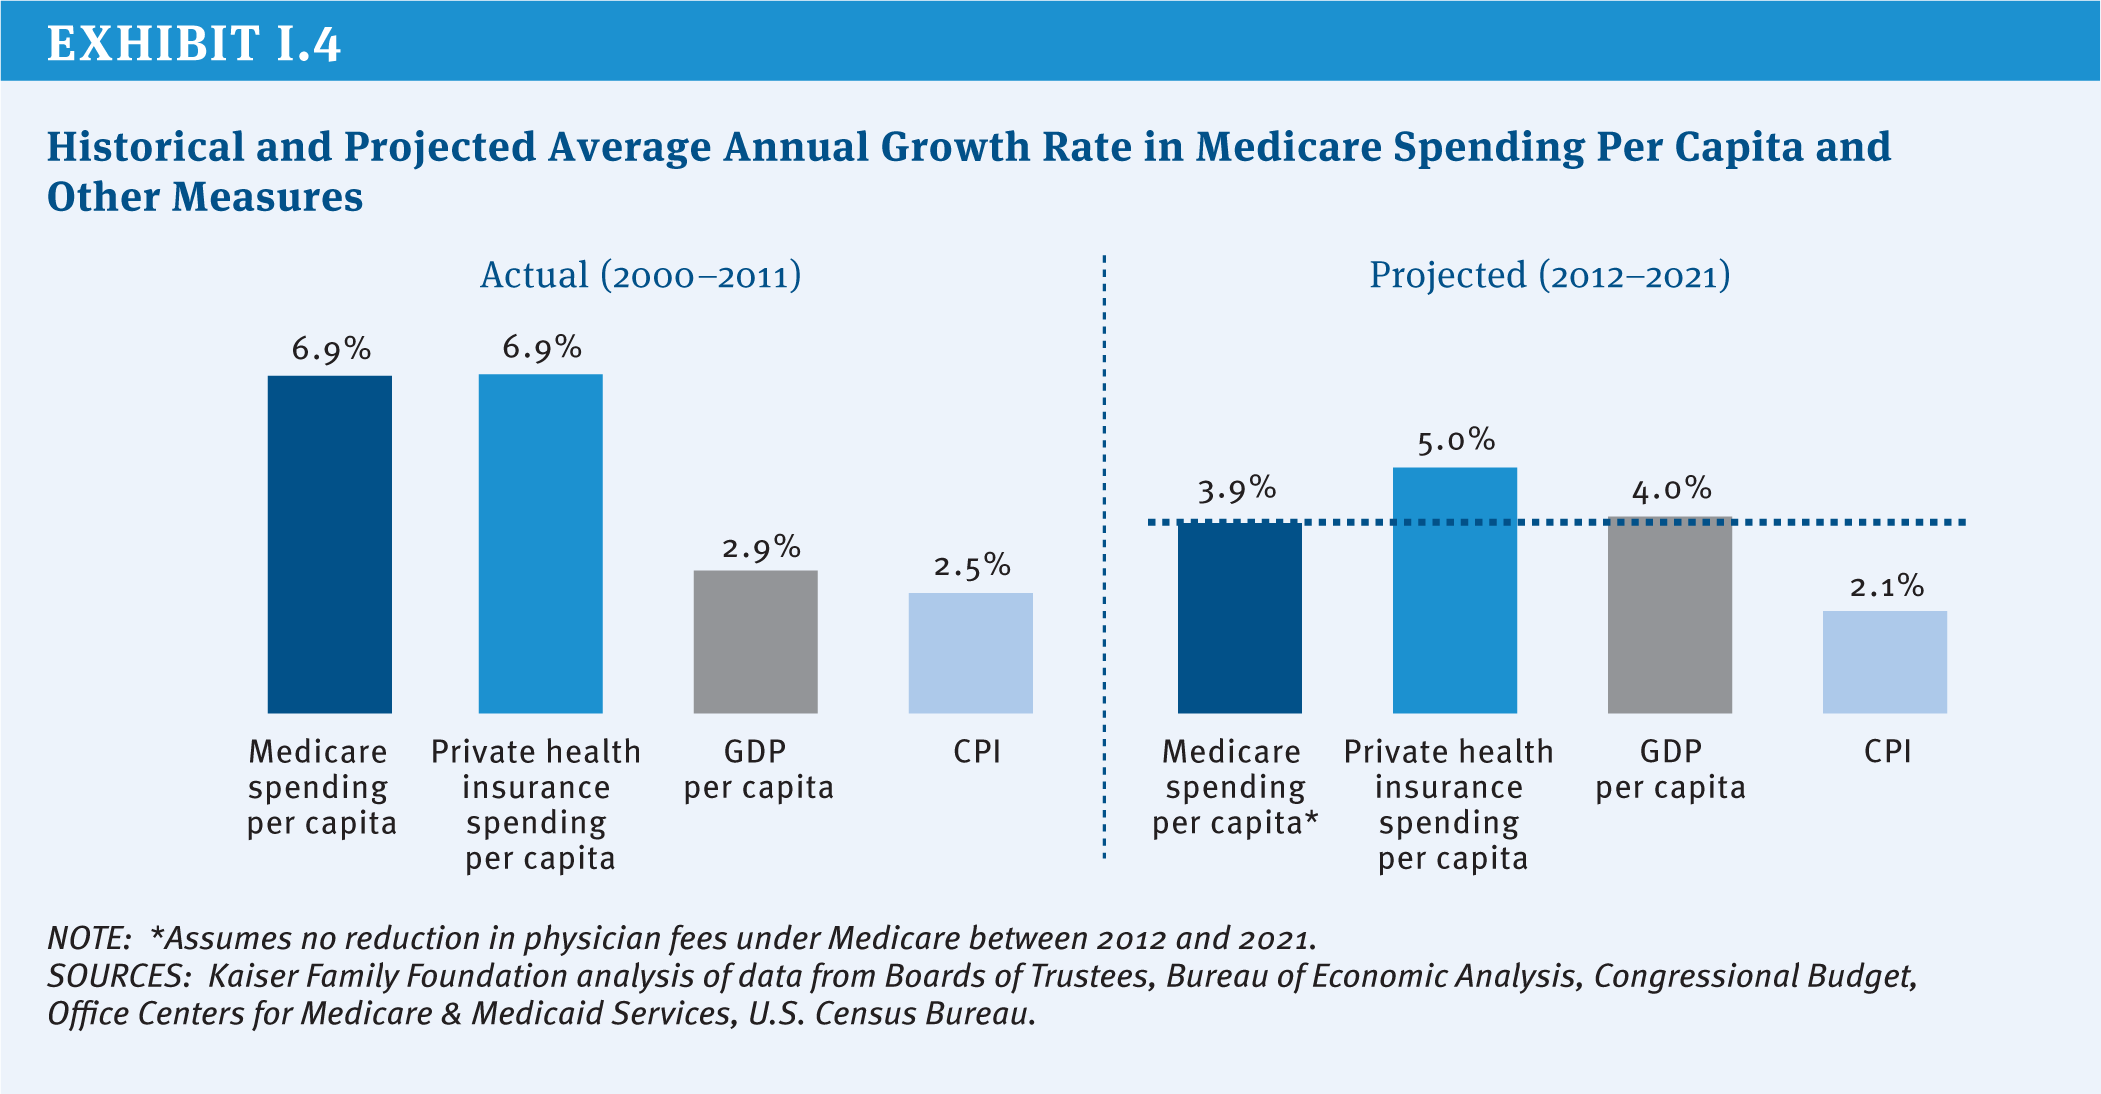
Partly as a result of payment changes enacted in the ACA, Medicare per capita spending is now projected to grow by 3.9 percent annually between 2012 and 2021, compared with 5.0 percent average annual per capita growth projected for private health insurance spending2 (Exhibit I.4). Even with the relatively low Medicare per capita growth rate projected for the next decade, policymakers face an ongoing challenge in finding ways to reduce long-term spending growth and continue to finance care for an aging population. And with Medicare spending accounting for a growing share of the Federal budget and the gross domestic product (GDP), Medicare’s challenges will be inextricably linked to ongoing deliberations over how to reduce annual Federal deficits and the national debt (Exhibit I.5).
Looking to the future, Medicare faces a number of challenges, including:
» A mismatch between projected revenues and spending that is projected to result in insufficient funds to support services that are paid for by the Hospital Insurance trust fund beginning in 2024;
» An outdated benefit design, with relatively high deductibles and cost-sharing requirements, no limit on out-of-pocket spending, and benefit gaps, that encourages beneficiaries to seek supplemental insurance and contributes to relatively high out-of-pocket spending;
» Several provider payment systems that reward volume, rather than value or patient outcomes, without adequate incentives to encourage providers to coordinate and manage patient care, particularly for high-need, high-cost beneficiaries;
» A physician payment formula, known as the Sustainable Growth Rate (SGR), that aims to constrain the growth in expenditures associated with physician services, but has led to frequent Congressional intervention to avoid sudden and severe reductions in doctors’ fees; and
» An ongoing struggle to constrain the growth in health care spending, while providing fair payments to providers and plans and high-quality, affordable medical care for beneficiaries.
Given these challenges, the debate about Medicare’s future is likely to revolve around several key questions:
- How much can Medicare absorb in additional savings, and over what period of time, without negatively affecting patient care?
- How should efforts to sustain Medicare be distributed among providers, plans, beneficiaries, and taxpayers?
- What are the most promising strategies for reducing inefficiencies and promoting high-quality care: accelerated delivery system reforms; greater competition among plans and providers; value-based purchasing strategies; stronger financial incentives to encourage care management?
- Should Medicare’s basic entitlement be changed from a program that guarantees a defined set of benefits to one that provides a defined contribution for the purchase of insurance?
- Should reform efforts focus specifically on Medicare or be broadened to address the growth in health care spending across all payers?
Since the enactment of Medicare, policymakers have been challenged to balance the interests of Medicare beneficiaries, taxpayers, health care providers, health plans, and manufacturers. Today’s national economic and fiscal constraints make this task more difficult than ever. The nature of the options presented in this report underscores the scale of changes that may be in store for Medicare in the future, and the potential effects of these changes on beneficiaries and providers of care mean that debating them will be contentious. Notwithstanding the difficult choices that lie ahead in coming to consensus on Medicare program changes, the effort to sustain Medicare for the future is a vital endeavor.
Report Outline
This report presents a compendium of policy ideas that have the potential to produce Medicare savings or generate revenue, while also laying out the possible implications of these options for beneficiaries, health care providers, and others, as well as estimates of potential savings, when available. This report does not attempt—nor is it intended—to endorse or recommend a specific set of Medicare policy options or reach a specific target for savings.
The report is divided into five sections, each of which presents options within several main topic areas. Topic areas are cross-referenced where options and ideas overlap. The five sections describe options related to:
» Medicare eligibility, beneficiary costs, and program financing;
» Medicare payments to providers and plans;
» Delivery system reform and options that focus on Medicare beneficiaries with high needs;
» The basic structure of the Medicare program; and
» Medicare program administration and governance, including program integrity.
We generally rely on cost estimates from official and publicly available government sources, including CBO, the Department of Health and Human Services Office of Inspector General (OIG), MedPAC, and the Office of Management and Budget (OMB). For many options, no cost estimate is available from one of these sources. In a few cases, estimates from other sources are presented and noted accordingly. For a complete list of options included in this report and budget effects, see Appendix p. 197, Table of Medicare Options and Budget Effects.
References
Click to expand/collapse
Boards of Trustees, Federal Hospital Insurance and Federal Supplementary Medical Insurance Trust Funds. 2012. 2012 Annual Report of the Boards of Trustees of the Federal Hospital Insurance and Federal Supplementary Medical Insurance Trust Funds, April 23, 2012.
Congressional Budget Office (CBO). 2011. The Budget and Economic Outlook: Fiscal Years 2011 to 2021, January 2011.
Congressional Budget Office (CBO). 2012a. The 2012 Long-Term Budget Outlook, June 4, 2012.
Congressional Budget Office (CBO). 2012b. Monthly Budget Review, Fiscal Year 2012, October 5, 2012.
Congressional Budget Office (CBO). 2012c. An Update to The Budget and Economic Outlook: Fiscal Years 2012 to 2022, August 2012.
Nancy De Lew. 2000. “Medicare: 35 Years of Service,” Health Care Financing Review, 2000.
Douglas W. Elmendorf. 2012. Letter to the Honorable John Boehner, Speaker of the House, July 24, 2012.
U.S. Bureau of the Census. 2012. Current Population Survey, Annual Social and Economic Supplements, Historical Poverty Tables, Table 3. Poverty Status of People, by Age, Race, and Hispanic Origin: 1959 to 2011, 2012.
U.S. Department of Health and Human Services (HHS). 2012. Centers for Medicare & Medicaid Services, unpublished estimate, 2012.
Major Amendments to Medicare
Since it was enacted in 1965, Medicare frequently has been amended in legislation to either add benefits, control costs, or both. Some of the major revisions include:
1972
Under the Social Security Amendments of 1972, Medicare eligibility is expanded to include people under age 65 with long-term disabilities (who received Social Security Disability Insurance payments for 24 months) and individuals suffering from end stage renal disease (ESRD) who require maintenance dialysis or a kidney transplant. The law also authorizes Medicare to contract with health maintenance organizations (HMOs), through either cost reimbursement or risk contracts.
1980
The Omnibus Reconciliation Act of 1980 eliminates the prior hospitalization requirement for home health services, removes the 100 home health visit limitations under Part A and Part B, and requires all home health visits to be paid by Part A unless the beneficiary is only enrolled in Part B.
1982
Medicare is expanded to include a new hospice benefit under the Tax Equity and Fiscal Responsibility Act of 1982. Part B premiums are set to cover 25 percent of program costs, Federal employees are required to pay the Medicare payroll tax, and HMOs are now paid based on 95 percent of the adjusted average per capita cost (AAPCC) of caring for beneficiaries under fee-for-service Medicare.
1983
As part of the Social Security Amendments of 1983, Medicare adopts a new a prospective payment system (PPS) for inpatient hospital services that pays a predetermined amount for each discharge depending on the patient’s condition. Separate rates are set for diagnosis related groups (DRGs).
1985
The Consolidated Omnibus Budget Reconciliation Act of 1985 establishes the Emergency Medical Treatment and Labor Act (EMTALA), requiring hospitals in the U.S. to stabilize patients before transferring them to other facilities. COBRA also makes the Medicare hospice benefit permanent.
1987
In response to concerns raised about the quality of care in nursing homes, the Omnibus Budget Reconciliation Act of 1987 sets new quality standards for Medicare and Medicaid certified nursing facilities while also modifying provider payments to reduce growth. Also that year, the Balanced Budget and Emergency Deficit Control Reaffirmation Act of 1987 freezes Medicare payment rates in an attempt to slow Medicare spending.
1988
Congress adopts, and, in 1989, repeals key provisions of the Medicare Catastrophic Coverage Act that would have capped beneficiaries’ out of pocket costs and added an outpatient prescription drug benefit to Medicare financed through premiums paid by beneficiaries including means-tested payments by upper-income seniors. Provisions expanding financial protections for low-income beneficiaries in Medicare and Medicaid remain in place, however.
1989
Under the Omnibus Budget Reconciliation Act of 1989, Medicare physician payments begin to be determined based on a resource-based relative value scale (RBRVS) based on the amount of work required to perform a service, replacing a system in which physicians were paid based on their own charges. A new “volume performance standard” is created to guard against sharp increases in the number of services provided to beneficiaries.
1990
The Omnibus Budget Reconciliation Act of 1990 sets new standards for Medigap policies, including standard benefit designs to facilitate comparisons across plans, curtails the use of preexisting condition limitations and requires new medical loss ratio requirements. Medicare benefits are expanded to include mammography screening.
1993
The Omnibus Budget Reconciliation Act of 1993 includes reductions in payments to providers as part of deficit reduction legislation. Congress also eliminates the cap on earnings subject to the Medicare payroll tax.
1997
The Balanced Budget Act of 1997 makes significant changes to Medicare resulting in savings by tightening Medicare payments to providers, increasing beneficiary premiums, and other provisions. The law establishes prospective fee schedules for all part B services except hospital outpatient services and expands the types of private plans participating in a newly named Medicare+Choice program. The law replaces Medicare’s volume performance standard (VPS) with a new formula—known as the Sustainable Growth Rate (SGR)—designed to guard against volume increases.
2000
The Benefits Improvement and Protection Act (BIPA) expands coverage of preventive care and increases Medicare payments to plans and certain providers. The law modifies payments to Medicare+Choice plans, increasing payments in certain rural and urban counties. It also provides Medicare coverage for people with amyotrophic lateral sclerosis (ALS) by waiving the 24-month waiting period.
2003
The Medicare Modernization Act of 2003 (MMA) adds a voluntary outpatient prescription drug program to be administered by stand-alone prescription drug plans (PDPs) or Medicare Advantage Prescription Drug Plans (MA-PDs) financing by general revenues, beneficiary premiums, and a “clawback” of savings from the States. MMA also increases Part B premiums for higher income beneficiaries and raises payments to private health plans participating in what is now called “Medicare Advantage.”
2008
The Medicare Improvements for Patients and Providers Act of 2008 (MIPPA) expands protection of low-income beneficiaries, adds more coverage of preventive care (including a “Welcome to Medicare” physical), and reduces the growth in payments to and imposes new restrictions and requirements on Medicare Advantage plans.
2010
The Affordable Care Act of 2010 (ACA) reduces the growth in Medicare spending for Medicare Advantage plans, hospitals, and other health care providers; sets a limit on the growth in spending to be enforced through the Independent Payment Advisory Board; improves benefits by gradually closing the Part D coverage gap; expands coverage of preventive services; creates a new Center for Medicare & Medicaid Innovation to test and implement payment and delivery system reforms to curb costs and improve quality; increases Part B and D premiums for higher-income beneficiaries; raises the Medicare payroll tax on earnings of high-income workers; and establishes fees on manufacturers of branded prescription drugs and medical devices.
2011
The Budget Control Act of 2011 provides for reductions in Medicare spending in the event Congress cannot agree on a long-term deficit and debt reduction plan. Beginning in 2013, Medicare spending will be subject to automatic, across-the-board reductions, known as “sequestration,” that would reduce Medicare payments to plans and providers by up to 2 percent.
2013
The American Taxpayer Relief Act includes provisions to avert a reduction in Medicare physician fees for one year and extends provisions that would have expired under current law and offsets the cost by reducing payments to hospitals and Medicare Advantage plans. The law delays the sequestration of Federal payments to Medicare plans and providers for two months, repeals the Community Living Assistance Services and Supports (CLASS) program authorized under the ACA, and establishes a new Commission on Long-Term Care.
Report
Section 1: Medicare Eligibility, Beneficiary Costs, and Program Financing
.
Age of Eligibility
Options Reviewed
This section reviews two options for raising the age of Medicare eligibility:
» Raise the age of Medicare eligibility from 65 to 67, using a similar phase-in schedule for the Social Security full retirement age
» Raise the Medicare eligibility age from 65 to 67 only for people with relatively high lifetime earnings
Currently, most Americans become eligible for Medicare benefits when they reach age 65. Raising the age at which people can begin to be covered by Medicare has been proposed as a way of decreasing future Medicare program spending by reducing the number of people on Medicare. Most proposals recommend gradually raising the Medicare eligibility age from 65 to 67, aligning Medicare eligibility with the full retirement age for Social Security. If adopted in conjunction with coverage expansions included in the Affordable Care Act (ACA), Federal savings associated with this change would be partially offset by costs associated with providing subsidies to 65- and 66-year-olds covered in the health insurance exchanges or under Medicaid; the effects for individuals would be expected to vary based on age, income, and source of health insurance coverage.
Background
Since Medicare was enacted in 1965, eligibility has generally been based on age (65 and older), employment history (individuals or their spouses contribute Medicare payroll taxes for at least 10 years), and citizenship/residency status.1 The eligibility age for both Medicare and full retirement benefits through Social Security were aligned until 2000, when, as a result of a 1983 law, the normal retirement age for Social Security began to rise in stages from age 65 to age 67.
In the past, a major concern related to raising the Medicare eligibility age has been the potential impact on people ages 65 and 66 who could become uninsured as a result of losing access to Medicare. Studies conducted prior to enactment of the ACA estimated that the number of uninsured 65- and 66-year-old adults would increase if the Medicare eligibility age were raised, in the absence of reforms that would provide older adults with access to affordable insurance, without pre-existing conditions exclusions and other restrictions (Davidoff and Johnson 2008). These studies documented that people who were not entitled to Medicare benefits at age 65 would have limited access to private insurance coverage unless they were working and had access to employer-sponsored group coverage. Such concerns were a major deterrent to increasing the Medicare eligibility age prior to enactment of the ACA.
With the implementation of the ACA, including coverage expansions and Federal subsidies for private coverage through the health insurance exchanges and expanded coverage for low-income individuals under Medicaid, the law will change the insurance coverage landscape for nonelderly individuals beginning in 2014. Combined with an individual mandate, the prohibition against insurers excluding people from coverage due to pre-existing conditions and limits on age-related rating bands, these reforms could create an avenue for affordable health insurance coverage for 65- and 66-year-olds if the Medicare eligibility age were raised above age 65. The individual mandate applies to all individuals, with certain exceptions unrelated to age. If the Medicare eligibility age is increased to 67, 65- and 66-year-olds would be eligible for income-based subsidies as long as they do not have an offer of coverage from an employer. However, a statutory change would be needed to extend eligibility for the Medicaid expansion to 65- and 66-year-olds because the ACA specifically limits the expansion to individuals who meet the new income requirements and are under age 65.
Policy Options
OPTION 1.1
Raise the Medicare eligibility age from 65 to 67
Under this option, the age of Medicare eligibility would gradually increase from 65 to 67, aligning Medicare with the full retirement age for Social Security, whereby the eligibility age is increasing by two months per year, reaching 67 in 2027 for people born in 1960 or later. This option could be modified by: (1) modifying the implementation date; (2) varying the number of years over which the age of eligibility would be raised; (3) indexing the age of eligibility to life expectancy in order to provide greater Federal savings and account for continued gains in life expectancy. The discussion below does not address the effects of these modifications.
Budget effects
The Congressional Budget Office (CBO) estimates that raising the Medicare eligibility age gradually to 67, by two months per year beginning in 2014, would reduce net Federal spending by $113 billion over 10 years (2012–2021) (CBO 2012). This takes into account new Federal costs associated with health insurance exchange subsidies and the Medicaid expansion, and the loss of Medicare Part B premium revenues.
Discussion
Proponents cite both demographic and economic justifications for increasing the Medicare eligibility age to achieve Medicare savings. Aligning the Medicare age of eligibility with the age when people can claim full retirement benefits for Social Security is bolstered by demographic trends, in particular, gains in average life expectancy at age 65. In 1960, just prior to the enactment of Medicare, the average 65-year-old could expect to live another 14.3 years; five decades later, the average life expectancy for a 65-year-old has increased to 19.2 years (NCHS 2012) (Exhibit 1.1). Gains in life expectancy result in an increase in the average number of years people rely on Medicare for their health insurance coverage, which places greater financial pressure on the Medicare program.
A deferral in Medicare eligibility would be expected to reinforce incentives in the Social Security system for workers to delay retirement and remain in the labor force, while at the same time enabling older Americans to save more for their expenses during retirement, pay payroll taxes to help support Medicare and Social Security, and pay taxes that help to strengthen the economy. Because many people choose to apply for Social Security and Medicare at the same time, CBO reports that raising the Medicare eligibility age would also reduce Social Security retirement benefit outlays in the short term.
The coverage expansions included in the ACA can help to alleviate the concern previously held about raising the age of Medicare eligibility, that 65- and 66-year-olds would be at high risk of becoming uninsured in the absence of Medicare. As mentioned earlier, with full implementation of the ACA, 65- and 66-year-olds would have access to health insurance coverage through the health insurance exchanges and Medicaid (assuming conforming technical changes are made to the law to facilitate coverage under the Medicaid expansion), with subsidies available to those with incomes up to 400 percent of the Federal Poverty Level (FPL).
Opponents cite a number of concerns with this option. Raising the age of eligibility would reduce Medicare spending, but also would shift costs from Medicare to other payers, which would result in a net increase in health care spending system-wide (Kaiser Family Foundation 2011). An increase in the Medicare eligibility age would result in higher premiums for those who remain on Medicare, because younger and relatively low-cost 65- and 66-year-olds would no longer be in the Medicare risk pool; higher premiums for younger adults getting private coverage through the health insurance exchanges because having 65- and 66-year-olds in that risk pool would increase the average cost of exchange coverage; higher costs for employers, to the extent that some of those no longer eligible for Medicare would be covered instead under an employer plan; and higher Medicaid expenditures as some lower-income people ages 65 and 66 would be eligible for coverage under that program.
For people ages 65 and 66, the effects of losing Medicare eligibility would be mixed. People with relatively modest incomes (less than 300 percent of the FPL) would be expected to have lower out-of-pocket costs under their new source of coverage, on average, than they would if covered by Medicare, but the majority of 65- and 66-year-olds with relatively higher incomes (greater than 300 percent of the FPL) are expected to face higher out-of-pocket costs because their private sources of coverage would be more expensive than under Medicare and they would receive less generous or no subsidies for private exchange coverage (Kaiser Family Foundation 2011). And while the ACA provides new coverage options, some low-income 65- and 66-year-olds might not be able to get coverage under the Medicaid expansion if they live in a state that chooses not to expand its Medicaid program. Another concern cited by opponents is the uneven effects on people ages 65 and 66 of raising the Medicare eligibility age due to differences in life expectancy by race, income, and gender. For example, life expectancy at age 65 is nearly two years shorter for black men than white men and one year shorter for black women than white women, on average (NCHS 2012).
OPTION 1.2
Raise the Medicare eligibility age to 67 for people with higher lifetime earnings
Under this option, all qualifying workers would get Medicare benefits but the timing of their eligibility for benefits would differ by income, with beneficiaries’ lifetime earnings determining when they would become eligible for Medicare (Emanuel 2012).22 Beneficiaries in the top quarter of the lifetime earnings distribution would not be eligible for Medicare until age 70; those in the next highest quarter of lifetime earnings distribution would be eligible at 67; and those in the lower half of the lifetime earnings distribution would continue to be eligible at age 65. Both of the higher-earnings groups would be permitted to buy into Medicare at age 65 until they reach the eligibility age for their lifetime earnings quartile.
Budget effects
No cost estimate is available for this option.
Discussion
Many of the advantages and disadvantages of Option 1.1 also pertain to this option. Adjusting the age of Medicare eligibility by income would take into account the fact that the wealthy, on average, live longer than those in lower-income brackets, which could address concerns that raising the age of Medicare eligibility for all 65- and 66-year-olds would adversely affect those with shorter average lifespans. Raising the eligibility age for Medicare according to lifetime earnings could also encourage more personal savings, as people may prepare differently for health expenses in retirement if they know they will not (or may not) be eligible for Medicare until after age 65.
There are issues to be considered when using a measure based on lifetime earnings. On the one hand, lifetime earnings are considered to be a more stable measure of wealth than income in a particular year or over a limited number of years, but on the other hand, lifetime earnings may not be a good indicator of a person’s financial situation at the time they age on to Medicare, especially if they have experienced a recent change in employment status.
An additional concern relates to the administrative feasibility of this proposal. While information related to earnings is collected by the Social Security Administration and disseminated to all workers who pay employment taxes, a number of questions arise with respect to how lifetime earnings would be calculated and how the policy would be implemented, including: (1) How would lifetime earnings be measured and over what time period? (2) How far in advance of age 65 would a prospective beneficiary be informed of their age of Medicare eligibility? (3) Which agency or agencies of the Federal government would be responsible for making income determinations, resolving discrepancies, and communicating income determinations to beneficiaries? (4) What are the implications of using a measure based exclusively on earnings for individuals with relatively low earnings but substantial unearned income?
References
Click to expand/collapse
Centers for Disease Control and Prevention, National Center for Health Statistics (NCHS). 2012. Health, United States, 2011, May 2012.
Congressional Budget Office (CBO). 2012. Raising the Ages of Eligibility for Medicare and Social Security, January 2012.
Amy J. Davidoff and Richard Johnson. 2003. “Raising the Medicare Eligibility Age: Effects on the Young Elderly,” Health Affairs, July/August 2003.
Ezekiel Emanuel. 2012. “Entitlement Reform for the Entitled,” The New York Times, May 20, 2012.
Kaiser Family Foundation. 2011. Raising the Age of Medicare Eligibility: A Fresh Look Following Implementation of Health Reform, July 2011.
.
Beneficiary Cost Sharing
Options Reviewed
This section reviews several options for reducing Medicare spending by increasing or modifying beneficiary cost sharing:
» Increase the Part B deductible
» Introduce cost sharing for home health services
» Introduce cost sharing for the first 20 days of a skilled nursing facility (SNF) stay
» Introduce cost sharing for clinical laboratory services
» Modify current cost-sharing requirements to reflect “value-based insurance design”
» Restrict first-dollar supplemental coverage or establish a supplemental coverage surcharge
Increasing deductibles and cost sharing for Medicare-covered services would reduce Medicare spending by shifting cost obligations from the Federal government to people on Medicare. In addition, Medicare may achieve savings that result from reduced utilization of Medicare-covered services to the extent that beneficiaries choose to forego medical care—potentially both necessary and unnecessary services—to avoid higher costs. The effects for beneficiaries would be expected to vary based on income, health status, and their supplemental insurance coverage. Increasing Medicare’s cost-sharing requirements also could affect costs incurred by other payers, including the Medicaid program and employers who provide supplemental coverage for retirees on Medicare.3 A related option would modify cost-sharing requirements to encourage the use of higher-value care and discourage the use of lower-value care.
Background
Medicare has a complex benefit design, with a deductible for inpatient services covered under Part A, another deductible for physician and other outpatient services under Part B, and a separate deductible for prescription drugs under the standard benefit design covered by Part D plans. Medicare also imposes cost-sharing requirements that vary by type of service. Unlike typical large employer plans, traditional Medicare does not have an annual limit on out-of-pocket spending for services covered under Parts A and B (although Medicare Advantage plans are required to include a limit on out-of-pocket costs for Medicare-covered services).
Due to the relatively high cost-sharing requirements and the absence of a limit on out-of-pocket spending, the vast majority of people with traditional Medicare have some type of supplemental insurance to help cover these costs, such as an employer-sponsored retiree health plan, a private Medicare supplemental insurance (Medigap) policy or, for those with low income, Medicaid. However, even though supplemental coverage helps to defray these expenses, out-of-pocket medical costs (including premiums) are a concern for many people with Medicare and have been rising as a share of income (Kaiser Family Foundation 2011a). With a median income for individual Medicare beneficiaries of $22,500 in 2012, health expenses consume a relatively large share of beneficiaries’ incomes and household budgets (Kaiser Family Foundation 2011a; Kaiser Family Foundation 2011c; Kaiser Family Foundation 2012) (Exhibit 1.2) (Exhibit 1.3).
A number of recent proposals have recommended various options to increase or modify deductibles and cost-sharing requirements for some or all Medicare beneficiaries. Some analysts assert that people with Medicare should bear part of the burden of Medicare savings, citing research indicating that the average beneficiary receives more in Medicare benefits than they have paid into the program during their working years (Steurle and Quakenbush 2012). Some also hope that changes in cost sharing would encourage beneficiaries to consume more high-value (i.e., higher-quality and lower-cost) services and fewer low-value services, just as tiered cost sharing has encouraged Part D enrollees to use lower-cost generic or preferred-brand drugs when available, producing savings for Medicare and for beneficiaries. However, others argue that beneficiaries should be protected from increases in cost sharing, especially those with low incomes.
Changes to Medicare’s cost-sharing requirements could produce a number of different outcomes. Higher cost-sharing requirements for specific services would reduce Medicare spending, while increasing costs for users of these services and for other payers. Making beneficiaries responsible for a greater share of their health costs would likely reduce the demand for care. Research demonstrates that people may forgo both unnecessary and necessary care in response to higher out-of-pocket costs (Swartz 2010). To the extent that beneficiaries forego necessary services and subsequently are hospitalized or visit an emergency department to treat preventable illnesses, the savings from higher cost sharing and reduced utilization could be offset in part or in whole by new Medicare spending. Under many of these approaches, the existence of supplemental coverage such as Medigap and employer-sponsored retiree health policies complicates the financial effects of cost-sharing changes.
This section describes several options to raise or modify deductibles and cost sharing, but does not present policy changes that could be considered in conjunction with these options that would strengthen financial protections for low-income beneficiaries, many of whom would be disproportionately affected by new cost sharing. Nor does it present options that would improve benefits, such as by adding a new limit on out-of-pocket spending for Part A and Part B services. The report includes a separate discussion of more comprehensive options that would restructure Medicare’s benefit design (see Section Four, Benefit Redesign).
Policy Options
OPTION 1.3
Increase the Part B deductible
The Part B deductible ($147 in 2013) is relatively low when compared with private coverage, while the Part A deductible ($1,184 in 2013) is relatively high. Under current law, the Part B deductible is indexed to rise with the growth in Part B per capita expenses and, as such, is projected to increase to $226 by 2021 (Boards of Trustees 2012).
This section describes two options to achieve savings by raising the Part B deductible:
» Option 1.3a: Increase the deductible incrementally by $75 for new beneficiaries only. This option was included in President Obama’s Fiscal Year (FY) 2013 Budget and would increase the Part B deductible for new enrollees by $25 in each of 2017, 2019, and 2021 (OMB 2012).
» Option 1.3b: Increase the deductible by $75 for all beneficiaries.
Budget effects
CBO estimated that Option 1.3a, as proposed in President Obama’s FY 2013 Budget, would save the Federal government $2.3 billion over 10 years (2013–2022) (CBO 2012). The savings would increase over time as new people become eligible for Medicare.
Although official government estimates are unavailable for Option 1.3b, analysis conducted by the Actuarial Research Corporation (ARC) for the Kaiser Family Foundation projects Federal savings of $32 billion over 10 years (2014–2023) if the policy were implemented in 2014. This estimate is considerably higher than that for President Obama’s proposal because the increase would apply to all beneficiaries, would be implemented in an earlier year, and would begin immediately, rather than incrementally.
Discussion
Increasing the Part B deductible would produce Federal savings and could make beneficiaries more cost-conscious about their use of physician and outpatient services. However, it also would increase costs for beneficiaries and other payers. According to ARC’s analysis, a $75 increase in the deductible for new enrollees in 2014 (similar to Option 1.3a, but implemented earlier) would raise costs for 5 percent of beneficiaries initially, although that share would grow over time as more people join Medicare. Raising the deductible by $75 for all enrollees in 2014, as in Option 1.3b, would increase cost-sharing obligations for the vast majority of Medicare beneficiaries.4 Supplemental plans that cover the deductible would moderate the effect of the cost-sharing increase for enrollees. This would, in turn, increase supplemental plan premiums and increase spending by employers and Medicaid. Those without supplemental coverage who use Part B services would incur the increase in the deductible directly. Part B premiums, set to cover 25 percent of Medicare Part B spending, would be expected to fall because the higher deductible would result in lower Part B expenditures.
OPTION 1.4
Introduce cost sharing for home health services
Medicare home health services are not subject to a deductible or cost-sharing requirements. Medicare covers home health services through both Part A and Part B, the former for up to 100 visits following an inpatient or skilled nursing facility (SNF) stay and for beneficiaries who are not covered under Part B, and the latter for all other visits (CRS 2010). Medicare home health utilization has risen relatively rapidly in recent years. Between 2002 and 2010, the number of home health users increased by 36 percent (from 2.5 million people to 3.4 million people), the annual number of episodes per user increased from 1.6 to 2.0, and the number of episodes of care increased by 66 percent, from 4.1 million to 6.8 million (MedPAC 2012b). The growth in home health care has been especially large among episodes that are not preceded by a hospitalization or post-acute care, which now comprise nearly two-thirds of home health episodes (MedPAC 2012b).
In 2010, Medicare spent $19.4 billion on home health services, up from $8.5 billion in 2000 (MedPAC 2012b). As part of a settlement agreement resulting from a Federal class action lawsuit, CMS could soon expand coverage of home health services by clarifying that beneficiaries who do not demonstrate a potential for improvement may still be eligible for coverage; it is not clear whether this change will lead to an increase in spending over time (Jimmo v. Sebelius 2012).
This section reviews three options for imposing cost sharing on home health services:
» Option 1.4a: Impose a 10 percent coinsurance on all home health episodes. In 2008, a 10 percent coinsurance on the average home health episode would equal about $300 (MedPAC 2011).
» Option 1.4b: Impose a $150 copayment per full episode, that is, episodes encompassing five or more visits. This $150 copayment represents approximately 5 percent of the average cost of a home health episode (as of 2008) (MedPAC 2011).
» Option 1.4c: Impose a $150 copayment per full episode, restricted to episodes that do not follow a hospitalization or post-acute care. In 2011, MedPAC recommended a copayment for episodes that do not follow a hospitalization or post-acute care, noting the rapid growth in volume of these types of episodes. President Obama’s FY 2013 Budget included a $100 copayment per full episode that does not follow a hospitalization or post-acute care, although this would only apply to new beneficiaries beginning in 2017 (OMB 2012).
Budget effects
The effects of home health cost sharing on program spending and beneficiaries would depend on several factors, including whether the cost sharing is imposed per visit or per episode, whether it applies to all episodes or a subset (e.g., those that do not follow inpatient or post-acute care), whether it applies to all beneficiaries or just new enrollees, and the implementation date.
» Option 1.4a: In 2011, CBO estimated that this option would produce Federal savings of $40 billion over 10 years (2012–2021) if implemented in 2013.
» Option 1.4b: No official government cost estimate is available for this option. According to ARC, a $150 copayment per full episode would produce Federal savings of $19 billion over 10 years (2014–2023).
» Option 1.4c: In 2011, MedPAC estimated that this option would produce between $1 billion and $5 billion in Medicare savings over five years. In 2012, CBO estimated that the Obama Administration proposal (a $100 copayment for this subset of episodes applied to new beneficiaries beginning in 2017) would produce Federal savings of about $0.3 billion from 2013 to 2022. Savings would increase over time as more people became eligible for Medicare.
Discussion
A new cost-sharing requirement for home health care would reduce Medicare spending and could address some concerns about overutilization. Home health cost sharing may also be helpful in that it could give beneficiaries information that could be used to identify and report possible instances of fraudulent billing. At the same time, this option would increase costs for beneficiaries who use these services, employers, and others.
ARC has projected that one in ten beneficiaries (10 percent) will use home health services in 2014, and all would be affected by a 10 percent coinsurance. However, some groups of beneficiaries are more likely to use home health services and would be disproportionately affected by new cost sharing, including beneficiaries with lower incomes and not covered by Medicaid, those ages 85 and older, women, those in relatively poor health, and those with functional impairments (Exhibit 1.4).
The effects of the three different options would differ in terms of how many beneficiaries would be affected, which beneficiaries would be affected, and how much cost sharing they would face. The 10 percent coinsurance would affect all home health users (or, according to ARC, roughly 3.8 million beneficiaries if implemented in 2014), while the $150 copayment would affect the majority of home health users (about 3.2 million beneficiaries if implemented in 2014). A more limited copayment, applied to those without an inpatient stay or post-acute care, would affect fewer beneficiaries (1.4 million).
In contrast to the coinsurance option (Option 1.4a), the two copayment options (Options 1.4b and 1.4c) would cap the cost-sharing obligation per home health episode, although users would pay more than $150 if they had multiple episodes. According to ARC, the average home health user would face $550 in new cost-sharing obligations with a 10 percent coinsurance—more than users would under the flat $150 copayment per full episode. Beneficiaries who use home health services more extensively would face larger increases in cost-sharing obligations with the coinsurance than the flat copayment. For example, among beneficiaries with functional impairments who use home health services, cost-sharing obligations would increase by an estimated $750, on average, with a 10 percent coinsurance.
To the extent that home health users pay the new cost sharing out of their own pockets, use of home health services would be expected to decline (which is factored into the ARC analysis). In some instances, this could occur without major implications for beneficiaries’ health, while in others, beneficiaries may forgo needed care, which could result in higher costs associated with preventable inpatient admissions.5
A new home health copayment could create incentives for beneficiaries to substitute care in one setting for another. For example, a home health copayment applied to services received following an inpatient stay could drive beneficiaries to seek care in a skilled nursing facility for which there is no copayment for the first 20 days. This would be less of a concern with a $150 copayment that is restricted to episodes that do not follow a hospitalization or post-acute care.
Home health users without supplemental coverage would be fully exposed to new cost-sharing requirements. Others would be protected from some or all of these new cost-sharing requirements to the extent that their supplemental insurance covers these expenses. Home health users with Medicaid (36% according to ARC analysis) would be shielded from new cost-sharing obligations if Medicaid assumed these expenses on their behalf, which would in turn increase Medicaid spending. Similarly, beneficiaries with Medigap or employer-sponsored supplemental coverage could be shielded from direct cost-sharing requirements, but premiums would be expected to rise as a result (along with costs for employers). Part B premiums would be expected to fall somewhat because they are tied to Part B per capita program expenses, which are projected to decline under this option.
Finally, a new home health copayment per episode would impose new administrative costs on Medicare and private entities, given that home health providers do not have to keep track of cost-sharing requirements for Medicare beneficiaries under current law.
OPTION 1.5
Introduce cost sharing for the first 20 days of a skilled nursing facility stay
Another option for achieving Medicare savings would be to add upfront cost sharing for short SNF stays. Under current law, Medicare covers SNF stays of up to 100 days per benefit period for beneficiaries who have been hospitalized for at least three consecutive days. Beneficiaries are not required to pay cost sharing for the first 20 days each benefit period, but face a daily copayment for days 21–100, set to equal 12.5 percent of the Part A deductible (or a projected $153 per day in 2014). On average, SNF users paid cost sharing for 23 days in 2010 (and those with cost sharing paid for an average of 36 days) (CMS 2011).
Budget effects
In 2011, CBO estimated that a daily copayment for the first 20 days of a SNF stay set at 5 percent of the Part A deductible would reduce Federal spending by $21.3 billion over 10 years (2012–2021), if implemented in 2013.
Discussion
Introducing an upfront copayment for SNF care could produce substantial Medicare savings. However, it would increase cost sharing for SNF users, a relatively small, but vulnerable, group of beneficiaries. According to analysis by the Actuarial Research Corporation (ARC) for the Kaiser Family Foundation, 4 percent of beneficiaries are projected to have a SNF stay in 2014, and would thus face new cost-sharing obligations under this policy. This would include a larger share of beneficiaries ages 85 or older, those with low incomes, those who report fair or poor health, and people with functional impairments.
With a copayment on the first 20 days set at 5 percent of the Part A deductible (projected to be $60 in 2014), cost-sharing obligations for SNF users would increase in 2014 by $920 on average. The average is somewhat less than $1,200 ($60 for the first 20 days) because some SNF stays are shorter than 20 days. To the extent that the additional SNF cost-sharing requirements are covered by Medigap and employer plans, premiums would be expected to rise for beneficiaries covered by these policies (as would employer spending). Because Medicaid pays cost sharing on behalf of Medicare beneficiaries who are dually eligible for Medicare and Medicaid, Medicaid spending would also rise.
A new copayment would be expected to have some impact on utilization of SNF services (which is factored into the analysis above). With higher front-end costs, the average length of stay would be expected to decline.
OPTION 1.6
Introduce cost sharing for clinical lab services
Currently, Medicare beneficiaries have no cost sharing for clinical lab services. One option to achieve savings would impose the same cost-sharing requirements on lab services as for other Part B services, applying the Part B deductible ($147 in 2013) and 20 percent coinsurance.
Budget effects
In 2008, CBO estimated that this policy would have reduced Federal spending by $24 billion over 10 years (2010–2019), had it been implemented in 2011.
Discussion
According to ARC analysis for the Kaiser Family Foundation, the majority of beneficiaries (85 percent) are expected to use clinical lab services in 2014. Implementing this policy would be expected to increase cost-sharing obligations for this group by an average of $60 in 2014, and 12 percent of beneficiaries would be expected to see increases in cost-sharing obligations of $100 or more.
Medigap insurance, employers, and Medicaid would help enrollees cover these new costs, but this would in turn mitigate the utilization impact and lead to relatively modest increases in plan premiums and employer and Federal and State Medicaid spending. Conversely, Part B premiums, which are tied to per capita program expenses, would fall slightly.
One concern raised with clinical lab cost sharing is that the administrative expenses for lab suppliers, beneficiaries, and insurers could be large relative to the new revenues collected, given the high volume but sometimes low payment for some tests. Relying on a copayment rather than a coinsurance may be easier to implement administratively. Some also argue that cost sharing would not have a substantial impact on utilization, given that lab work is often ordered as part of a physician visit and not as a discretionary stand-alone service. If so, most of the savings from clinical lab cost sharing could represent a cost shift from Medicare to beneficiaries and their supplemental plans, rather than savings from lower utilization.
OPTION 1.7
Modify current cost-sharing requirements to reflect “value-based insurance design”
Evidence about the value of services and providers can be used to provide care more efficiently and could produce savings as a result. One mechanism for doing this within Medicare would be to move towards a value-based insurance design (VBID). Value-based benefit changes would modify Medicare’s cost-sharing requirements in order to encourage beneficiaries to use higher-value services and providers, discourage lower-value services and providers, or promote healthier behavior (Fendrick 2009). For example, the Affordable Care Act (ACA) eliminated cost sharing in traditional Medicare for recommended preventive services. Cost sharing tied to the value of services could be applied broadly to all beneficiaries, or could be targeted towards those who may be more likely to benefit, such as people with particular conditions, especially severe forms of those conditions, or who are participating in disease management programs (Fendrick 2009).
One approach to moving towards VBID in the Medicare program would be to allow the Secretary of the Department of Health and Human Services (HHS) to make value-based changes to the Part A and Part B cost-sharing structures, as long as those changes did not affect the overall actuarial value of Medicare for beneficiaries. MedPAC recommended a similar policy as part of a broader package of changes to Medicare’s benefit design (MedPAC 2012a).6 This approach is designed to be flexible so that the cost-sharing structure can be updated over time as the evidence-base develops (MedPAC 2012c). Another approach would impose lower cost-sharing obligations for using “preferred” providers who offer discounts to Medicare or meet certain quality or efficiency thresholds (see Section Two, Provider Payments for a discussion of this option).
Budget effects
No cost estimate is available for this option.
Discussion
Moving towards VBID could produce savings while minimizing the harm to beneficiaries or even making beneficiaries better off in terms of reducing costs and/or improving the quality of care. Some large employers have already begun to implement components of value-based insurance design in their health plans and many others have expressed interest in doing so (Choudry et al. 2010).
There are some practical complications, however. For one, identifying “high-value” and “low-value” services may be difficult given that the evidence base is still developing. The value inherent in many services may also depend on the particular clinical needs of beneficiaries. This may limit the usefulness of VBID or could suggest the need to tailor the benefit design to individual circumstances. Implementing VBID may be a challenge for traditional Medicare, given that beneficiaries are currently entitled to payment for services that are medically necessary, with cost sharing that is uniform across all beneficiaries. Finally, supplemental coverage could mute the impact of VBID on beneficiaries’ utilization decisions.
OPTION 1.8
Restrict “first-dollar” supplemental coverage or establish a supplemental coverage surcharge
Another option would restrict supplemental coverage or require beneficiaries with this coverage to pay a surcharge. Most beneficiaries have some type of supplemental insurance to help pay Medicare’s cost-sharing requirements and fill gaps in Medicare’s benefit package. For example, in 2009, nearly a quarter of beneficiaries (24%) had a Medigap policy that supplements traditional Medicare and more than one-third (35%) had an employer-sponsored supplemental plan (these estimates include the 5 percent of beneficiaries who had both types of coverage).7
From the perspective of beneficiaries, supplemental plans provide protection from sudden and unpredictable medical expenses, alleviate the burden of ongoing everyday medical spending, and reduce the time spent on paperwork. Yet research has shown that comprehensive first-dollar coverage may lead people to obtain unnecessary services by protecting them from Medicare’s upfront cost-sharing requirements, although the estimates of the extra spending incurred by Medicare vary substantially. This in turn imposes costs not just on the supplemental policy, but on the Medicare program itself—costs borne by all beneficiaries and taxpayers.
Some have proposed to restrict this coverage in order to reduce Medicare spending or to recoup some of the additional costs of beneficiaries with first-dollar supplemental coverage by establishing a surcharge on supplemental plans. Proposals vary in terms of whether they would apply to all types of supplemental plans or just Medigap policies, whether or not they would be restricted to new enrollees, when they would be implemented, and whether they would target first-dollar coverage only or apply to all coverage. This section reviews three options:
» Option 1.8a: Restrict first-dollar Medigap coverage. This option would prohibit Medigap policies from covering the first $550 of beneficiary cost-sharing obligations and limit coverage to 50 percent of the next $4,950 in cost sharing. This option was evaluated by CBO in 2011 and is similar to a recommendation made by the President’s National Commission on Fiscal Responsibility and Reform (the Simpson-Bowles commission).
» Option 1.8b: Impose a 20 percent premium surcharge on all supplemental policies (both Medigap and employer plans). This option would retain beneficiaries’ current options regarding choice of supplemental plans, but would require them to pay a 20 percent surcharge in addition to their plan premium. The surcharge is intended to recover some or all of the additional costs that supplemental coverage may impose on Medicare. MedPAC recommended a premium surcharge on all supplemental plans (including both Medigap and retiree plans) as part of a broader proposal to restructure Medicare’s benefit design (MedPAC 2012a).
» Option 1.8c: Impose a 30 percent Part B premium surcharge for new enrollees who have “near first-dollar” Medigap coverage beginning in 2017. This option was included President Obama’s FY 2013 budget proposal. Although the budget proposal does not define “near first-dollar” coverage, it would minimally include Medigap Plans C and F, which provide first-dollar coverage and covered the majority of Medigap enrollees in 2010 (54 percent, and 13 percent of the overall Medicare population) (Exhibit 1.5).
Budget effects
CBO has estimated that restricting first-dollar Medigap coverage as described under Option 1.8a would produce Federal savings of $53 billion over 10 years (2012–2021) if implemented in 2013 (CBO 2011). CBO has not provided an estimate of Option 1.8b, although it estimated that a related (but narrower) version of this policy that would levy an excise tax on Medigap policies alone set at five percent of the plan premium would save $12 billion over 10 years (2009–2018) (CBO 2008). CBO also estimated that a 30 percent Part B premium surcharge for new enrollees with “near first-dollar” Medigap coverage beginning in 2017, as described under Option 1.8c, would save $2.6 billion over 10 years (2013–2022) (CBO 2012). Savings would increase as new people join Medicare.
The savings to Medicare from restrictions on Medigap are derived from expected reductions in utilization of medical services covered by the Medicare program as a result of greater price sensitivity among beneficiaries who would no longer have their cost sharing fully covered. In practice, the financial impact of surcharges is expected to come from: (1) the surcharges paid by beneficiaries who keep their supplemental coverage, which would be used to finance the extra costs currently imposed on Medicare, and (2) expected reductions in utilization and spending from beneficiaries who choose to drop their coverage or switch to a less generous plan. Actual savings would vary based on the extent to which beneficiaries drop or switch plans.
Discussion
Options to restrict or add a surcharge to supplemental coverage could produce savings for Medicare by reducing the indirect costs that supplemental coverage imposes on Medicare or recuperating the costs through a surcharge. In addition, because Part B spending would decline, Part B premiums would also decline for all beneficiaries.
The downside of these options is that they would limit beneficiaries’ ability to fully insure against the risk of unexpected medical expenses, exposing them to Medicare’s relatively high cost-sharing requirements, or they would require beneficiaries to pay more to insure against that risk. This could be especially burdensome for beneficiaries with modest incomes who do not qualify for Medicaid. In 2009, about two-fifths (41%) of beneficiaries with Medigap and/or employer coverage had incomes between $10,001 and $30,000.8
The effects on Medicare spending and beneficiary well-being would vary based on several key differences between specific proposals:
» Apply restrictions/surcharge to Medigap policies only or, more broadly, to all supplemental plans, including employer-sponsored retiree health coverage? Applying changes to employer plans could be viewed as more equitable in the sense that changes would apply to all supplemental policies rather than being targeted solely to Medigap policies. However, some might argue that retiree plans should be excluded, given that employees may have sacrificed additional earnings during their working years in exchange for retiree benefits. In addition, employer-sponsored retiree health plans generally do not provide first-dollar supplemental coverage. Including retiree health plan enrollees would affect a much larger share of beneficiaries; while about one-quarter (24%) of beneficiaries had Medigap coverage in 2009, more than twice as many (53%) had either Medigap or an employer-sponsored retiree health plan.9
» Apply restrictions/surcharge to first-dollar Medigap policies only or, more broadly, to all Medigap policies? Some proposals (including Option 1.8b above) would apply coverage restrictions or a surcharge on all Medigap policies, while other options more narrowly focus on policies that offer first-dollar coverage. Research suggests that cost sharing may have a greater impact on a patient’s decision of whether to seek care, but less of an impact once the patient has already sought medical care (Swartz 2010). Nonetheless, focusing on first-dollar policies may produce less savings than options that apply to all supplemental policies.
» Impose restrictions on supplemental coverage or impose a premium surcharge? A restriction on first-dollar supplemental coverage would more directly address concerns that first-dollar coverage leads to higher utilization of Medicare-covered services and spending, while a premium surcharge would give beneficiaries more flexibility to purchase their ideal level of insurance relative to a proposal that prohibits first-dollar coverage outright. However, a premium surcharge may discourage beneficiaries—especially those with limited incomes—from retaining or purchasing relatively comprehensive supplemental coverage.
» Apply restrictions/surcharge to all Medigap policyholders or, more narrowly, to new Medicare beneficiaries purchasing first-dollar Medigap policies? Under some proposals, changes to supplemental coverage would exclude beneficiaries who already have supplemental policies, as is the case under Option 1.8c. On the one hand, excluding current policyholders could be justified, given that existing Medigap policyholders may have purchased coverage with an expectation that they would retain access to guaranteed, renewable coverage in the future (and have paid premiums based on the value of this coverage under current law rules). On the other hand, excluding existing policyholders and applying changes only to those newly purchasing Medigap coverage would substantially reduce short-term savings, as indicated by CBO’s estimate of the President’s FY 2013 budget proposal.
» Apply surcharge to the Part B premium or Medigap premiums? This issue has distributional implications: applying a surcharge to the Part B premium would be nationally uniform and easier to administer, while applying a surcharge to Medigap premiums would result in differences due to the variation in Medigap premiums, which can vary by insurer, type of policy, and geographic area.
References
Click to expand/collapse
A.E. Benjamin. 1993. “An Historical Perspective on Home Care Policy,” The Milbank Quarterly, 1993.
Boards of Trustees, Federal Hospital Insurance and Federal Supplementary Medical Insurance Trust Funds. 2012. 2012 Annual Report of the Boards of Trustees of the Federal Hospital Insurance and Federal Supplementary Medical Insurance Trust Funds, April 23, 2012.
Centers for Medicare & Medicaid Services (CMS). 2011. Medicare & Medicaid Statistical Supplement: 2011 Edition. November 2011.
Niteesh K. Choudry, et al. 2010. “Assessing The Evidence For Value-Based Insurance Design,” Health Affairs, 2010.
Congressional Budget Office (CBO). 2008. Budget Options, Volume 1: Health Care, December 2008.
Congressional Budget Office (CBO). 2011. Reducing the Deficit: Spending and Revenue Options, March 2011.
Congressional Budget Office (CBO). 2012. Analysis of the President’s FY 2013 Budget, March 2012.
Congressional Research Service (CRS). 2010. Medicare Primer, July 2010.
A. Mark Fendrick. 2009. “Value-Based Insurance Design Landscape Digest,” National Pharmaceutical Council July 2009.
Jimmo v. Sebelius. 2006. Proposed Settlement Agreement, October 16, 2012. Available at: http://www.medicareadvocacy.org/wp-content/uploads/2012/11/Proposed-Settlement-Agreement.101612.pdf.
Kaiser Family Foundation. 2011a. How Much “Skin in the Game” is Enough? The Financial Burden of Health Spending for People on Medicare,” June 2011.
Kaiser Family Foundation. 2011b. Medigap Reform: Setting the Context, June 2011.
Kaiser Family Foundation. 2011c. Projecting Income and Assets: What Might the Future Hold for the Next Generation of Medicare Beneficiaries? June 2011.
Kaiser Family Foundation. 2012. Health Care on a Budget: The Financial Burden of Health Spending by Medicare Households, March 2012.
Medicare Payment Advisory Commission (MedPAC). 2011. Report to the Congress: Medicare Payment Policy, March 2011.
Medicare Payment Advisory Commission (MedPAC). 2012a. Report to the Congress: Medicare and the Health Care Delivery System, June 2012.
Medicare Payment Advisory Commission (MedPAC). 2012b. Report to the Congress: Medicare Payment Policy, March 2012.
Medicare Payment Advisory Commission (MedPAC). 2012c. Transcript of Public Meeting, April 5, 2012.
Office of Management and Budget (OMB). 2011. Living Within Our Means and Investing in the Future, September 2011.
Office of Management and Budget (OMB). 2012. Fiscal Year 2013 Budget of the U.S. Government, February 2012.
Eugene Steurle and Caleb Quakenbush. 2012. Social Security and Medicare Taxes and Benefits Over a Lifetime: 2012 Update, The Urban Institute, October 5, 2012.
Katherine Swartz. 2010. Cost-Sharing: Effects on Spending and Outcomes, Robert Wood Johnson Foundation Synthesis Project Report No. 20, December 2010.
.
Beneficiary Premiums
Options Reviewed
This section reviews two options for increasing beneficiary premiums:
» Increase the Part B or Part D premium
» Increase the income-related Part B and Part D premiums or expand to more beneficiaries
Raising Medicare premiums, either for all beneficiaries or just for higher-income beneficiaries, would reduce Medicare costs by shifting obligations from the Federal government to beneficiaries and other payers. Under current law, people enrolled in Part B and Part D generally are required to pay a monthly premium, which is set to cover 25 percent of per capita program spending ($104.90 in 2013) under Part B and 25.5 percent of the national average cost of standard Part D coverage ($31.17 in 2013, although actual premiums vary across plans and regions) (CMS 2012a; CMS 2012b). As of 2011, 92 percent of Medicare beneficiaries were enrolled in Part B and 73 percent were enrolled in Part D (Boards of Trustees 2012).
Beneficiaries with annual incomes above $85,000 for an individual or $170,000 for a couple are required to pay a higher premium than other beneficiaries in both Parts B and D. For example, in 2013, the income-related Part B monthly premium ranges from $146.90 to $335.70 (Exhibit 1.6). The income thresholds were fixed beginning in 2011 and will be frozen under current law through 2019, thereby increasing the number and share of beneficiaries required to pay the higher premium during that period. In 2020 and subsequent years, the income thresholds will again be indexed to inflation as if they had not been frozen from 2011 to 2019. The Part B premium for upper-income beneficiaries ranges from 35 percent to 80 percent of Part B per capita expenditures. The Part D premium range is the same.
The distribution of income among Medicare beneficiaries is skewed, with half estimated to have income of about $22,500 or less in 2012 and the top 5 percent having income of $88,900 or more (Exhibit 1.7). In 2013, 5 percent of Part B enrollees are estimated to pay the income-related Part B premium; that share is projected to rise to 10 percent by 2019, but then drop to about 7 percent in 2021.10 Similarly, about 4 percent of Part D enrollees will be subject to the income-related Part D premium in 2013, with that share expected to rise to 8 percent in 2019 and then fall to 6 percent in 2021 (OACT 2010).
Many beneficiaries with low incomes are not required to pay Medicare premiums if they are eligible for programs that pay premiums on their behalf, including Medicaid, the Medicare Savings Programs (for Part B premiums), and the Low-Income Subsidy (LIS) program for Part D premiums. In addition, in a year where the Social Security cost of living adjustment (COLA) is insufficient to cover an increase in the Medicare Part B premium for an individual, the so-called “hold harmless” provision prohibits an increase in the Part B premium that would otherwise result in a reduction in that individual’s monthly Social Security payments.
Policy Options
OPTION 1.9
Increase the Part B or Part D premium
One option for achieving Medicare savings would gradually increase the share of Part B costs paid by enrollees from 25 percent to 35 percent and increase Part D premiums from 25.5 percent to 35 percent of the national average cost of standard Part D coverage.
Budget effects
CBO has estimated that gradually increasing the standard Part B premium for people with Medicare by 2 percentage points each year to eventually cover 35 percent of Part B expenditures would reduce Federal spending by $241 billion over 10 years (2012–2021) (CBO 2011). Because the average Part D premium is less than the Part B premium and fewer people are enrolled in Part D, it stands to reason that increasing the Part D premium in a similar way would generate fewer savings to the Federal government, but no cost estimate is available for this option.
To the extent that Medicaid, Medicare Savings Programs, and the Low-Income Subsidy (LIS) program pay premiums on behalf of some low-income beneficiaries, increasing the share of Part B and/or Part D program costs paid by beneficiaries would increase spending by the Federal and State governments that fund these programs.11 This would offset some of the Federal savings from reduced Medicare spending.
Discussion
This policy change would involve tradeoffs in spending by the Federal government, State governments, beneficiaries, and some employers (those that pay Part D premiums on behalf of retirees). Raising Medicare premiums could substantially reduce net program spending, but would shift most of these expenses onto beneficiaries or those entities paying Medicare premiums on their behalf. To cover 35 percent of program costs in 2013, the standard Part B premium would increase from $104.90 to about $147 per month—raising Part B premiums for individuals by about $42 per month ($504 per year) and for couples by $84 per month ($1,007 per year).
Some, but not all, low-income beneficiaries would be protected from the premium increases. For example, Medicaid pays Part B premiums on behalf of the roughly nine million low-income Medicare beneficiaries who also are enrolled in Medicaid or Medicare Savings Programs (MSPs). The Low-Income Subsidy (LIS) program, which provides financial assistance under Part D for about 11 million low-income beneficiaries (Boards of Trustees 2012), would cover the full Part D premium for low-income Part D beneficiaries enrolled in “benchmark” plans and partially protect those who enroll in more expensive plans. Nonetheless, many low-income beneficiaries would be subject to the higher premium because they are not enrolled in Medicaid, Medicare Savings Programs, or the LIS program.
Some of the Medicare savings derived from this option could be used to shield low-income beneficiaries from premium in-creases. This could be accomplished in one of several ways: (1) raise the income and asset thresholds for the MSPs and/or the LIS program to allow more low-income beneficiaries to qualify for these programs; (2) increase the amount of LIS premium assistance for beneficiaries who only receive a partial subsidy; (3) modify the “hold harmless” provision, which currently prevents a reduction in Social Security payments that would otherwise occur for an individual if the monthly Part B premium increase is larger than the monthly Social Security cost-of-living increase, to take into account Part D premiums; or (4) modify the “hold-harmless” provision to prohibit Medicare premium increases from exceeding a certain percentage (e.g., 25 percent) of the COLA.
OPTION 1.10
Increase the income-related Part B and Part D premiums or expand to more beneficiaries
Beneficiaries with higher incomes could be asked to contribute more in premium payments to achieve additional savings. This could be done by:
» Increasing the income-related premium. Beneficiaries with higher incomes could be required to pay a larger share of the cost of their Part B or Part D coverage than they are required to pay under current law or they could be required to pay the full cost of their coverage.
» Increasing the share of beneficiaries paying the income-related premium. The income-related premium could be imposed on a larger share of beneficiaries by continuing the freeze on income thresholds for an extended period of time and/or by lowering the income thresholds.
President Obama’s FY 2013 budget included a proposal that, beginning in 2017, would raise the Part B income-related premiums by 15 percent to cover between 40.25 to 92 percent of Part B program costs depending on the beneficiary’s income, increase the Part D income-related premium based on the same surcharge percentages, and freeze current income thresholds until such time when 25 percent of beneficiaries pay an income-related premium (OMB 2012). Republicans in the U.S. House of Representatives proposed a similar option in 2011 (U.S. House of Representatives 2011).
Budget effects
CBO estimated that President Obama’s proposal would produce Federal savings of $30 billion over 10 years (2013–2022) (CBO 2012). Savings would increase over time as more beneficiaries paid the income-related premium.
Discussion
By targeting those with incomes above a certain level, this option would be less regressive than a premium increase for all beneficiaries. However, expanding this provision to a greater share of beneficiaries by freezing the income thresholds could reach beneficiaries who would not be considered “high income” by some standards. For example, if the income thresholds are frozen until 25 percent of all beneficiaries are subject to the income-related premium, as in the President’s FY 2013 budget, then beneficiaries with incomes at or above $47,000 in 2012 inflation-adjusted dollars would eventually be required to pay the income-related premium (Kaiser Family Foundation 2012).
Beneficiaries with higher incomes already pay much more into the program during their working (and payroll-tax paying) years than other beneficiaries and, under current law, are paying higher Part B and D premiums than other beneficiaries. There is some concern that proposals to raise premiums for higher-income beneficiaries could lead some to drop out of Medicare Part B and/or Part D, which could result in higher premiums for others who remain on Medicare, assuming the higher income beneficiaries who disenroll are relatively healthy. However, so far, there is no evidence that higher income beneficiaries are dropping out of Part B and Part D in response to existing income-related premiums.
References
Click to expand/collapse
AARP Public Policy Institute. 2012. Option: Raise Medicare Premiums for Higher-Income Beneficiaries, June 2012.
Boards of Trustees, Federal Hospital Insurance and Federal Supplementary Medical Insurance Trust Funds. 2012. 2012 Annual Report of the Boards of Trustees of the Federal Hospital Insurance and Federal Supplementary Medical Insurance Trust Funds, April 23, 2012.
Centers for Medicare & Medicaid Services (CMS). 2012a. Annual Release of Part D National Average Bid Amount and Other Part C & D Bid Related Information, August 6 2012.
Centers for Medicare & Medicaid Services (CMS). 2012b. Medicare & You 2013, November 2012.
Office of the Actuary (OACT). 2010. Part D Income-Related Premium, PB2012, Unpublished estimates, December 2010.
Congressional Budget Office (CBO). 2011. Reducing the Deficit: Spending and Revenue Options, March 2011.
Congressional Budget Office (CBO). 2012. Analysis of the President’s FY 2013 Budget, March 2012.
Congressional Research Service (CRS). 2009. The Effect of No Social Security COLA on Medicare Part B Premiums, October 2009.
Kaiser Family Foundation. 2011. The Ups and Downs of Medicare Part B Premiums: Frequently Asked Questions, November 2011.
Kaiser Family Foundation. 2012. Income-Relating Medicare Part B and Part D Premiums Under Current Law and Recent Proposals: What are the Implications for Beneficiaries? February 2012.
National Committee to Preserve Social Security & Medicare. 2012. Medicare and Means Testing, January 2012.
Office of Management and Budget (OMB). 2012. Fiscal Year 2013 Budget of the U.S. Government, February 2012.
U.S. House of Representatives. 2011. Middle Class Tax Relief and Job Creation Act of 2012 (as introduced December 9, 2011), December 9, 2011.
.
Revenues
Options Reviewed
This section reviews options for increasing revenue dedicated to Medicare financing:12
» Raise the Medicare payroll tax
» Increase other existing taxes
While this report identifies numerous approaches to slowing growth in Medicare spending, it may not be possible to sustain the program through spending reductions alone in light of the demographic changes that underlie Medicare’s financing shortfall. Over the next 20 years, Medicare enrollment will grow by more than 1.5 million beneficiaries each year, as the Baby Boom generation reaches current eligibility age. Between 2011 and 2030, an average of 10,000 Americans will turn 65 every day. By 2030, the program will finance care for twice as many Americans as it did in 2000 (Passel and Cohn 2008) (Exhibit 1.8). This rapid enrollment growth means that even if policy changes were enacted that succeed in limiting Medicare’s per-beneficiary spending trend to the annual growth in the gross domestic product (GDP)—well below the historical average of GDP plus 1.5 percentage points—total program spending still will grow at an average rate of GDP plus 3 percentage points. The demographic challenge may, therefore, lead policymakers to consider revenue options in addition to spending constraints so that Medicare benefits and payments are maintained at a level sufficient to cover the costs of care.
Currently, Medicare is financed by a combination of revenue streams (Exhibit 1.9). Employers and employees each pay a payroll tax of 1.45 percent (for a total of 2.9 percent of wages), which provided 36 percent of total program income in 2011. General tax revenue accounted for 43 percent of Medicare’s income. Beneficiary premium contributions comprised another 13 percent of program income, and 3 percent came from a portion of taxes paid on Social Security benefits. Other revenue sources include interest earned on Medicare’s trust fund reserves and payments from the states related to Medicare prescription drug coverage. Beginning in 2013, an additional Medicare tax will be paid by high-wage earners—those with annual income above $200,000 a year for individuals and $250,000 a year for couples—at a rate of 0.9 percent.
Policy Options
OPTION 1.11
Increase the Medicare payroll tax
The Medicare payroll tax could be increased from its current level of 2.9 percent. For example, one option would replace the additional 0.9 percent tax on high-wage earners with a 1 percentage point increase in the Medicare payroll tax applied to all wage earners, split equally between employer and employee. If that were done, the payroll tax would total 3.9 percent, split between employer and employee (1.95 percent paid by each).
Budget effects
In 2011, CBO estimated that replacing the high-earner additional Medicare tax with a 1 percentage point increase in the basic Medicare payroll tax would generate $651 billion in new revenue over 10 years (2012–2021).
Discussion
Increasing the payroll tax would shore up an important component of Medicare financing. Under Medicare’s financing structure, inpatient hospital care and other Part A benefits are financed primarily through the payroll tax, which accounts for about 85 percent of annual Hospital Insurance (Part A) trust fund revenue. Unlike Medicare Parts B and D, no automatic general revenue transfers are provided to cover shortfalls in the Part A trust fund. Since 2008, the trust fund annual income has been insufficient to cover benefits, and reserves that were built up in previous years are being drawn down. The Medicare actuaries project that by 2024 these reserves will be exhausted, meaning that there will not be sufficient funds to cover all program obligations for Part A benefits (Exhibit 1.10). CBO estimates that a 1 percentage point increase in the Medicare payroll tax would extend the exhaustion date for several decades.
Raising the rate would increase the total tax burden on workers, which is especially burdensome for those with lower incomes. A possible alternative would be to limit the increase to higher earners, although this would generate less revenue. For example, it could be accomplished by raising the rate for the additional Medicare tax above 0.9 percent or by lowering the income threshold ($200,000 for individuals and $250,000 for couples filing jointly) to which the additional tax is applied.
OPTION 1.12
Increase other existing taxes
Another option would be to impose new taxes and dedicate the revenue to Medicare. These taxes could be dedicated to the Part A trust fund to help ensure its continued solvency. New revenue could also become part of the general revenue that is used to finance the program. Because the Supplementary Medical Insurance (Part B) trust fund draws on general revenues as needed, dedicating a specific revenue stream to cover the costs of this part of Medicare would reduce the need for a draw-down of general funds. Any number of taxes might be considered for Medicare financing, including excise taxes aimed at encouraging healthier behaviors that also could reduce need for health care services, as well as taxes on health insurance benefits. New revenue aimed at encouraging healthier behavior could include increases in existing Federal excise taxes on alcohol and tobacco products to both discourage use and increase revenue. Federal taxes also could be extended to address other behaviors, such as foods associated with obesity and diabetes, with some or all of these new revenues dedicated to financing Medicare.
A variation on this option would be to dedicate an existing revenue stream to the Part A trust fund. This would not increase total Federal revenue, but would improve the financial status of the trust fund. For example, the Affordable Care Act (ACA) added a 3.8 percent tax on unearned income, called the “Unearned Income Medicare Contribution,” that was estimated to raise about $120 billion in revenue over 10 years (2010–2019).13 This new tax, effective January 2013, is applied to net investment income for taxpayers with modified adjusted gross income in excess of $200,000 for singles and $250,000 for married couples. Revenue from this provision, which is currently treated as general revenue, could be dedicated to the Medicare Part A trust fund.
OPTION 1.12a
Increase the Federal tax on alcohol products and dedicate all or a portion of the revenue to Medicare
Federally, different alcoholic beverages currently are taxed at different rates, with a much higher rate imposed on distilled spirits than on beer and wine. The National Coalition on Health Care (NCHC) has recommended equalizing the excise tax rate applied to all alcoholic products at a level that achieves the same monetary level achieved in 1991, the last time there was a tax increase on alcohol, and is further indexed to inflation (NCHC 2012).
Budget effects
CBO estimated that increasing taxes on all alcoholic beverages to a uniform $16 per proof gallon would result in $60 billion in new revenue over 10 years (2012–2021) (CBO 2011).14 The NCHC proposal likely would generate more revenue.
Discussion
Alcohol use has been associated with increased health care spending, which affects Medicare and other payers. Increasing the Federal excise tax would generate revenue to help offset these higher health care costs and would reduce use of alcohol, which could lower alcohol-related health care spending. According to CBO, the current excise tax, when adjusted for inflation, is lower than historical levels. The current tax accounts for 10-to 20 percent of the pretax price of alcohol, compared with 50 percent in 1950. However, the use of alcohol is not always unhealthy and the increased tax would fall on some people who are using alcohol in ways that do not increase health or social costs. In particular, studies have associated moderate use of wine with lower incidence of heart disease and stroke. Equalizing the tax rate on all forms of alcoholic beverages would result in proportionally larger tax increases on wine and beer relative to distilled spirits. In addition, some object to increases in this tax because it already is regressive (the tax represents a higher proportion of income for lower-income households than higher-income households) and an increase would exacerbate this.
OPTION 1.12b
Increase the Federal tax on tobacco products and dedicate all or a portion of the revenue to Medicare
Currently, the Federal excise tax on cigarettes and small cigars is $1.01 per pack. The NCHC has recommended increasing this tax by an additional $1 per pack and increasing the tax on other tobacco products equivalently.
Budget effects
CBO has estimated that a 50-cent per pack increase in the tax on cigarettes and small cigars beginning in 2013 and indexed to inflation would increase revenue by $41 billion over a nine-year period (2013–2021); net savings to Medicare from reduced health spending would total $250 million. The tax would have other budget effects (for example, reduced Medicaid spending and greater Social Security benefit payments). CBO estimates a net nine-year reduction in Federal spending of $730 million. The total budget impact would be $42 billion over nine years (2013–2021) (CBO 2012).
Discussion
Increasing the excise tax on cigarettes and other tobacco products would reduce use, improve health, and result in greater longevity. Research on the impact of price changes in use of tobacco has shown that teenagers would most likely reduce tobacco use if the tax were increased, and more young people would be discouraged from starting to smoke. In the long-term, however, improved longevity would increase Medicare spending and, combined with effects on Social Security and other programs, it would be the revenue-raising aspect of the tax alone that would improve the Federal deficit. The burden of this tax would be greatest on low-income people, who are more likely to smoke than others.
OPTION 1.12c
Impose a new Federal excise tax on sugar-sweetened beverages and dedicate all or a portion of the revenue to Medicare
This option would impose a new Federal excise tax on sodas, fruit drinks, and other beverages sweetened with sugar, high fructose corn syrup, or similar sweeteners.
Budget effects
In 2008, CBO estimated that an excise tax on sugar-sweetened beverages of three cents per 12 ounces would generate about $50 billion in revenue over 10 years (2009–2018).
Discussion
High consumption of sugar-sweetened beverages has been associated with increased incidence of obesity, diabetes, and other health conditions. A recent study found that a one cent per ounce tax would reduce consumption of sugar-sweetened beverages by 15 percent among adults ages 25-64 (Wang et al. 2012).
Reduced consumption might not improve overall health if people continue to consume other unhealthy foods, however. Like other excise taxes, this tax would be regressive and affect lower-income consumers more than others. Finally, no mechanism exists for a Federal tax on sugar-sweetened soft drinks, and a new tax on these items would require investments for administration and collection.
OPTION 1.12d
Increase taxes on employer-funded health insurance
The ACA includes an excise tax on high-cost employer plans beginning in 2018. To further increase revenue, the tax could be phased in more quickly and the thresholds reduced so that it applies to more plans. As enacted, the tax initially is expected to affect a small proportion of plans (7 percent in one estimate) (Congressional Research Service 2011), with this share growing over time. In addition to generating direct revenue, the tax is seen as encouraging employers and employees to shift to lower-cost plans, which in turn will increase Federal revenue by shrinking the portion of employee compensation that is not taxed.15 Part of the revenue raised by such a policy would go directly to the Part A trust fund in the form of payroll tax revenue; policy-makers could choose to dedicate all or a portion of the remaining revenue to Medicare.
Budget effects
In 2011, CBO estimated that beginning the tax on high cost plans in 2014 and lowering the threshold to initially include the top 20 percent of plans, and then indexing it to general inflation, would generate an additional $310 billion in revenue over 10 years (2012–2021). The revenue would be a combination of increased excise, income, and payroll taxes.
Discussion
The exclusion of employer health benefits from individual income and payroll taxes has long been viewed by economists as contributing to higher health care costs. Because of the exclusion from taxation, a dollar in health benefits has greater value to the employee than a dollar in wages, and over time employer health benefits expanded as a result. Extending the ACA tax to more employer coverage would therefore shift the incentives of the current system and encourage employers and employees to choose less costly coverage. However, growing health costs have led many employers to increase employee cost sharing, which already acts to reduce health spending. Lowering the thresholds to expand the number of plans subject to the tax could create inequities, such as taxing plans that are expensive because of the age and health status of the workforce, not the generosity of benefits. To the extent that employers respond to the new tax by shifting to less generous employee coverage, workers (or their dependents) with health problems would be forced to pay more out of pocket for health care, and some may avoid needed services.
Because some employers and employees would choose less costly health plans in order to avoid paying the excise tax, this option would increase Medicare payroll tax revenue. As spending on health benefits declined, the labor market likely would adjust to increase the amount of compensation that is paid in the form of wages subject to payroll and income taxes.
References
Click to expand/collapse
Boards of Trustees, Federal Hospital Insurance and Federal Supplementary Medical Insurance Trust Funds. 2012. 2012 Annual Report of the Boards of Trustees of the Federal Hospital Insurance and Federal Supplementary Medical Insurance Trust Funds, April 23, 2012.
Centers for Disease Control and Prevention (CDC). 2010. CDC Guide to Strategies for Reducing the Consumption of Sugar-Sweetened Beverages, March 2010.
Congressional Budget Office (CBO). 2011. Reducing the Deficit: Spending and Revenue Options, March 2011.
Congressional Budget Office (CBO). 2012. Raising the Excise Tax on Cigarettes: Effects on Health and the Federal Budget, June 2012.
Congressional Research Service (CRS). 2011. Health-Related Revenue Provisions in the Patient Protection and Affordable Care Act, February 10, 2011.
Joint Committee on Taxation. 2012. Estimates of Federal Tax Expenditures for Fiscal Years 2011–2015, January 17, 2012.
National Coalition on Health Care (NCHC). 2012. “Curbing Costs, Improving Care: The Path to an Affordable Health Care Future,” November 2012.
Jeffrey S. Passel and D’Vera Cohn. 2008. U.S. Population Projections: 2005–2050, Pew Research Center, 2008.
Y. Clare Wang et al. 2012. “A Penny-Per-Ounce Tax on Sugar-Sweetened Beverages Would Cut Health and Cost Burdens of Diabetes,” Health Affairs, January 2012.
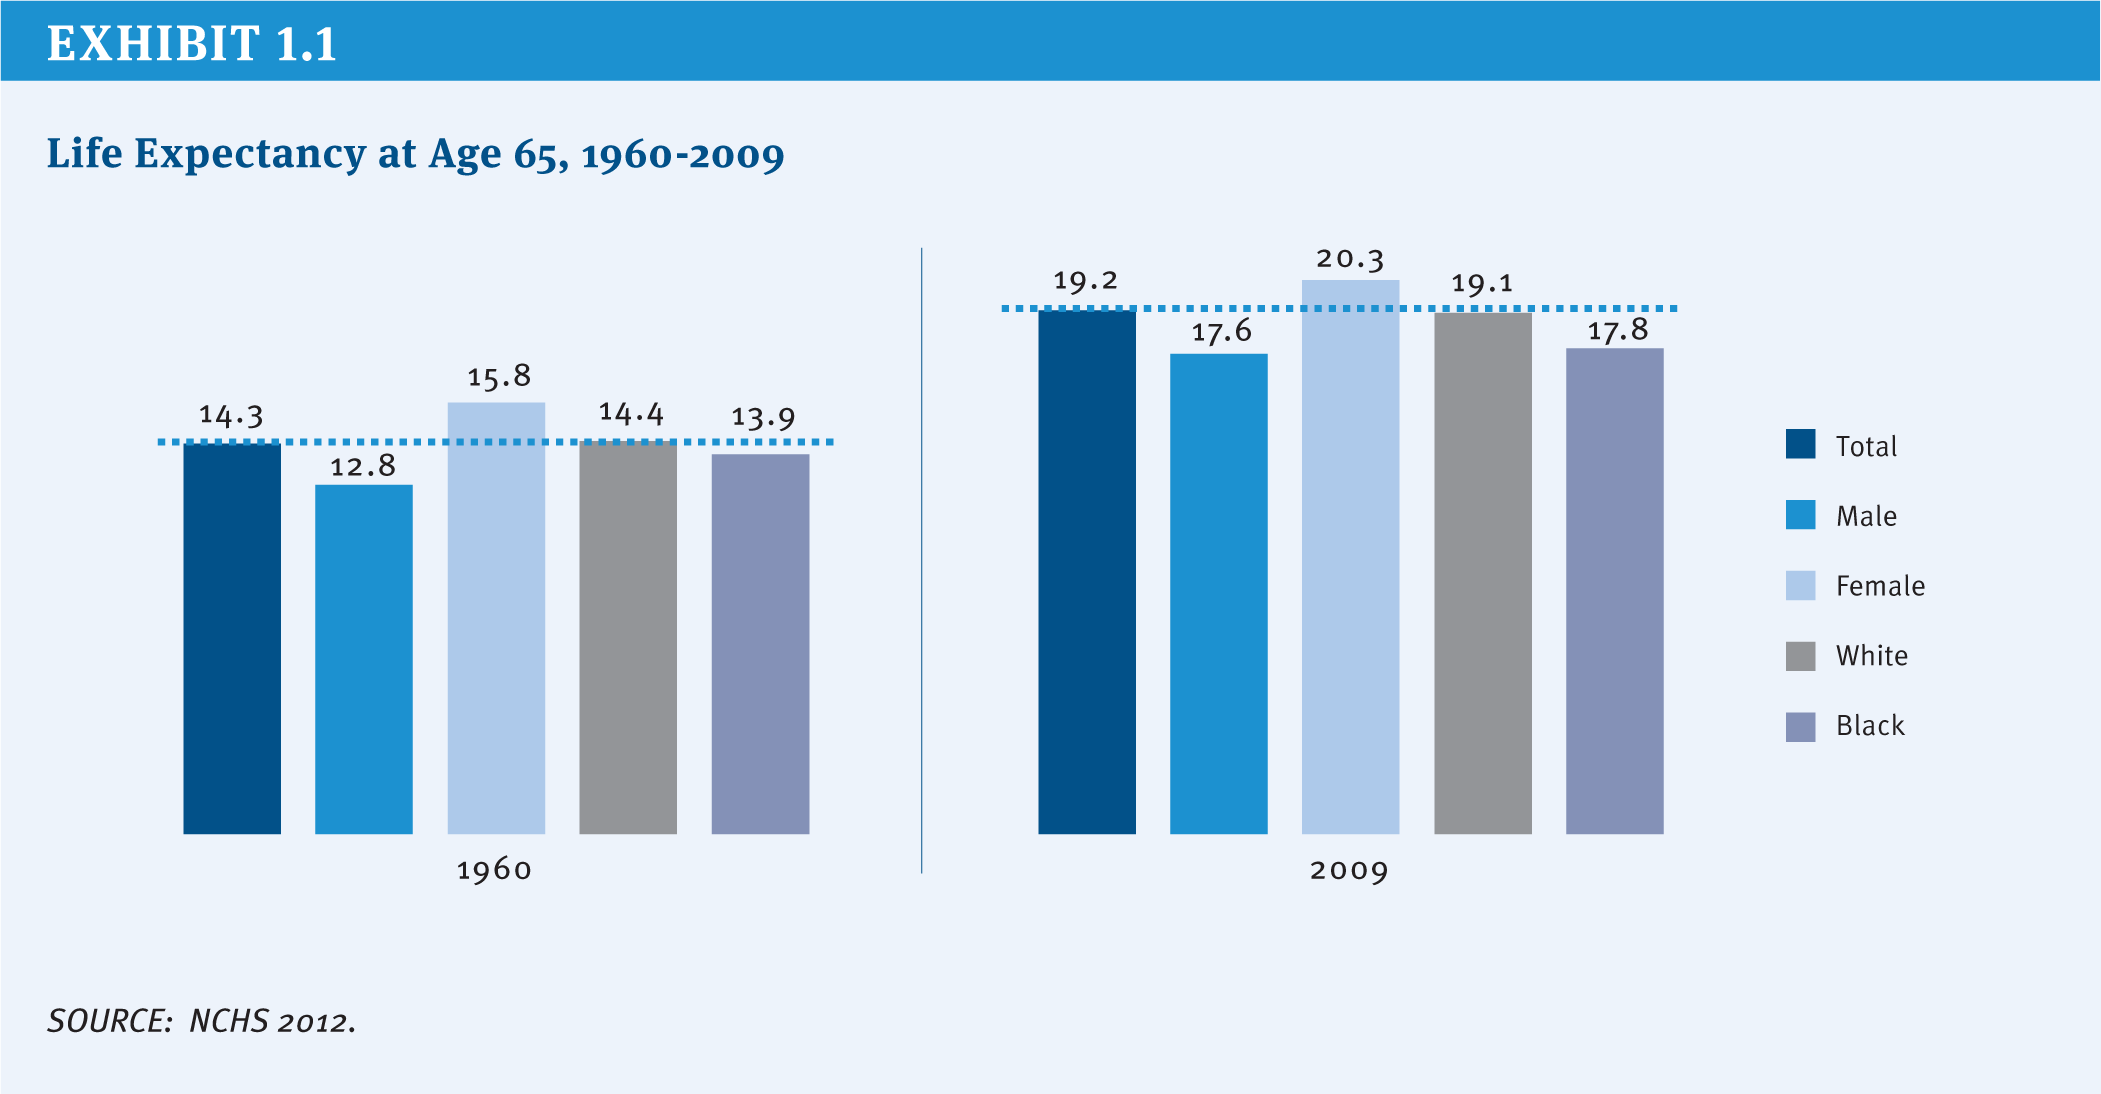
Exhibit 1.1: Life Expectancy at Age 65, 1960-2009
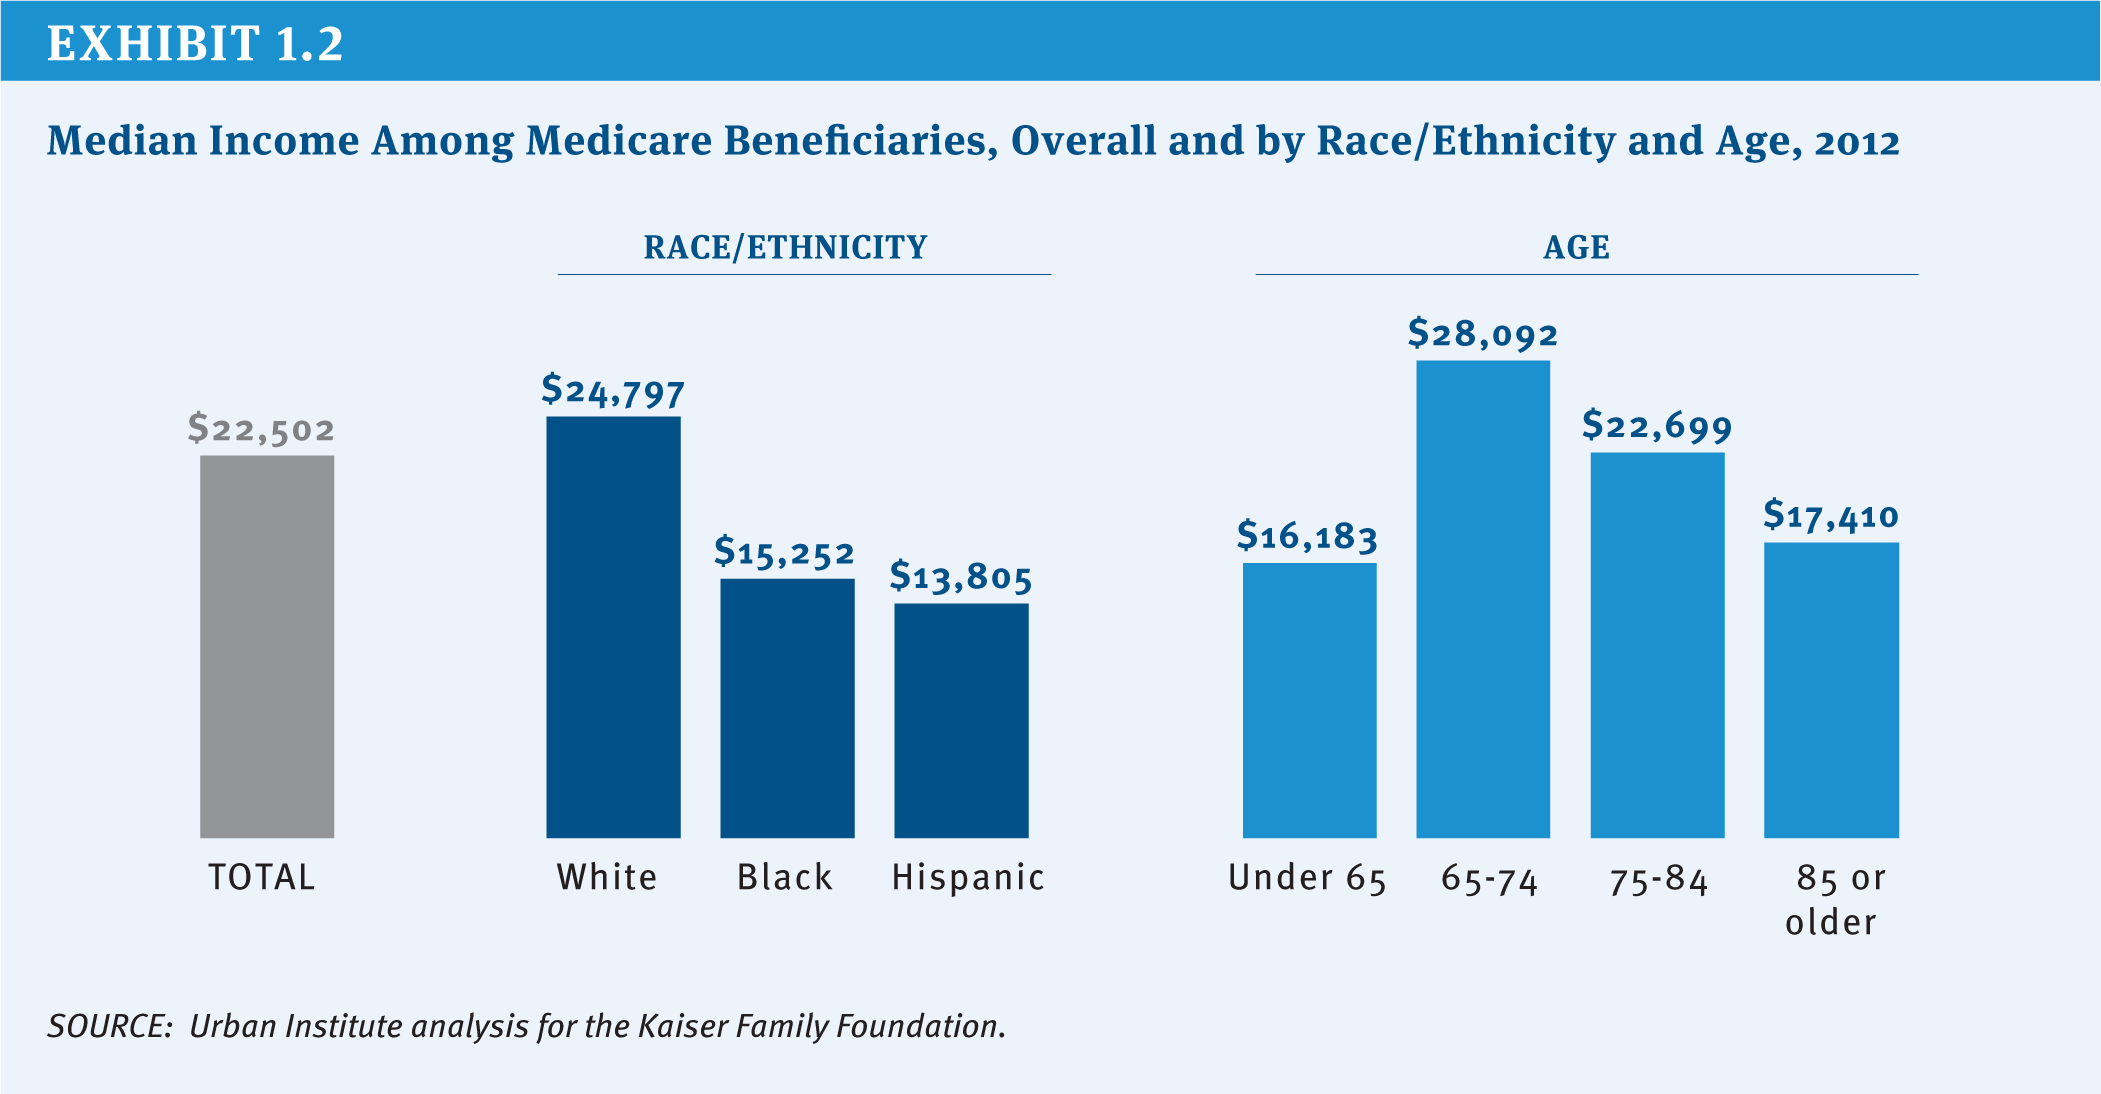
Exhibit 1.2: Median Income Among Medicare Beneficiaries, Overall and by Race/Ethnicity and Age, 2012
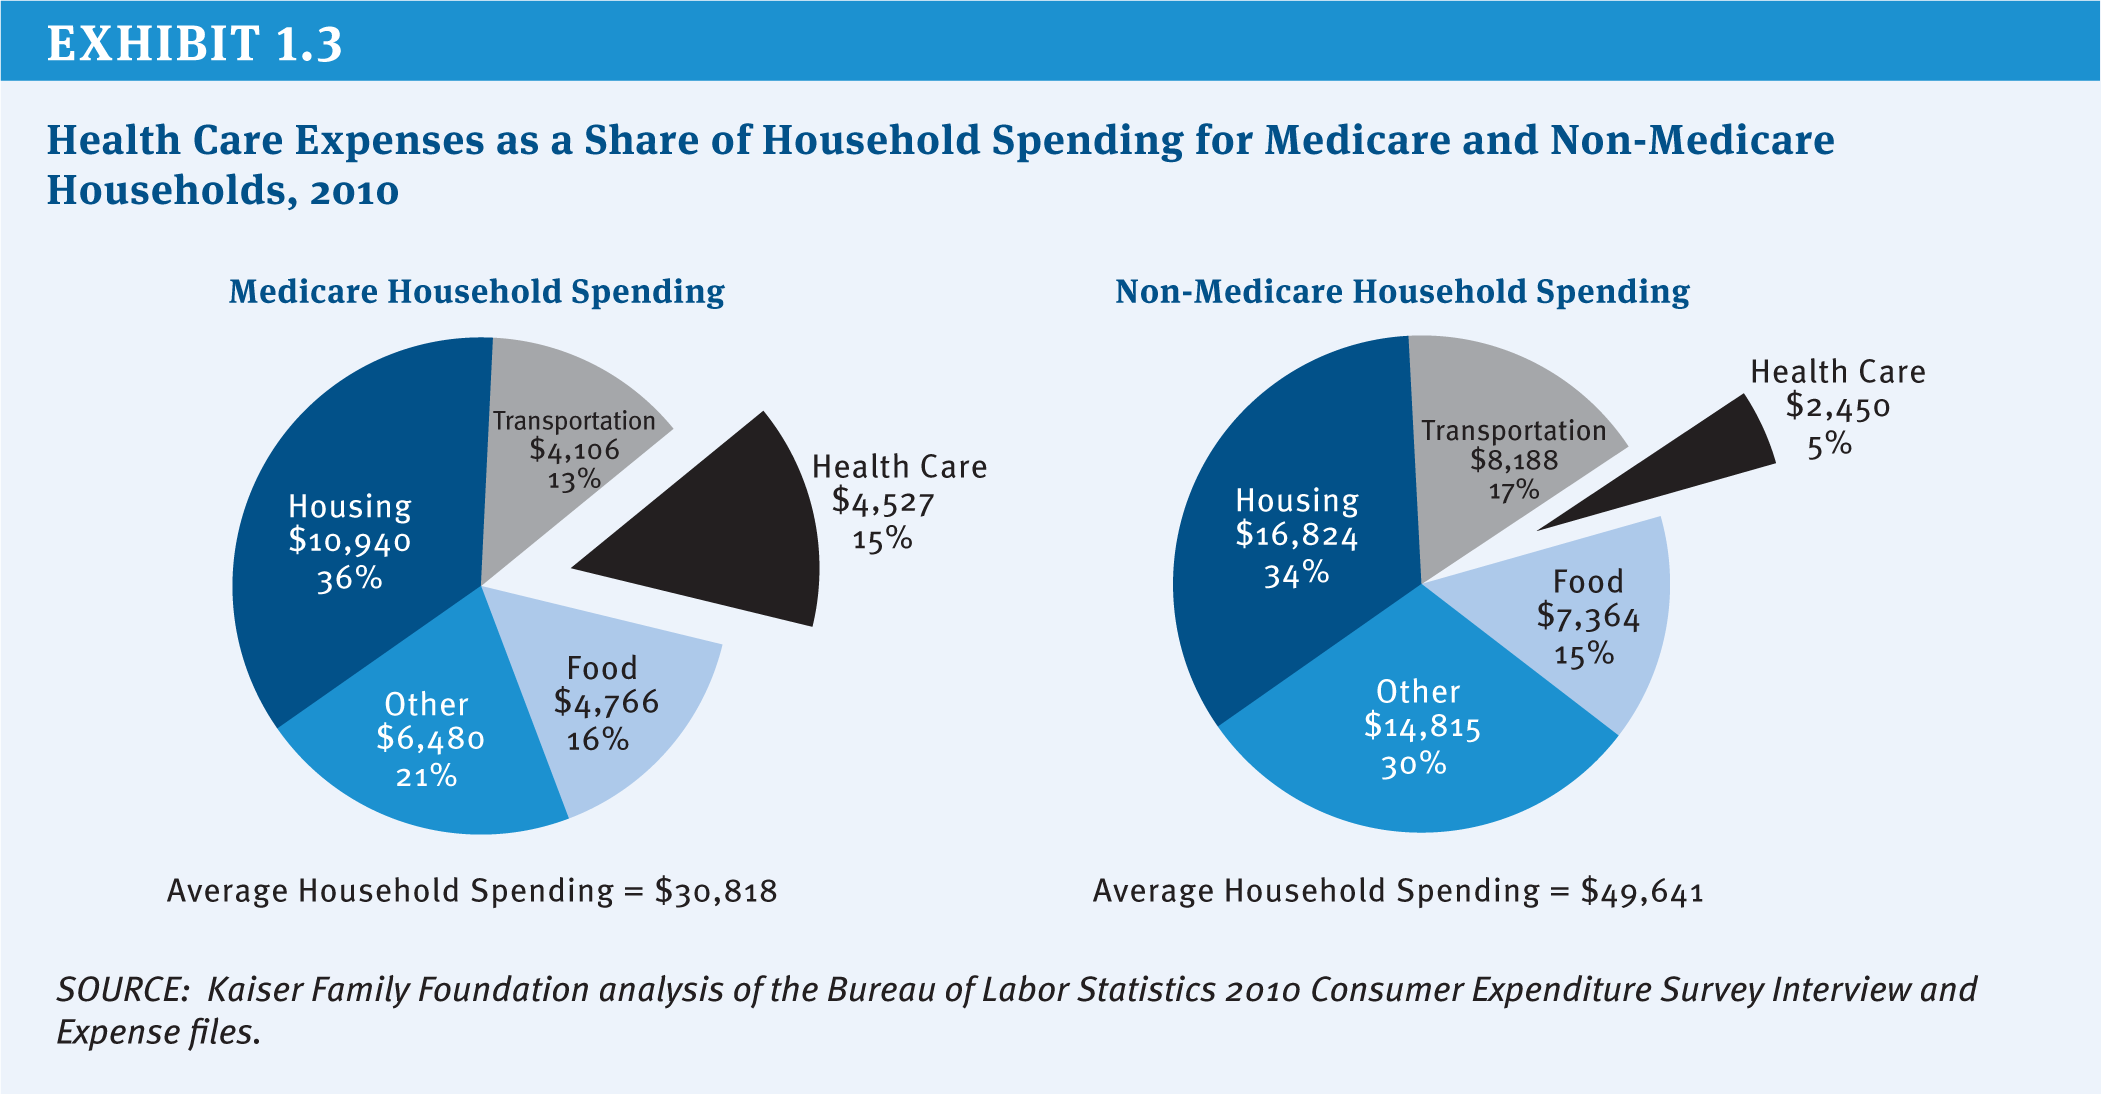
Exhibit 1.3: Health Care Expenses as a Share of Household Spending for Medicare and Non-Medicare Households, 2010
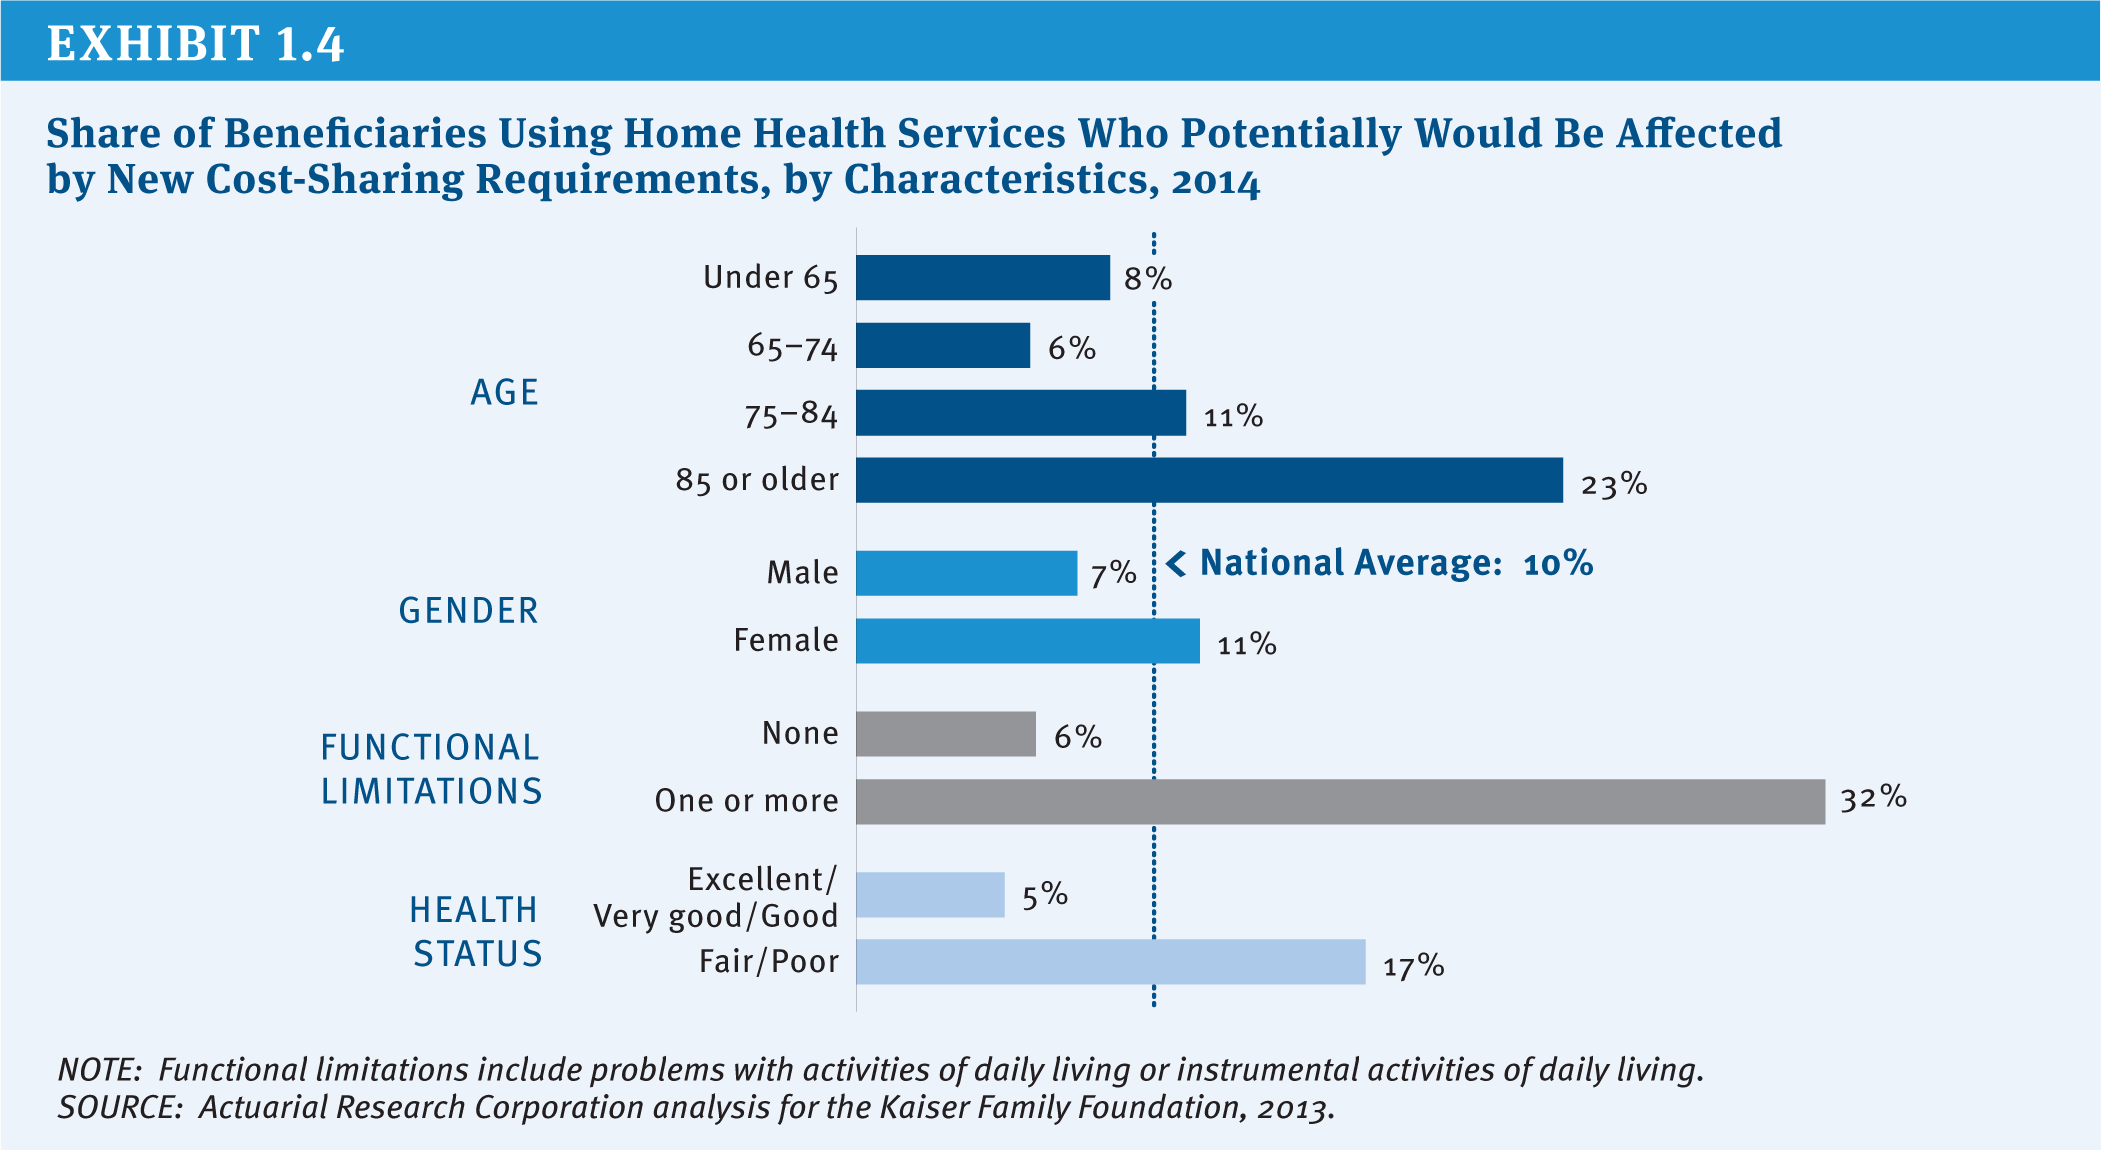
Exhibit 1.4: Share of Beneficiaries Using Home Health Services Who Potentially Would Be Affected by New Cost-Sharing Requirements, by Characteristics, 2014
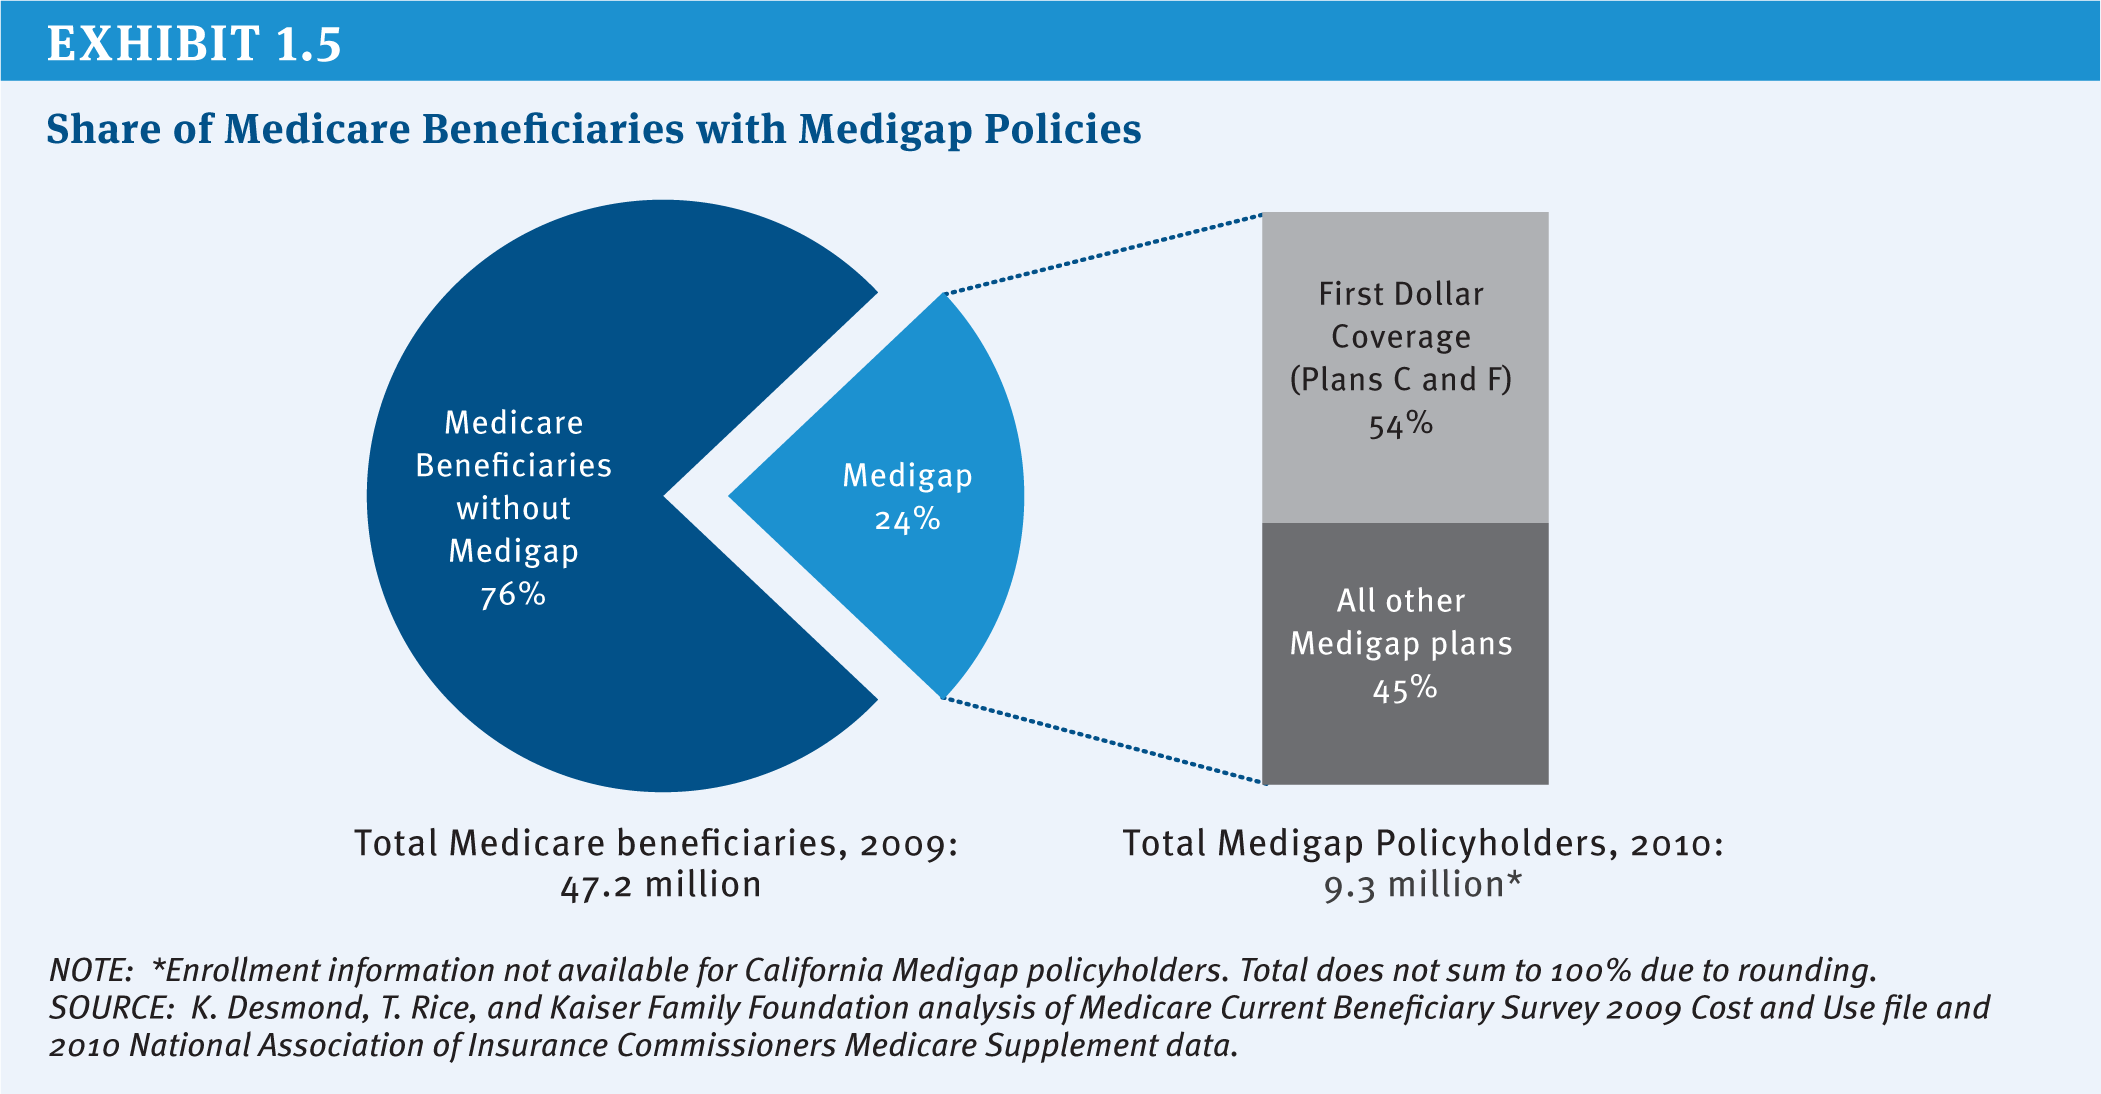
Exhibit 1.5: Share of Medicare Beneficiaries with Medigap Policies
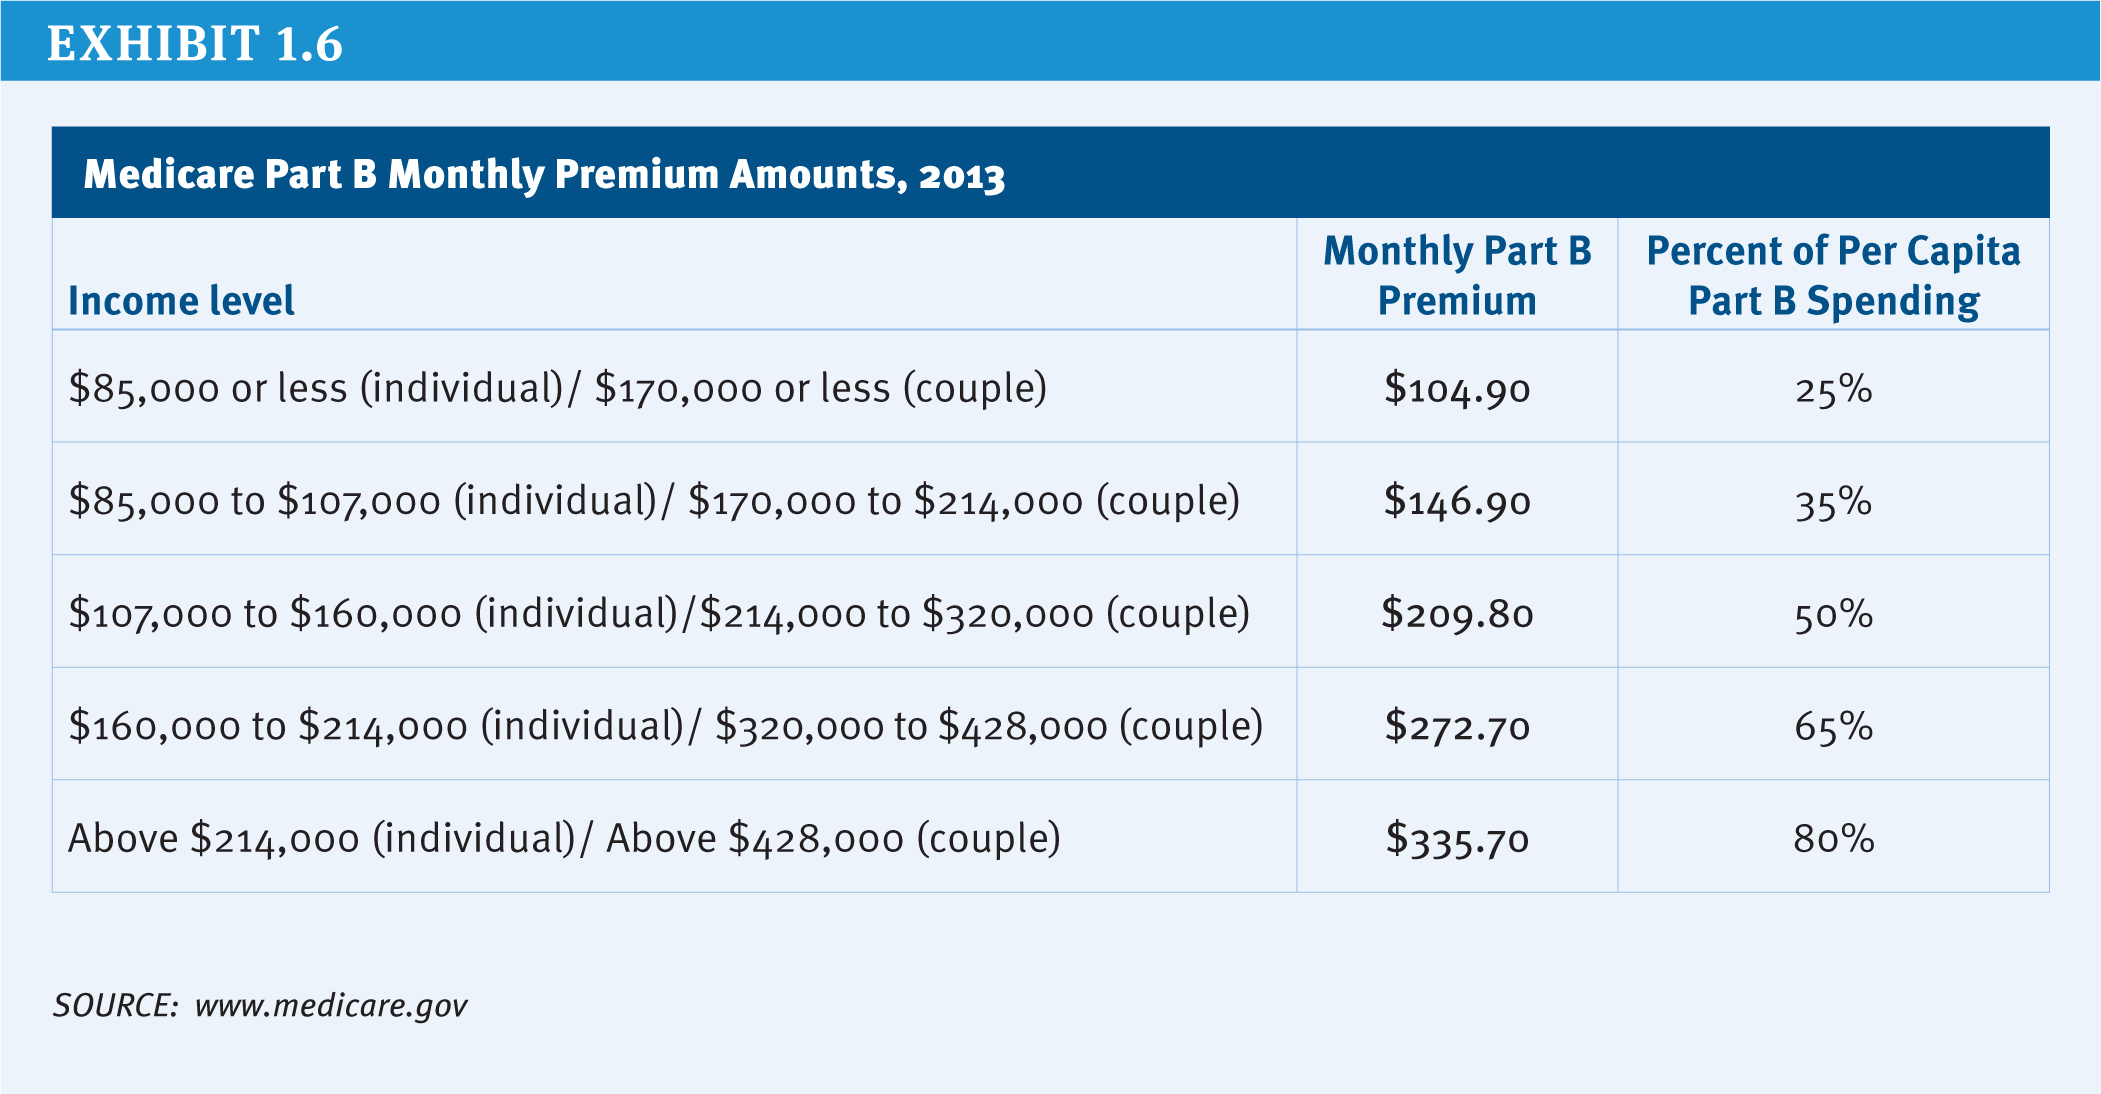
Exhibit 1.6: Medicare Part B Monthly Premium Amounts, 2013
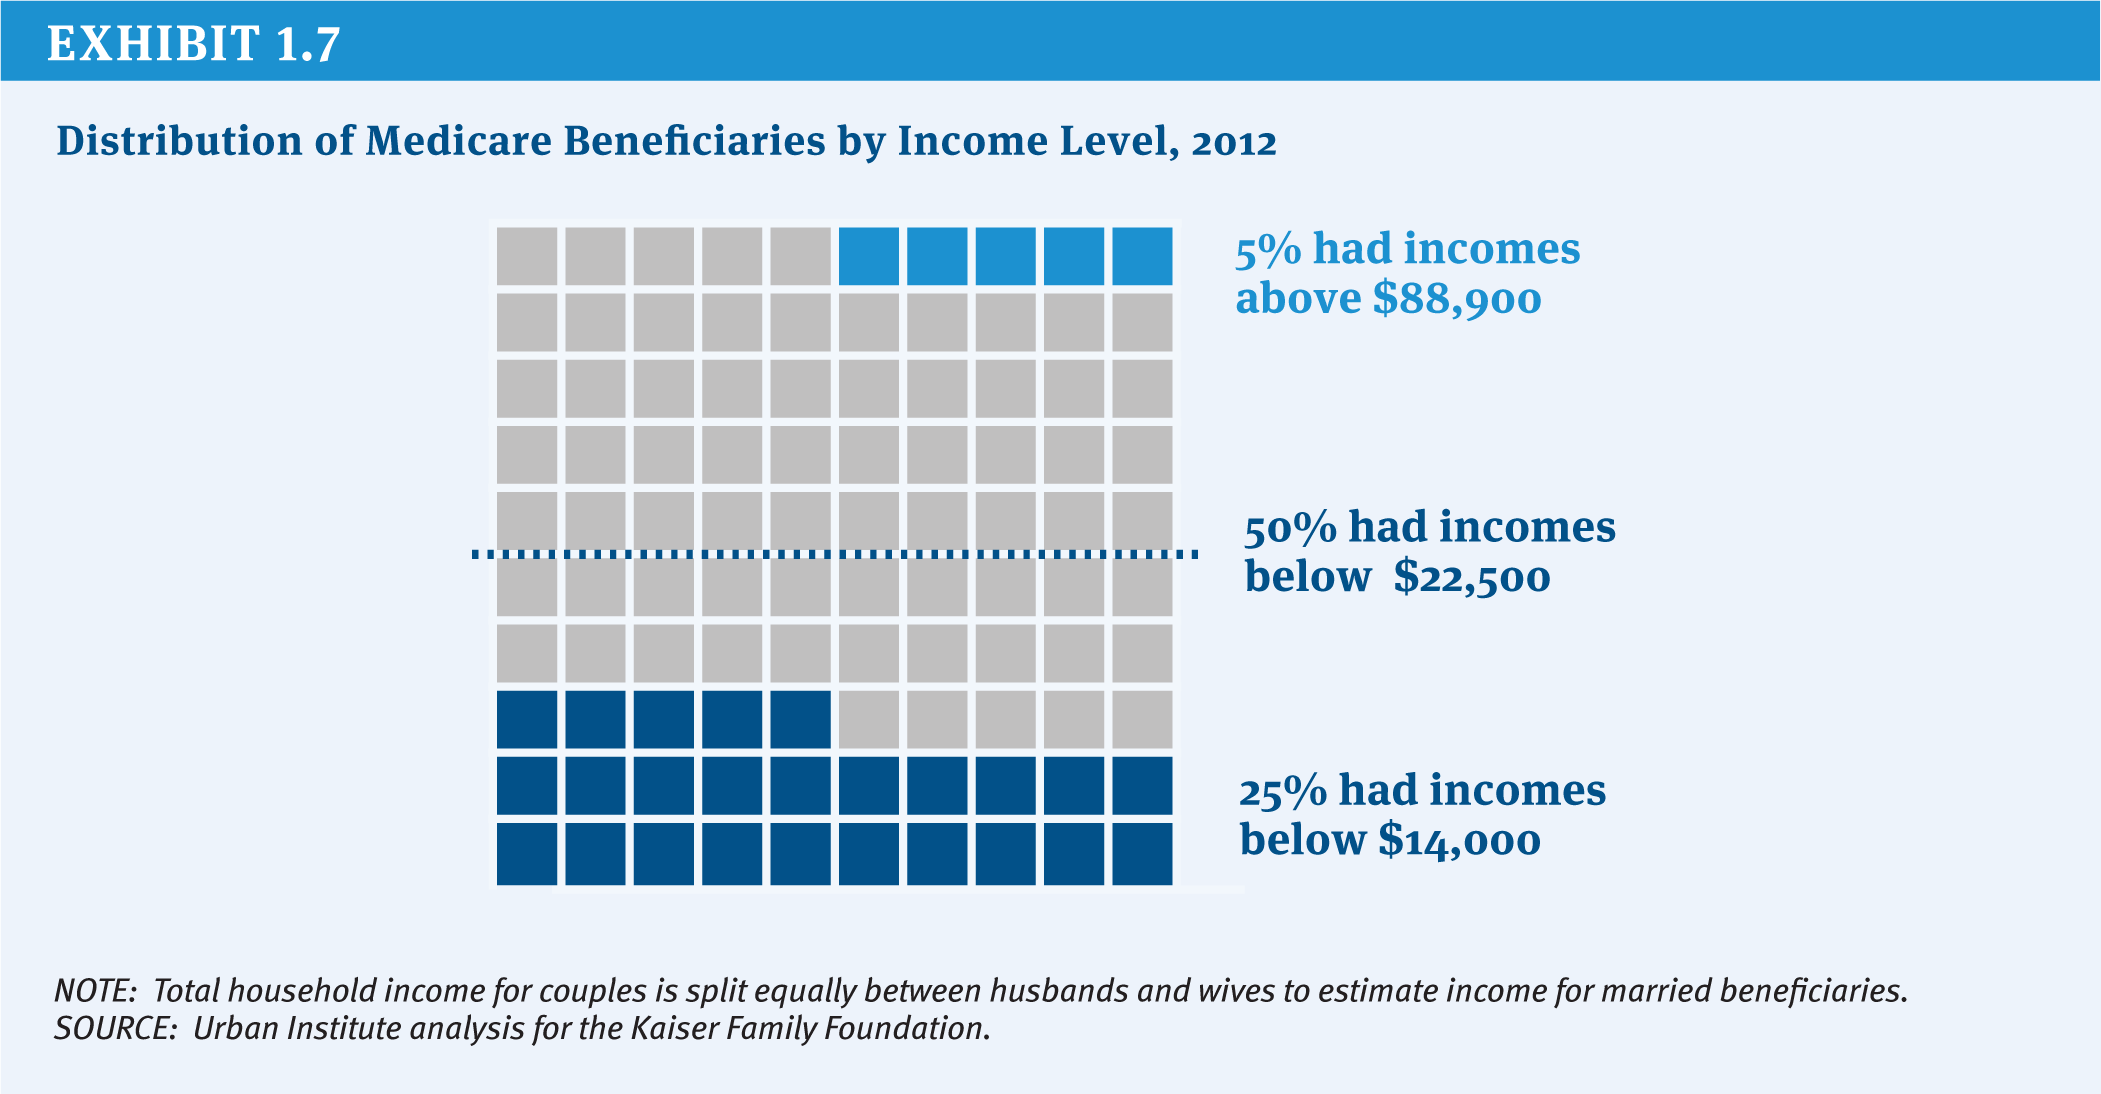
Exhibit 1.7: Distribution of Medicare Beneficiaries by Income Level, 2012
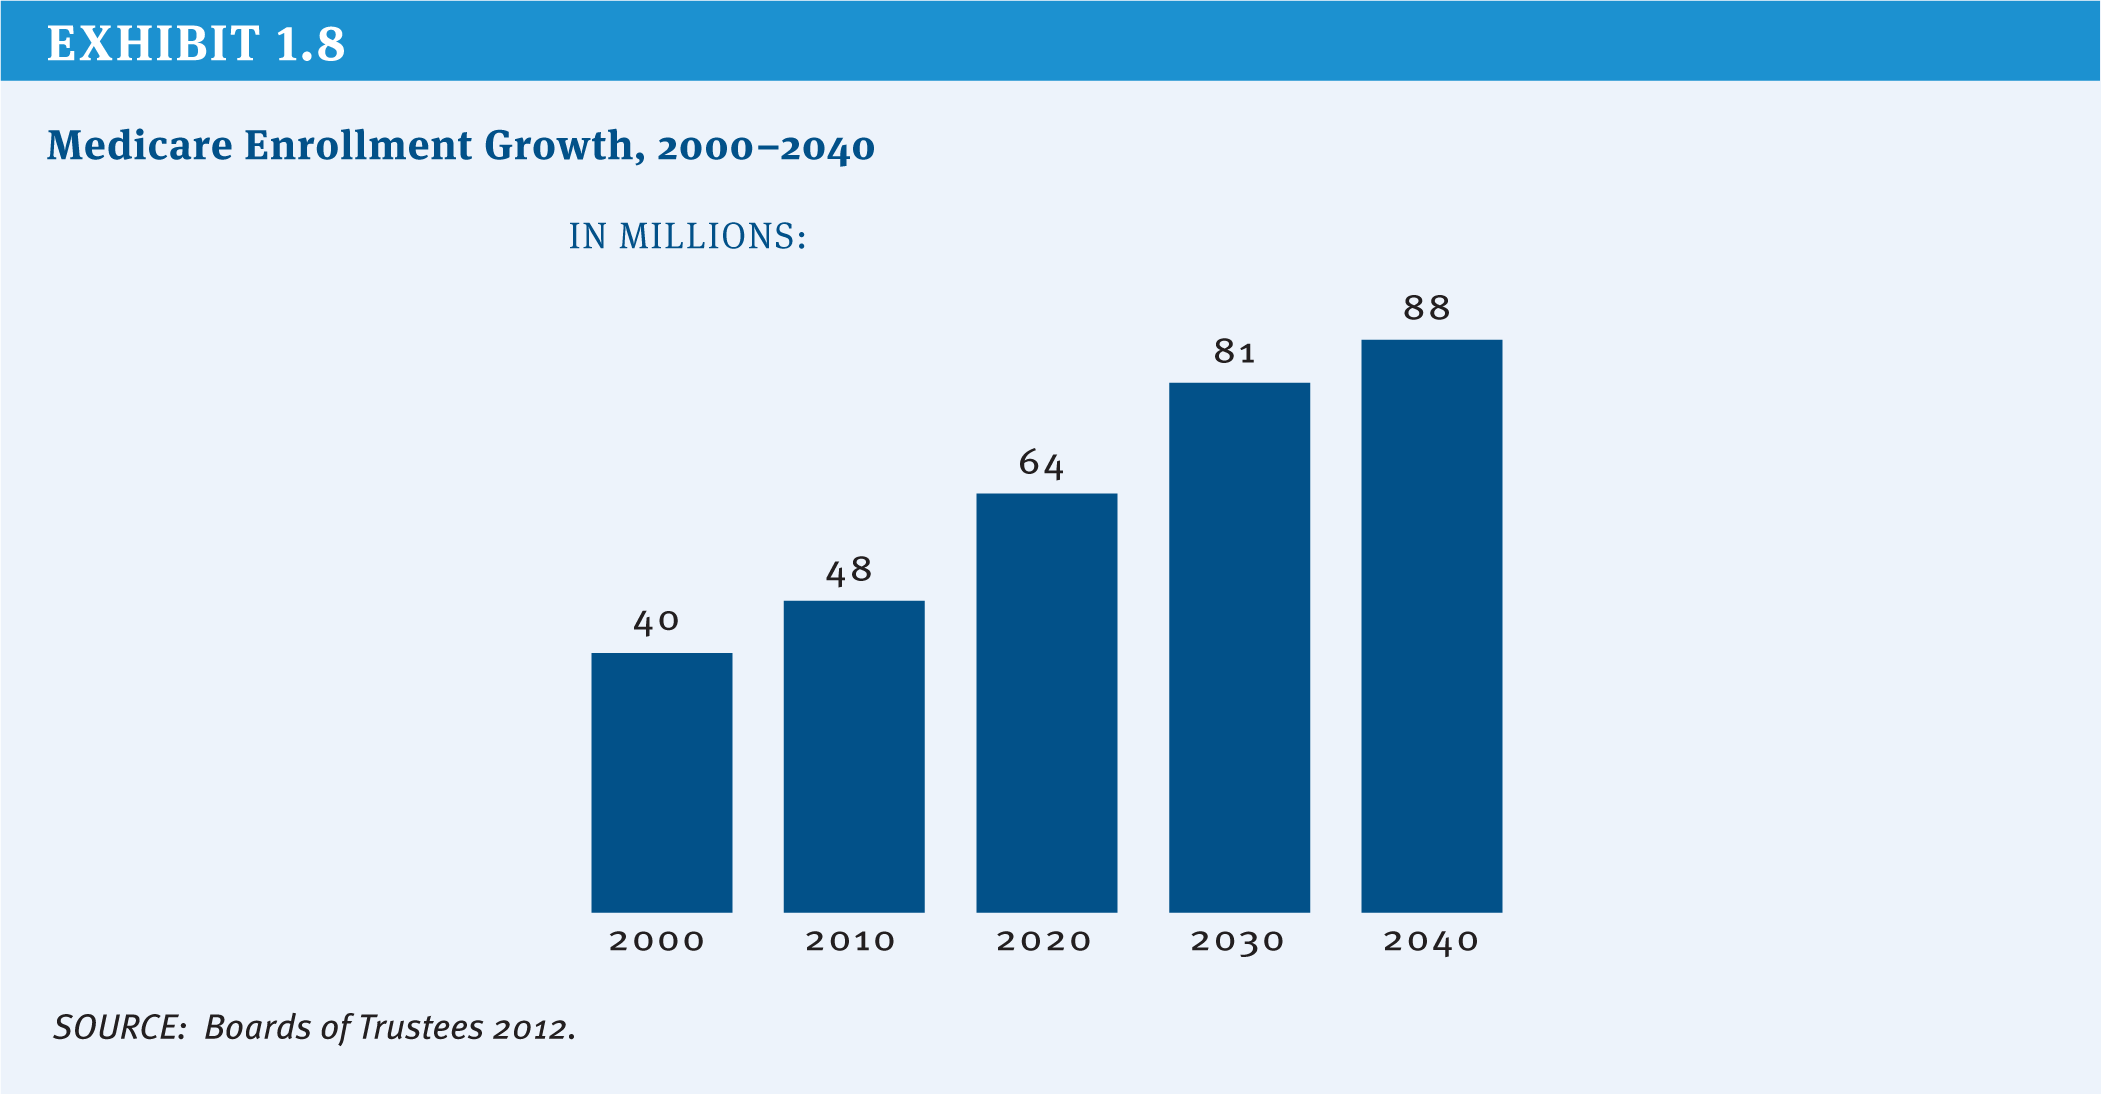
Exhibit 1.8: Medicare Enrollment Growth, 2000–2040
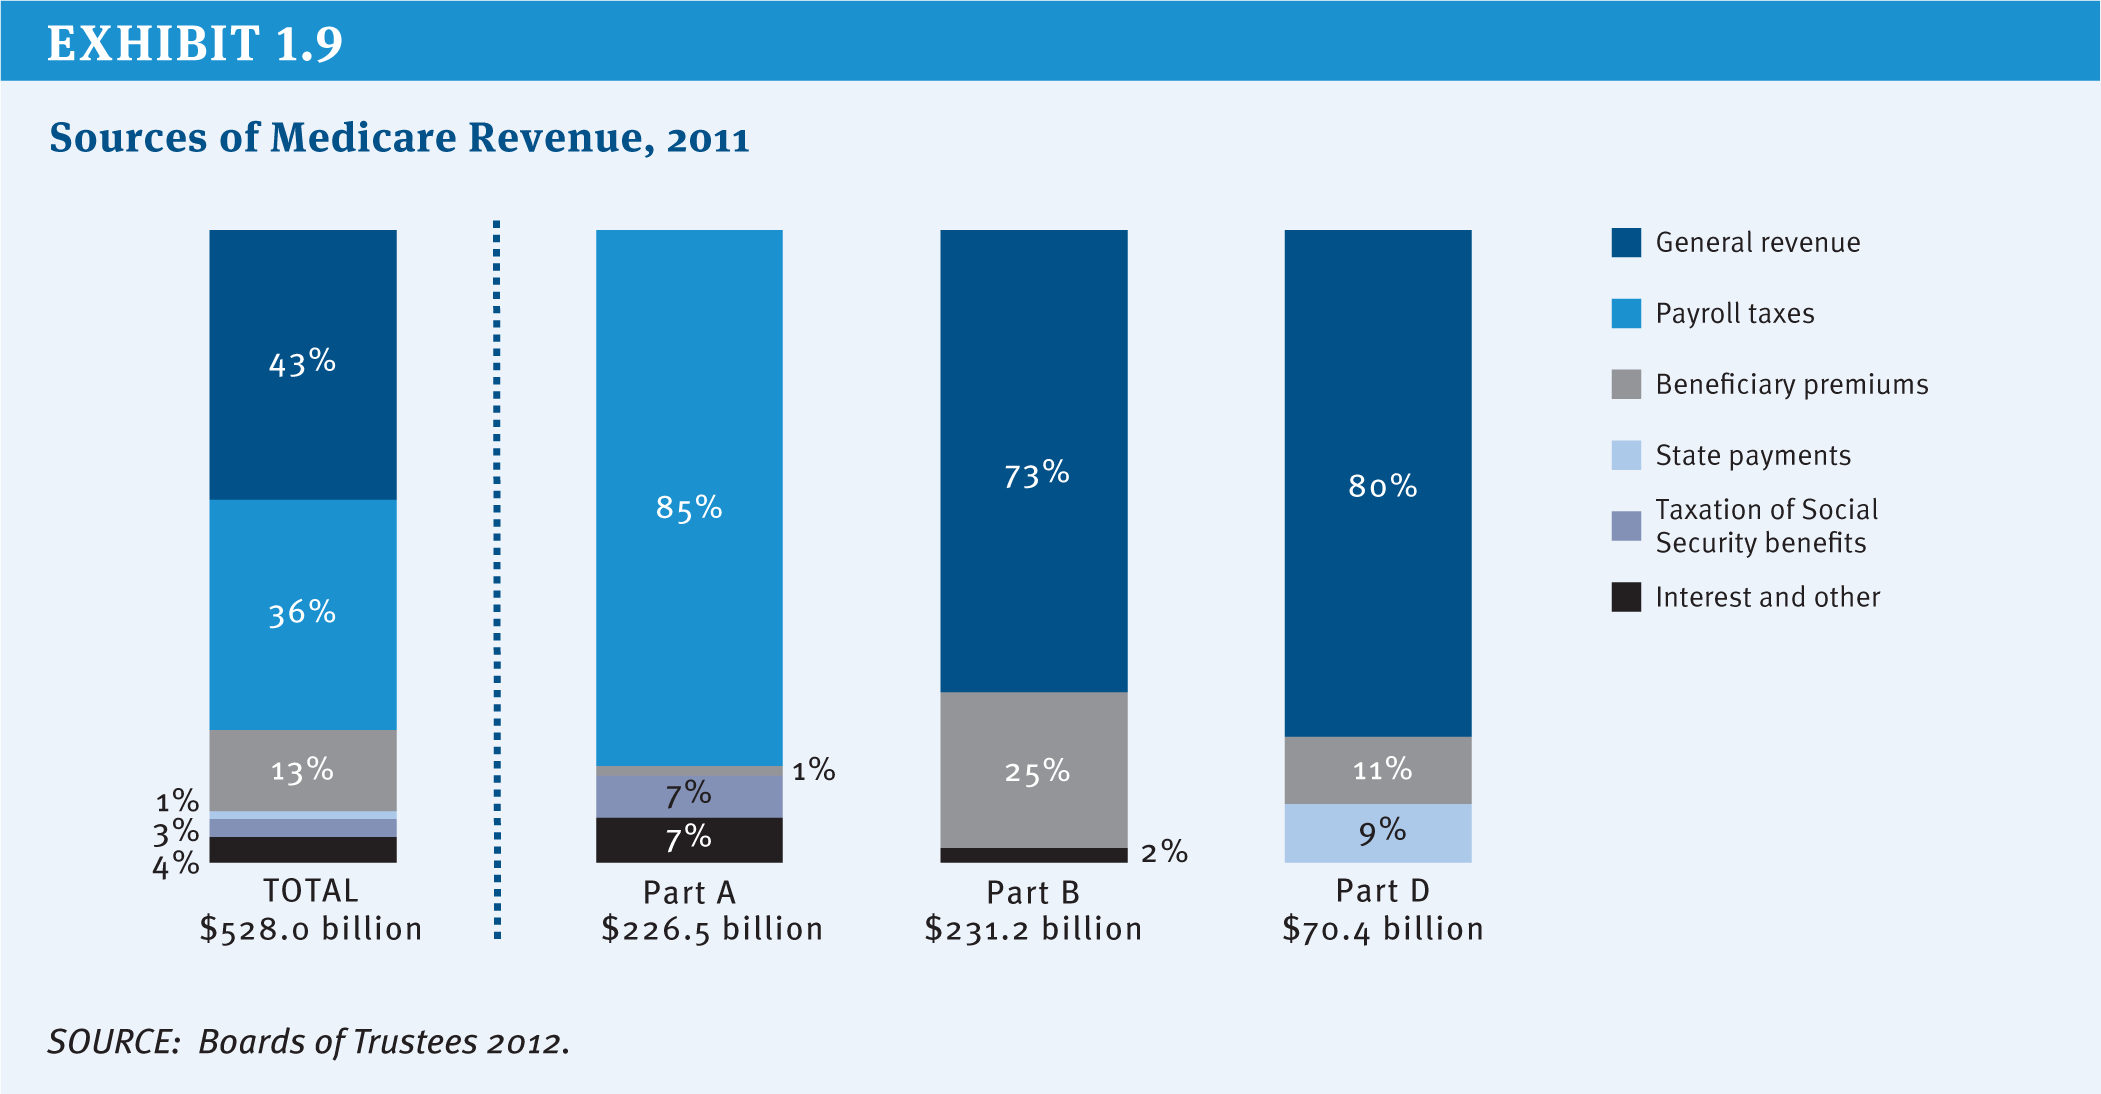
Exhibit 1.9: Sources of Medicare Revenue, 2011
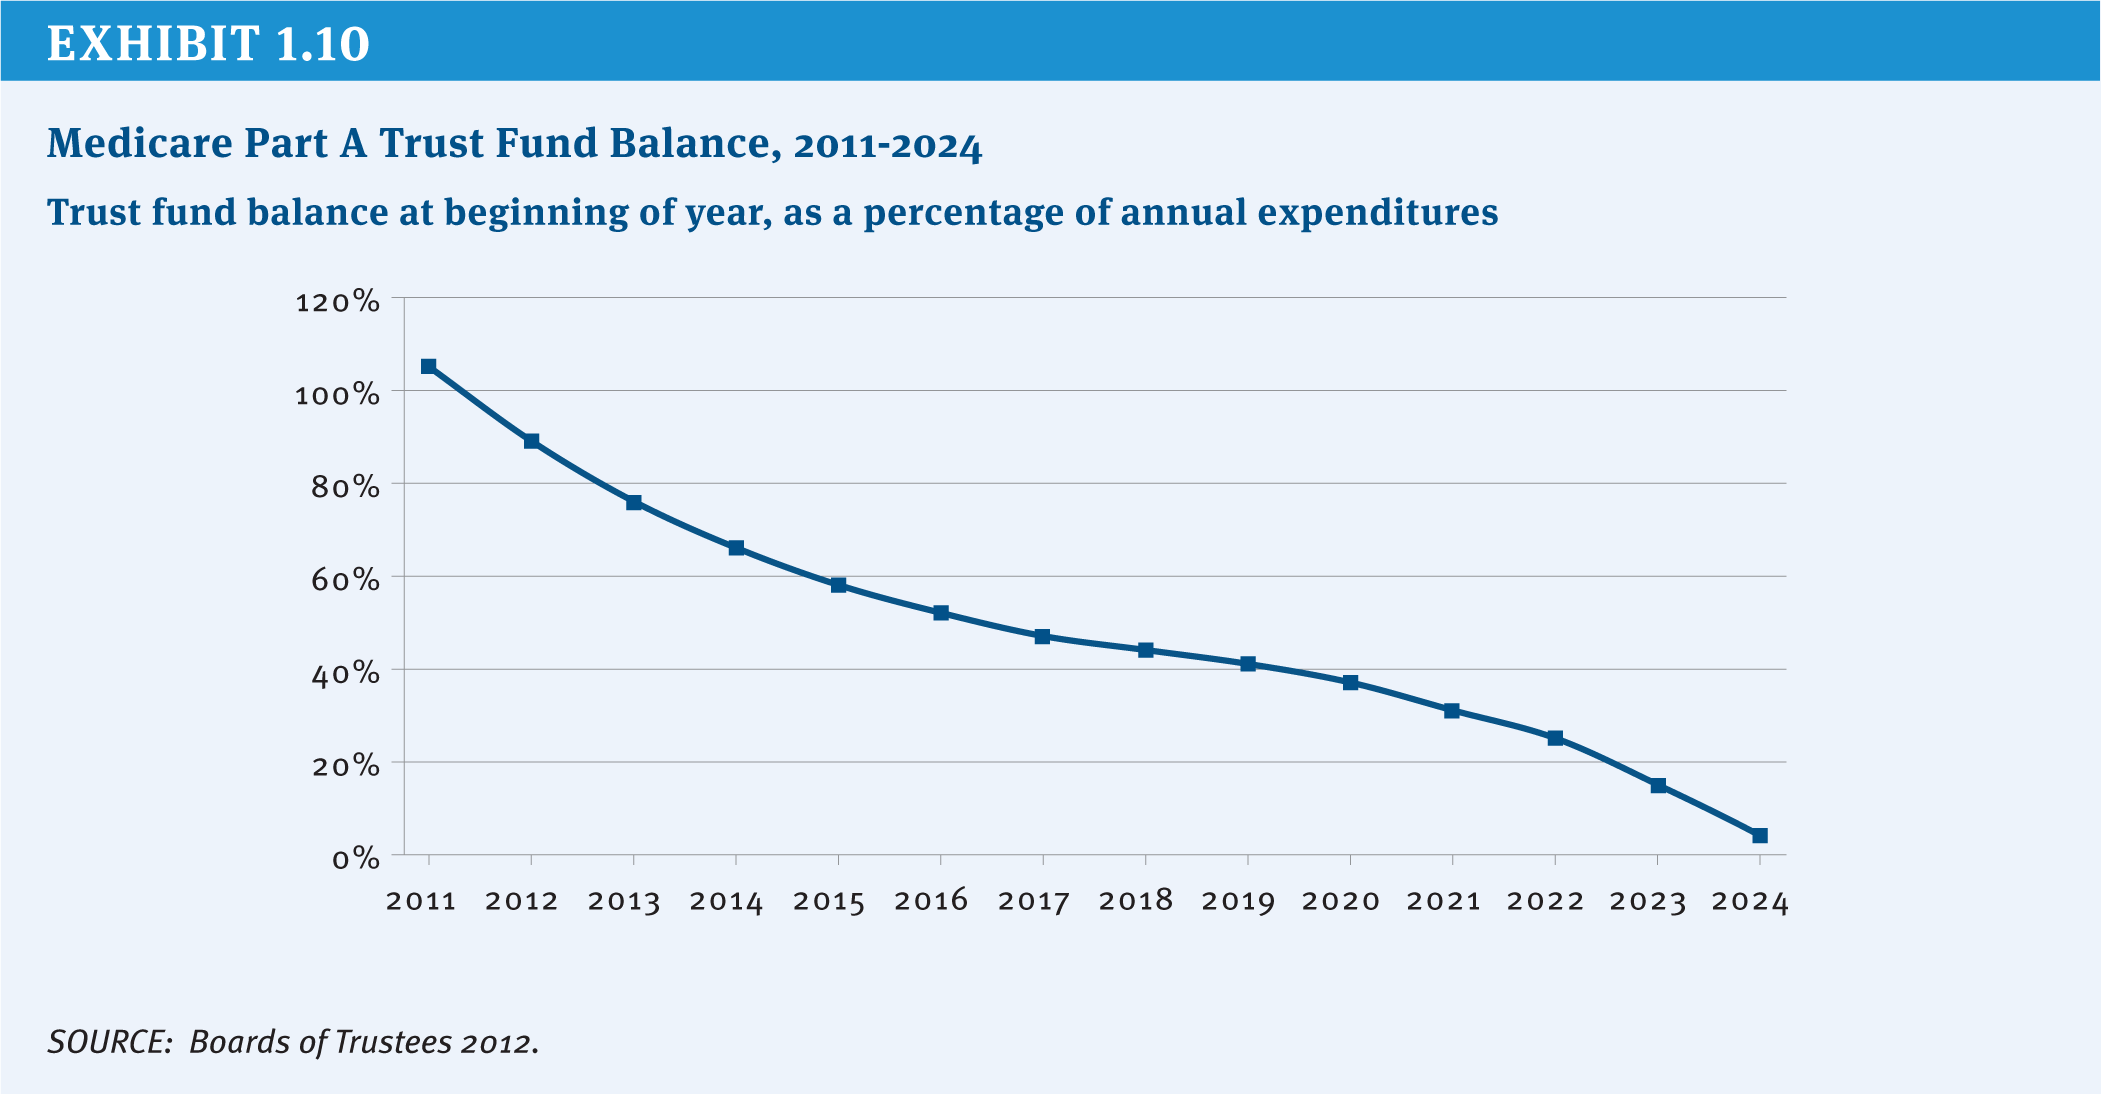
Exhibit 1.10: Medicare Part A Trust Fund Balance, 2011-2024
Section 2: Medicare Payments to Plans and Providers
.
Medicare Advantage
Options Reviewed
This section discusses four sets of options for reducing Federal spending on the Medicare Advantage program:
» Reduce Federal payments by lowering Medicare Advantage plan benchmarks
» Set payments to Medicare Advantage plans through competitive bidding
» Change the risk adjustment methodology
» Reduce or modify quality ratings and bonus payments
Since the 1970s, Medicare beneficiaries have had the option to receive their Medicare benefits through private health plans as an alternative to traditional Medicare. Policymakers have debated the appropriate role and level of payments for private plans in Medicare. The Affordable Care Act (ACA) made changes in the Medicare Advantage program, including reductions in payments and new quality-based bonus payments.
Perspectives on the Medicare Advantage program vary and policymakers arrive at a variety of answers to the following key questions, resulting in different policies for the program:
» Should plans be paid more for enrollees than the per capita costs of the traditional Medicare program, and if so, under what conditions?
» Should plans be rewarded for higher quality ratings (or penalized for lower ratings), and if so, how much, which plans, and under what rating system?
» Should plans be available to all beneficiaries in all parts of the country, and if so, what inducements, if any, should be offered to support plan participation in all areas?
Background
Since 2004, the number of Medicare beneficiaries enrolled in private plans has more than doubled from 5.3 million (13 percent of beneficiaries) to 13.1 million (27 percent of beneficiaries) in 2012, with large variations across counties (Exhibit 2.1). In some counties, such as Miami-Dade County in Florida and Multnomah County in Oregon, more than half of beneficiaries were enrolled in a Medicare Advantage plan in 2012. In contrast, in other counties, such as Cook County in Illinois and Baltimore County in Maryland, less than 12 percent of beneficiaries were enrolled in a Medicare Advantage plan in 2012.
Private plans in the Medicare Advantage program are paid a capitated amount per enrollee to provide all Medicare Part A and B benefits. In addition, Medicare makes a separate payment to plans for providing prescription drug benefits under Medicare Part D (see Section Two, Prescription Drugs for options related to Part D). Since 2006, Medicare has paid plans under a process that compares bids with benchmarks. Plans submit bids based on estimated costs per enrollee for services covered under Medicare Parts A and B. The bids then are compared to benchmark amounts that are set by a formula established in statute and vary by county (or region in the case of regional PPOs), based in part on traditional Medicare costs in the area. The benchmark is the maximum amount Medicare will pay a plan in a given area. If a plan’s bid is higher than the benchmark, enrollees who choose that plan must pay the difference between the benchmark and the bid in the form of a monthly premium (in addition to the Medicare Part B premium). If the bid is lower than the benchmark, the plan and Medicare split the difference between the bid and the benchmark; the plan’s share, known as a “rebate,” varies by the plan’s quality rating and must be used to provide supplemental benefits to enrollees. Medicare payments to plans are then risk adjusted based on enrollees’ risk profiles, including demographic and health status information.
Based on data showing Medicare Advantage plans were being paid, on average, more than the cost of traditional Medicare in their areas, the ACA reduced the benchmarks and tied them to the costs of traditional Medicare in the county, ranging from 95 percent (in high-cost counties) to 115 percent (in low-cost counties) of per capita traditional Medicare spending in the county (see (Exhibit 2.2) for the share of Medicare Advantage enrollees residing in higher-cost and lower-cost counties in 2012). As a result, any changes in the costs of traditional Medicare, such as reductions in payments to providers, directly affect payments to Medicare Advantage plans. The new benchmarks will be phased in between 2011 and 2017, with the length of the phase-in period varying by county; until the new (lower) benchmarks are fully phased in, the benchmarks are a blend between the old and new benchmark. Since January 2012, plans with higher quality ratings have been paid bonus payments, based on provisions in the ACA and a Centers for Medicare & Medicaid Services (CMS) demonstration, and are provided a larger rebate than plans with lower quality ratings.
Policy Options
Reduce Federal Payments by Lowering Medicare Advantage Plan Benchmarks
OPTION 2.1
Implement the Affordable Care Act benchmarks for the Medicare Advantage program over a shorter time period
The ACA reduced the benchmarks for all counties, with the transition to the new benchmarks phased in between two and six years (longer transition periods are provided in counties that would experience larger reductions in benchmarks). The majority of beneficiaries (80 percent) reside in counties where the transition will occur over six years. This option would fully implement the new benchmarks established in the ACA by phasing in new benchmarks from 2011 to 2015 rather than from 2011 to 2017, shortening the maximum phase-in period from six years to four years.
Budget effects
No cost estimate is available for this option. Implementing the new ACA benchmarks by 2015 rather than 2017 would reduce Medicare spending between 2014 and 2017 for the counties with the longest transition period.
Discussion
Proponents argue this option maintains the payment policies set forth in the ACA but implements the policy on an expedited schedule to achieve savings. Opponents argue that, in the counties with the largest changes in benchmarks, Medicare Advantage plans may not have sufficient time to adjust their care delivery models and business strategies, and thus may be more likely to raise their premiums, limit the benefits they offer, or withdraw from those counties or from the program entirely, requiring beneficiaries to pay more, change plans, or switch to traditional Medicare. The slower transition period may have been implemented to mitigate concerns about the dislocation of beneficiaries resulting from plans withdrawing from the Medicare Advantage program.
OPTION 2.2
Set benchmarks for the Medicare Advantage program equal to local costs of traditional Medicare
The ACA reduced the benchmarks for all counties and tied the benchmarks to the local per capita costs of traditional Medicare, but the benchmarks for some counties will be lower than the local per capita spending for traditional Medicare, while benchmarks for other counties will be higher than the local per capita spending for traditional Medicare. The approach was adopted partly based on research that showed that Medicare Advantage plan costs vary much less geographically than do costs within traditional Medicare (Berenson 2008). However, on a national basis, on average, the new benchmarks are projected to be about equal to local per capita spending for traditional Medicare (MedPAC 2010). Specifically, for the counties in the top quartile of traditional Medicare costs, benchmarks will be 95 percent of traditional Medicare costs, and for the counties in the bottom quartile of traditional Medicare costs, benchmarks will be 115 percent of traditional Medicare costs (MedPAC 2011).
This option would set the benchmark for each county equal to the projected local per capita spending for traditional Medicare. It would increase the benchmarks for the counties in the top quartile of traditional Medicare costs, make no change to the benchmarks for the counties in the second highest quartile of traditional Medicare costs, and reduce the benchmarks for the counties in the third highest and bottom quartiles of traditional Medicare costs. In other words, the reduction in payments to counties with the lowest traditional Medicare costs would be offset by higher payments to counties with the highest traditional Medicare costs.
Budget effects
No current cost estimate is available for this option. Setting the benchmarks equal to local per capita costs of traditional Medicare would produce small savings, if any, once the new ACA benchmarks are fully implemented. In 2008, CBO estimated that setting the benchmarks equal to local per capita costs of traditional Medicare would reduce Federal spending by $157 billion over 10 years (2010–2019), if implemented in 2011; however, this estimate was produced prior to the enactment of the ACA (CBO 2008). Since the new ACA benchmarks are projected to be equal to the costs of traditional Medicare, on average, the actual Federal savings from this option would be small, if any Federal savings were produced.
Discussion
An argument in favor of this option is that Medicare would pay no more for enrollees in Medicare Advantage plans than it would have paid if they had remained in traditional Medicare, regardless of where the enrollee lives. This argument appeals to those who believe the Medicare program should be neutral as to whether beneficiaries decide to enroll in Medicare Advantage plans or traditional Medicare. An argument against this option is that in the counties with lower traditional Medicare costs (which tend to be more rural areas), the reduction in benchmarks could lead Medicare Advantage plans to raise their premiums, limit the benefits they offer, or withdraw from certain regions or from the program entirely, requiring beneficiaries to pay more, change plans, or switch to traditional Medicare.
OPTION 2.3
Set benchmarks equal to local costs of traditional Medicare in counties in which benchmarks for Medicare Advantage plans are higher than local costs of traditional Medicare
The ACA reduced the benchmarks for all counties and tied the benchmarks to the local per capita costs of traditional Medicare, but the benchmarks for some counties will be lower than the local per capita spending for traditional Medicare, while benchmarks for other counties will be higher than the local per capita spending for traditional Medicare.
This option would set the benchmark equal to the projected local per capita spending for traditional Medicare in counties with benchmarks higher than the local costs of traditional Medicare (Feder et al. 2012). This option would reduce the benchmarks for the counties in the third highest and bottom quartiles of traditional Medicare costs and make no change to the benchmarks for the counties in the top quartile and second highest quartile of traditional Medicare costs. This option is identical to Option 2.2 for counties in which the benchmark is higher than traditional Medicare costs, but differs from Option 2.2 in that it would retain the current law benchmark for counties in the top quartile, with benchmarks equal to 95 percent of traditional Medicare costs.
Budget effects
No cost estimate is available for this option. If the benchmarks had been set equal to local per capita costs of traditional Medicare for the counties with benchmarks higher than traditional Medicare costs in 2012, Medicare spending would have been between $2 billion and $4 billion lower in 2012.
Discussion
An argument in favor of this option is that Medicare would pay no more for enrollees in Medicare Advantage plans, and would continue to pay less in one-quarter of counties, than it would have paid if they had remained in traditional Medicare, regardless of where the enrollee lived. This argument appeals to those who believe that private Medicare Advantage plans should be at least as efficient as the traditional Medicare program. Some also argue that this option would promote efficiency in the Medicare Advantage market while reducing Medicare spending. Additionally, some argue that paying plans less than traditional Medicare in some counties could help to counter the findings of some research indicating that plans are selectively enrolling healthier enrollees (MedPAC 2012). However, similar to the effects of Option 2.2 above, an argument against this option is that in the counties in which benchmarks are higher than traditional Medicare costs (which tend to be more rural areas), the reduction in benchmarks could lead plans to raise premiums, cut benefits, or withdraw from certain regions or entirely from the program, requiring beneficiaries to pay more, change plans, or switch to traditional Medicare. This option might preserve choice between Medicare Advantage and traditional Medicare only for beneficiaries residing in counties with average or higher traditional Medicare costs.
Set Payments to Medicare Advantage Plans Through Competitive Bidding
OPTION 2.4
Establish benchmarks for the Medicare Advantage program through competitive bidding
Under current law, payments to Medicare Advantage plans are based on benchmarks defined under current law, as noted above. This option would use a new approach to determine the benchmarks that would be based solely on the average plan bid in each county, with each plan’s bid weighted by its enrollment in the previous year. The benchmarks established by a competitive bidding process would be subject to a ceiling (no greater than the benchmarks under current law) to ensure that benchmarks and Medicare spending are not inflated by this methodology. Beneficiaries enrolled in a Medicare Advantage plan with a bid higher than the benchmark would pay an additional premium. Beneficiaries enrolled in a plan with a bid lower than the benchmark would receive supplemental benefits equal to the value of the difference between the plan bid and the benchmark. Traditional Medicare would not be a bidding plan under this option.
Under current law, beneficiaries enrolled in a plan with a bid lower than the benchmark receive supplemental benefits equal to 75 percent of the difference between the plan bid and the benchmark, and most plans provide some supplemental benefits. Under this option, only the plans with bids lower than the average bid in the county could provide supplemental benefits, but beneficiaries enrolled in those plans would receive supplemental benefits equal to 100 percent of the difference between the plan bid and the benchmark, providing beneficiaries with stronger incentives to enroll in the plans with the lowest bids.
Budget effects
No current cost estimate is available for this option. In 2008, CBO estimated that establishing benchmarks through competitive bidding would reduce Federal spending by $158 billion over 10 years (2010–2019), if the program began in 2012 and assuming benchmarks would be subject to a ceiling no greater than the benchmarks under current law (CBO 2008). However, this estimate was produced prior to the enactment of the ACA, which reduced the benchmarks in the Medicare Advantage program; thus, the actual savings from competitive bidding, if fully implemented in 2012, would be smaller.
Discussion
Proponents of this option believe it could lower benchmarks and increase price competition among plans, encouraging plans to obtain larger discounts from providers, provide supplemental benefits valued by beneficiaries, and manage care more efficiently. An argument against this option is that it would reinforce an uneven playing field between private plans and traditional Medicare, but in this case favoring traditional Medicare, especially in high-cost areas, by not requiring it to compete with private plans and improve its efficiency. For example, plans with bids above the benchmark would be required to charge beneficiaries an additional premium, even if the bid was lower than the average per capita costs of traditional Medicare in the county, providing beneficiaries a financial incentive to enroll in either traditional Medicare or a lower cost private plan. Over time, this option could lead some higher-cost plans to withdraw from the Medicare Advantage program, thereby reducing the number of private plans available to beneficiaries.
Demonstrations of competitive bidding among Medicare private plans have not been fully implemented in the past due to objections to traditional Medicare not being included as a plan bid and general opposition among stakeholders. Future attempts to implement competitive bidding in Medicare Advantage could encounter these issues as well, or different concerns may arise in a different environment. A similar option that included traditional Medicare as a plan bid would closely resemble an option for a premium support system (see Section Four, Premium Support).
Change the Risk Adjustment Methodology
Currently, Medicare prospectively adjusts payments to Medicare Advantage plans to reflect the expected costs and health risks of each enrollee. This risk adjustment is intended to compensate plans for enrolling sicker and more costly enrollees, and avoid overpaying plans that enroll healthier than average enrollees. Results from some studies have indicated that plans might be selecting against sicker beneficiaries, particularly within categories of diagnoses, suggesting that the current risk adjustment system may not be adequate (Brown et al. 2011; MedPAC 2012). Studies have also suggested that the differences in payments between Medicare Advantage plans and traditional Medicare may have actually increased after risk adjustment and led to an eight percent increase in total Medicare spending (Brown et al. 2011). While these findings suggest the need for a fundamental review of the current risk adjustment methodology or consideration of a payment approach that reduces the impact of favorable selection, such as partial capitation, by which some of the payment would be based on Medicare Advantage plans’ actual costs, there is still room to improve the current risk adjuster. The option below would make modifications to the existing risk adjustment system.
OPTION 2.5
Improve the risk adjustment system for Medicare Advantage plans
Under the current risk adjustment system for Medicare Advantage, each plan enrollee is assigned a risk score (with average risk equal to 1.0) based on relative health risk, which includes demographics and diagnoses based on the prior year of medical claims, as well as disabilities, institutional status and Medicaid status. The current model for adjusting Federal payments to plans for the health risk of their enrollees explains about 11 percent of the variation in Medicare spending (Pope et al. 2004). Research indicates that providers often do not consistently code conditions on claims from year to year. For example, a primary care provider may indicate on medical claims that a patient has diabetes when initially diagnosed, but might not indicate it on the following year’s claims if the patient’s diabetes is well-controlled and did not require medical attention. This inconsistency in coding of conditions results in greater fluctuations in risk scores and less stable payments to plans (MedPAC 2012). Several researchers, including MedPAC, have concluded that using two years of medical claims data would make the risk scores more stable and would improve the predictive accuracy of the risk adjustment model, particularly for beneficiaries with mental illness and beneficiaries with five or more chronic conditions (Frogner et al. 2011; MedPAC 2012).
This option would require CMS to use two years of historical medical claims data, rather than one year, and to include the number of medical conditions, to adjust the payments to Medicare Advantage plans for the demographics and health history of each plan enrollee. Because two years of diagnosis data would not be available for beneficiaries in their first or second year of Medicare eligibility, the current risk adjustment methodology could be used for these beneficiaries.
Budget effects
No cost estimate is available for this option. Using two years of medical claims data (when available) rather than one year and including the number of medical conditions in the risk adjustment model would increase payments for some Medicare Advantage plan enrollees and decrease payments for other enrollees. The option could reduce Medicare spending if it results in a net reduction in payments to Medicare Advantage plans.
Discussion
An argument in favor of this option is that using two years would help to more accurately identify beneficiaries’ conditions and provide a more stable revenue stream for Medicare Advantage plans by reducing year-to-year fluctuations in beneficiaries’ risk scores. An argument against this option is that it would increase the administrative burden of the Medicare Advantage program for both plans and CMS, while significantly improving the risk scores for only the sickest beneficiaries
Reduce or Modify Quality Ratings and Bonus Payments
OPTION 2.6
Terminate the Quality Bonus Demonstration in 2013
The ACA authorized plans with 4 or more stars to receive bonuses of 5 percent added to their benchmark in 2014 and subsequent years, with smaller bonuses for plans receiving 4 stars or 4.5 stars, and 5 percent for plans receiving 5 stars in 2012 and 2013. All Medicare Advantage plans are rated on a 1 to 5 star scale, with 1 star representing poor performance, 3 stars representing average performance, and 5 stars representing excellent performance. The quality scores are based on 53 performance measures, such as whether the plans’ enrollees received the appropriate screening tests, the number of complaints CMS received about the plan, and how enrollees rated the communication skills of the plans’ physicians.
The ACA provided bonuses to about 42 percent of plans in 2012 (Jacobson et al. 2011). In 2012, CMS implemented a demonstration, to take the place of the ACA authorized bonuses, under which plans with 4 or more stars receive bonuses of 5 percent, and plans with 3 and 3.5 stars also receive bonuses of 3 percent and 3.5 percent, respectively, for plan years 2012 through 2014. The demonstration extended the bonus payments to include about 91 percent of plans in 2012. The GAO has recommended terminating the demonstration, and MedPAC has raised concerns about its design and cost (Hackbarth 2011; GAO 2012b). This option would terminate the Quality Bonus Demonstration in 2013 rather than in 2014, which would result in the bonuses to Medicare Advantage plans reverting to the bonuses authorized by the ACA.
Budget effects
No cost estimate is available for this option. Medicare savings in 2014 would be less than $3 billion because aggregate bonuses for Medicare Advantage plans that year are expected to be lower than in 2012 ($3 billion). The CMS Office of the Actuary estimated that the total cost of the demonstration will be approximately $8 billion over the three years of the demonstration.
Discussion
Although terminating the demonstration one year early would produce only modest savings, some argue that the demonstration should be terminated because they question the appropriateness of providing bonuses to plans with average ratings (3 or 3.5 stars), and the costs associated with the demonstration. Proponents of the demonstration argue that it encourages and creates more incentives for plans at various quality ratings to maintain or improve their quality ratings.
OPTION 2.7
Restructure quality bonuses to Medicare Advantage plans to be budget neutral
Prior to 2011, plans were “graded on a curve” and scored on a relative scale for each quality measure, resulting in ratings that were relatively normally distributed. Under current law, the bonuses that Medicare Advantage plans receive based on their quality ratings are added to the county benchmark, which increases payments to plans. This option would restructure the quality bonuses to Medicare Advantage plans to be budget neutral, rather than an additional payment to plans, and would adjust the ratings so that the plans were graded on a curve; plans in the top half of the ratings would receive an increase in their benchmarks while plans in the bottom half of the ratings would receive a reduction in their benchmarks, and bonuses would be applied to plans on a sliding scale based on their quality rating.
Budget effects
No cost estimate is available for this option. Restructuring the bonus payments to be budget neutral would result in moderate savings by continuing to provide bonuses to half of the plans and reducing payments to the other half of plans. In 2012, Medicare Advantage plans received approximately $4 billion in bonus payments, all of which will be savings if this option is implemented prior to 2015; however, bonus payments will be smaller in 2015 and future years if the CMS demonstration program ends as scheduled at the end of 2014.
Discussion
Proponents argue that this option would reduce Medicare spending while continuing to encourage plans to maintain or improve their ratings. Critics say plans would be rated relative to one another, discouraging collective quality improvements and sharing of quality improvement information among plans. Plans that receive reductions in payments due to relatively low quality ratings may find it difficult to invest financial resources into improving their ratings, which could lead to stagnation in the plan ratings or other fiscal challenges.
OPTION 2.8
Prohibit Medicare Advantage plans from receiving double bonuses in specified counties
The ACA required bonuses to be doubled for plans that are offered in counties with all the following characteristics: (1) lower than average traditional Medicare costs, (2) a Medicare Advantage penetration rate of 25 percent or more as of December 2009, and (3) a designated urban floor benchmark in 2004. In 2012, Medicare Advantage plans in 210 counties qualify for double bonus payments, and the double bonuses accounted for approximately 21 percent of all bonus payments. The rules for the “double bonus counties” were maintained under the Quality Bonus Demonstration. For example, a 5-star plan in a double bonus county has 10 percent added to its benchmark, whereas a 5-star plan in a neighboring county that does not qualify for double bonuses has 5 percent added to its benchmark in 2014.
This option would eliminate the ACA provision that doubles bonuses for plans in specified counties. This would result in all plans with the same quality rating receiving the same bonus percent added to their benchmark.
Budget effects
No cost estimate is available for this option.
Discussion
In addition to the savings, an argument for this option is that no objective reason for awarding double bonuses to plans in these counties has been made. Another argument for this option is that it would eliminate inequities across neighboring counties. An argument against this option is that the “double bonus” to the highly rated plans in those counties would help offset the reductions in Medicare Advantage benchmarks resulting from the ACA.
References
Click to expand/collapse
Robert A. Berenson. 2008. “From Politics to Policy: A New Payment Approach in Medicare Advantage,” Health Affairs, March 2008.
Jason Brown, Mark Dugan, Ilyana Kuziemko, and William Woolston. 2011. How Does Risk Selection Respond to Risk Adjustment? Evidence from the Medicare Advantage Program, National Bureau of Economic Research, April 2011.
Congressional Budget Office (CBO). 2008. Budget Options, Volume 1: Health Care, December 2008.
Judy Feder, Stephen Zuckerman, Nicole Cafarella Lallemand, and Brian Biles. 2012. Why Premium Support? Restructure Medicare Advantage, Not Medicare, Urban Institute, September 2012.
Bianca Frogner, Gerard F. Anderson, and Robb A. Cohen. 2011. “Incorporating New Research into Medicare Risk Adjustment,” Medical Care, March 2011.
Government Accountability Office (GAO). 2012a. CMS Should Improve the Accuracy of Risk Score Adjustments for Diagnostic Coding Practices, January 2012.
Government Accountability Office (GAO). 2012b. Medicare Advantage: Quality Bonus Payment Demonstration Undermined by High Estimated Costs and Design Shortcomings, March 2012.
Glenn Hackbarth, Chairman of the Medicare Payment Advisory Commission. 2011. Letter to Donald Berwick, Administrator for the Centers for Medicare & Medicaid Services, January 6, 2011.
Medicare Payment Advisory Commission (MedPAC). 2010. Presentation by Scott Harrison to the Medicare Payment Advisory Commission, “The Medicare Advantage Program: Status Report,” November 4, 2010.
Medicare Payment Advisory Commission (MedPAC). 2011. Report to the Congress: Medicare Payment Policy, March 2011.
Medicare Payment Advisory Commission (MedPAC). 2012. Report to the Congress: Medicare and the Health Care Delivery System, June 2012.
Gregory Pope, John Kautter, Randall P. Ellis, et al. 2004. “Risk Adjustment of Medicare Capitation Payments Using the CMS-HCC Model,” Health Care Financing Review, Summer 2004.
Prescription Drugs
Options Reviewed
This section discusses several options for reducing Medicare spending for prescription drugs in Medicare:1
» Medicare Part D: Provide rebates on prescription drugs used by low-income subsidy recipients enrolled in Part D plans, reduce payments for single-source drugs in Part D, and additional options to make the Part D market more competitive
» Medicare Part B: Change the methodology for determining payment rates for prescription drugs covered under Part B
» Drug approval and patent policy: Accelerate the use of generic and follow-on biologic drugs
Medicare covers the cost of prescription drugs in both inpatient and outpatient settings. For many years, Medicare has provided inpatient coverage of prescription drugs through Part A and coverage in certain outpatient settings, such as physician offices, outpatient departments, and dialysis facilities, through Part B. In 2006, Medicare added a new voluntary Part D benefit to cover outpatient prescription drugs through private stand-alone prescription drug plans (PDPs) or as part of comprehensive coverage in Medicare Advantage (MA) plans. In 2013, the program is projected to spend $79 billion on Part D outpatient prescription drugs, or about 13 percent of total program spending, and about $20 billion (3 percent of total program spending) on the provision of drugs through Part B (Exhibit 2.3).2 The average annual per capita growth rate on Medicare Part D spending is projected to be 6.5 percent between 2012 and 2020 (Exhibit 2.4). Medicare savings could be achieved by modifying current payment policy for prescription drugs through a variety of approaches.
Background
Med Medicare pays for prescription drugs under Parts A, B, and D. In the case of Part A, Medicare covers prescription drug costs when provided during stays in an inpatient hospital or skilled nursing facility, as well as drugs used in hospice care for symptom control or pain relief. The cost of prescription drugs in these settings generally is covered as part of a bundled prospective payment for services provided in an inpatient setting, thus putting the facility in charge of managing the price and use of drugs.
Medicare Part B covers drugs in several circumstances including: drugs administered under the direct supervision of a physician (such as infusion of chemotherapy drugs), certain oral cancer drugs that are clinical substitutes for physician-administered drugs, and drugs used in conjunction with Medicare-covered durable medical equipment (DME), such as a nebulizer or infusion pump. Most Part B drugs are paid under a system based on an average sales price (ASP). In addition, Medicare Part B covers drugs provided in conjunction with services delivered in hospital outpatient departments or dialysis facilities; these drugs are included as part of larger payment bundles for services provided at these facilities.
Medicare Part D, the voluntary prescription drug benefit enacted in the Medicare Modernization Act of 2003 and implemented in 2006, covers outpatient prescription drugs. Under Part D, Medicare makes payments to private plans—either stand-alone prescription drugs plans (PDPs) or comprehensive Medicare Advantage (MA) plans—to subsidize the cost of the prescription drug benefit for enrollees. Beneficiaries participating in traditional Medicare may select a PDP for their drug coverage, while those in Medicare Advantage may enroll in the drug plan offered by their Medicare Advantage plan. Basic drug coverage parameters are set in law, but participating plans have flexibility to manage a formulary, employ tiered cost sharing and other utilization management techniques, and create networks of participating pharmacies (all within a set of Federal guidelines) (Exhibit 2.5). Federal subsidies to the plans cover 74.5 percent of the cost of the average plan. Enrollees selecting more expensive plans pay the higher cost above the average bid, while those selecting less expensive plans pay less.
Policy Options
Medicare Part D
OPTION 2.9
Require manufacturers to pay a minimum rebate on drugs covered under Medicare Part D for beneficiaries receiving low-income subsidies
The price paid for a Medicare Part D drug is determined through negotiation between private drug plans that administer the benefit and the manufacturer of the drug. By contrast, drug prices in the Medicaid program are based on a rebate system. For any drug covered in Medicaid, the manufacturer pays a rebate to the Federal government (shared with the states) defined as the lesser of a minimum amount or an amount based on the best price paid by private purchasers, with an additional rebate if the drug’s price increases faster than general inflation. Prior to the introduction of Part D in 2006, Medicaid covered prescription drugs for beneficiaries dually eligible for Medicare and Medicaid, with drug prices subject to the rebate system. However, beginning in 2006, responsibility for drug costs for dual eligible beneficiaries shifted from Medicaid to Medicare Part D, and Medicaid rebates no longer were required. Part D discounts negotiated by private plans are smaller (averaging about one-third the size) than the rebates received by Medicaid, which means that Medicare pays higher prices than Medicaid would for low-income enrollees (HHS OIG 2011a).
An option to achieve savings in Medicare would be to require manufacturers to pay a minimum rebate on drugs covered under Medicare Part D (including best price and inflation provisions similar to the current system under Medicaid) for Medicare beneficiaries enrolled in the Low-Income Subsidy (LIS) program.
Budget effects
Requiring manufacturers to provide a rebate on all prescription drugs used by low-income beneficiaries is estimated by the Congressional Budget Office (CBO) to achieve $137 billion in savings over 10 years (2013–2022) or about $15 billion in the first year of full implementation (CBO 2012a).
Discussion
Advocates of this option argue that it would achieve considerable savings and put the nation’s largest public programs on par when it comes to paying for drugs. Opponents argue that a rebate policy would reduce revenue available for private investment in research and development for new drugs, reduce incentives for manufacturers to offer favorable rebates to private payers, and result in higher prices for new drugs. Opponents also contend that this option would undermine the competitive system used in Part D and lead to higher beneficiary premiums (Antos and King 2011; Holtz-Eakin and Ramlet 2011). Advocates suggest the effects on research and development would be relatively small, and CBO scoring appears to support this perspective (Frank 2012).
OPTION 2.10
Authorize the Secretary of Health and Human Services (HHS) to negotiate lower prices for high-cost single-source drugs
Currently, responsibility for Part D drug pricing falls in the domain of the competing private Part D plans that offer the drug benefit to participating beneficiaries. Private drug plans seek to negotiate lower drug prices (both direct retail prices and manufacturer rebates) through decisions about which drugs are on formulary and on preferred formulary tiers. Current law explicitly states that the HHS Secretary “may not interfere with the negotiations between manufacturers and pharmacies and PDP sponsors.” This option would authorize the HHS Secretary to negotiate lower prices for high-cost drugs sold by only one manufacturer (i.e., single-source drugs). In addition to direct negotiation by the Secretary, one approach to such negotiation would be a system of binding arbitration (Frank and Newhouse 2008). A third alternative would use a mandated rebate for the same subset of drugs instead of a drug-by-drug negotiation process (similar to Option 2.9).
Budget effects
No current cost estimate is available for this option. In 2007, CBO scored a proposal to remove the current non-interference provision, but retaining the ban on a Federally required formulary, as having a negligible effect on costs. CBO based the lack of scored savings on the premise that the HHS Secretary would have no leverage for negotiation in the absence of any power to require a formulary and thus to obtain discounts in recognition of preferred formulary status. In 2008, CBO reiterated its view but suggested the possibility of small savings “for single-source drugs that had no close substitutes on the market,” where the HHS Secretary might use the power of persuasion to obtain discounts. Similarly, the Secretary could consider requiring plans to use prior authorization for specified drugs for which no discount is provided as part of a negotiation strategy, even in the absence of a national formulary (CBO 2008).
Discussion
Though CBO has cast doubt on the potential for savings with a simple repeal of the non-interference provision, its 2008 statement suggests that a targeted expansion of Federal involvement in pricing can offer savings if it creates true leverage for a negotiation. Private drug plans have the most leverage to obtain discounts on brand-name drugs that face competition from other drugs that treat the same medical condition. In these cases, plans use available tools (such as tiered cost sharing or step therapy) to encourage enrollees to use one particular drug among other options in the drug class. Manufacturers typically offer discounts in recognition of the higher market share for their drug. Private plans are least able to negotiate discounts on brand-name drugs with no real therapeutic alternative, including many of the new, expensive biologic drugs.
Advocates of a Federal role in price negotiation (or a targeted rebate) contend that the government would have greater leverage to obtain better prices on these high-priced drugs. Opponents respond that the higher prices for these new single-source drugs reflect the high cost of developing new drugs and such policies would inhibit research and development.
OPTION 2.11
Authorize the HHS Secretary to administer a Medicare-sponsored Part D plan to compete with private Part D plans
The Medicare prescription drug benefit is provided through a system of competing private plans, which have an incentive to keep premiums down in order to gain a larger share of enrollment. Although the current system relies exclusively on private drug plans, some policymakers have advocated for a government-operated approach to providing drug coverage, in line with the traditional Medicare program.
One option for achieving savings would be to authorize the HHS Secretary to administer a Federally-run Part D plan offered through the Medicare program to compete with private drug plans. Like other Part D plans, this Medicare-sponsored plan would have the authority to establish formularies, use cost-sharing tiers, and apply utilization management tools. This plan could be offered as the default option for beneficiaries who fail to select a plan or for Low-Income Subsidy (LIS) beneficiaries whose current plan no longer qualifies as an LIS “benchmark” plan.3
Budget effects
No cost estimate is available for this option. Savings could be achieved to the extent that the Medicare-sponsored option is able to provide coverage more efficiently than private plans in certain parts of the country or spur greater competition in the Part D marketplace. This would depend on the ability of the Medicare-sponsored option to leverage lower prices, manage utilization more effectively, and operate with fewer administrative expenses than private Part D plans. The likelihood of savings would be reduced if private plans were able to attract healthier and less-expensive beneficiaries than enrollees in the Medicare-sponsored option (beyond the reach of risk-adjustment factors). More specific assessment of the potential cost implications of this option would depend on many design decisions and on projected enrollment.
Discussion
Advocates of a Medicare-sponsored plan suggest that it would have greater negotiating leverage over drug prices and lower administrative costs, which could bring the cost of the Part D benefit down for both beneficiaries and the government. In addition, it might have the ability to test reforms aimed at addressing long-term cost drivers, such as the growth of expensive specialty drugs. Critics of this option contend that a Medicare-sponsored plan would have less latitude to adopt formulary and utilization management approaches than private plans, which could limit its ability to obtain discounts on drug prices. If true, enrollment might remain modest and the plan’s impact on costs would be minimal.
OPTION 2.12
Authorize the HHS Secretary to engage in a competitive bidding approach that excludes plans with relatively high bids or poor quality
The competitive model for Medicare Part D achieves lower costs when competing plans reduce costs—and thus beneficiary premiums—by managing utilization and negotiating for low drug prices. If beneficiaries regularly shop for lower premiums and total out-of-pocket costs, plans have a greater incentive to keep costs low. Evidence suggests that many Part D enrollees have not been selecting the optimal plan for their particular drug needs and that many enrollees do not reconsider their plan choice on a regular basis (Polinski et al. 2010; Abaluck and Gruber 2011; Zhou and Zhang 2012). Both factors tend to reduce the incentives for plans to compete vigorously for plan enrollment and to minimize total spending.
Medicare could increase incentives for plan competition by replacing the current “all-comers” approach with a system of competitive bidding, whereby low-quality plans or plans that bid too high are excluded from the program (Rice and Cummings 2010). To minimize disruption, plans with winning bids could remain in Medicare for more than a single year.
Budget effects
No cost estimate is available for this option.
Discussion
Proponents of a competitive bidding approach contend that it would enhance competition on both cost and quality by requiring plans to compete first for inclusion in the program and then, if they meet the standards of participation, compete for enrollment. A program with fewer plans might also make it easier for beneficiaries to review their choices and to make more optimal selections. On the other hand, excluding potential competitors could reduce the scope of competition and eliminate the best plan option for some beneficiaries.
OPTION 2.13
Reduce reinsurance payments to Part D plans
Part D includes several mechanisms by which the Medicare program partially offsets the insurance risk faced by Part D plan sponsors:
» A risk-adjustment system for the capitated payments made by Medicare to Part D plans;
» Reinsurance payments to plans whereby Medicare pays 80 percent of the cost of covered benefits for any individual enrollee with drug spending above the catastrophic coverage threshold; and
» Risk-sharing corridors under which Medicare shares unanticipated losses (and profits) incurred by plans.
Federal reinsurance payments for high-cost users totaled an estimated $13 billion in 2011, or 22 percent of Federal Part D costs. About 9 percent of Part D enrollees had spending in 2010 high enough to reach the catastrophic phase of the Part D benefit—the point at which 95 percent of costs are partially paid by Federal funds (80 percent directly as reinsurance and 15 percent by the plans, but with Federally subsidized premium dollars). Spending incurred by these beneficiaries represents 44 percent of total drug costs for Part D enrollees (MedPAC 2012a). One option to achieve savings would be to reduce by half the Federal reinsurance payments to Part D plans for costs above the catastrophic coverage threshold—from 80 percent to 40 percent, with 55 percent paid by the plans (up from 15 percent under current law).
Budget effects
No cost estimate is available for this option. A reduction of reinsurance payments would not directly reduce Federal spending because total Federal subsidies, as 74.5 percent of plan costs, are divided between direct premium subsidy amounts and reinsurance payments; if reinsurance payments are lower, then the direct premium subsidy is higher. However, Federal savings would be achieved if the reduction of reinsurance increases the incentives for plans to manage utilization by these high-cost users and if plans successfully implement more effective management. In that case, the resulting savings would be shared by the plans and the Federal government in future-year premium bids and in risk-sharing payments.
Discussion
Reinsurance blunts incentives for plans to manage the costs of high-spending enrollees by making the government responsible for the vast majority of costs for enrollees who exceed the catastrophic cost threshold. With only 15 percent exposure for high-cost users, plans may be less likely to invest resources in efforts to manage the drug costs of these enrollees. To the extent that plans continue to receive full manufacturer rebates for drugs purchased by these enrollees, plan incentives to manage drug use are further blunted. In some situations, rebate revenue may actually offset the plan’s cost for brand drugs in the catastrophic phase. A substantial reduction in the reinsurance share could significantly increase plan incentives to manage costs.
Plans, however, may argue that tools for managing many high-cost enrollees are limited, especially because the choice of treatment options is driven by physicians with whom they lack any contractual relationship (which is particularly the case for stand-alone PDPs). In addition, an original reason for including reinsurance payments in the system was to protect plans from the consequences of adverse selection—although this proposal would leave the protections of risk adjustment and risk-sharing corridors in place. If plans perceive higher risk, they may increase premiums or take steps to avoid the most risky enrollees.
OPTION 2.14
Encourage plans to expand the use of generic drugs
Generic drugs accounted for 75 percent of all prescriptions paid for by Part D in 2010 but just 25 percent of Part D spending.4 Use of generics saved Medicare $33 billion in 2007 (CBO 2010). Patent expirations for popular brand-name drugs provide opportunities for Medicare and other payers to achieve additional savings. To encourage use of generics, plans use tiered cost sharing, step therapy, and other utilization management approaches. Additional steps could be taken to increase use of generic drugs in Part D.
OPTION 2.14A
Increase the differential between generic and brand drug copayments in drug classes where generics are broadly available
One option to achieve savings would be to increase the differential in copayments between generic and brand drugs in drug classes where generics are broadly available. There is some evidence that a zero copayment for generics creates a much stronger incentive than does a low copayment. Although some plans now apply a large copayment differential and some set the generic copayment at zero, CMS could modify the guidance to plans that use tiered cost sharing to encourage larger differentials or lower copayment levels for generic drugs, or create incentives (e.g., through performance measures) to increase generic use. In addition, nondiscrimination rules that currently disallow differential cost-sharing policies for drugs used to treat different medical conditions could be modified to allow variations in cost sharing based on the availability of generics in a particular class of drugs.
Budget effects
No cost estimate is available for this option. Using 2007 data, CBO has projected additional savings of nearly $1 billion if all prescriptions for multiple-source brand-name drugs had been filled with generics and another $4 billion with increased therapeutic substitution in seven drug classes (CBO 2010).
Discussion
Advocates point to evidence that plans can use different cost-sharing structures, especially lower copayments for generics and higher copayments for brands, to increase incentives to substitute generic drugs and achieve savings (Hoadley et al. 2012). Sharper financial incentives may encourage more patients to use generics. However, a concern with this option is that it could impair access and outcomes for patients whose clinical response to a generic drug is less than optimal, although this concern could be addressed if effective exceptions processes are guaranteed in these cases. Some have expressed concern that reduced use of brand-name drugs would lower returns on these drugs and thus weaken incentives for research associated with pharmaceutical innovation.
OPTION 2.14B
Increase the differential between generic and brand drug copayments for Low-Income Subsidy Part D enrollees in drug classes where generics are broadly available
For LIS enrollees, copayments are set in law (and updated annually by an indexing formula) and not subject to modification by plans. In 2013, some LIS enrollees (depending on income and eligibility status) are charged a $1.15 copayment for generic subscriptions and a $3.50 copayment for brands, while most others are charged $2.65 and $6.60, respectively. This may help explain why the rate of generic use for LIS enrollees is lower than that for non-LIS enrollees. The Medicare Payment Advisory Commission (MedPAC) has recommended increasing the differential in copayments between generic and brand drugs in drug classes where generics are broadly available (MedPAC 2012c). The Commission offered an example of $0 for generics, $6 for preferred brand drugs, and a potentially higher amount for non-preferred brand drugs. To protect against any adverse impact on access, MedPAC proposed that current exceptions and appeals processes would remain in effect in circumstances where the generic drug is not clinically appropriate, and that the HHS Secretary should monitor utilization for any access problems.
Budget effects
In 2011, MedPAC estimated that its recommendation on drug copays for LIS beneficiaries would lead to a reduction of $17 billion in Federal spending over 10 years (MedPAC 2011). If adherence to medications increases, there could be additional savings as a result of lower use of other medical services.
Discussion
MedPAC suggested that lower generic copayments would lead more LIS beneficiaries to switch to generics, with a resulting reduction in out-of-pocket costs that could in turn increase access and adherence to medications (MedPAC 2012c). The decreased costs experienced by plans would help to lower premiums and Federal subsidy payments. As with options to increase generic use for non-LIS beneficiaries, this option could reduce access if exceptions processes prove inadequate. MedPAC highlighted the importance of an effective exceptions and appeals process to protect beneficiary access. The option could also lower returns on brand-name drugs and thus weaken incentives for pharmaceutical innovation.
OPTION 2.15
Strengthen incentives for adherence
Although Part D plans are responsible for managing drug utilization and have a financial incentive to keep drug costs low, stand-alone prescription drug plans do not gain or lose money based on the cost or savings for non-drug services that may be a result of drug use. When beneficiaries receive drug benefits through Medicare Advantage plans, the incentives are better aligned. A small but growing body of literature suggests that greater adherence leads to lower use of health services and potentially better health outcomes (Osterberg and Blaschke 2005; McWilliams et al. 2011; Stuart et al. 2011; Jha et al. 2012).
Savings could be achieved by strengthening incentives for medication adherence. Options include: (1) lowering cost sharing for specific drugs, (2) targeted beneficiary education, (3) engagement of physicians or pharmacists in addressing non-adherence issues, (4) performance measures for drug plans aimed at adherence, and (5) broader systemic solutions involving medication adherence in initiatives such as accountable care organizations.
Budget effects
No cost estimate is available for this option. Increased adherence to drug regimens will likely increase spending for drugs in Part D. However, CBO recently concluded that it could attribute Part A or Part B savings based on increased drug use. In general, the agency finds that a 1 percent increase in prescription drug use results in a reduction in spending for medical services of about one-fifth of 1 percent (CBO 2012b).
Discussion
Proponents suggest that various factors can increase adherence and that different approaches may work for different patients and different disease states. Several studies show that lower cost sharing (including implementation of value-based insurance design) and more use of generic drugs are associated with increased adherence. But financial incentives may not be the entire solution, and targeted beneficiary education initiatives could play a role. The involvement of both physicians and pharmacists can help address some issues of non-adherence, and initiatives such as patient-centered medical homes or accountable care organizations could incorporate a focus on medication adherence. In addition, electronic health records could offer tools for tracking adherence and offering physicians and other clinicians more opportunities to counsel patients. CMS could take specific actions to strengthen incentives, including improved performance measures for both stand-alone PDPs and Medicare Advantage drug plans to increase adherence. For example, plans could be encouraged to implement elements of value-based insurance design, such as eliminating copayments for selected drug classes or for selected high-value drugs where adherence is critical. Critics may question whether the added direct costs associated with greater medication adherence would be fully offset by savings for hospital and physician care.
OPTION 2.16
Strengthen medication therapy management programs
In 2010, about 9 percent of Part D enrollees (about 2.3 million enrollees) had spending high enough to reach the catastrophic phase of the Part D benefit, meaning they had at least $6,440 in total Part D drug costs in that year. Spending by these beneficiaries represented 44 percent of total Part D drug spending. Most of these costs are paid with Federal dollars (MedPAC 2012a). In part to address the unique needs of people with high drug needs, all Part D plans are required to operate medication therapy management (MTM) programs that focus on beneficiaries with high drug costs, large numbers of drugs, or multiple chronic conditions. As of 2010, 2.6 million of 3 million eligible enrollees were participating in MTM programs (MedPAC 2012c).
Although all plans have created MTM programs, evidence on their effectiveness is limited. CMS is collecting data on plan MTM programs and conducting an evaluation of them, with results due in 2013. Evaluation results could help policymakers identify specific steps to increase the effectiveness of MTM programs. The original intent behind MTM programs was to improve medication use and to reduce adverse events that may result when beneficiaries take multiple medications. If properly designed, MTM programs could reduce unnecessary utilization of drugs by those taking multiple drugs, while also increasing adherence with the important drugs for a person’s condition. MTM programs could also focus on appropriate use of high-cost drugs. Steps to increase the effectiveness of MTM programs could include stronger incentives for beneficiaries, physicians, and pharmacists to participate, for example, reduced cost sharing if MTM participants undergo comprehensive medication reviews, or adding MTM provided by physicians or pharmacists as a covered Part B service. CMS could consider incorporating MTM programs into its shared savings programs for accountable care organizations. CMS also could consider improved performance measures related to MTM programs (Rucker 2012).
Budget effects
No cost estimate is available for this option. With Part D spending for 2013 projected at $79 billion, the highest-cost Part D enrollees will represent about 44 percent, or $35 billion, in spending. If costs for these enrollees were reduced even 10 percent, it would represent at least $3 billion in annual savings. Greater savings could be achieved if MTM programs result in less medical spending, such as for adverse drug-related hospitalizations (Budnitz et al. 2011).
Discussion
MTM program advocates emphasize improved safety and clinical outcomes as the most important results of effective MTM, and they can point to successful examples of such programs outside of Part D. Many of these exemplar programs can point to a return on investment through both lower medication costs and medical and hospital costs. Concern about the growth of these programs includes the possibility that up-front spending to operate the programs may not realize savings (MedPAC 2009). In addition, some enrollees may find the programs impose an undue burden and make it more difficult to access to needed medications.
OPTION 2.17
Repeal provisions in the Affordable Care Act that would close the Part D coverage gap by 2020
The original design of Part D included a coverage gap (between $2,970 and $6,955 in total drug costs in 2013 under the standard benefit design), in which beneficiaries were responsible for paying all drug costs out of pocket. Beneficiaries with costs that exceed the gap are then eligible for catastrophic coverage, in which the Federal government pays 95 percent of drug costs. The ACA phases out the coverage gap by 2020 through a combination of mandated lower manufacturer prices for brand drugs and gradually reduced beneficiary cost sharing. Repeal of the ACA—or of these specific provisions—would reduce Federal spending and shift those costs back to beneficiaries.
Budget effects
CBO has estimated that the provisions closing the gap result in an additional $86 billion in new Federal spending over 10 years, partially offset by $35 billion in reductions on other medical services under Medicare, for a net increase of $51 billion over 10 years (2013–2022). Legislation restoring the coverage gap would recoup that spending, but savings could be reduced if the Federal government had to repay discounts already provided by manufacturers (CBO 2012b).
Discussion
Proponents of repeal argue that the Federal government cannot afford additional entitlement spending at a time of large annual deficits and a growing national debt. Opponents say repeal would lower Federal spending but only by shifting costs back to Part D enrollees with relatively high drug costs. This also could lead some beneficiaries to skip drugs or take reduced doses, leading to higher medical costs.
Medicare Part B
OPTION 2.18
Lower the percentage paid by Medicare for Part B drugs from 106 percent to 103 percent of the average sales price
Since 2005, Medicare payments for many drugs covered under Part B—primarily injectable or intravenous products administered by a physician—are based on an average sales price (ASP) methodology. The ASP is based on sales data submitted to CMS by drug manufacturers, excluding sales under various government programs, and reflects the price net of various discounts and rebates. Medicare Part B drug payments are set at 106 percent of the ASP since not all providers can obtain the drug at the average price. Prior to 2005, Medicare paid providers at a rate equal to 95 percent of the average wholesale price (AWP), and costs were rising rapidly for Medicare and its beneficiaries. Since shifting to the ASP approach, Part B drug spending has increased modestly at 2.7 percent per year, compared with increases of 25 percent per year from 1997 to 2003 (MedPAC 2012a). Under this option, the current payment would be reduced from 106 percent of ASP to 103 percent.
Budget effects
CBO has estimated this option would save $3.2 billion over 10 years.
Discussion
Some have argued that the 6 percent add-on amount is excessive, especially for the most expensive drugs, and that there is no empirical justification for this amount. Furthermore, the percentage-based add-on is much greater for expensive drugs and creates an incentive to select the most expensive brand-name drug among available alternatives. Critics of changing this policy say that the current pricing methodology has done a good job of achieving savings, and that additional adjustments would threaten access to these drugs (Holtz-Eakin and Zhong 2011). Oncology providers also have argued that this option would have the greatest impact on small, community-based practices with the least leverage to negotiate prices with manufacturers. Patients treated by these practices might be referred to hospital outpatient departments for their treatments.
OPTION 2.19
Change from the current average wholesale price (AWP) methodology for certain Part B drugs to the average sales price (ASP) methodology used for other Part B drugs
Although the ASP-based system for setting prices is used for most Part B drugs, several small groups of drugs (drugs administered at home with an infusion pump, immune globulin administered by subcutaneous injection, and preventive vaccines for influenza, pneumococcus, and hepatitis B) are instead paid based on 95 percent of the average wholesale price (AWP). Because the AWP is more of a “list price” that does not incorporate frequently used discounts and rebates, it tends to overstate actual market prices. A 2005 study by the HHS Office of Inspector General (OIG) found that across about 900 brand-name Part B drugs, the ASP was 26 percent lower than the AWP at the median (HHS OIG 2005). Thus, even a 5 percent reduction in payments below AWP levels provides higher reimbursement than would occur using the ASP. Because the AWP generally is regarded as an unreliable indicator of the cost of the drugs listed above, Congress could move these drugs to the ASP system that has proven effective for other Part B drugs.
Budget effects
No cost estimate is available for this option. Total spending in 2010 for Part B drugs administered in physicians’ office or furnished by suppliers was $11.5 billion, of which no more than 5 percent (up to about $0.5 billion) is for drugs paid under the AWP methodology. Ten percent savings would yield savings of up to $500 million over 10 years.
Discussion
A switch to the ASP-based price for this set of Part B drugs, some of which are associated with the use of durable medical equipment, would correct the current payment methodology that appears to produce higher-than-necessary payments for these drugs. One reason for the exclusion of these drugs from using ASP-based prices may have been the intended transition of durable medical equipment to a system of competitive bidding, a reform that still is in progress. Because some drugs in this category have been subject to shortages, some worry that lower prices could exacerbate those shortages because the manufacturers would receive lower returns from production.
OPTION 2.20
Restore the legal authority for CMS to use a “least costly alternative” policy among competing Part B drugs
For some patients, there are multiple therapeutic alternatives available. However, under a system that reimburses physicians based on the sales price of the drug, physicians have no incentive to select a less expensive option. In fact, the 6 percent markup on the ASP may create an incentive to use the more expensive option (HHS OIG 2011). A notable example is the choice between Lucentis and Avastin—two related biologicals used to treat age-related macular degeneration in eyes—that have been shown to produce equivalent results for patients but have very different prices (Rosenfeld 2011; CATT Research Group et al. 2012). A 2011 report by the HHS Office of Inspector General estimated that paying for treatments using Lucentis at the lower Avastin rate would have generated $1.1 billion in savings in 2008–2009 and reduce beneficiary cost sharing by another $275 million (HHS OIG 2011c). A 2012 report by the OIG on drugs used to treat prostate cancer showed savings if the least costly drug in the class was substituted for other similar drugs, with a total one-year savings of $33 million, or 13 percent of the cost of this class of drugs (HHS OIG 2012b).
In the past, Medicare has used a “least costly alternative” policy, where Medicare bases the payment rate for a group of clinically similar services (drugs in this case) on the least costly item in the group. In April 2010, Medicare removed this policy from Part B drugs after a successful challenge in court (relating to inhalation drugs used to treat lung diseases, Zopenex and Duoneb). In 2012, the HHS Office of Inspector General recommended that CMS consider seeking legislative authority to reinstate Medicare’s authority to apply this policy (HHS OIG 2012b).
Budget effects
In 2011, MedPAC reported that restoring the HHS Secretary’s authority to apply a least costly alternative policy would lead to savings of $1 billion in Federal spending over 10 years (MedPAC 2011).
Discussion
Advocates to restore authority to use the “least costly alternative” policy argue that the current policy creates a financial incentive for providers to choose the more expensive drug. Restoring the “least costly alternative” policy could level the financial incentives and encourage physicians to select a therapy based on clinical and safety considerations. They also point out that beneficiaries would save money through reduced cost sharing.
Critics raise concerns that it would put CMS in the position of determining when treatments are similar enough to be used interchangeably without the benefit of a full array of clinical studies. In particular, some critics point out that the full value of a new, more expensive drug may not be immediately apparent when it first comes to the market. Limiting payment for the more expensive drug would not only make access to that drug more difficult, but would deny clinicians experience with the new drug that might lead to a better understanding of its clinical benefits.
OPTION 2.21
Require manufacturer discounts or rebates for Part B drugs or allow Medicare to negotiate drug prices for Part B drugs when Medicare purchases account for a large share of spending on a specific drug
Although the ASP methodology generally reflects pricing levels in private-sector transactions, various government purchasers acquire these drugs at lower prices than under Medicare’s rules. One option to address this pricing discrepancy would be to allow Medicare to negotiate drug prices in Part B for those drugs where the Medicare program purchases the majority of the particular drug. Alternatively, Medicare could consider policies such as reference pricing or a Medicaid-style rebate system for Part B drugs.
Budget effects
According to an analysis by the HHS Office of Inspector General, about $2 billion in Federal savings would be achieved if manufacturers of the 20 costliest single-source drugs paid under Part B were required to pay the same rebates required under Medicaid (HHS OIG 2011b). Of these 20 drugs, 13 would meet the criterion that Medicare purchases the majority of a drug, representing rebate savings of $1.6 billion in 2010 (GAO 2012). Savings would be greater if based on the full list of qualifying drugs.
Discussion
Supporters of this option say that allowing negotiation or establishing a system of rebates in Part B means the Federal government would no longer have to accept any price set by a pharmaceutical company. Critics respond that forcing lower prices would reduce incentives for innovative research by pharmaceutical manufacturers.
OPTION 2.22
Lower the reimbursement for Part B drugs for which the price based on the average manufacturer price (AMP) is lower than the current ASP-based price
Since 2005, Medicare has paid for most Part B-covered drugs based on the ASP. Manufacturers generally must provide CMS with the ASP and volume of sales for all drugs on a quarterly basis; they also must report the average manufacturer price (AMP). By law, the HHS Inspector General identifies Medicare Part B prescription drugs with an ASP that exceeds the AMP by a certain threshold (currently set at 5 percent) and reports the financial impact of lower reimbursement amounts in these cases. CMS has the authority to substitute a price based on the AMP (103 percent of AMP) for the ASP-based price (106 percent of ASP) when it is lower, but has never used this authority. In the 2012 Physician Fee Schedule final rule, CMS added a requirement that AMP could only be substituted for ASP if the ASP exceeded the AMP by at least 5 percent in two consecutive quarters or three of the four previous quarters. Citing drug shortage concerns based on the lower prices, CMS has not implemented this requirement. The 2013 final rule would prevent use of the AMP-based price for drugs deemed to be in short supply. Under this option, CMS could finalize and implement a policy for lowering the reimbursement for drugs for which the AMP-based price is lower than the ASP-based price, including adding safeguards through rulemaking authority.
Budget effects
In 2012, the HHS Office of Inspector General estimated annual savings of as much as $17 million if the AMP-based price were substituted for 14 of the 29 drugs exceeding the 5 percent threshold (HHS OIG 2012a).
Discussion
Advocates suggest that this option fulfills the original intent of the law that CMS is supposed to lower reimbursement for drugs when the AMP-based price is lower. Because there are issues with both methodologies, use of both price standards was intended to make sure that Medicare does not overpay for Part B drugs. The HHS Inspector General has recommended implementation of this policy. Opponents of this option contend that, even with the protections proposed by CMS, the lower prices could exacerbate the problem of prescription drug shortages. Through rulemaking, CMS has tried to address this issue by considering whether drugs subject to this policy appear on a drug shortage list maintained by the FDA.
Drug Approval and Patent Policy
OPTION 2.23
Shorten the exclusivity period for biologics from 12 years to 7 years
Biologics—drugs made from living organisms and their products—are likely to be a large element of drug costs moving into the future. Although biologics represent a fairly small share of Medicare Part D costs today (about 13%5), they represent a large share of Part B drug costs. Biologics paid for under either Part B or Part D constitute about one-fourth of Medicare drug spending.6 As more self-administered biologics enter the market, their share of costs in Part D will increase. By one estimate, the list of most prescribed drugs (measured by costs) is switching from domination by traditional drugs for chronic conditions to biologics, a result of both patent term expirations for traditional brand drugs as well as increased use of biologics. The patents for biologics with about $20 billion in annual sales will expire between 2012 and 2018, creating a significant opportunity for savings if follow-on biologics can be approved and gain acceptance in the marketplace (Grabowski et al. 2011).
The Biologics Price Competition and Innovation Act, enacted as part of the ACA, allows the FDA to approve follow-on biologics or biosimilars, by creating a pathway for more expeditious entry into the market (similar to treatment of generic drugs) and creating competition and lower prices. It also allows the FDA to create a formal designation of interchangeability for biosimilars, a status that will make it easier for physicians, patients, and payers to substitute the newly approved biosimilars as safe and effective alternatives. The FDA is in the initial stages of implementing the new statutory provisions. An estimate conducted in 2007 found that follow-on biologics might be priced at a discount of anywhere from 5 percent to 30 percent below current prices (Ahlstrom et al. 2007). Additional issues in the marketplace will be whether automatic substitution of biosimilars for the original biologic by pharmacists would be allowed (generally a matter of state law) and whether payers (including Medicare) will use formularies, cost sharing, and other incentives to encourage use of biosimilars.
One option to achieve Medicare savings would be to reduce the exclusivity period for biologics from 12 years to 7 years.
Budget effects
A proposal in the President’s budget for Fiscal Year 2013 to shorten the exclusivity period from 12 years to 7 years was estimated by CBO as saving the Federal government about $3 billion over 10 years (2013–2022).
Discussion
The specific proposal for shortening the exclusivity period from 12 years to 7 years is one means of getting follow-on biologics to the market more quickly. Proponents note that 7 years exceeds the 5-year exclusivity available to non-biologics, and that it still allows adequate time for manufacturers to recoup their research and development costs. But issues of acceptance and substitutability will be keys to shifting utilization and realizing these types of savings. It remains unclear whether State laws will permit automatic substitution of follow-on biologics at the pharmacy. In addition, many decisions to use these drugs, if administered by physicians, are not made at a retail pharmacy counter. Even if the FDA creates standards for the substitutability of these drugs, market adoption will require time to ensure acceptance by both physicians and patients. Also, there is concern that the considerably higher research costs for these drugs require more time to recoup costs and that shortening the exclusivity period could reduce incentives to develop new products (AARP Public Policy Institute 2012a; Frank 2012).
OPTION 2.24
Prohibit pay-for-delay agreements associated with patent exclusivity periods
The Drug Price Competition and Patent Term Restoration Act of 1984 created a new and faster pathway for approval of generic drugs by the FDA by proving that the generic drug is bioequivalent to the brand version. In general, the generic manufacturer may begin marketing its drug once all the original patents have expired. The law also provided a guaranteed minimum patent term for the original brand manufacturer and gave the first manufacturer with an approved generic version a period of 180 days when it would be the only generic on the market.
Some brand manufacturers have worked around the law by compensating a generic manufacturer for keeping its product off the market for a period of time—a practice referred to as pay-for-delay. The Federal Trade Commission (FTC) found that they keep generic drugs off the market for an average of 17 months. Several cases, seeking to bar pay-for-delay agreements, are currently making their way through the Federal court system. In December 2012, the Supreme Court agreed to hear one of these cases and could resolve this issue in 2013.
The President’s Fiscal Year 2013 Budget called for prohibiting routine settlements of drug patent litigation. In doing so, it would remove current incentives for generic drug companies to challenge patents by prohibiting a generic drug company from accepting anything of value from the patent holder in a settlement other than an “early entry date” for the marketing of a generic drug. A similar proposal to ban pay-for-delay agreements (S. 27) was introduced in 2011 by Senators Charles Grassley (R-IA) and Herb Kohl (D-WI).
Budget effects
CBO scored the Grassley-Kohl legislation as saving the Federal government $4.8 billion over 10 years (2012–2021), including both spending and revenue effects (the total effect on public and private drug spending was estimated as $11 billion over the 10 years) (CBO 2011). A similar proposal included in the President’s Fiscal Year 2013 budget was estimated by CBO as saving about $5 billion over 10 years (2013–2022).
Discussion
Proponents of prohibiting pay-for-delay agreements argue that these agreements keep less expensive generic drugs off the market, thus preserving higher prices for brand manufacturers. Higher prices raise costs for Medicare and other payers, and lead to higher cost sharing for brand drugs for enrollees, which may have a negative effect on patients’ access and adherence to these drugs. Opponents contend that the settlements may save money if they resolve expensive litigation between generic and brand manufacturers that would take longer to be decided in court than the length of the agreed-on delay. According to both generic and brand manufacturers, banning patent settlements would delay competition and cut the number of new generics that enter the market prior to the expiration of brand patents. Some opponents also argue that generic manufacturers may be less likely to initiate legal action in an all-or-nothing environment where a financial settlement is excluded as an intermediate option (Federal Trade Commission 2011; Kesselheim et al. 2011; AARP Public Policy Institute 2012b).
References
Click to expand/collapse
AARP Public Policy Institute. 2012a. Allow Faster Market Access to Generic Versions of Biologic Drugs, June 2012.
AARP Public Policy Institute. 2012b. Prohibit Pay-for-Delay Agreements, June 2012.
Jason T. Abaluck and Jonathan Gruber. 2011. “Choice Inconsistencies Among the Elderly: Evidence from Plan Choice in the Medicare Part D Program,” American Economic Review, June 2011.
Alexis Ahlstrom et al. 2007. Modeling Federal Cost Savings from Follow-On Biologics, Avalere Health LLC, April 2007.
Joseph Antos and Guy King. 2011. “Tampering with Part D Will Not Solve Our Debt Crisis,” American Enterprise Institute Health Studies Working Paper, June 29, 2011.
Boards of Trustees, Federal Hospital Insurance and Federal Supplementary Medical Insurance Trust Funds. 2012. 2012 Annual Report of the Boards of Trustees of the Federal Hospital Insurance and Federal Supplementary Medical Insurance Trust Funds, April 23, 2012.
Daniel Budnitz et al. 2011. “Emergency Hospitalizations for Adverse Drug Events in Older Adults,” New England Journal of Medicine, November 24, 2011.
CATT Research Group et al. 2012. Ranibizumab and Bevacizumab for Treatment of Neovascular Age-related Macular Degeneration: Two-Year Results, Ophthalmology, July 2012.
Congressional Budget Office (CBO). 2008. Budget Options, Volume 1: Health Care, December 2008.
Congressional Budget Office (CBO). 2010. Effects of Using Generic Drugs on Medicare’s Prescription Drug Spending, September 2010.
Congressional Budget Office (CBO). 2011. Cost Estimate, S. 27: Preserve Access to Affordable Generics Act, November 2011.
Congressional Budget Office (CBO). 2012a. Estimates of the Effects of Medicare, Medicaid and Other Mandatory Health Provisions Included in the President’s Budget Request for Fiscal Year 2013—March 2012 Baseline, March 16, 2012.
Congressional Budget Office (CBO). 2012b. Offsetting Effects of Prescription Drug Use on Medicare’s Spending for Medical Services, November 2012.
Express Scripts, Inc. 2012. 2011 Drug Trend Report, April 2012.
Federal Trade Commission. 2011. Authorized Generic Drugs: Short-Term Effects and Long-Term Impacts, August 31, 2011.
Richard Frank. 2012. Prescription Drug Procurement and the Federal Budget, Henry J. Kaiser Family Foundation, March 2012.
Richard Frank and Joseph Newhouse. 2008. “Should Drug Prices Be Negotiated Under Part D Of Medicare? And If So, How?” Health Affairs, January 2008.
Government Accountability Office (GAO). 2012. Medicare: High-Expenditure Part B Drugs, October 12, 2012.
Henry G. Grabowski et al. 2011. “Implementation of the Biosimilar Pathway: Economic and Policy Issues,” Seton Hall Law Review, 2011.
HHS Office of Inspector General (OIG). 2005. Medicaid Drug Price Comparison: Average Sales Price to Average Wholesale Price, June 2005.
HHS Office of Inspector General (OIG). 2011a. Higher Rebates for Brand-Name Drugs Result in Lower Costs for Medicaid Compared to Medicare Part D, August 2011.
HHS Office of Inspector General (OIG). 2011b. Letter to Senator Herb Kohl, October 6, 2011.
HHS Office of Inspector General (OIG). 2011c. Review of Medicare Part B Avastin and Lucentis Treatments for Age-Related Macular Degeneration, September 2011.
HHS Office of Inspector General (OIG). 2012a. Comparison of Fourth-Quarter 2011 Average Sales Prices and Average Manufacturer Prices: Impact on Medicare Reimbursement for Second Quarter 2012, August 2012.
HHS Office of Inspector General (OIG). 2012b. Least Costly Alternative Policies: Impact on Prostate Cancer Drugs Covered Under Medicare Part B, November 2012.
Jack Hoadley et al. 2012. “In Medicare Part D Plans, Low or Zero Copays and Other Features to Encourage the Use of Generic Statins Work, Could Save Billions,” Health Affairs, October 2012.
Douglas Holtz-Eakin and Michael Ramlet. 2011. Cost Shifting Debt Reduction to America’s Seniors, American Action Forum, July 21, 2011.
Douglas Holtz-Eakin and Han Zhong. 2011. Medicare Part B Drug Reimbursement Why Change A Market-Driven System That Works Well at Controlling Costs? American Action Forum, October 26, 2011.
IMS Institute for Healthcare Informatics. 2012. The Use of Medicines in the United States: Review of 2011, April 2012.
Ashish K. Jha et al. 2012. “Greater Adherence to Diabetes Drugs Is Linked to Less Hospital Use and Could Save Nearly $5 Billion Annually,” Health Affairs, August 2012.
Aaron Kesselheim et al. 2011. “Pay for Delay” Settlements of Disputes over Pharmaceutical Patents, New England Journal of Medicine, October 31, 2011;
J. Michael McWilliams et al. 2011. “Implementation of Medicare Part D and Nondrug Medical Spending for Elderly Adults with Limited Prior Drug Coverage,” Journal of the American Medical Association, July 27, 2011.
Medicare Payment Advisory Commission (MedPAC). 2009. Report to the Congress: Medicare Payment Policy, March 2009.
Medicare Payment Advisory Commission (MedPAC). 2011. “Moving Forward from the Sustainable Growth Rate (SGR) System,” Letter to Chairmen and Ranking Members of Congressional committees of jurisdiction, October 14, 2011.
Medicare Payment Advisory Commission (MedPAC). 2012a. Health Care Spending and the Medicare Program: A Data Book, June 2012.
Medicare Payment Advisory Commission (MedPAC). 2012b. Report to the Congress: Medicare and the Health Care Delivery System, June 2012.
Medicare Payment Advisory Commission (MedPAC). 2012c. Report to the Congress: Medicare Payment Policy, March 2012.
National Coalition on Health Care. 2012. Curbing Cost, Improving Care, November 2012.
Lars Osterberg and Terrence Blaschke. 2005. “Adherence to Medication,” New England Journal of Medicine, August 4, 2005.
Jennifer Polinski et al. 2010. “Medicare Beneficiaries’ Knowledge of and Choices Regarding Part D, 2005 to the Present,” Journal of the American Geriatrics Society, May 2010.
Thomas Rice and Janet Cummings. 2010. “Reducing the Number of Drug Plans for Seniors: A Proposal and Analysis of Three Case Studies,” Journal of Health Policy, Politics & the Law, December 2010.
Philip J. Rosenfeld. 2011. “A Prescription for Savings: Reducing Drug Costs to Medicare,” Testimony before the Senate Special Committee on Aging, July 21, 2011.
N. Lee Rucker. 2012. Medicare Part D’s Medication Therapy Management: Shifting from Neutral to Drive, AARP Public Policy Institute, 2012.
Bruce Stuart et al. 2011. “Does Medication Adherence Lower Medicare Spending Among Beneficiaries with Diabetes?” Health Services Research, August 2011.
Chao Zhou and Yuting Zhang. 2012. “The Vast Majority of Medicare Part D Beneficiaries Still Don’t Choose the Cheapest Plans That Meet Their Medication Needs,” Health Affairs, October 2012.
Provider Payments
Options Reviewed
This section begins with a discussion of reforming Medicare’s physician payment system and then reviews a number of approaches for reducing Medicare provider payments:
» Reform physician payment and the Sustainable Growth Rate (SGR)
» Modify update formulas and make other changes to overall payment levels
» Expand value-based purchasing and reduce hospital readmissions
» Reduce Medicare payments for medical education
» Expand competitive bidding and adopt selective contracting
» Rationalize payments across settings and circumstances
» Change payments for post-acute care and hospice case
» Modify or eliminate special provider payments
» Reduce geographic variation in Medicare spending
Changes to the way Medicare pays hospitals, doctors, and other health care providers have been a common feature of past efforts to reduce Medicare expenditures, and remain an important means of seeking future program savings. Medicare uses a variety of methods to pay providers for their services, most of which set rates in advance for specific services using fee schedules or prospective payment systems. These various payment systems undergo regular updates to reflect growth in the costs of delivering care and often are modified to improve payment equity across providers as well as to encourage more efficient and higher quality care.
Medicare pays most hospitals, skilled nursing facilities (SNF), and home health agencies (HHA) under prospective payment systems (PPS) using predetermined rates for a package of services such as a hospital stay or SNF day. Payment for many other services, such as physician visits, clinical laboratory services, and durable medical equipment, are made using fee schedules.
Despite the many differences in the way providers are paid, one unifying feature is that Medicare tends to pay a fee for each service that is delivered; sometimes the fee covers a set of services (such as a hospital stay) and other times it is a singular service (such as a lab test or a doctor visit), but Medicare generally pays each time a service occurs. Research has shown that such fee-for-service payment tends to encourage a greater volume of services, which can drive up costs. The Affordable Care Act (ACA) contains more than 100 changes in Medicare provider payments, many of which currently are being phased in. The ACA also authorized the Centers for Medicare & Medicaid Services (CMS) to test new payment methods including moving away from fee-for-service payments toward unified or bundled payments for care a patient receives from multiple providers.
Given the wide range and complexity of Medicare provider payment systems, the options discussed in this section by no means constitute an exhaustive list of policy changes that could potentially lead to savings. The approach taken here starts with broad categories of policy change including those that previously have been used to generate program savings and others that have been proposed or identified as a potential source of savings. Within each category, several options are discussed and the possibility for variations and alternatives noted. Estimates of potential Medicare savings are presented where available, but these do not take into account the interactive effects of combining options.
Medicare payment for physician services has been the subject of concern in recent years as short-term legislation has been regularly enacted to prevent substantial cuts in physician fees that would otherwise automatically result under the current Sustainable Growth Rate (SGR) formula. Enacting a long-term solution to the SGR fee reductions, which would increase Medicare spending against the current baseline, has been recommended by the National Commission on Fiscal Responsibility and Reform (the Simpson-Bowles commission) and also is discussed here. The Simpson-Bowles commission and the Medicare Payment Advisory Commission (MedPAC) each provided a menu of options for Medicare and Medicaid savings to offset the cost of their recommended reforms to the SGR. Those suggested program savings are addressed in the relevant policy categories as appropriate.
Policy Options
Reform Physician Payment and the Sustainable Growth Rate
The Balanced Budget Act of 1997 created a new Sustainable Growth Rate (SGR) formula that sets an annual target for Medicare spending on physician services. The target is composed of four factors:
» The estimated percentage change in physicians’ fees;
» The estimated percentage change in the average number of beneficiaries in original Medicare;
» The estimated 10-year average percentage change in real gross domestic product (GDP) per capita; and
» The estimated percentage change in spending on physician services due to any changes in law or regulation.
Under the SGR, if spending on physician services exceeds the target in a particular year, the annual update for physicians in the next year is reduced by that amount. Policymakers did not intend the formula to achieve significant savings; it was enacted as a safeguard against an increase in volume that might occur in response to constraints in the payment updates. However, the formula has proved to be flawed. Since 2001, the SGR would have triggered double-digit reductions in physician fees, and Congress has repeatedly intervened to postpone the cuts and enact freezes or small fee increases, most recently in early 2013 as part of the American Taxpayer Relief Act of 2012. Because the SGR remains the baseline policy, any legislation postponing or overriding fee reductions is “scored” as a cost to Medicare.
OPTION 2.25
Repeal the sustainable growth rate (SGR) and establish a series of legislated updates
The Simpson-Bowles commission recommended repealing the SGR and replacing it with a two-year freeze in physician fees in 2012–2013 and a 1 percent cut in all fees in 2014. The commission also recommended that, for 2015 and beyond, CMS develop an improved physician payment formula that encourages care coordination across multiple providers and settings and pays doctors based on quality instead of quantity of services.
MedPAC also has recommended repeal of the SGR coupled with a 10-year freeze in fees. In addition, MedPAC recommends that fees for non-primary care services be cut 5.9 percent each year for the first three years (MedPAC 2012e).
President Obama’s Fiscal Year (FY) 2013 budget does not include a specific proposal for fixing the SGR, but the Administration includes funds in its budget baseline and commits to working with Congress to achieve a permanent policy that will make payments to physicians predictable and encourage improvements in quality and efficiency.
Budget effects
MedPAC estimated that its recommendation would cost roughly $200 billion over 10 years.
Discussion
Experts have concluded that while the SGR likely resulted in smaller fee increases it has not restrained volume growth and may have contributed to volume increases for some specialties. Also, some physicians may have less ability to increase volume and therefore are hit harder by lower payment rates.
Payment reductions of the magnitude called for under the SGR formula could lead to serious access issues. Access to physician services currently is adequate for most beneficiaries but is a persistent concern. MedPAC’s most recent survey found that, only a small share of beneficiaries reported looking for a new physician and most reported no major problems; but finding a new primary care physician continues to be more difficult than finding a new specialist. Similar to prior surveys, racial and ethnic minorities in both the Medicare and the privately insured populations were more likely to experience access problems, particularly in finding a new specialist. For many physicians, especially certain specialists, not seeing Medicare patients may not be viable because Medicare represents a substantial portion of their practice revenue. The 2009 National Ambulatory Medical Care Survey found that among physicians with at least 10 percent of their practice revenue coming from Medicare, 82 percent of primary care physicians and 96 percent of physicians in other specialties accepted new Medicare patients.
Finally, beneficiaries would face increased costs under all of these proposals in the form of higher coinsurance payments combined with higher Medicare Part B premiums. To illustrate, if Part B spending increased by $100, the beneficiary share would increase $40, comprised of $20 for the 20 percent coinsurance and an additional $20 for a premium increase (25 percent of Medicare’s $80 portion).
OPTION 2.26
Retain the SGR and revise with a new a base period and other changes
This set of options would retain the SGR but change some of its parameters. Under this approach, Congress would forgive the cumulative spending that resulted from the temporary fixes enacted over 1996–2012. Lawmakers would then establish a new base period (e.g., 2012), limit the look-back period (e.g., to five years instead of 10), and base future payment updates to a different measure (e.g., GDP plus 1 percent). The formula could vary by type of services (e.g., a bigger update for primary care) and/or set an upper limit on any fee increase or decrease.
Budget effects
CBO estimates that resetting the SGR target at the 2011 spending level, with no other changes, would cost about $254 billion over a 10-year period (2013–2022) (CBO 2012c). Resetting the SGR target at the 2011 spending level and using GDP plus 1 percent in the target would cost about $314 billion and using GDP plus 2 percent would cost about $377 billion over the same 10-year period. According to CBO, using GDP plus zero percent, physician payments would again be cut beginning in 2016, because spending growth would exceed that target. Using GDP plus 1 percent would result in payments being cut beginning in 2017, but then rising again in the future. Using GDP plus 2 percent, physician payment rate updates would begin to rise in 2013.
Discussion
Retaining rather than repealing the SGR would maintain budget discipline but would be costly. MedPAC and others have concluded that the SGR has failed to moderate growth in the volume and intensity of physician services. A frequently cited reason for SGR’s lack of impact on service use is that the SGR does not provide any incentive for individual physicians to control the volume and intensity of services they provide and may, in fact, provide the opposite incentive since the update adjustment factor cuts all physicians’ reimbursements.
The SGR reform options also may not solve the physician update problem for the long term. CBO projects that negative updates would occur in some years unless the SGR target uses GDP plus 2 percent, which has a higher cost than the other options. Also, as was described for Option 2.25, beneficiaries also would face higher coinsurance and premium costs under this option.
OPTION 2.27
Make other reforms to the physician payment system
Separate from the SGR, lawmakers could make other changes to the physician payment system to generate savings for Medicare including reducing payments for “misvalued” services, cutting payments for multiple procedures performed on the same day, and making technical changes to payments for physician practice expense. These changes can affect the specific payment rate for an individual service by adjusting the relative value units (RVUs) for physician work, practice expense, and professional liability insurance expenses. Options related to changing the physician payment system by ensuring the payment accurately reflects the resources related to physician work and practice expense are discussed below.
OPTION 2.27A
Recalibrate the Resource-Based Relative Value Scale (RBRVS) to address “misvalued” services
The Affordable Care Act requires Medicare to establish a formal process for validating the physician fee schedule’s relative value units (RVUs). In 2012, CMS announced it would incorporate the statutory requirement for review at least every five years into its annual review of “misvalued” services that included a review of both the work and practice expense (PE) RVUs. MedPAC has recommended establishing an RVU reduction of at least 1 percent for five consecutive years.
The time that physicians and other health care providers spend in providing a service is also an important component to the calculations of the RVUs; current time estimates are based primarily on surveys conducted by specialty societies. To ensure the data are collected in a consistent and accurate fashion, MedPAC recommended the development of a cohort of practices to participate in data reporting. These practices would include a range of different practice types and those that incorporate techniques and technologies associated with improved efficiency, such as reorganized delivery systems and electronic health records. These groups would be the basis for collection of consistent and accurate time data for both work and practice expense, which could be used to identify overpriced services.
Budget effects
No cost estimate is available for this option. By statute, adjustments in RVUs are budget neutral and cannot cause expenditures to change by more than $20 million. However, changes associated with misvalued services could be made in a non-budget neutral manner. The savings would depend on the specific codes involved and corresponding utilization.
Discussion
ce 1992, Medicare’s physician fee schedule is based on the Resource-based Relative Value Scale (RBRVS), with payment based on the relative amount of resources it takes to provide a service as compared with other services. Concerns have been raised about perceived inequities in payments for primary care and those for other services, such as imaging, tests, and procedures,
In 2012, CMS initiated an annual review of “misvalued” services that were identified based on a variety of criteria, including high-expenditure services, services that had not been reviewed since 2006, services still valued at the original (1992) RVUs, all evaluation and management (E/M) services, and services that are publicly nominated. The process involves collaboration with the Relative (Value) Update Committee (RUC), created by the American Medical Association and national medical specialty societies to annually review a subset of services and make recommendations to CMS.
MedPAC believes an annual numeric goal for RVU reductions could improve the RVU review process. Concerns have been raised that this process is time consuming, will require significant resources by physician specialty societies and will take several years. There also are concerns that the process used by the RUC is not transparent and is dependent on surveys collected by specialty societies. CMS is developing a review process that includes different stakeholders and in September 2012 entered into two contracts to develop models for validation of physician work for new and existing services.
MedPAC has found that the time estimates are likely too high for some services. Further evidence of time errors contributing to misvalued services is CMS’ identification of services with revised downward time estimates after consultation with the RUC. Although the RUC does attempt to adjudicate the time estimates provided by surveys, the process lacks objective data. In addition, the process does not have an established framework for accounting for efficiencies that develop. An option to collect data from all physicians could be viewed as an administrative burden.
OPTION 2.27B
Expand the multiple procedure payment reduction (MPPR) policy
To account for efficiencies related to overlap or duplication of services, Medicare has a longstanding policy that reduces payment for the second and subsequent procedures furnished to the same patient on the same day (a reduction known as the multiple procedure payment reduction, or MPPR). The MPPR is applied to surgical procedures, outpatient physical therapy services, and many advanced imaging services. Depending on the services, the MPPR may apply only to the technical component (practice expense) or the professional component (physician work) or both. The size of the reduction in payment also depends on the type of service category.
The Government Accountability Office (GAO) has recommended CMS systematically review services commonly furnished together and implement a MPPR to capture efficiencies in both physician work and practice expense, where appropriate, for these services. The review would focus on service pairs that have the most impact on Medicare spending.
Similarly, MedPAC recommended implementing an MPPR to reduce the physician work component of diagnostic imaging services and expanding the MPPR to all imaging services and applying it to both the practice expense and professional components. MedPAC also encouraged CMS to explore applying the MPPR to the practice expense portion of diagnostic tests other than imaging such as electrocardiograms and cardiovascular stress tests.
This would accelerate efforts to expand application of the MPPR where appropriate. The ACA specifies that the HHS Secretary shall identify potentially “misvalued” codes by examining multiple codes that are frequently billed together and review and make appropriate adjustments to their relative values. CMS is working to identify non-surgical codes that are furnished together between 60 percent and 70 percent of the time. For 2013, CMS will extend the MPPR to practice expenses for some ophthalmologic and cardiovascular diagnostic services, and expand it to the professional component of certain advanced imaging services to include the professional component for physicians within the same group. The American Taxpayer Relief Act of 2012 (ATRA) increased the MPPR applicable to physical, occupational, and other therapy services from 20 percent to 50 percent beginning April 1, 2013.
Budget effects
No cost estimate is available for this option. Savings would depend on the specific procedures involved. Currently, changes in the MPPR are made in a budget neutral manner and produce no savings to Medicare. Congress could change that approach to achieve savings.
Discussion
This option would reduce excessive payments when multiple services are provided to a patient on the same day because the fee schedule does not recognize efficiencies that occur when two or more services are furnished together. But there often are disagreements about the magnitude of “duplicated” services and objective data can be hard to come by.
A potential downside to implementing this option is that beneficiary access to needed services could be affected if providers respond by providing fewer procedures or by arranging to perform services on different days to maintain separate billings. Monitoring of utilization could be undertaken to assess these effects and take steps to respond.
OPTION 2.27C
Change the assumptions used for determining the equipment utilization factor for calculating practice expense relative value units
Practice expense (PE) RVUs include the cost of the medical equipment used for each service, which are calculated on a cost per minute basis. The equipment cost per minute calculation includes minutes per year, an assumption about the percentage of time the equipment will be utilized (75 percent for certain expensive diagnostic imaging equipment and 50 percent for others), the price of the equipment, the interest rate, the useful life of the equipment, and maintenance.
The ACA requires the HHS Secretary to use a 75 percent equipment use rate for expensive diagnostic imaging machines beginning in 2011 in a non-budget neutral fashion, thus returning the savings to the trust fund. As a result, CMS increased the equipment use rate from 50 percent to 75 percent for 24 services that use diagnostic imaging equipment priced at over $1 million, such as diagnostic computed tomography angiography (CTA) and magnetic resonance angiography (MRA) procedures that use CT and MRI machines. ATRA increased the equipment use rate for such expensive diagnostic imaging equipment to 90 percent beginning in 2014.
Additional changes in assumptions regarding equipment use could be made. One option, recommended by MedPAC, would expand this provision to diagnostic imaging machines that cost $1 million or less. That is, a 75 percent utilization assumption would be applied to all diagnostic imaging machines. Another option would further increase the utilization assumption. For calculation of the cost of expensive medical equipment used for services, in 2009, MedPAC recommended the practice expense calculations should include a “normative” equipment standard which assumes that expensive diagnostic imaging machines are used 45 hours per week or 90 percent of the time that providers are assumed to be open.
Budget effects
No cost estimate is available for this option. Savings would require implementation in a non-budget neutral manner, as was done in the ACA and ATRA.
Discussion
These proposals are consistent with CMS’ commitment to improve the accuracy of practice expense payments. However, given the payment reductions resulting from changes in PE resource input assumptions, there is concern about beneficiary access to the affected services, especially in certain locales.
Modify Update Formulas and Make Other Changes to Overall Payment Levels
Annual payment rate updates based on statutory formulas are applied to most Medicare services (including inpatient and outpatient hospital, SNF, home health care, hospice, and hospital care in rehabilitation, psychiatric, and long-term acute care facilities). These formulas try to measure the price changes faced by providers in purchasing the goods and services that they use in the course of delivering patient care. Components of the formula, (such as employee wages and benefits, supplies and pharmaceuticals, and utilities and other building costs, are weighted to reflect the proportion of total cost contributed by each.
Medicare payments for such services as ambulance, ambulatory surgical centers (ASCs), laboratory services, certain durable medical equipment, and orthotics and prosthetics are updated annually by the increase in the Consumer Price Index (CPI).
To create an incentive for hospitals and other providers to improve their efficiency, the Affordable Care Act applies a productivity adjustment to most of Medicare’s annual updates. The adjustment reduces the update by the percentage increase in the 10-year moving average of private nonfarm business multifactor productivity, which is estimated to increase by about 1.1 percent per year over the long term. MedPAC research suggests that continued pressure on hospital rates leads to greater efficiency with quality that is at least as good.
The options below would achieve Medicare savings through changes to provider payment update formulas or other across-the-board changes to the level of payments.
OPTION 2.28
Freeze all Medicare payment rates for one year
A one-year freeze in all Medicare payment rates (except the physician fee schedule) would generate significant savings. Alternatively, provider-specific update reductions could be enacted based on analysis of the various Medicare service to determine which level of update is warranted.
Budget effects
No cost estimate is available for a fee freeze on all Medicare payment rates. Based on estimates from CBO, freezing inpatient and outpatient hospital payments in 2013 would save about $30 billion over 10 years (2013–2022), and freezing skilled nursing facility (SNF) and home health agency (HHA) rates would save about $6 billion and $4 billion respectively (CBO 2012b). Freezing the rates for all other Medicare services (except those paid under the physician fee schedule) would save about $12 billion, bringing total 10-year savings to about $52 billion for this option. The proposal generates significant savings because payment rates are not adjusted upward in future years to remove the effect of the one-year freeze.
Discussion
In general, cuts in annual update factors are simple to implement and can produce large savings, but deep cuts that are driven by the need for budget savings can work against the goal of sustaining beneficiary access to high quality care. Applying an across-the-board freeze or update factor reduction could fail to take into account what might be the appropriate update factor or payment level for a particular Medicare service.
In its March 2012 recommendations to Congress, MedPAC recommended payment update reductions for several Medicare services based on its analysis of the appropriate payment level for these services. This included reductions for inpatient and outpatient hospital services, rehabilitation and long-term care hospitals, SNFs, HHAs, ASCs, and hospice services.
OPTION 2.29
Use a refined inflation measure to update Medicare payment rates currently adjusted by the CPI
The Simpson-Bowles commission recommended adopting an inflation measure known as the “Chain-Weighted Consumer Price Index for Urban Consumers” or C-CPI-U, for most government programs including Medicare. The C-CPI-U, developed by the Bureau of Labor Statistics, is viewed as a more accurate picture of inflation’s impact on spending because it accounts for substitutions made when products and services become more costly. The following Medicare services base inflation updates on the CPI-U:
» Ambulatory Surgical Centers
» Direct graduate medical education
» Clinical diagnostic laboratory services
» Durable Medical Equipment (DME)
» Prosthetics and orthotics
» Parenteral and Enteral Nutrition (PEN)
» Ambulance services
Payment rates for other Medicare services use different inflation measures and would not be affected. These include hospitals and physicians as well as other facilities.7
Budget effects
No cost estimate is available for this option.
Discussion
Adopting the C-CPI-U inflation index has had bipartisan support in Congress. Government-wide adoption would affect tax revenues as well as eligibility and payments for many public programs, including Social Security, Medicare, Medicaid, and others. The largest savings would come from lower Social Security benefits resulting from reduced annual cost-of-living updates. In Medicare, use of C-CPI-U also could mean that more beneficiaries would be subject to income-related premiums under Parts B and D because the indexed thresholds would rise more slowly, and could trigger additional cuts by the Independent Payment Advisory Board (IPAB) (see Section Five, Spending Caps and Governance and Management for options related to IPAB).
OPTION 2.30
Reduce payment rates for clinical laboratory services
Clinical laboratory services are paid on the basis of fee schedules, and payments totaled about $9 billion in 2011. The fee schedules were established in 1985 based on local area charges (56 separate fee schedules apply across geographic areas), but national payment limits apply for each test, and as a practical matter most tests are paid at the national limits. The fee schedule amounts are indexed to increases in the CPI (and since 2011 are subject to the productivity adjustment) but legislation frequently has specified a freeze or reduction in rates; fees have been increased only three times between 1997 and 2012. This option would impose an across-the-board reduction in payments.
Budget effects
MedPAC estimated in October 2011 that a 10 percent reduction in clinical lab rates would save $10 billion over 10 years; the Middle Class Tax Relief and Job Creation Act of 2012 imposed a 2 percent reduction and was scored as saving $2.7 billion over 10 years (2013–2022).
Discussion
Although Medicare savings can be achieved by reducing provider payment rates, including those for clinical lab services, reducing fees does nothing to encourage more efficient use of clinical lab services. Reductions in Medicare fees may affect beneficiary access to services, particularly in rural areas served by smaller laboratories. Data that might be used to determine the adequacy of Medicare payment rates—comparing payments with the cost of providing laboratory services, for example—are not available.
Expand Value-Based Purchasing and Reduce Hospital Readmissions
In Medicare’s FFS payment systems, providers generally are paid more when they deliver more services without regard to the quality or value of the additional services. The Affordable Care Act begins to move Medicare toward a “value-based” purchasing (VBP) system, linking a percentage of the Medicare payment to quality and imposing penalties on hospitals for excessive readmission rates. The VBP payment adjustment is based on each hospital’s performance score for selected quality measures. Current measures primarily involve clinical process of care but also include patient experience of care, mortality and other patient outcomes, and Medicare spending per beneficiary as a measure of efficiency. In Fiscal Year 2013, the hospital VBP program affects only 1 percent of payments, increasing to 1.25 percent for FY 2014, 1.5 percent for FY 2015, 1.75 percent for FY 2016, and 2 percent for FY 2017 and thereafter.
Options related to strengthening and expanding the VBP programs and expanding the hospital readmissions reduction program are discussed below
OPTION 2.31
Use value-based purchasing (VBP) programs to achieve savings (rather than being budget neutral), increase the percentage of Medicare payments subject to VBP, and place greater emphasis on patient outcomes and efficiency
The ACA required value-based purchasing to be budget neutral—that is, the total amount of withheld payments must be paid out as value-based incentive payments to hospitals participating in the VBP program. This option would remove the budget neutrality requirement and a hospital’s VBP adjustment would be determined based on performance standards set in statute or by the HHS Secretary (for example, a hospital might be required to have a VBP performance score at or above the 75th percentile). This option also would restructure the hospital VBP program to emphasize measures of outcomes and reduce Medicare payments when lower quality, lower value care is provided. It also would gradually increase the proportion of Medicare payments subject to VBP to 5 percent, from a fully phased-in 2 percent under current law.
Budget effects
No cost estimate is available for this option. Savings from this option would depend on the proportion of payments subject to VBP and hospital performance on the quality measures. CMS has estimated that the VBP incentive pool for FY 2013 will total $963 million. Illustratively, if removing budget neutrality resulted in about 10 percent of the pool not being paid to hospitals and reverting to Medicare, potential 10-year savings would be in the range of $2.5 billion to $3.5 billion.
Discussion
This option seeks to improve patient outcomes and increase the efficiency of Medicare purchasing as it responds to current and future financing challenges. Adjusting a greater portion of Medicare’s payment for performance on quality measures moves Medicare further in the direction of becoming a prudent purchaser of services and provides an additional incentive for hospitals to improve the quality and efficiency of care. When payments are reduced for care delivered by lower-quality providers, Medicare would not pay other providers more, as budget neutrality requires.
Hospitals generally have argued that the VBP program should be budget neutral to ensure the focus is on quality improvement and not on generating budget savings. Budget neutrality allows the VBP incentive system to make larger bonus payments to top-performing hospitals, which gives an additional incentive for improved quality of care. Hospitals also may prefer a smaller share of payments to be determined based on quality performance to maintain predictability of payments.
OPTION 2.32
Expand value-based purchasing to other Medicare services
Medicare currently includes some level of performance-based payment in inpatient hospital and ESRD facilities. Beginning in 2012, an ESRD facility must achieve a total quality performance score that meets or exceeds a level determined by CMS in order to receive full payment. The assessment of each ESRD facility includes a range of performance standards, such as anemia management and dialysis adequacy.8 A value-based payment modifier will be applied to the physician fee schedule beginning in 2015 for some physicians, and will be extended to all physicians beginning in 2017. The adjustment, which is budget-neutral, will modify 1 percent of the physician fee schedule payment based upon the quality and cost of care.
The ACA directed the Secretary of Health and Human Services to develop VBP implementation plans for SNFs, HHAs, and ASCs. The plans address several issues including measure development, reporting and validation of data, setting performance thresholds, the structure and financing of payment adjustments, and public reporting. Implementation of VBP for these other programs, however, requires legislation.
Potentially avoidable hospital admissions and readmissions are elements of performance identified by HHS for possible inclusion in VBP for skilled nursing facilities and are incorporated into the Nursing Home VBP Demonstration. Reducing such admissions would have benefits in terms of both quality and greater efficiency. Unnecessary hospitalizations can be harmful to patients’ physical and mental well-being, and represent a significant expense for Medicare. A study by RTI International of dual eligibles estimated 42 percent of re-hospitalizations during a Medicare-covered SNF stay and 47 percent of hospitalizations of longer-stay Medicaid-covered nursing home residents were preventable. These admissions cost Medicare $2.6 billion in hospital payments in 2005.
(Exhibit 2.6) shows when quality reporting began for Medicare services not subject to VBP.
Budget effects
No cost estimate is available for this option. Savings from value-based purchasing would depend on the portion of payments put at risk and the performance of providers on the quality measures. Illustrative savings from extending VBP to other Medicare services are shown in (Exhibit 2.7), based on assumed savings of one-tenth of one percent of expenditures.9 Additional savings would accrue to the extent VBP spurred quality improvements that reduce program spending, such as fewer health care-acquired infections or lower critical care utilization.
Discussion
There is broad consensus among employers, beneficiary groups, and payers, both public and private, that health care services should deliver better outcomes and become more efficient. Various organizations have called for more performance measurement and value-based programs to help induce that improvement. Expanding VBP to other Medicare services would build on current quality initiatives and move other Medicare services toward more prudent purchasing.
Protecting beneficiaries is another consideration in designing VBP. Incentives should be structured to reward more efficient care and not stinting on care. For example, in encouraging reductions in avoidable hospitalizations and readmissions, safeguards to assure that necessary hospitalizations are not avoided should also be in place.
The effectiveness of VBP programs may depend on the efficacy of the measures, their focus on outcomes and efficiency, and proportion of payments subject to VBP. Poorly designed or inadequately risk-adjusted outcomes measures may affect access for the sickest patients.
OPTION 2.33
Expand the readmissions reduction program to post-acute care providers such as skilled nursing facilities, long-term care and rehabilitation hospitals, and home health agencies
The ACA includes a provision, effective October 1, 2012, to reduce inpatient hospital payments for hospitals with risk-adjusted readmissions exceeding a certain level. In FY 2013, the program applies to three conditions—heart attack, heart failure, and pneumonia—using standardized hospital readmission measures that currently are in the hospital quality reporting program. In future years, CMS plans to expand the list of applicable conditions beyond the initial three conditions and add conditions that have been identified by MedPAC.
In its March 2012 report to Congress, MedPAC recommended implementing a similar re-hospitalization policy for SNFs. This proposal also was included in President Obama’s FY 2013 budget. If modeled after the hospital readmission policy, this option would reduce payment rates to SNFs with above-average re-hospitalization rates.
Initially, the re-hospitalizations penalty may apply to a limited number of conditions for which hospitalization has been demonstrated as largely preventable with higher-quality nursing care. With experience and evidence, policies could be extended to apply to a broader set of conditions and to excessive rates, whether or not above average. For example, research has identified five conditions (respiratory infections, congestive heart failure, kidney and urinary tract infections, electrolyte imbalance, and sepsis) accounting for three-quarters of re-hospitalizations from SNF and preventable with high-quality nursing care. Risk adjusters also are available for these conditions to allow distinctions among preventable and unavoidable readmissions. A readmission policy also could be extended to long-term care hospitals. MedPAC found that long-term care hospital patients with certain conditions had experienced increases in readmissions disproportionate to their volume growth. Extending a readmissions policy to rehabilitation facilities and home health agencies would establish a consistent policy across post-acute care providers.
This option could be expanded to address additional preventable hospital admissions from Medicare SNFs. That is, Medicare SNF payments could be reduced for facilities with high rates of preventable hospital admissions for any nursing home resident who is a Medicare beneficiary, not just those in a Medicare Part A-covered SNF stay. Nursing home residents experience higher rates of preventable hospital use than other Medicare beneficiaries (Jiang et al. 2010). In part, these hospitalizations reflect inadequacies in physician and nurse staffing in nursing homes (Ouslander and Berenson 2011). They also reflect financial incentives for nursing homes, whereby admitting long-stay Medicaid patients to hospitals and then readmitting them to the SNF creates a post-acute stay, and the nursing home receives the higher Medicare SNF payment rate. Just as with the hospital readmissions policy, however, a potential downside to a penalty-based approach is that lowering payments to poor-performing facilities could make it less likely that they will invest the resources needed to provide nursing home residents with the level of care that precludes the need for a hospital stay.
Budget effects
CBO estimated that the President’s FY 2013 budget proposal to adjust SNF payments to reduce preventable hospital readmissions would save $1.4 billion over 10 years (2013–2022). No cost estimate is available for extending a readmissions reduction program to other post-acute services.
Discussion
Avoidable readmissions are a bad health outcome for patients and costly to Medicare. The current penalty for excessive readmissions is leading hospitals to give greater attention to the problem of readmissions. Extending the readmissions reduction policy to SNFs and other post-acute providers would provide a similar incentive for them to focus on the problem. Having all providers in the care episode face similar incentives could provide new incentives for improved communication and cooperation. According to MedPAC analysis, risk-adjusted re-hospitalization rates for patients with potentially avoidable conditions vary almost threefold across SNFs, suggesting a significant potential for improvement for many facilities.
However, hospitals treating a high proportion of low-income patients may have higher readmission rates and could be unfairly penalized. CMS has committed to working with stakeholders to undertake additional analysis. Concerns have been raised about potential overcrowding in hospital emergency departments if the hospital readmissions reduction program leads hospitals to avoid readmitting patients. Patients may be kept in observation status for an extended period of time and not admitted to the hospital. Rising use of observation care is a current Medicare issue for beneficiary advocates because the practice increases beneficiary coinsurance payments and represents hospital care that does not meet the requirement of a prior three-day hospital stay to qualify for Medicare SNF care.
Extension of the readmissions program could require refinement in other areas as well. One area of significant concern is patients under “extreme circumstances” such as transplants, end-stage renal disease, burn, trauma, psychosis, and substance abuse.
Reduce Medicare Payments for Graduate Medical Education
Medicare makes two types of payments to hospitals for costs associated with training medical residents. Direct graduate medical education (GME) payments are made to cover Medicare’s share of the costs of resident salaries and other direct costs borne by hospitals that operate medical residency programs. GME payments are projected to average about $3 billion annually through 2022. The indirect medical education (IME) adjustment further increases the amount paid to teaching hospitals for each Medicare beneficiary discharged from an inpatient hospital stay. These payments will total almost $7 billion in 2013, growing to nearly $12 billion by 2022.
OPTION 2.34
Reduce the indirect medical education adjustment
The IME adjustment is calculated using a formula intended to recognize the additional costs of patient care that teaching hospitals incur, taking into account the more complex mix of patients they treat and other cost factors. The formula essentially pays teaching hospitals an additional 5.5 percent per Medicare stay for every 10 percent increase in the hospital’s ratio of medical residents to beds.
MedPAC, the Simpson-Bowles commission, and others have recommended reducing the IME adjustment factor to a level consistent with the empirical estimates of the cost of providing patient care in hospitals that have medical residents compared to costs of care in other hospitals. The most recent published estimate justifies a factor of 1.88 percent, about one-third the current level (Nguyen and Sheingold 2011). Similar earlier estimates by MedPAC estimated that costs increase about 2 percent for every 10 percent increase in a hospitals’ resident to bed ratio.
Budget effects
In 2010, MedPAC estimated that reducing the IME adjustment from 5.5 percent to 2 percent would reduce annual IME payments by about $3.5 billion, or 54 percent of current spending. Applying that savings percentage to the most recent CBO projections of IME spending produces a savings estimate of approximately $50 billion over 10 years. The President’s budget for FY 2013 proposed to phase down the IME adjustment by a total of 10 percent, which CBO estimates would save $6 billion over 10 years (2013–2022).
Discussion
Paying more than the empirically justified level is viewed as excessive because additional funds are not needed to cover the costs associated with resident training. Moreover, other features of the Medicare payment policy for hospitals recognize higher costs borne by teaching hospitals. MedPAC has reported that Medicare revenue margins are much higher for teaching hospitals than non-teaching hospitals, in part due to the IME additional payments.
Teaching hospitals would have to make changes to accommodate what would be, for many, a substantial revenue reduction. Some of these changes might affect the availability of services or the quality of patient care provided to Medicare beneficiaries and others in teaching hospitals. In addition, some hospitals may decide to reduce the number of residents they train or residency programs they operate if the IME adjustment is reduced. Depending on which programs are reduced, long-term access to care could be reduced if fewer physicians are trained in needed specialties.
OPTION 2.35
Reduce direct graduate medical education payments
Direct graduate medical education payments generally are based on historical hospital-specific per-resident amounts, which are slightly higher for primary care residents than those in other specialties and are reduced for lengthy subspecialty training. Through 2013, the amounts are also subject to a floor and a ceiling based on the national average salary amount adjusted for local area costs. Finally, there are hospital-specific caps on the number of residents for which a hospital may receive reimbursement.
One option for reducing direct GME payments included in the Simpson-Bowles commission report would limit direct GME payments to 120 percent of the national average salary paid to residents in 2010, updated annually thereafter.
Budget effects
No cost estimate is available for this option.
Discussion
Per-resident payment amounts vary widely across hospitals, in part due to differences that are not directly tied to the current cost of operating the residency program, such as historical allocation of hospital overhead costs. Over time, Medicare policies have been modified to reduce this variation by instituting a floor on per-resident amounts as well as limiting updates to per resident amounts below a certain level. The approach recommended by the Simpson-Bowles commission would achieve program savings by limiting per-resident amounts and would base the limits using recent information on salaries paid to medical residents.
While achieving savings and reducing potentially unnecessary variation on payments for medical residency programs, a cap is a blunt instrument that could harm some residency programs. Some teaching hospitals with current costs that exceed the cap could reduce the resources they devote to resident training in ways that have negative effects on the quality of the resident training experience or that reduce the number of available residency positions. In addition, this option does not take steps to ensure that residency programs are producing the mix of physician specialties needed to address national health care needs.
OPTION 2.36
Reduce and restructure graduate medical education payments to hospitals
This option would pool IME and direct GME funding and create a new mechanism for distributing these payments to teaching hospitals. The initial aggregate pooled amount may or may not include reductions in IME funding as described in Option 2.34; MedPAC has recommended that savings from a reduction in IME be transferred to such a pool and combined with direct GME funds. Once an initial pool amount is established, it could be indexed to grow over time along with general inflation, health care price inflation, or some other measure.
The new pooled funds would be delinked from Medicare payment for inpatient stays and could be distributed in a number of ways. Under the model recommended by MedPAC, the HHS Secretary would establish performance-based standards for distributing the pool of graduate medical education funds. These standards would be designed to achieve certain educational goals and outcomes aimed at producing a health care workforce that delivers care at lower costs while improving quality. Funds could be paid to teaching hospitals, medical schools and other organizations sponsoring residency programs, and the level of funding tied to performance on the specified measures.
Additional ideas for distribution of Medicare’s GME funding may be identified in a forthcoming report by the Institute of Medicine (IOM), which currently is engaged in a consensus study of GME financing and organization aimed at addressing the health care workforce needs. The pooled funds could be limited to Medicare contributions or could be complemented by payments from other health care purchasers.
Budget effects
The budget effects of this approach depend on the extent to which the types of cuts discussed in Options 2.34 and 2.35 are included, and which indexing measure is used. In 2011, CBO estimated that pooling the excess IME funds, direct GME funds, and Medicaid GME funds, and indexing the pooled amount to annual growth in the CPI minus 1 percentage point would generate savings of $69.4 billion over 10 years (2012–2021). The vast majority of these savings would come from Medicare.
Discussion
This approach would allow Medicare’s contributions toward financing medical education to be allocated in ways that better meet national goals in the nature of graduate medical education training and the composition of the health care workforce. However, like the other options, reductions in funding could negatively affect some residency programs, and could make it more difficult to achieve improvements in the health care workforce aimed at meeting national needs.
Expand Competitive Bidding and Adopt Selective Contracting
Medicare generally contracts with all providers and suppliers that meet specified program standards. Use of competitive bidding and selective contracting offers potential for using markets to set program payment rates and opportunities to obtain lower prices in exchange for higher volume of Medicare business. Medicare has been phasing in a competitive bidding program for certain durable medical equipment, prosthetics, orthotics, and supplies (DMEPOS), beginning with nine metropolitan statistical areas (MSAs) in 2011. This program is slated to expand to an additional 91 MSAs effective July 1, 2013, and will then include a national mail order component for diabetes supplies.
OPTION 2.37
Expand the use of competitive bidding
Competitive bidding could be expanded to other items and services, such as clinical laboratory tests, diagnostic imaging services, medical devices, Part B drugs, and other commodities and could involve increased reliance on regional or national mail order companies. The approach is likely to work best for items and services that vary little in terms of quality (e.g., manufactured products meeting general standards and tests conducted using automated equipment) or for which there are adequate means to monitor supplier performance. For some items, competitive bidding might be conducted at the manufacturer level, rather than at the provider or supplier level, as is done today, for example, by the Veterans Health Administration through national contracts.
Budget effects
No cost estimate is available for this option. In the first year of operation, the DMEPOS competitive bidding program saved Medicare about $202 million, and CMS projects that the program will save the program $26 billion over 10 years (2013–2022), with an additional $17 billion in savings for beneficiaries during that period (CMS 2012b). This amounts to savings of 20 percent to 30 percent. Savings projections for other possible uses of competitive bidding are not available and could differ in percentage terms from the reductions projected for DMEPOS.
Discussion
Average payment reductions of 35 percent in the DMEPOS Round 1 Rebid suggest the potential for additional Medicare savings through expanded use of competitive bidding. Early experience under the DMEPOS competitive bidding program appears to have been generally positive, with relatively few beneficiary complaints and no obvious negative effects on beneficiary access or health status. Nonetheless, competitive bidding means that only some providers or suppliers can furnish competitively bid items and services to Medicare beneficiaries, making the characteristics of these providers—such as their geographic distribution—of obvious importance to beneficiaries. Doing business with a limited pool of providers or suppliers may, however, make it easier for CMS to monitor performance, require improved beneficiary service, and prevent fraud and abuse.
Critics have faulted the methodology used by CMS under the DMEPOS competitive bidding program for failing to make bids binding, basing payments on the median of winning bids, and having other perceived flaws, and have argued that these problems may cause the program to “degenerate into a ‘race to the bottom’ in which suppliers become increasingly unreliable, product and service quality deteriorates, and supply shortages become common” (Letter to Pete Stark 2010). There also are concerns that beneficiaries might be denied access to higher quality products, need to travel far to obtain the products they need, or suffer other, perhaps subtle changes in quality or service over time.
OPTION 2.38
Adopt selective contracting for provider or service categories
CMS could be authorized to use selective contracting, and this authority could be limited to urban areas or selected provider or service categories.10 Selective contracting could be used to negotiate payment levels lower than those that would otherwise apply or providers could be asked to offer Medicare a discount in return for being designated a Medicare preferred provider. In addition, selective contracting could be limited to providers meeting certain quality and efficiency thresholds, possibly leading to higher quality of care and improved beneficiary service.
Under one approach to selective contracting, Medicare beneficiaries would be required to select only from providers having contracts with Medicare. Alternatively, beneficiaries could retain the option of seeking care from any Medicare-enrolled provider, but would qualify for reduced cost-sharing or other incentives whenever they use a Medicare “preferred” provider.
Budget effects
No cost estimate is available for this option.
Discussion
Selective contracting would be a major departure for Medicare, especially if it restricted beneficiary choice. However, it could be used to reduce Medicare expenditures in locales with large numbers of providers of a certain type or for service categories where there is evidence that Medicare payment rates are overly generous. Some of the resulting savings could be used to encourage beneficiaries to use Medicare preferred providers. Selective contracting also could facilitate anti-fraud and anti-abuse efforts.
Selective contracting would not likely be a viable strategy in rural areas with few providers, or for provider or service categories in relatively short supply. Even in urban areas, CMS might find it challenging to identify providers meeting certain quality and efficiency thresholds who are also willing to agree to Medicare contract terms, but this might depend on the nature of these terms and CMS’ expectations with respect to per-service payment reductions. Also, in using selective contracting, CMS would need to ensure adequate beneficiary access throughout the affected geographic areas. Providers failing to secure contracts with Medicare might not be economically viable, especially if Medicare beneficiaries made up a substantial share of their current patient mix. Selective contracting also could end up imposing high barriers to entry of new providers and suppliers.
Rationalize Payments Across Settings and Circumstances
These options address the potential for Medicare to equalize payments for the same service across care settings, identify whether Medicare payment rates are reasonable relative to the broader marketplace and/or Medicare’s purchasing power, and encourage the delivery of care in the lowest-cost setting appropriate for the patient.
OPTION 2.39
Equalize payments across settings
Medicare maintains a large number of independent payment systems, sometimes producing very different payment rates for the same or similar services across settings of care. In recent years, Medicare has taken steps to address this issue, including limiting payments for the technical component of advanced imaging services furnished in physician offices at levels paid for these services in hospital outpatient departments, and limiting payments for certain surgical procedures furnished in ambulatory surgical centers but commonly provided in physician offices at the level paid in the physician office setting.
CMS could be directed to identify additional circumstances warranting payment equalization. MedPAC has called for such equalization with respect to outpatient visits furnished in hospital outpatient departments. MedPAC also has identified additional hospital outpatient department (OPD) payments that should be reduced to the levels paid when the same services are furnished in physicians’ offices or where current payment differentials between hospital OPD and physician office settings should be narrowed substantially. In addition, other options discussed in this section provide specific examples of approaches to payment equalization across post-acute care settings.
Budget effects
MedPAC has estimated that equalizing payments for outpatient visits furnished in hospital outpatient departments (phased in over three years with special safeguards for hospitals that serve a relatively large share of low-income patients) could reduce Medicare spending by between $250 million and $750 million in 2013 and by between $1 billion and $5 billion over five years (MedPAC 2012e). MedPAC has estimated that Medicare payment reductions for an additional 86 hospital OPD services, with the goal of producing a site-neutral payment policy for these services, would yield one-year Medicare savings of $900 million and reduce Medicare beneficiary cost sharing by $250 million. The potential savings from this option would depend upon the types of services affected, their Medicare utilization trends, and the amount of resulting per-service payment reductions, but could be substantial.
Discussion
MedPAC argues that Medicare should base payment rates on the resources needed to treat patients in the most efficient setting, taking into account any differences in patient severity. In doing so, MedPAC has noted that hospitals’ acquisition of physician practices has essentially had the effect of converting physician office buildings into hospital outpatient departments, thereby increasing Medicare expenditures for what had previously been physician office visits. Payment equalization also can have the added benefit of reducing beneficiary cost-sharing obligations.
A key challenge in equalizing payments across settings is making certain that “apples to apples” comparisons are being made. Providers argue that differences in patient characteristics, provider service or regulatory obligations, uncompensated care burdens, or the services covered by a Medicare payment amount in a given setting are among the factors that could easily make equalizing payments an inequitable undertaking. These differences might be addressed by reducing but not eliminating payment differentials across settings of care. Even when equalization is considered fair and proper, careful monitoring of beneficiaries’ access to the affected services is warranted.
OPTION 2.40
Use inherent reasonableness authority to reduce overpayments
In December 2005, CMS published a final rule specifying a process for correcting Medicare payments found to be “inherently unreasonable” because they are either grossly excessive or grossly deficient. This process, which applies to items and services not paid under a prospective payment system, has not been used since then, but CMS hosted a public meeting in 2012, to explore the possibility of using the process to reduce payments for non-mail order diabetic testing supplies. Although the American Taxpayer Relief Act of 2012 recently mandated equal payment for mail order and non-mail order diabetic testing supplies upon implementation of the national mail order competitive bidding program, CMS could apply the inherent reasonableness process to other items and services on an annual or other periodic basis. In addition, Congress could revise the inherent reasonableness authority to facilitate its use, such as by modifying procedural or data requirements.
Budget effects
No cost estimate is available for this option. CMS has characterized the savings potential for non-mail order diabetic testing supplies as significant.
Discussion
Successful application of inherent reasonableness to correct excessive Medicare payments would produce not only Medicare savings but also a reduction in beneficiary cost-sharing amounts. Application of the inherent reasonableness authority would allow Medicare to use means other than competitive bidding to determine market prices, such as surveys of retail prices for equipment and supplies that are generally available on a retail basis. Identifying valid and reliable data justifying a payment reduction (or a payment increase in the case of “grossly deficient” Medicare payments) may be a limiting factor in applying this authority. The procedural requirements related to use of inherent reasonableness may explain why this tool has not been used in the seven years since the associated regulatory framework was put in place.
OPTION 2.41
Encourage care in lower-cost settings
Medicare coverage and payment policies can influence the site of care. For example, if Medicare payments for one or more medically necessary services in one setting are considered inadequate by providers, a patient may be transferred to a higher-cost setting even though the services could have been furnished safely and effectively elsewhere at lower cost to Medicare. Addressing this problem may require adjustments to Medicare’s usual payment policies in order to provide more appropriate incentives. MedPAC recently discussed the potential for Medicare home infusion policies to produce Medicare savings by allowing patients to be treated at home rather than in higher-cost hospital or nursing home settings. One randomized clinical trial also demonstrated that savings could be produced by making supplemental payments to nursing homes to treat residents with pneumonia and other lower respiratory tract infections with a clinical pathway or treatment protocol rather than the usual practice of transferring them for inpatient hospital care. CMS could identify, on an annual or other basis, opportunities for modifying Medicare coverage and payment policies to incentivize appropriate care in lower-cost settings and a target Medicare savings amount could be specified.
Budget effects
No cost estimate is available for this option.
Discussion
Encouraging appropriate shifts in site of care is difficult. Shifts in site of service would need to result in savings that exceed the effects of other potentially confounding factors. For example, payment improvements relating to the provision of a service in one setting, such as home infusion therapy, could provide incentives for increased use of the service in such setting even when other, lower-cost services would have sufficed. In other words, unless policymakers proceed cautiously, Medicare could find that more patients end up receiving home infusion therapy rather than lower-cost oral medications, thus reducing any savings from shifting medically necessary infusion therapy from higher-cost settings.
Government-induced shifts in site of care should be predicated on reasonably solid evidence that such shifts are appropriate for Medicare beneficiaries, and not simply a means to produce Medicare savings. Finding the data needed to develop payment policies that properly encourage such shifts also is likely to be challenging. Nonetheless, taking advantage of the savings potential from shifts in site of care also could affect beneficiaries if their cost-sharing obligations end up being reduced in the process.
Change Payments for Post-Acute Care and Hospice Care
For patients leaving an acute care hospital, Medicare covers post-acute care in multiple settings—in institutions that include SNFs, inpatient rehabilitation facilities (IRFs), and long-stay hospitals, and at home with care from home health agencies. Some post-acute care, such as home health care, can be covered without a prior hospital stay, which is intended in part to prevent a hospitalization. Post-acute care, broadly defined, accounted for more than one-seventh (15 percent) of traditional Medicare spending in 2011, up from 12.9 percent in 2001, making it the third largest category of program spending (following hospital and physicians services).
Medicare payments for post-acute care services have grown rapidly in recent years. From 2006 through 2011, while overall Medicare spending growth averaged 4.6 percent annually, SNF and home health spending growth averaged 10.2 percent and 8.6 percent, respectively. Growth patterns differed for different types of providers. For SNFs, the number of providers across the nation held steady, but the number of home health agencies increased by almost 40 percent. Episodes of home health care grew substantially at 6.9 percent per year from 2002 to 2009.
Growth in the number of service providers and in benefits claimed is not by itself evidence of excessive spending. However, the geographic pattern of growth raises questions. The bulk of the new home health agencies are concentrated in a very small number of states and do not appear to be a response to a deficient supply. Growth is also disproportionately fueled by for-profit providers (MedPAC 2012e). In addition, profit margins show that payments to post-acute providers are well above costs. In 2010, average profit margins for free-standing or non-hospital SNFs (90 percent of all SNFs) reached 18.9 percent—according to MedPAC, the tenth consecutive year with margins above 10 percent. A quarter of SNFs had margins of 26.9 percent or higher. Home health agency margins have averaged 17.5 percent since 2001 and, in 2010, averaged 19.4 percent. These averages are more than twice the margins other provider types earn from Medicare.
This section examines several options for reducing costs and assuring quality of post-acute services.
OPTION 2.42
Modify skilled nursing facility (SNF) and home health payment
Medicare payments for SNF and home health services could be modified in a number of ways. One approach is an across-the-board reduction in the prospective payment rates paid to these providers, also called rebasing. Shared savings and risk is an alternative to rebasing under which the Medicare program would make retrospective adjustments to a provider’s payment. Another payment policy change would pay for therapy services based on a patient’s prospectively determined need for therapy rather than on the amount of therapy services provided.
OPTION 2.42A
Rebase SNF and home health payment rates
This option would reduce SNF and HHA payment rates to bring payments more in line with costs, a process referred to as rebasing. MedPAC has recommended rebasing SNF rates with a 4 percent reduction in 2014 and applying subsequent reductions, as determined by the HHS Secretary, over an appropriate transition until Medicare’s payments better track providers’ costs. MedPAC also recommended accelerating the rebasing of HHA rates—scheduled to begin in 2014—to 2013.
President Obama’s FY 2013 budget described an alternative approach to address SNF and HHA payment levels by reducing statutory payment updates for SNFs and HHAs and other post-acute care providers (inpatient rehabilitation facilities and long term care hospitals) by 1.1 percentage points each year for eight fiscal years, 2014 through 2021, or to zero if the result would have been a payment reduction.
Budget effects
MedPAC estimates its proposals to rebase SNFs and HHAs would each save between $5 billion and $10 billion over five years (MedPAC 2012c). CBO estimated that the update reductions for post-acute care included in President Obama’s FY 2013 budget would save $45 billion over 10 years (2013–2022).
Discussion
MedPAC recommends rebasing SNF and home health rates because the cost experience on which they are based has changed significantly since the implementation of the PPS more than a decade ago. PPS implementation led to a change in service mix with substantially lower-than-expected average costs compared to the historical experience used to set PPS rates. Persistently high average Medicare margins for both provider types reflect the resulting excess of average payments over average costs. Rebasing would align rates to reflect the costs of serving current patients.
MedPAC’s ongoing monitoring of beneficiary access and the quality of SNF and home health care has found no significant issues of concern. MedPAC believes the phased in SNF and HHA reductions it recommended would not have a significant negative effect on provider supply, beneficiary access, or the quality of care.
Rebasing, however, has limitations. Although it would narrow the gap between current payments and average service delivery costs, its application would not reflect the significant variation in the needs and costs of individual patients that is not captured by the patient classification categories used by the SNF and home health payment systems. Providers can therefore be advantaged by serving patients whose care needs are less than average for the category or disadvantaged by serving patients with above-average care needs. Rebasing to align average payments and average costs would particularly affect providers now serving patients with above average care needs who would be more likely to incur losses and would exacerbate incentives to avoid high cost patients. Moreover, for post-acute services, the absence of measurable standards of adequate care allows providers to profit from under-provision of care, regardless of the population they serve. Hence, even with rebasing to better tie average payments to average costs, profit margins may well continue to vary widely independent of providers’ efficiency in delivering care.
OPTION 2.42B
Modify SNF and home health payment to combine prospective payment with shared savings and risk
This alternative to rebasing would adjust payments to reflect actual service provision through retrospective adjustment to prospectively-set rates—sharing the difference between prospective payment rates and actual service costs with individual providers. At the end of each year, provider experience would be assessed to determine the difference between prospective payments and actual costs. Providers would receive a share, rather than the full amount, of any excess of rates over costs. Similarly, Medicare would pay a share of provider costs that exceeded prospective rates. To encourage efficiency, providers would be able to earn a sufficient share of profits and bear the larger share of losses. This policy option could be adopted with or without rebasing of current Medicare prospective rates.
Budget effects
No cost estimate is available for this option. MedPAC indicated that this type of option could be budget neutral. It also could be designed to result in an average margin level that represented what a prudent purchaser may be willing to pay. A 10 percentage point reduction in the average margin would have resulted in savings of approximately $3 billion in SNF spending and $2 billion in home health spending in 2011.
Discussion
Modifying post-acute payments to share savings and risk could reduce excess Medicare payments without the risks to patients posed by rebasing with across-the-board rate cuts. A system of shared savings and risk can achieve the same reduction in average payments while recapturing any excessive payments appropriately from each provider, depending on its actual patient mix and service costs. Retrospective adjustment payments to share profits and risks would reduce current incentives to under-provide without penalizing efficient providers or their patients.
A downside to risk-sharing is that it reduces the incentives to maximize the efficiencies that are associated with retention of all profits and absorption of all losses. Arguably, however, the absence of standards and inability to ensure adequate care mean providers’ financial gains may not reflect efficiencies, but, instead, reflect under-provision of care. Thus, risk-sharing improves the balance between the incentives for efficiency and patient protection. Some home health agencies may cease to participate in Medicare or close without the opportunity for a high return. Such exits could affect access to services, although most areas are served by multiple agencies and remaining agencies may be able to expand to serve more beneficiaries.
OPTION 2.42C
Refine SNF and home health prospective payments to fully incorporate therapies on a prospective basis
Both SNFs and home health agencies are paid prospectively based on how much therapy is provided, not on a prospective assessment of need. This option would replace payment for therapy services based on services received with payment based on predicted need for services. MedPAC recommended such a modification for SNFs in 2008 and for home health in 2011.
Budget effects
No cost estimate is available for this option. These modifications may be introduced in a budget neutral manner. The budgetary impact would then be related to changes in growth in the number of beneficiaries inappropriately receiving therapy or excessive amounts of therapy.
Discussion
Current payment methods encourage the provision of unnecessary or inappropriate therapy services and can produce greater profit margins. A prospective rate would link Medicare’s payment to a patient’s therapy needs, based on clinical factors, rather than allowing nursing homes or home health agencies to determine use and costs. This option could reduce excessive SNF and home health spending and reduce incentives to over-provide therapies relative to patient needs.
At the same time, however, paying prospectively, without regard to service actually delivered, has the potential to reward under-provision of therapy services, and requires additional steps to assure adequate quality care such as monitoring the receipt of services and/or the outcomes of care.
OPTION 2.43
Modify payments to Inpatient Rehabilitation Facilities (IRFs) to apply a blended rate for specific diagnoses and raise minimum case-mix requirements
IRFs provide care to Medicare beneficiaries for whom recovery from an illness, injury, or surgery requires intensive and complex rehabilitation services. Coverage of IRF services is subject to multiple requirements—including documentation of patients’ needs for multiple types of therapy, service delivery by a qualified (and medically supervised) interdisciplinary team, and a patient-mix (referred to as a compliance threshold) emphasizing a specific set of diagnoses.
Questions exist as to whether IRF care appropriately targeted achieves better results than less costly care in other post-acute settings where similar patients are commonly treated. Payment increases have exceeded increases in costs per case, and average margins are relatively high (8.8 percent in 2010) while freestanding and for-profit IRFs, dominated by a single chain, averaged margins of 21.4 percent and 19.8 percent respectively (MedPAC 2012e).
To address concerns that IRFs are overpaid, relative to SNFs, for roughly equivalent treatment of specific conditions, this option would set IRF payments equal to a blended SNF-IRF rate. The SNF rate would be adjusted upward for a portion of the difference between SNFs and IRFs in the average costs of care. This could be modified to also increase the compliance threshold, from 60 percent to 75 percent of IRF case-mix. Raising the threshold would better assure that a facility’s patients are likely to warrant the higher payment rate.
Budget effects
CBO estimated the President’s FY 2013 budget proposal to blend SNF and IRF rates for three diagnoses would reduce spending by $1.4 billion over 10 years (2013–2022). The estimated savings from increasing the compliance threshold to 75 percent was an additional $0.8 billion over 10 years (2013–2022).
Discussion
This option would reduce the rates paid to IRFs admitting patients requiring lower-intensity care and further dampen remaining financial incentives to inappropriately admit lower-cost patients. Savings from this option would be limited by the number of conditions affected. To the extent that current measures of rehabilitation needs and the outcomes of therapy do not fully capture differences among patients being served in SNFs and IRFs, this option may have an impact on care of some beneficiaries served in IRFs.
OPTION 2.44
Modify the hospital inpatient prospective payment system to include payment for long-term care hospitals
Long-term care hospitals (LTCHs) are a category of hospitals (more than a third are units within hospitals) that Medicare pays, with prospectively set rates, to treat patients with medically complex problems requiring exceptionally long stays (averaging a minimum of 25 days). No criteria exist for defining who does, or does not, belong in an LTCH. Respiratory conditions predominate among LCTH patients, with conditions requiring ventilator support for 96 or more hours the most frequent.
This option would pay the same rate for the same patient, whether served in a hospital or in an LTCH. Adjustments to Diagnosis Related Group (DRG) classifications might be necessary to appropriately accommodate patients requiring exceptionally long stays rather than relying on outlier payments for such stays.
Budget effects
No cost estimate is available for this option.
Discussion
Many parts of the country are without LTCHs. While there has been substantial growth in the number of LTCHs over the past decade, that growth often is in areas with existing providers rather than those with none. A higher concentration of LTCHs in an area appears to reduce the average severity of need among the patients being served. In the absence of LTCHs, patients with long-term acute care needs receive care in acute-care hospitals or SNFs—with no apparent differences in mortality or readmissions from similar patients treated in LTCHs. Although research indicates that for the most severely ill patients, care in LTCHs may be appropriate and no more costly than alternatives, criteria that can actually target service to these patients are lacking. In the absence of such criteria, prospective payment rates reward the admission of less severely ill patients who can be served as effectively elsewhere at lower costs. That LTCHs in areas with multiple facilities serve less severely ill patients validates this concern. In addition to payment of excessive rates for care in LTCHs, prospective payment per hospital stay encourages discharges to LTCHs, further increasing Medicare costs.
With little evidence to counter the conclusion that hospitals provide equivalent patients similar care at lower cost than LTCHs, there is little justification for supporting these institutions as a distinct class of Medicare provider.
OPTION 2.45
Modify prospective per diem payments to hospices to reflect variation in service intensity over the course of an episode
Medicare spending on hospice care totaled $13 billion in 2010 and has been growing at a 7.2 percent annual rate since 2006, making it one of the fastest growing components of Medicare. Between 2000 and 2010, hospice admissions more than doubled, enrollment in hospice care among beneficiaries who died during the year increased from 23 percent to 44 percent, and the number of hospices increased by 30 percent. This growth was disproportionately (90 percent) among for-profit providers. This option would align payments with beneficiary needs by varying the per diem payment rate over the course of an episode. Hospices would be paid a higher per diem rate for the first part of an episode (the first 30 days, for example) than for the remainder of the episode. At a patient’s death, the hospice would receive an additional payment, to compensate for higher costs associated with the end of life. The Affordable Care Act requires the HHS Secretary to revise hospice payment methods in a budget neutral manner after collecting more detailed data about hospice services. It suggests varying payment over the course of an episode, but does not require such a change.
Budget effects
No cost estimate is available for this option. The potential for savings exists if the entry of for-profit hospices is slowed by the prospect of less profit from extended stays.
Discussion
MedPAC has found a very skewed distribution of hospice stay lengths. The median stay is relatively short (17 days). Although longer stays (greater than 180 days) account for only a small proportion of hospice use, they generate higher hospice profit margins, due in large part to variation in the intensity of service over the course of a patient’s enrollment. Patients receive more frequent visits when they first enroll and in the period close to their death. In between, they receive fewer services, increasing the profitability of a long stay.
Varying the prospective per diem rates paid for hospice care to better reflect the “U-shaped” pattern of hospice services would reduce profit incentives in current payment policy that reward inappropriately long stays. At the same time, it would be more protective of hospices with shorter, more intensive stays. This change could better align payment to service costs and thereby reduce average profit margins and profit margin variation and, if accompanied by oversight, could improve quality of care. However, as in all prospective payment systems, the new arrangement would continue to reward efficient providers as well as those serving lower-need/lower-cost patients or delivering inadequate care. Excessive profit margins and profit margin variation may therefore continue.
Modify or Eliminate Special Provider Payments
The various payment systems under traditional Medicare include special payments and adjustments that either add to the total amount of payments made by Medicare or are made on a budget-neutral basis, meaning payments for some providers are reduced in order to increase payments to others. Some of these adjustments, such as special payments for low-volume or rural providers, are aimed at preserving access to services for certain beneficiaries. Others, such as local area wage or practice cost adjustments, recognize variation in provider costs. Still others, such as the inpatient medical education and disproportionate share hospital adjustments, provide a means for the Medicare program to support broader social goals.
Medicare currently classifies about 1,300 small, rural inpatient facilities as Critical Access Hospitals and pays them 101 percent of their Medicare reasonable costs. Another 385 hospitals, classified as sole community hospitals, are paid the higher of the normal inpatient payments or several different payment rates. A similar policy applies to about 200 other small rural hospitals termed Medicare-dependent because Medicare beneficiaries represent a high proportion of stays.
Eliminating or reducing some of these special payment rules and adjustments could lower Medicare expenditures.
OPTION 2.46
Reduce or eliminate special payments to rural hospitals
Special payments to rural providers could be modified in a number of ways. Payments to Critical Access Hospitals could be reduced to 100 percent of costs and qualifying criteria could be changed to reduce the number of hospitals paid higher rates (for example, by limiting designation to hospitals that do not have another hospital close by.) Alternatively, special rural hospital payment classifications could be eliminated entirely in favor of retargeting special payments to assist those hospitals with higher costs for reasons that are not otherwise recognized in the payment system.
Budget effects
The President’s FY 2013 budget proposals related to CAHs would save about $2 billion over 10 years (2013–2022)—$1.3 billion from reducing reimbursement to 100 percent of costs and $0.7 billion from prohibiting CAH designation for facilities less than 10 miles from another hospital. In 2011, CBO estimated that eliminating the Critical Access Hospital, Sole Community Hospital and Medicare-Dependent Hospital programs would reduce Medicare expenditures by $62 billion over 10 years (2012–2021).
Discussion
MedPAC has concluded that use of services and Medicare beneficiary satisfaction with access are similar in rural and urban areas. Modifying, eliminating, and retargeting special payments for rural and low-volume hospitals would arguably eliminate Medicare payments that are not needed to preserve access to care in rural areas.
Despite the potential benefits, if the extra payments are reduced or eliminated quickly or without a thorough analysis of the potential impacts, it could result in some hospitals closing or cutting back services in ways that are harmful to Medicare beneficiaries and others living in affected rural communities. Continuing cost-based reimbursement may prove the simplest payment system for some rural hospitals that offer limited inpatient services and have a widely fluctuating patient volume.
OPTION 2.47
Reduce or eliminate payments for Medicare bad debt
Medicare reimburses hospitals and skilled nursing facilities a portion (currently 65 percent) of the bad debt they incur when Medicare beneficiaries do not pay the cost sharing they owe for services received. Reducing bad debt payments was recommended by the Simpson-Bowles commission and proposed in President Obama’s budget for Fiscal Year 2013. A reduction from 70 percent to 65 percent beginning in 2013 was enacted in February 2012.
Budget effects
CBO estimated that the President’s FY 2013 budget proposal to phase down reimbursement of bad debt over three years to 25 percent would save $24 billion over 10 years (2013–2022). The Simpson-Bowles commission assumed a similar level of 10-year savings.
Discussion
Arguably, the Medicare program should not be expected to reimburse providers for unpaid beneficiary cost sharing, which is not a practice of private payers and may reduce provider incentives for collecting amounts owed by beneficiaries.11 Many Medicare beneficiaries purchase private Medigap coverage that covers most or all cost sharing obligations, and some have retiree health coverage that cover cost sharing. However, for lower income beneficiaries who do not qualify for Medicaid coverage and who cannot afford Medigap, Medicare cost sharing can be very expensive, especially for a hospital stay. Hospitals and skilled nursing facilities that tend to treat lower income patients can incur significant bad debt as a result. Moreover, for dual eligibles, state Medicaid programs have the option of limiting coverage for Medicare cost sharing to the amount that would be covered if the state’s Medicaid payment rate were in effect. As a result, providers are not always paid the cost sharing owed to them when Medicaid coverage is in effect, and these losses are counted as bad debt.
OPTION 2.48
Limit Medicare disproportionate share hospital payments to large urban hospitals
Medicare provides an add-on payment for inpatient services provided by hospitals serving a relatively high proportion of low-income patients. The payments are made using a series of formulas that vary based on urban and rural location and hospital size. The ACA reduces the DSH payments that would otherwise be made under these formulas by 75 percent beginning in 2015 and provides for a system of distributing some of the savings to hospitals with high levels of uncompensated care. This option would limit future DSH add-on payments to those hospitals for which there is a demonstrated relationship between higher costs and care for low-income patients, generally large urban hospitals.
Budget effects
No cost estimate is available for this option. In 2011, about 11 percent of DSH payments went to rural hospitals or hospitals in urban areas with fewer than 100 beds. Applying this proportion to CBO projections of DSH payments, 10-year savings would be approximately $13 billion.
Discussion
The aggregate reductions in DSH payments enacted under the ACA are consistent with empirical analyses conducted by MedPAC and others of the relationship between serving low-income patients and hospital costs. That analysis associates serving the poor with higher hospital costs even after other Medicare payment factors are taken into account, such as those recognizing the severity of patient illness, local area wages, and training of medical residents. However, the empirical finding is limited to hospitals located in urban areas with 100 beds or more. No similar cost effect is found for other hospitals. Therefore, continuing to provide DSH payments, even at the lower ACA levels, to small urban and rural hospitals arguably overcompensates them. The rationale for retaining these payments is that over time the DSH adjustment has evolved to reflect a broader notion of preserving access for low-income populations by assisting hospitals that serve them, regardless of whether there is an empirical finding of higher costs that result.
Reduce Geographic Variation in Medicare Spending
Medicare spending varies widely across geographic areas and at least a good share of these differences does not appear to be explained by Medicare reimbursement or other factors. The ACA put in place several reforms intended to reduce this variation. The Accountable Care Organization (ACO) program, for example, updates the target spending level during their initial three years of operation by the average increase in nationwide Medicare spending expressed in dollars, which has the effect of providing a larger percentage increase in lower spending geographic areas and a lower percentage increase in higher spending geographic areas. Additional options discussed here focus on areas with unusually high spending.
OPTION 2.49
Reduce Medicare’s fees for physicians and other providers in areas in high-spending regions
Medicare could attempt to achieve savings in high-spending regions by reducing provider payment rates for services in these areas. In 2008, CBO outlined how this might be implemented with respect to physician fees, payment rates for hospitals, and all Parts A and B services. These options are discussed below.
OPTION 2.49A
Reduce physician payments in areas with unusually high spending
Under this option, local spending on physician payments could be compared across regions that are defined on the basis of hospital service areas (HSAs). A spending target for physician payments could be developed for each region based on the number of Medicare beneficiaries, adjusted by health. CMS could calculate an annual local adjustment factor for each region based on comparing the local target with the local spending and apply the local adjustment factor to all physicians with a primary practice location in the region. Under this approach, CMS could phase in the local adjustment factor over five years. CMS could provide regular reports to state medical associations showing how it calculated the local adjustment factor and information on patterns of health care utilization.
OPTION 2.49B
Reduce hospital payments in areas with a high volume of elective admissions
Under this option, CMS could identify certain hospital admissions that are elective and could group these elective admissions into clinically related diagnosis and resource utilization groups. These elective admissions would account for at least 8 percent of current Medicare spending on short-stay hospital admissions. CMS could evaluate admission rates based on demographics for the local population and identify areas as having an unusually high volume of admissions for a specific group of elective admissions. The payment rate for high-volume elective admissions could be reduced based on comparison with the national average.
OPTION 2.49C
Reduce all Medicare payment rates in high-spending areas
Under this option, spending per beneficiary could be computed for each defined region of a state, adjusted to reflect the price of inputs and the health status of the local population, divided by the nationwide average spending per beneficiary. In areas where relative spending was 10 percent more than the national average, payment rates for all providers could be reduced. For example, a region spending 20 percent above the national average would experience reductions in Medicare payment rates amounting to 5 percent. As with the other proposals, the reduction in payment rates could be phased in over five years and capped at 20 percent. A variation in this option would be to only apply the reduction to specific services with high-spending instead of to all services in a high spending area.
Budget effects
No recent cost estimates are available for these options. In 2008 (prior to enactment of the ACA), CBO estimated spending reductions of approximately $5 billion for Option 2.49a (the physician payment option), $3 billion for Option 2.49b (the hospital elective admission option), and $51 billion for Option 2.49c (reducing Medicare payments across-the-board in high spending regions) over 10 years (2010–2019).
Discussion
It generally is agreed that there is some level of unnecessary variation in Medicare spending that, if reduced, could save a substantial amount of money. A recent analysis of 12 hospital referral regions showed significant geographic variation in Medicare spending, averaging $10,145 per beneficiary in Miami, Florida, compared with $4,959 in Honolulu, Hawaii. However, reductions in payments based on geography is certain to create large numbers of “losers” and engender considerable opposition and debate. Such changes also could result in reduced health outcomes for beneficiaries in areas that received lower payments. The Department of Health and Human Services has commissioned a study by the IOM; the IOM Committee on Geographic Variation in Health Care Spending and Promotion of High-Value Care is reviewing a comprehensive range of factors associated with geographic variation, and is expected to report in the first half of 2013.
References
Click to expand/collapse
Jonathan Blum. 2012. Centers for Medicare & Medicaid Services, Letter to Glenn M. Hackbarth, Chairman, Medicare Payment Advisory Commission. March 6, 2012.
Centers for Medicare & Medicaid Services (CMS). 2005. “Medicare Program; Application of Inherent Reasonableness Payment Policy to Medicare Part B Services (Other Than Physician Services), Final Rule,” Federal Register Vol. 70, No. 238, December 13, 2005.
Centers for Medicare & Medicaid Services. (CMS). 2012a, ”Clinical Laboratory Fee Schedule, Payment System Fact Sheet Series,” January 2012.
Centers for Medicare & Medicaid Services (CMS). 2012b. Competitive Bidding Update—One Year Implementation Update, April 17, 2012.
Centers for Medicare & Medicaid Services. (CMS). 2012c. “Medicare Program: Payment Policies Under the Physician Fee Schedule, DME Face-to-Face Encounters, Elimination of the Requirement for Termination of Non-Random Prepayment Complex Medical Review and Other Revisions to Part B for CY 2013,” Federal Register, November 16, 2012.
Centers for Medicare & Medicaid Services (CMS). 2012d. “Medicare Program; Public Meeting Regarding Inherent Reasonableness of Medicare Fee Schedule Amounts for Non-Mail Order (Retail) Diabetic Testing Supplies, Notice of Meeting,” Federal Register Vol. 77, No. 123, June 26, 2012.
Congressional Budget Office (CBO). 2008. Health Care Options, “Geographic Variation in Spending for Medicare,” December 2008.
Congressional Budget Office (CBO). 2011. Reducing the Deficit: Spending and Revenue Options, March 2011.
Congressional Budget Office (CBO). 2012a. Estimate of the Effects of Medicare, Medicaid, and Other Mandatory Health Provisions Included in the President’s Budget Request for Fiscal Year 2013, March 2012.
Congressional Budget Office (CBO). 2012b. Medicare Baseline, March 2012.
Congressional Budget Office (CBO). 2012c. Medicare’s Payments to Physicians: The Budgetary Impact of Alternative Policies Relative to CBO’s March 2012 Baseline, July 2012.
Robert F. Coulam, Roger D. Feldman, and Bryan E. Dowd. 2011. “Competitive Pricing and the Challenge of Cost Control in Medicare,” Journal of Health Politics, Policy and Law, August 2011.
Ezekiel Emanuel et al., Center for American Progress. 2012. “A Systemic Approach to Containing Health Care Spending,” New England Journal of Medicine, August 1, 2012.
Government Accountability Office (GAO). 2009. Medicare Physician Payments: Fees Could Better Reflect Efficiencies Achieved When Services are Provided Together, July 31, 2009.
Government Accountability Office (GAO). 2011. Medicare: Issues for Manufacturer-Level Competitive Bidding for Durable Medical Equipment, May 31, 2011.
HHS Office of Inspector General. 2012. Department of Health and Human Services, 2012, Comparison of Fourth-Quarter 2011 Average Sales Prices and Average Manufacturer Prices: Impact on Medicare Reimbursement for Second Quarter 2012, August 2012.
Institute of Medicine, Committee on the Future Health Care Workforce for Older Americans. 2008. Retooling for an Aging America: Building the Health Care Workforce, 2008.
H. Joanna Jiang, Lauren M. Wier, D.E.B. Potter, and Jacqueline Burgess. 2010. “Hospitalizations for Potentially Preventable Conditions among Medicare-Medicaid Dual-Eligibles, 2008,” Statistical Brief #96, Agency for Healthcare Research and Quality, Healthcare Cost and Utilization Project, September 2010.
Letter from 166 Concerned Auction Experts on Medicare Competitive Bidding Program to the Honorable Pete Stark, Chairman, Subcommittee on Health, Committee on Ways and Means, (Letter to Pete Stark), September 26, 2010.
L&M Policy Research LLC. 2011. Evaluation of Practice Models for Dual Eligibles and Medicare Beneficiaries with Serious Chronic Conditions. 2011. Report Prepared for CMS, July 25, 2011.
Mark Loeb et al. 2006. “Effect of a Clinical Pathway to Reduce Hospitalizations in Nursing Home Residents With Pneumonia,” Journal of the American Medical Association, June 7, 2006.
Medicare Payment Advisory Commission (MedPAC). 2008. Report to the Congress: Medicare and the Health Care Delivery System, March 2008
Medicare Payment Advisory Commission (MedPAC). 2009. Report to the Congress: Medicare Payment Policy, March 2009.
Medicare Payment Advisory Commission (MedPAC). 2010a. Letter to Congress, August 23, 2010.
Medicare Payment Advisory Commission (MedPAC). 2010b. Report to the Congress: Aligning Incentives in Medicare, June 2010.
Medicare Payment Advisory Commission (MedPAC). 2010c. Report to the Congress: Medicare Payment Policy, March 2010.
Medicare Payment Advisory Commission (MedPAC). 2011a. Report to the Congress: Medicare and the Health Care Delivery System. June 2011.
Medicare Payment Advisory Commission (MedPAC). 2011b. Report to the Congress: Regional Variation In Medicare Service Use, January 2011.
Medicare Payment Advisory Commission (MedPAC). 2012a.Clinical Laboratory Services Payment System, October 2012.
Medicare Payment Advisory Commission (MedPAC). 2012b. A Data Book: Health Care Spending and the Medicare Program, June 2012.
Medicare Payment Advisory Commission (MedPAC). 2012c. Letter to Congress, “Moving Forward from the Sustainable Growth Rate (SGR) System” (dated October 14, 2011); cited in Report to the Congress: Medicare Payment Policy, March 2012.
Medicare Payment Advisory Commission (MedPAC). 2012d. Report to the Congress: Medicare and the Health Care Delivery System, June 2012.
Medicare Payment Advisory Commission (MedPAC). 2012e. Report to the Congress: Medicare Payment Policy, March 2012.
National Commission on Fiscal Responsibility and Reform. 2010. The Moment of Truth: Report of the National Commission on Fiscal Responsibility and Reform, December 2010.
Nguyen Xuan Nguyen and Steven H. Sheingold. 2011. “Indirect Medical Education and Disproportionate Share Adjustments to Medicare Inpatient Payment Rates,” Medicare and Medicaid Research Review, 2011.
Frank Opelka. 2012. “Medicare Physician Payments: Perspectives from Physicians.” Statement before the Senate Finance Committee, July 2012.
Joseph G. Ouslander and Robert M. Berenson. 2011. “Reducing Unnecessary Hospitalizations of Nursing Home Residents,” New England Journal of Medicine, September 29, 2011.
Senate Finance Committee. 2012. “Summary of The
Middle Class Tax Relief and Job Creation Act of 2012,” February 16, 2012.
Laurence D. Wilson, Director, Chronic Care Policy Group, Centers for Medicare & Medicaid Services. 2012. Statement Before the House Committee on Ways and Means, Subcommittee on Health, May 9, 2012.
U.S. Department of Health and Human Services, Report to Congress: Plan to Implement a Medicare Skilled Nursing Facility Value-Based Purchasing Program (publication not dated).
Medical Malpractice
Options Reviewed
This section discusses options in two categories relating to medical malpractice, using labels assigned to them in a 2010 study commissioned by the Medicare Payment Advisory Commission (MedPAC) (Mello and Kachalia 2010):
» Adopt “traditional” tort reforms at the Federal level
» Adopt more “innovative” tort reforms
While medical malpractice is not exclusively or primarily a Medicare issue and policy debates in this area do not typically focus on Medicare as a driver of change, medical malpractice-related policy changes have the potential to reduce Medicare expenditures. There continues to be considerable interest in finding ways to reduce medical malpractice insurance premiums paid by doctors and other health care providers, along with the costs associated with unnecessary defensive medical practices, as a means of reducing health expenditures under Medicare and other public and private programs
Background
The current system for adjudicating medical malpractice claims, which involves civil suits typically in State courts, often has been criticized. Research indicates that relatively few patients who are injured by negligence file claims; only about half of claimants recover money; and the outcome of litigation is sometimes unrelated to the merit of the claim (Kachalia and Mello 2011). Evidence on other key issues related to medical malpractice, such as the extent and cost of defense medicine that might result from efforts to avoid malpractice claims, the impact of alternative reform proposals, and potential savings from malpractice reform is often lacking or contradictory. Therefore, it is not surprising that malpractice reforms often engender considerable controversy and sharp differences of opinion.
The National Commission on Fiscal Responsibility and Reform (Simpson-Bowles commission) included malpractice reforms in its comprehensive proposal to reduce the Federal budget deficit (National Commission on Fiscal Responsibility and Reform 2010). Several bills have been introduced in Congress but, so far, none has been enacted. The Agency for Healthcare Research and Quality (AHRQ) is funding a series of demonstration projects to test various reform models (AHRQ 2012) and President Obama’s Fiscal Year 2013 budget included funding to provide grants to States to test various models of reform.
A 2010 study done for MedPAC examined eight “traditional” tort reforms and six “more innovative” ones (Mello and Kachalia 2010). For each reform, the study identified key design features and decisions and evaluated the available evidence for its effects on a range of variables, including health care providers’ medical malpractice premiums and defensive medicine.
Policy Options
OPTION 2.50
Adopt traditional tort reforms at the Federal level
Tort reforms affect some aspect of the process for filing and adjudicating malpractice claims, including the payment of damages and other fees when such claims are successful. Although medical malpractice litigation typically has been handled as a State issue, Congress arguably has the power, under the Commerce Clause of the U.S. Constitution, to enact Federal tort reform laws. (Exhibit 2.8) briefly describes eight traditional tort reforms.
Each of these reforms could involve many design variations. For example, for caps on noneconomic damages, the amount of the cap could vary for different kinds of injuries, the cap might or might not be indexed over time for inflation, and the cap might or might not be subject to judicial waiver.
The Simpson-Bowles commission included in its deficit reduction plan a package of tort reforms, including modifying the collateral source rule, imposing a statute of limitations on medical malpractice lawsuits, replacing joint-and-several liability with a fair share rule, creating “health courts,” and adopting “safe haven” rules for providers who follow best practices of care.
Another recent example of the traditional tort reform approach is provided by the Help Efficient, Accessible, Low-Cost, Timely Healthcare (HEALTH) Act (H.R. 5), which was approved by the House of Representatives in March 2012. As introduced, H.R. 5 included the following provisions:
» A three-year statute of limitations for medical malpractice claims, with certain exceptions, from the date of discovery of an injury;
» A cap of $250,000 on awards for noneconomic damages;
» A cap on awards for punitive damages that would be the larger of $250,000 or twice the economic damages, and restrictions on when punitive damages may be awarded;
» Replacement of joint-and-several liability with a fair-share rule, under which a defendant in a lawsuit would be liable only for the percentage of the final award that was equal to his or her share of responsibility for the injury;
» Sliding-scale limits on the contingency fees that lawyers can charge;
» Authorization for periodic payments of future damage awards of $50,000 or more;
» A safe harbor from punitive damages for products that meet applicable FDA safety requirements; and
» Permission to introduce evidence of income from collateral sources (such as life insurance payouts and health insurance) at trial (this last element was deleted from the version of the bill reported by the House Committee on the Judiciary and subsequently passed by the House of Representatives).
The bill would not preempt state laws that are more protective of providers and organizations with respect to liability, loss, or damages, nor would it preempt any state law that specified a particular monetary limit on economic, noneconomic, or punitive damages, whether such limit was higher or lower than the comparable one specified in the bill.
Budget effects
CBO has estimated that the tort reforms in H.R. 5 would produce a roughly 0.5 percent decrease in overall health spending and a reduction in the Federal budget deficit of $40 billion to $57 billion over a 10-year period (2012–2021); the range of estimates arises from the fact that one Congressional committee reported a version of H.R. 5 lacking the collateral source provision, as noted above. This estimated impact on the deficit combines an estimated $34 billion to $48 billion in reduced spending under Medicare, Medicaid, the State Children’s Health Insurance Program, and the Federal Employees Health Benefits Program over a 10-year period, and a $6 billion to $10 billion increase in Federal revenues (because employers would pay less for health insurance for employees, meaning that more of their employees’ compensation would be in the form of taxable wages). CBO notes that its savings estimates for Medicare are greater, in percentage terms, than for other programs or national health spending in general because empirical evidence shows that the impact of tort reform on the utilization of health care services is greater for Medicare than for the rest of the health care system. By comparison, the Simpson-Bowles commission’s package of tort reforms was estimated to produce Federal savings of $2 billion in 2015 and $17 billion through 2020; the commission did not estimate Medicare savings separately.
Discussion
Tort reforms typically are intended to reduce the number of frivolous law suits and the total size of awards, thereby reducing malpractice insurance premiums and the amount of defensive medicine. A report done for MedPAC found that caps on noneconomic damages appear to moderately constrain the growth of malpractice premiums over time and lower the rate of defensive medicine, but the report also says that the available evidence underlying these conclusions is imperfect. For the remaining tort reforms, the report generally concludes that evidence regarding their impact on malpractice premiums and defensive medicine is limited, equivocal, or non-existent, or even suggests that they have no significant impact on these variables.
Critics of caps on noneconomic damages worry they could limit awards for seriously injured patients or disadvantage older people or others receiving relatively low economic damage awards. Similarly, limits on attorneys’ contingency fees could make it difficult for some patients to obtain legal representation. CBO also has noted that imposing caps on noneconomic damages might have a negative impact on health outcomes, but concluded that the evidence for such negative effects is less clear than the evidence regarding expected reductions in health care costs. And other research has found that physicians’ concern about being sued was modestly lower in states that had established caps on total damages (not just noneconomic damages) or abolished joint-and-several liability, but was not significantly affected by the other reforms, including caps on noneconomic damages.
OPTION 2.51
Adopt more innovative tort reforms
In addition to “traditional” tort reforms, a range of other “innovative” malpractice reforms have been proposed and are briefly described in (Exhibit 2.9). Each of the reforms could encompass a wide range of variants.
Budget effects
No cost estimates are available for these options.
Discussion
Most of the above reforms have no real-world examples, have undergone only limited trials, or have not been rigorously evaluated. Administrative systems are in place in countries such as Denmark, New Zealand and Sweden. The few administrative systems currently in place in the United States—Florida’s Birth-Related Neurological Injury Compensation Plan, Virginia’s Birth-Related Neurological Injury Compensation Program, and the U.S. National Vaccine Injury Compensation Program—serve limited purposes. While such administrative systems do reduce overhead costs by making it easier to pursue a malpractice claim, they could increase the total number of claims (claim rates per million persons are about four to five times higher in Denmark, New Zealand, and Sweden than they are in the United States), and they also could have uncertain impacts on total malpractice costs and defensive medicine. On the other hand, by increasing the number of claims, they could allow creation of a rich database of medical injuries and contributing factors, thereby facilitating patient safety efforts. Four states—Florida, Maine, Minnesota, and Vermont—experimented with practice guideline-related safe harbors, but none has adopted these policies on a permanent basis. The 2010 study done for MedPAC concludes that the evidence base underlying the above reforms is “extremely small” but that most of the reforms “show sufficient promise…to merit controlled experimentation.” As noted earlier, the Agency for Healthcare Research and Quality is currently funding demonstrations of several of these concepts.
References
Click to expand/collapse
Agency for Healthcare Research and Quality (AHRQ). 2012. Medical Liability Reform and Patient Safety Demonstration Grants Fact Sheet.
Randall Bovbjerg and Robert A. Berenson. 2012. The Value of Clinical Practice Guidelines as Malpractice ‘Safe Harbors’, Robert Wood Johnson Foundation Issue Brief, April 2012.
Emily Carrier et al. 2010. “Physicians’ Fears of Malpractice Lawsuits Are Not Assuaged By Tort Reforms,” Health Affairs, September 2010.
Congressional Budget Office (CBO). 2009. Letter to the Honorable Orrin G. Hatch regarding the effects of proposals to limit costs related to medical malpractice, October 9, 2009.
Congressional Budget Office (CBO). 2011. Cost Estimates, H.R. 5, Health Efficient, Accessible, Low-cost, Timely Healthcare (HEALTH) Act of 2011, March 10, 2011 and May 23, 2011.
Allen Kachalia and Michelle M. Mello. 2011. “New Directions in Medical Liability Reform,” New England Journal of Medicine, April 21, 2011.
Michelle Mello and Allen Kachalia. 2010. Evaluation of Options for Medical Malpractice System Reform; A Study Conducted for the Medicare Payment Advisory Commission, April 2010.
National Commission on Fiscal Responsibility and Reform. 2010. The Moment of Truth: Report of the National Commission on Fiscal Responsibility and Reform, December 2010.

Exhibit 2.1: Total Medicare Private Health Plan Enrollment, 2000–2012
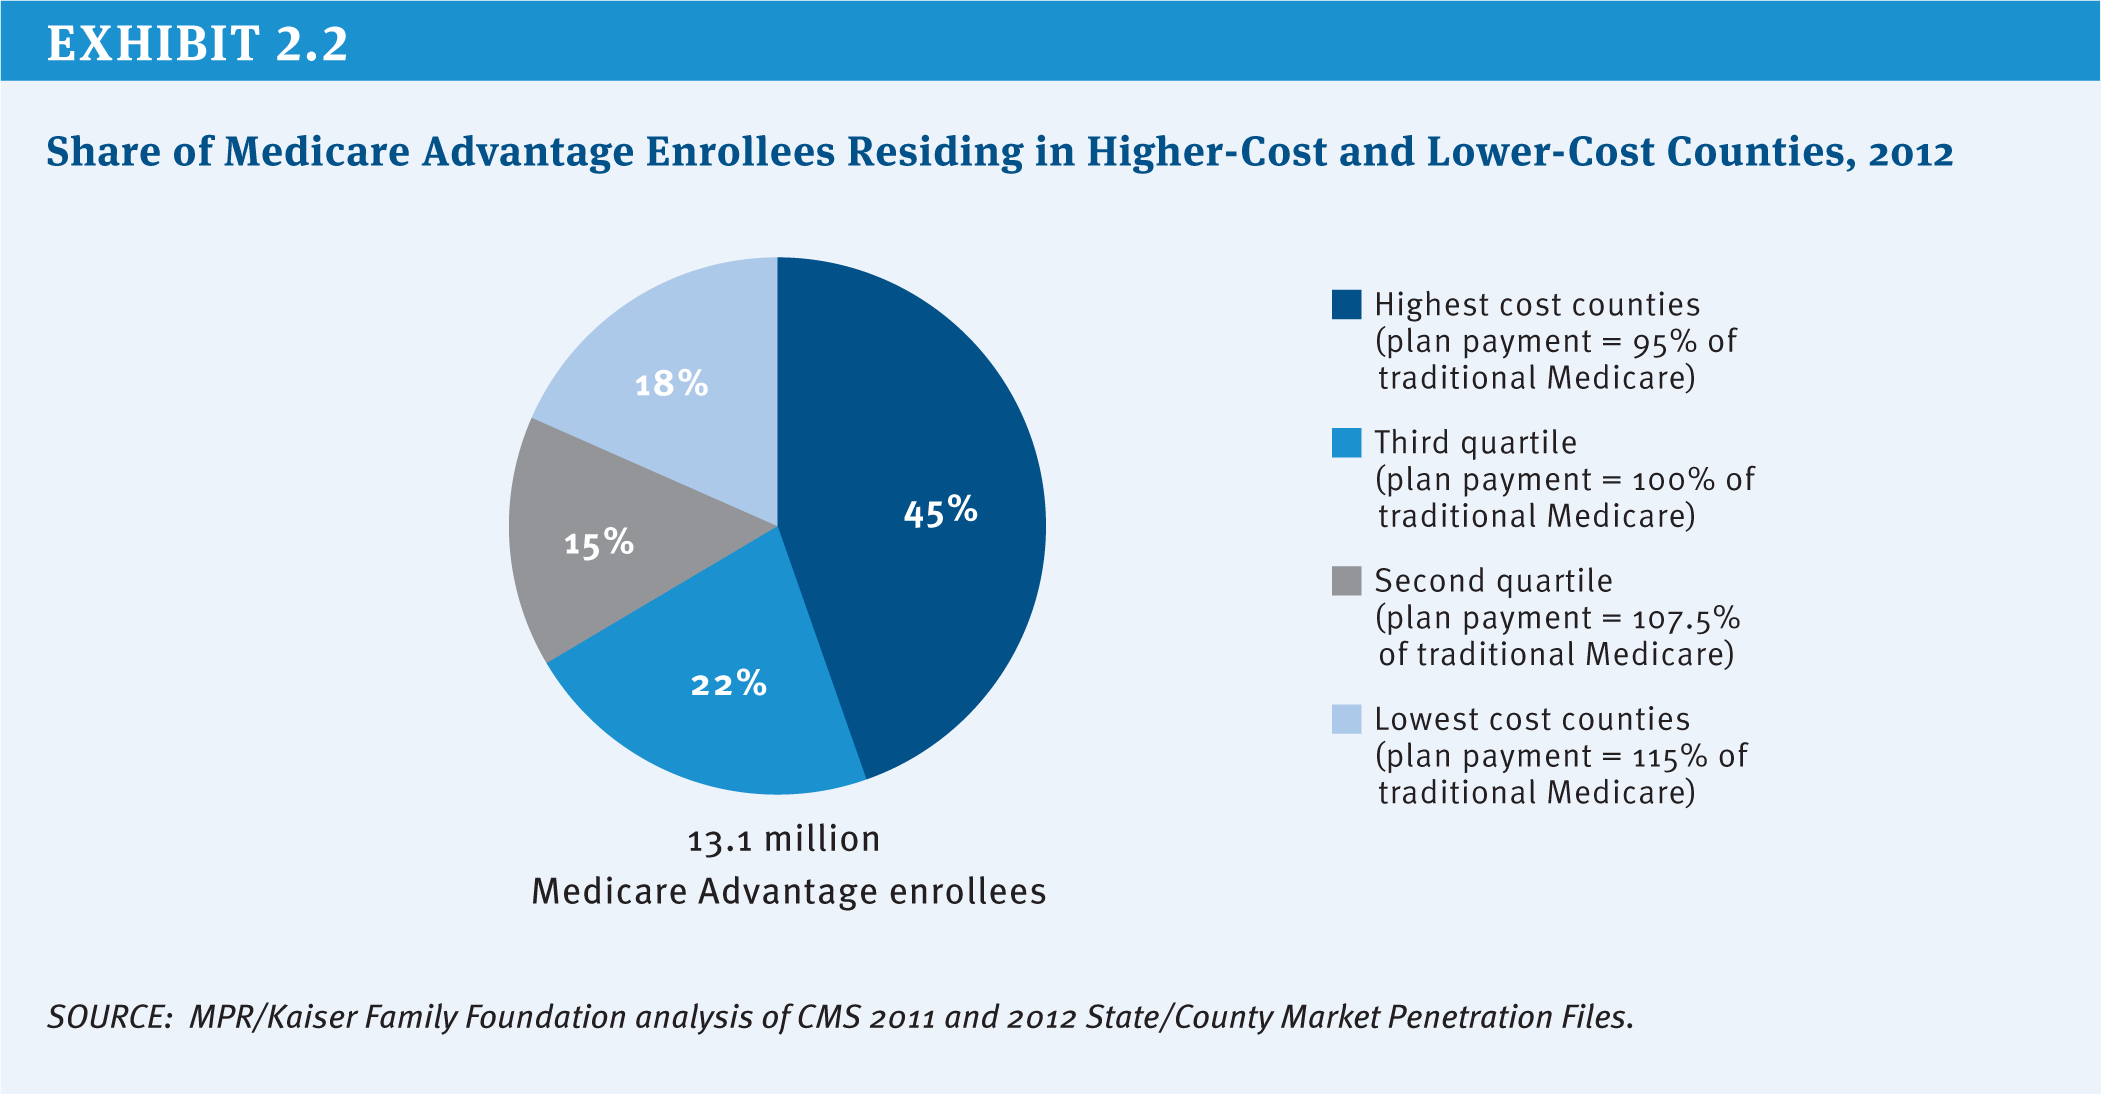
Exhibit 2.2: Share of Medicare Advantage Enrollees Residing in Higher-Cost and Lower-Cost Counties, 2012
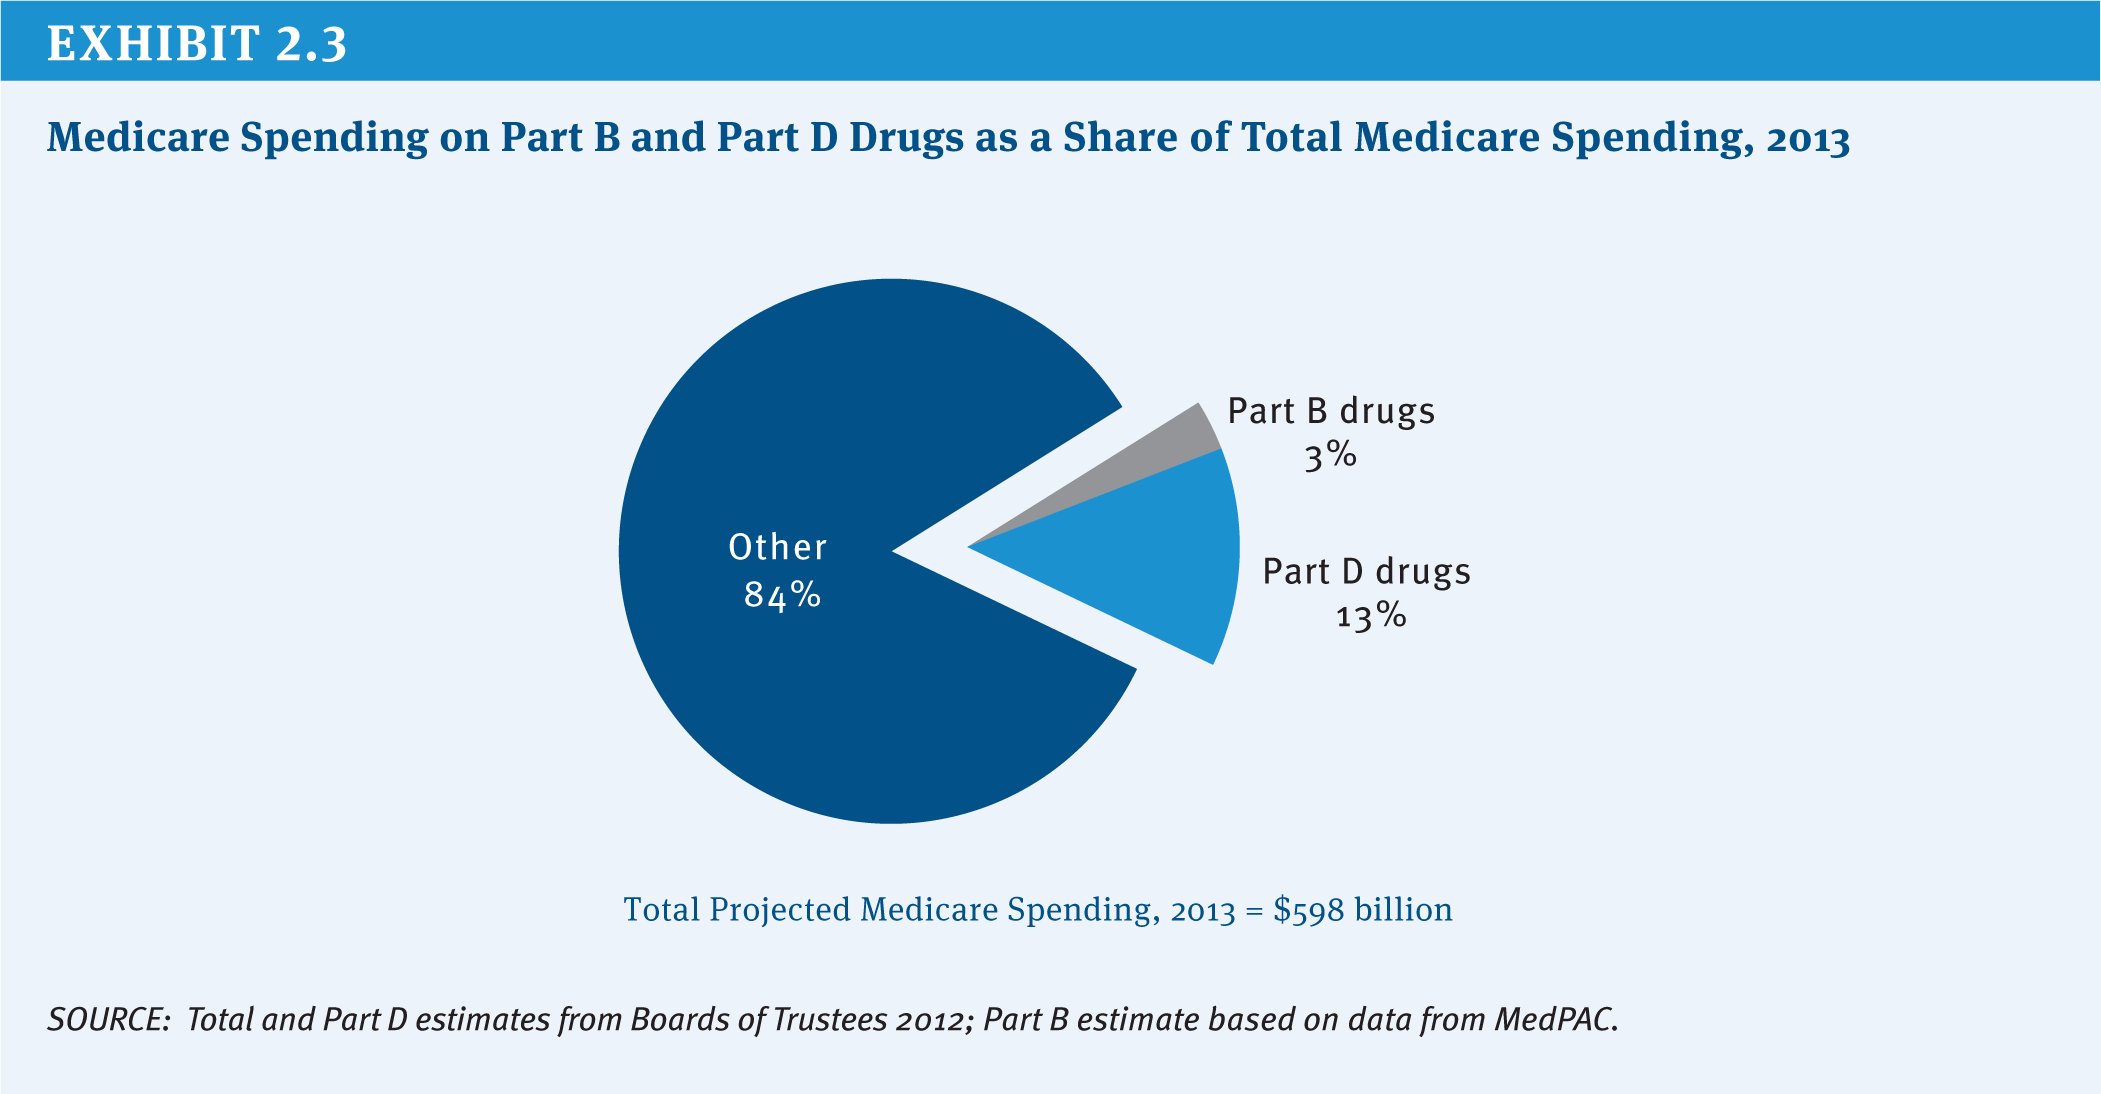
Exhibit 2.3: Medicare Spending on Part B and Part D Drugs as a Share of Total Medicare Spending, 2013
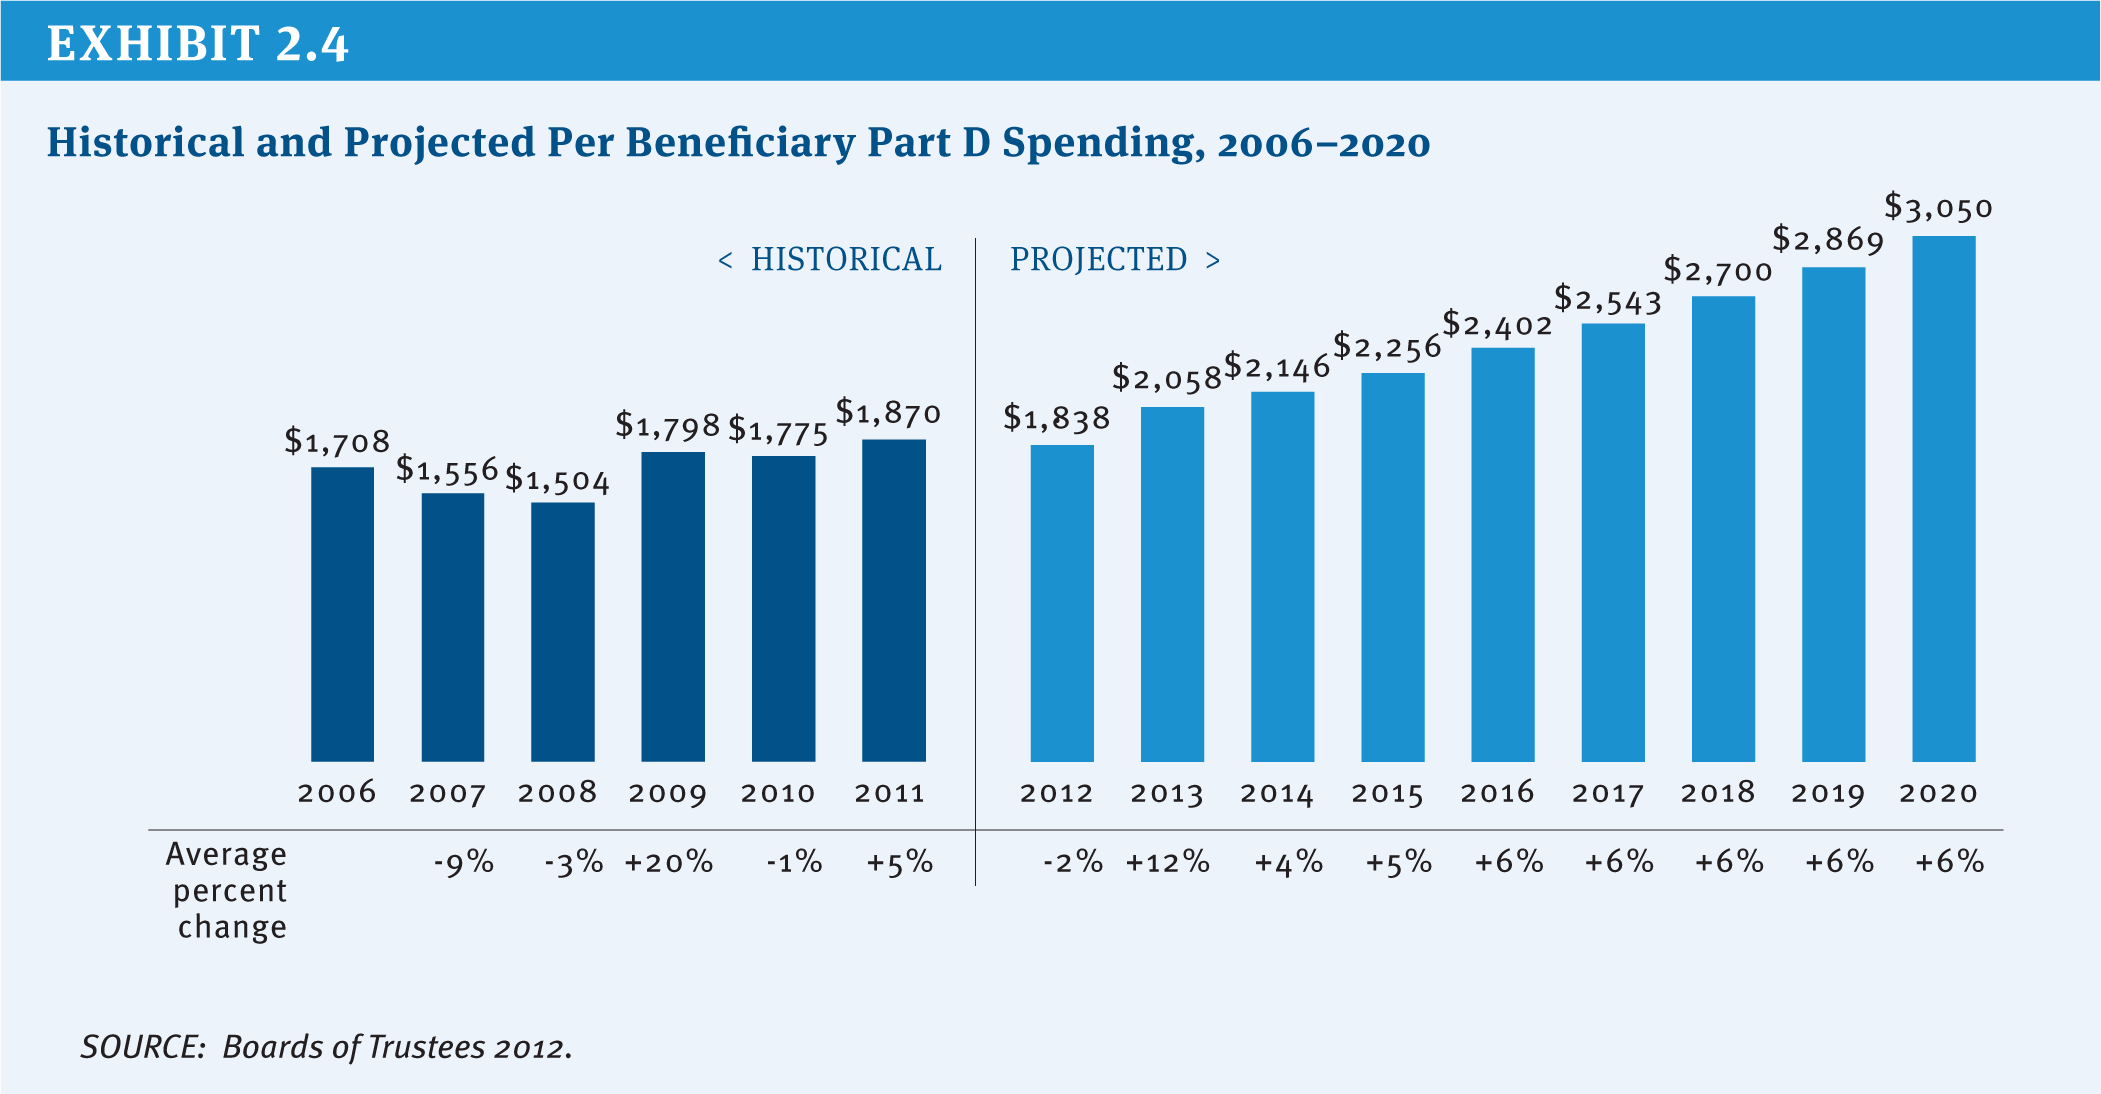
Exhibit 2.4: Historical and Projected Per Beneficiary Part D Spending, 2006–2020
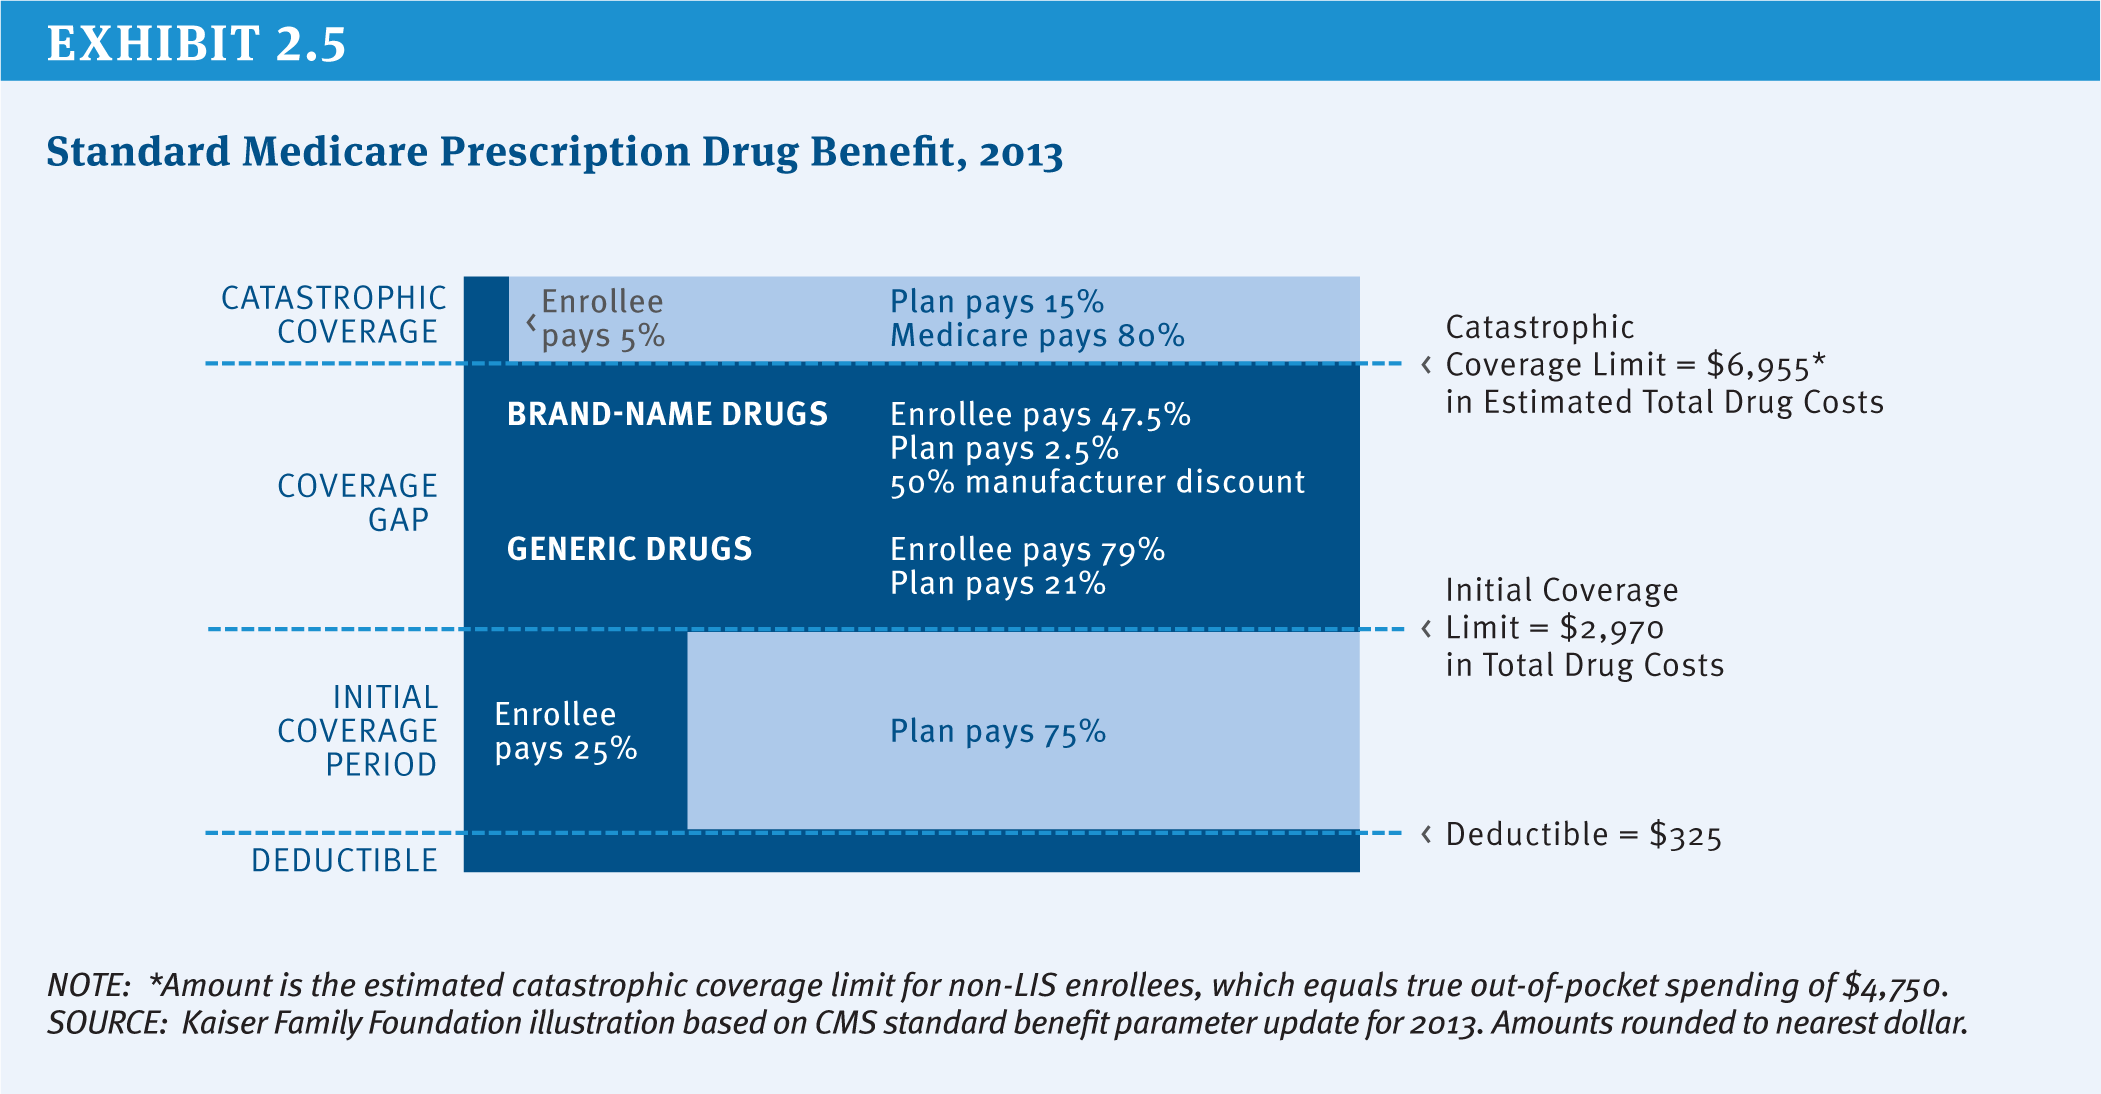
Exhibit 2.5: Standard Medicare Prescription Drug Benefit, 2013
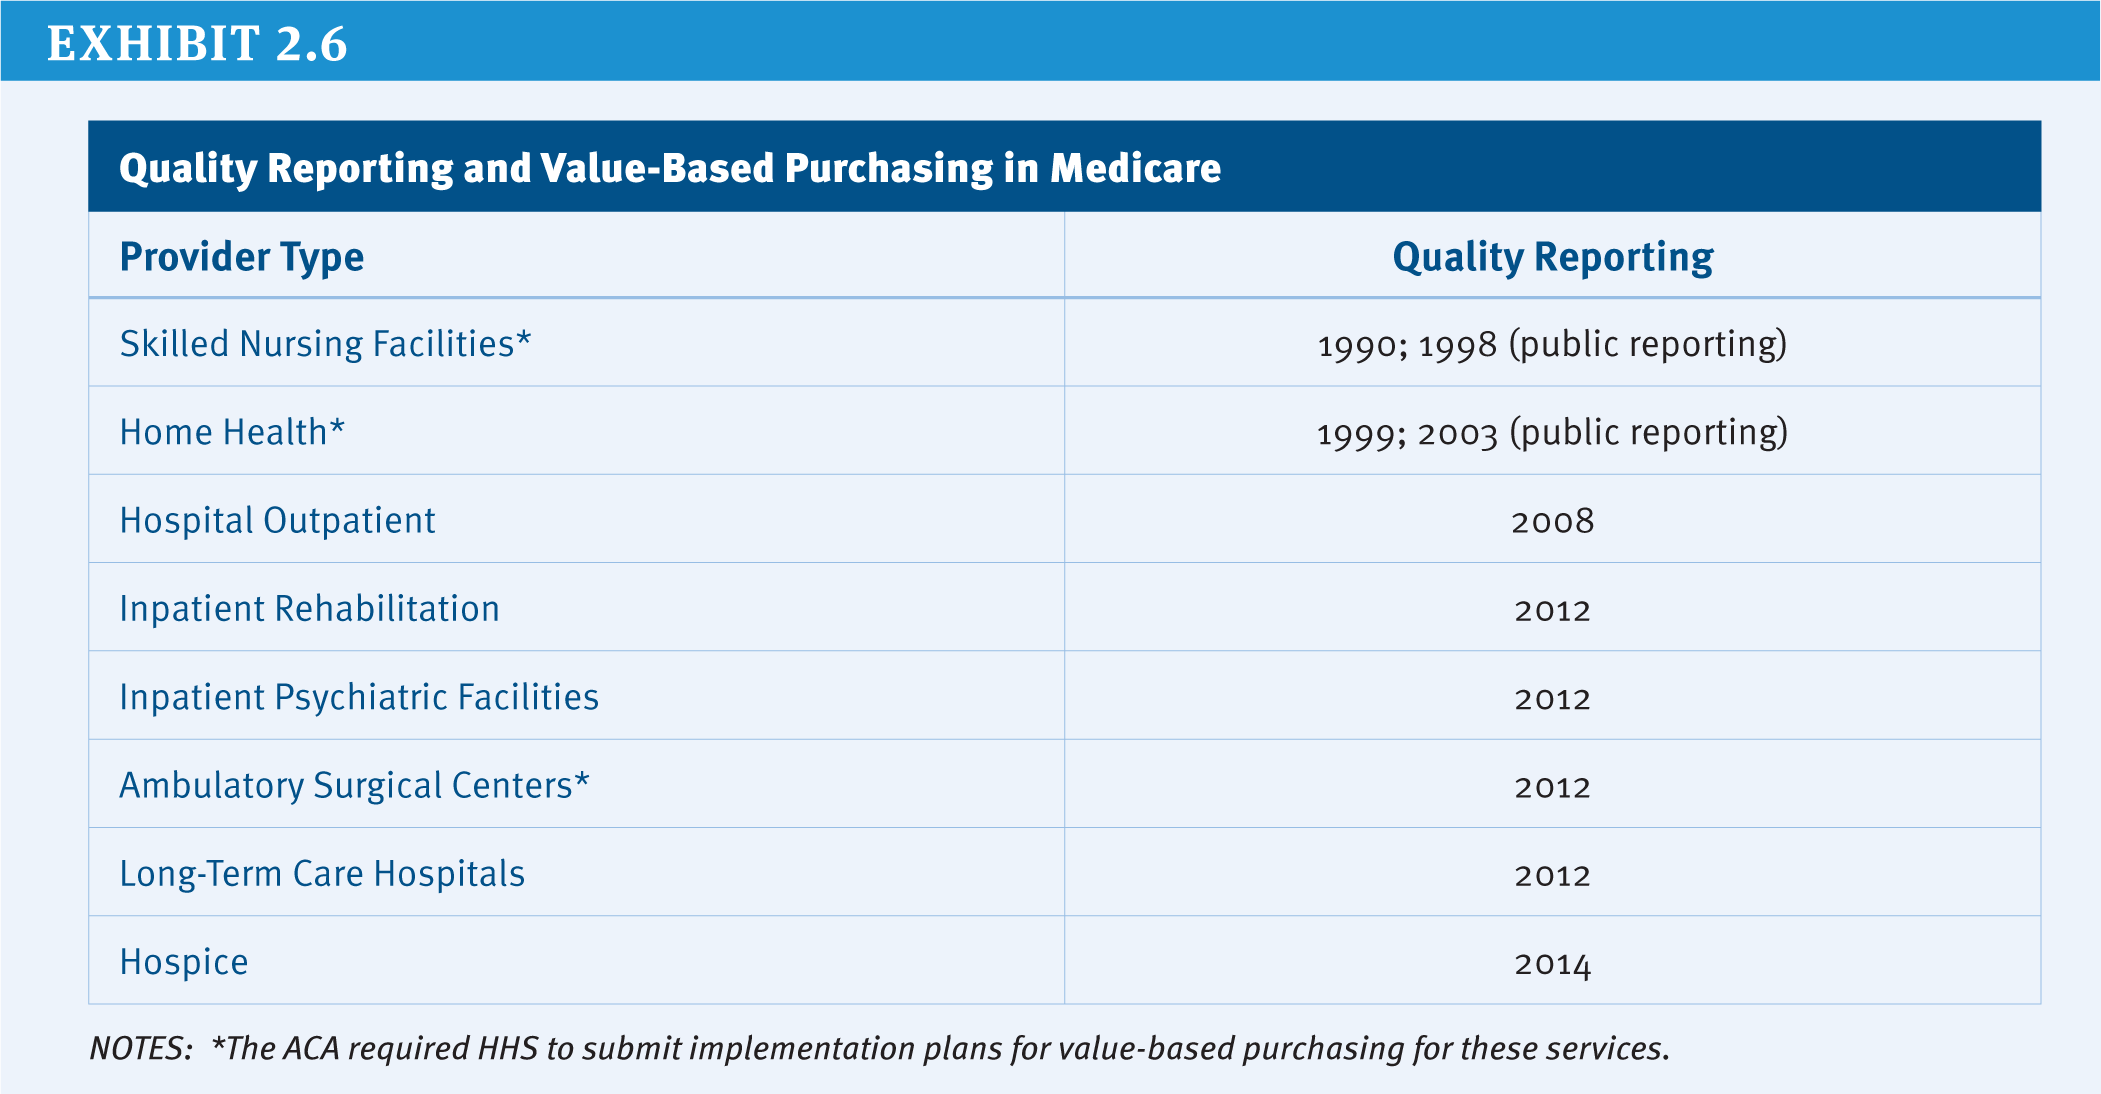
Exhibit 2.6: Quality Reporting and Value-Based Purchasing in Medicare
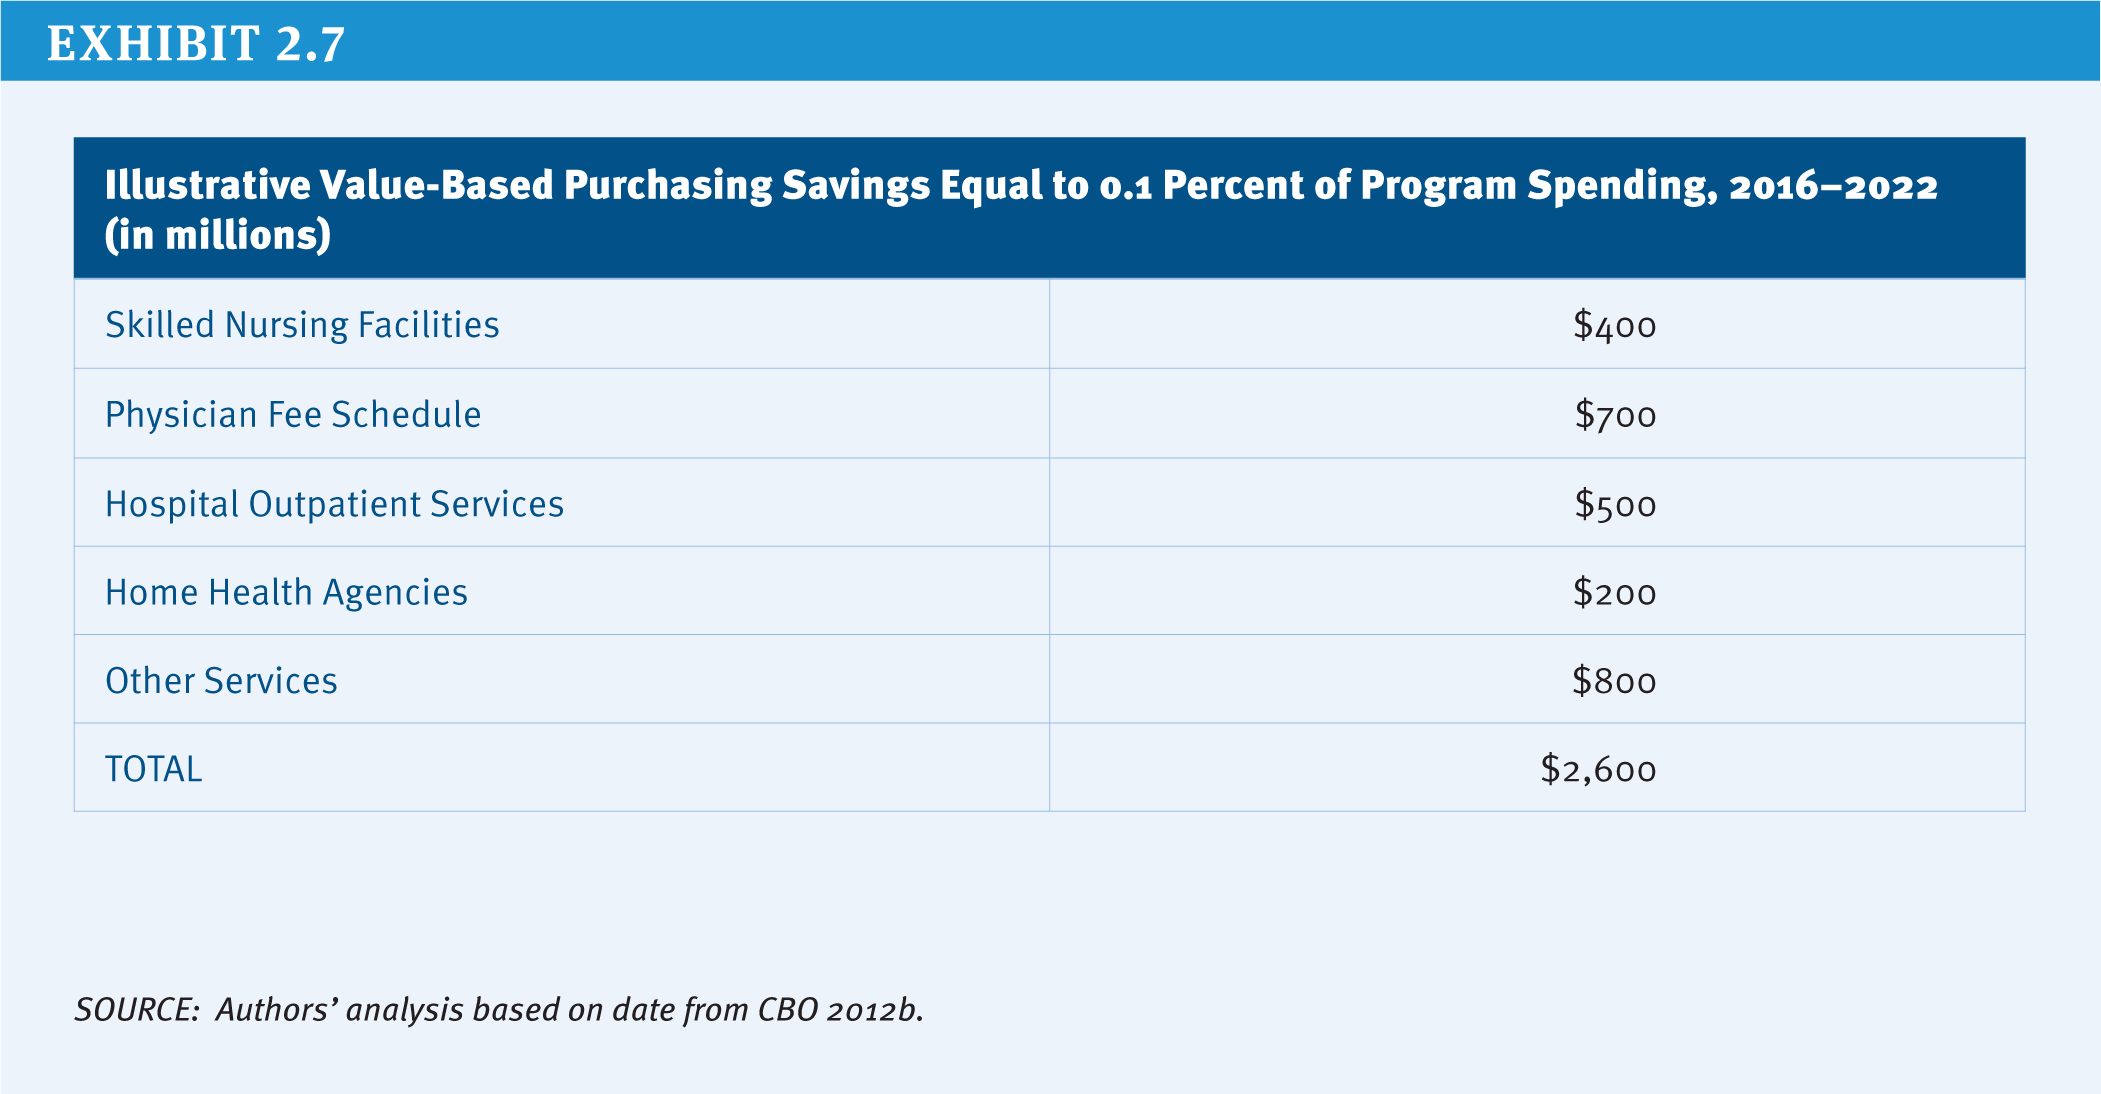
Exhibit 2.7: Illustrative Value-Based Purchasing Savings Equal to 0.1 Percent of Program Spending, 2016–2022
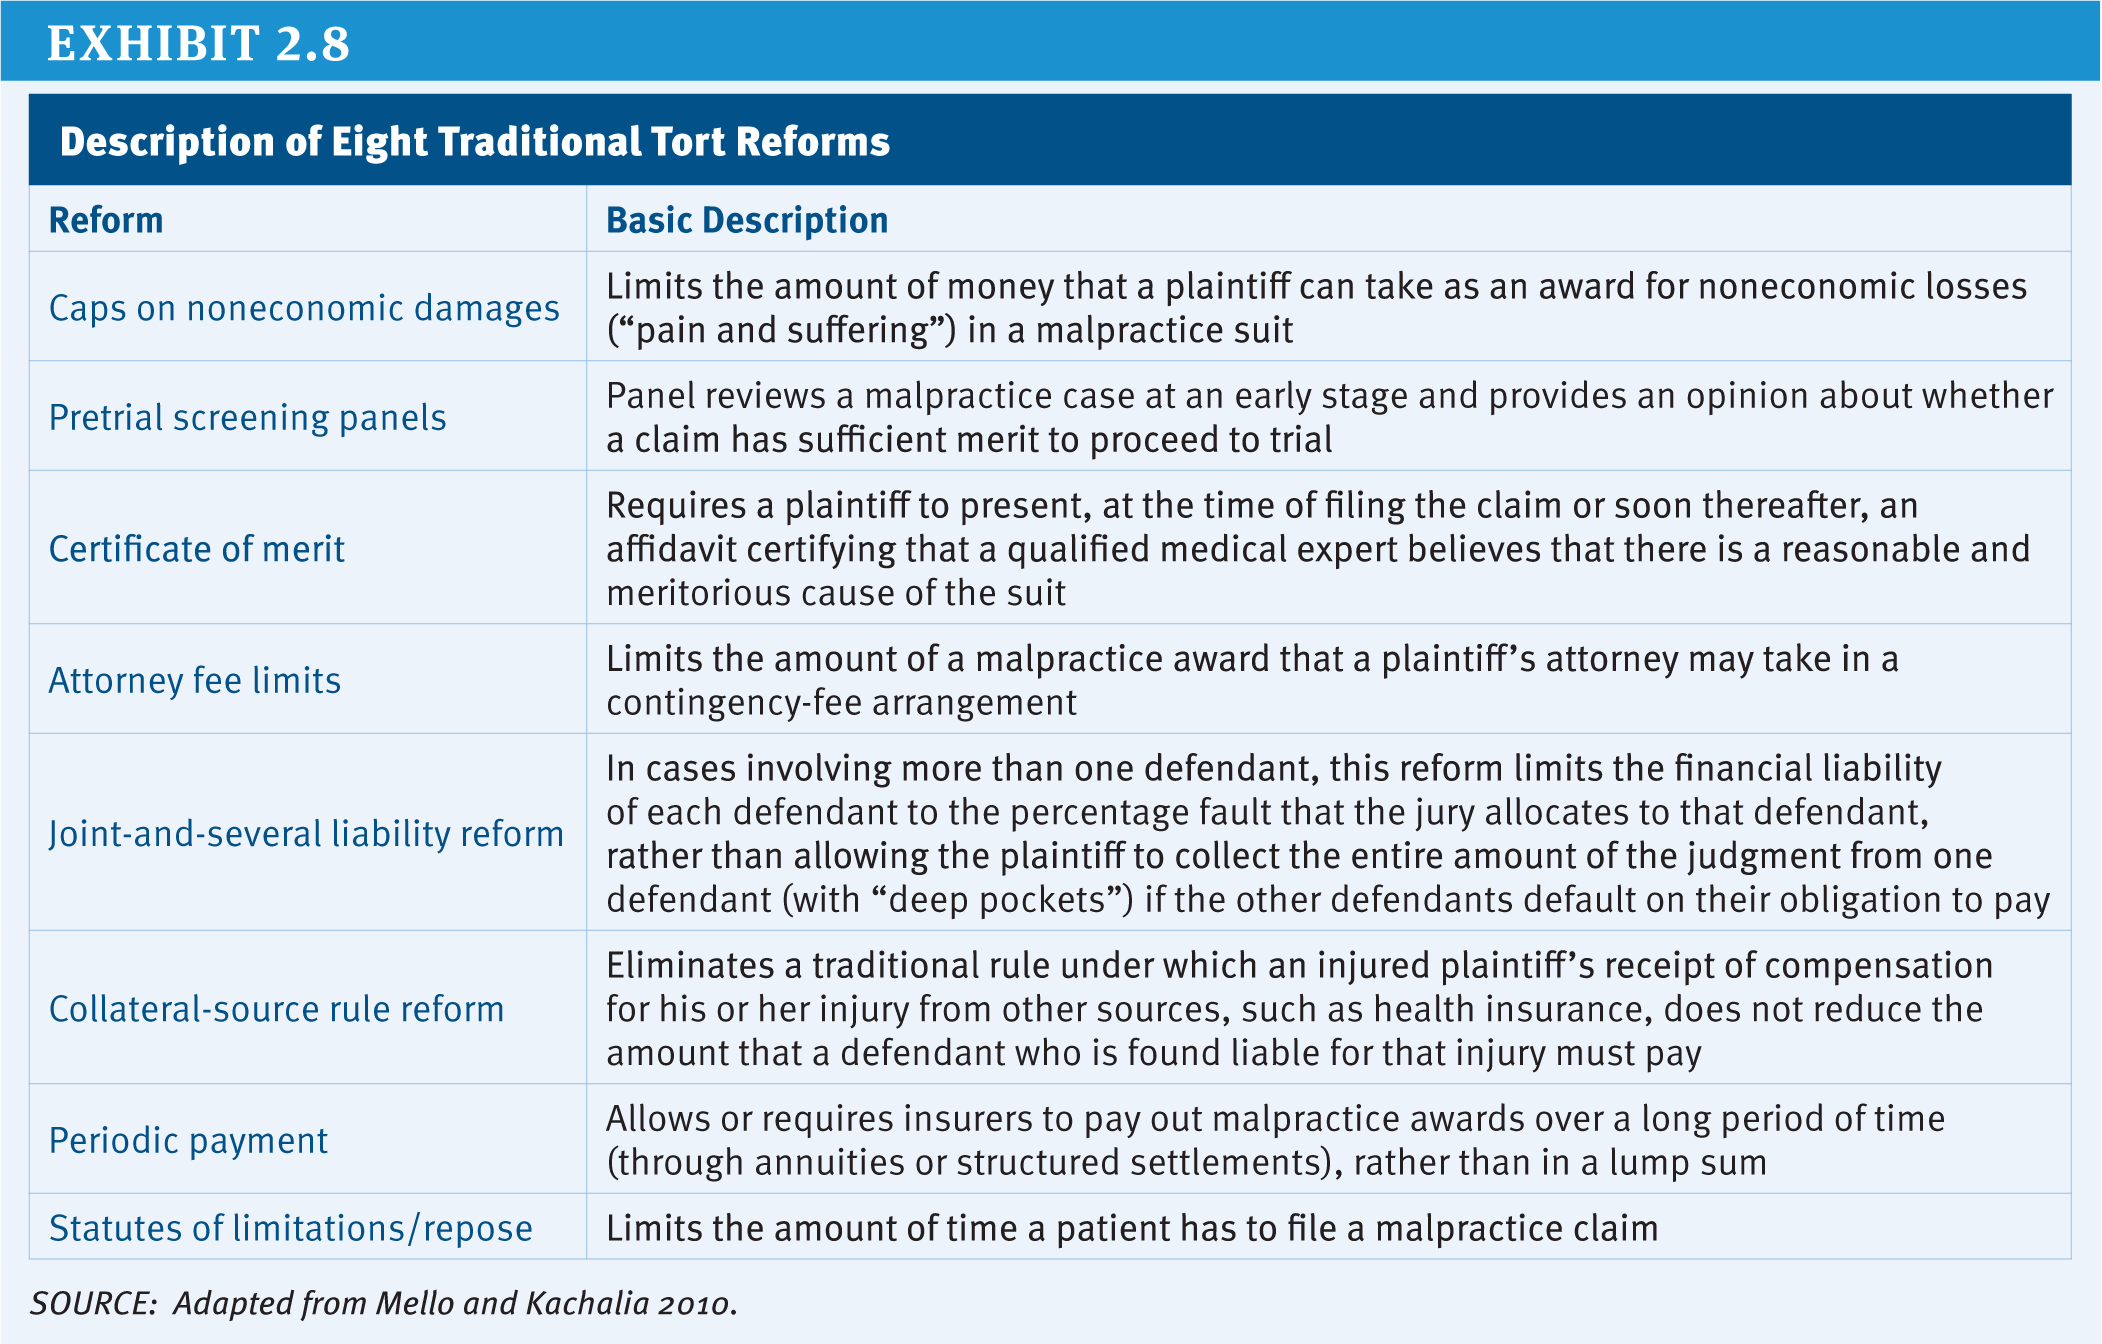
Exhibit 2.8: Description of Eight Traditional Tort Reforms
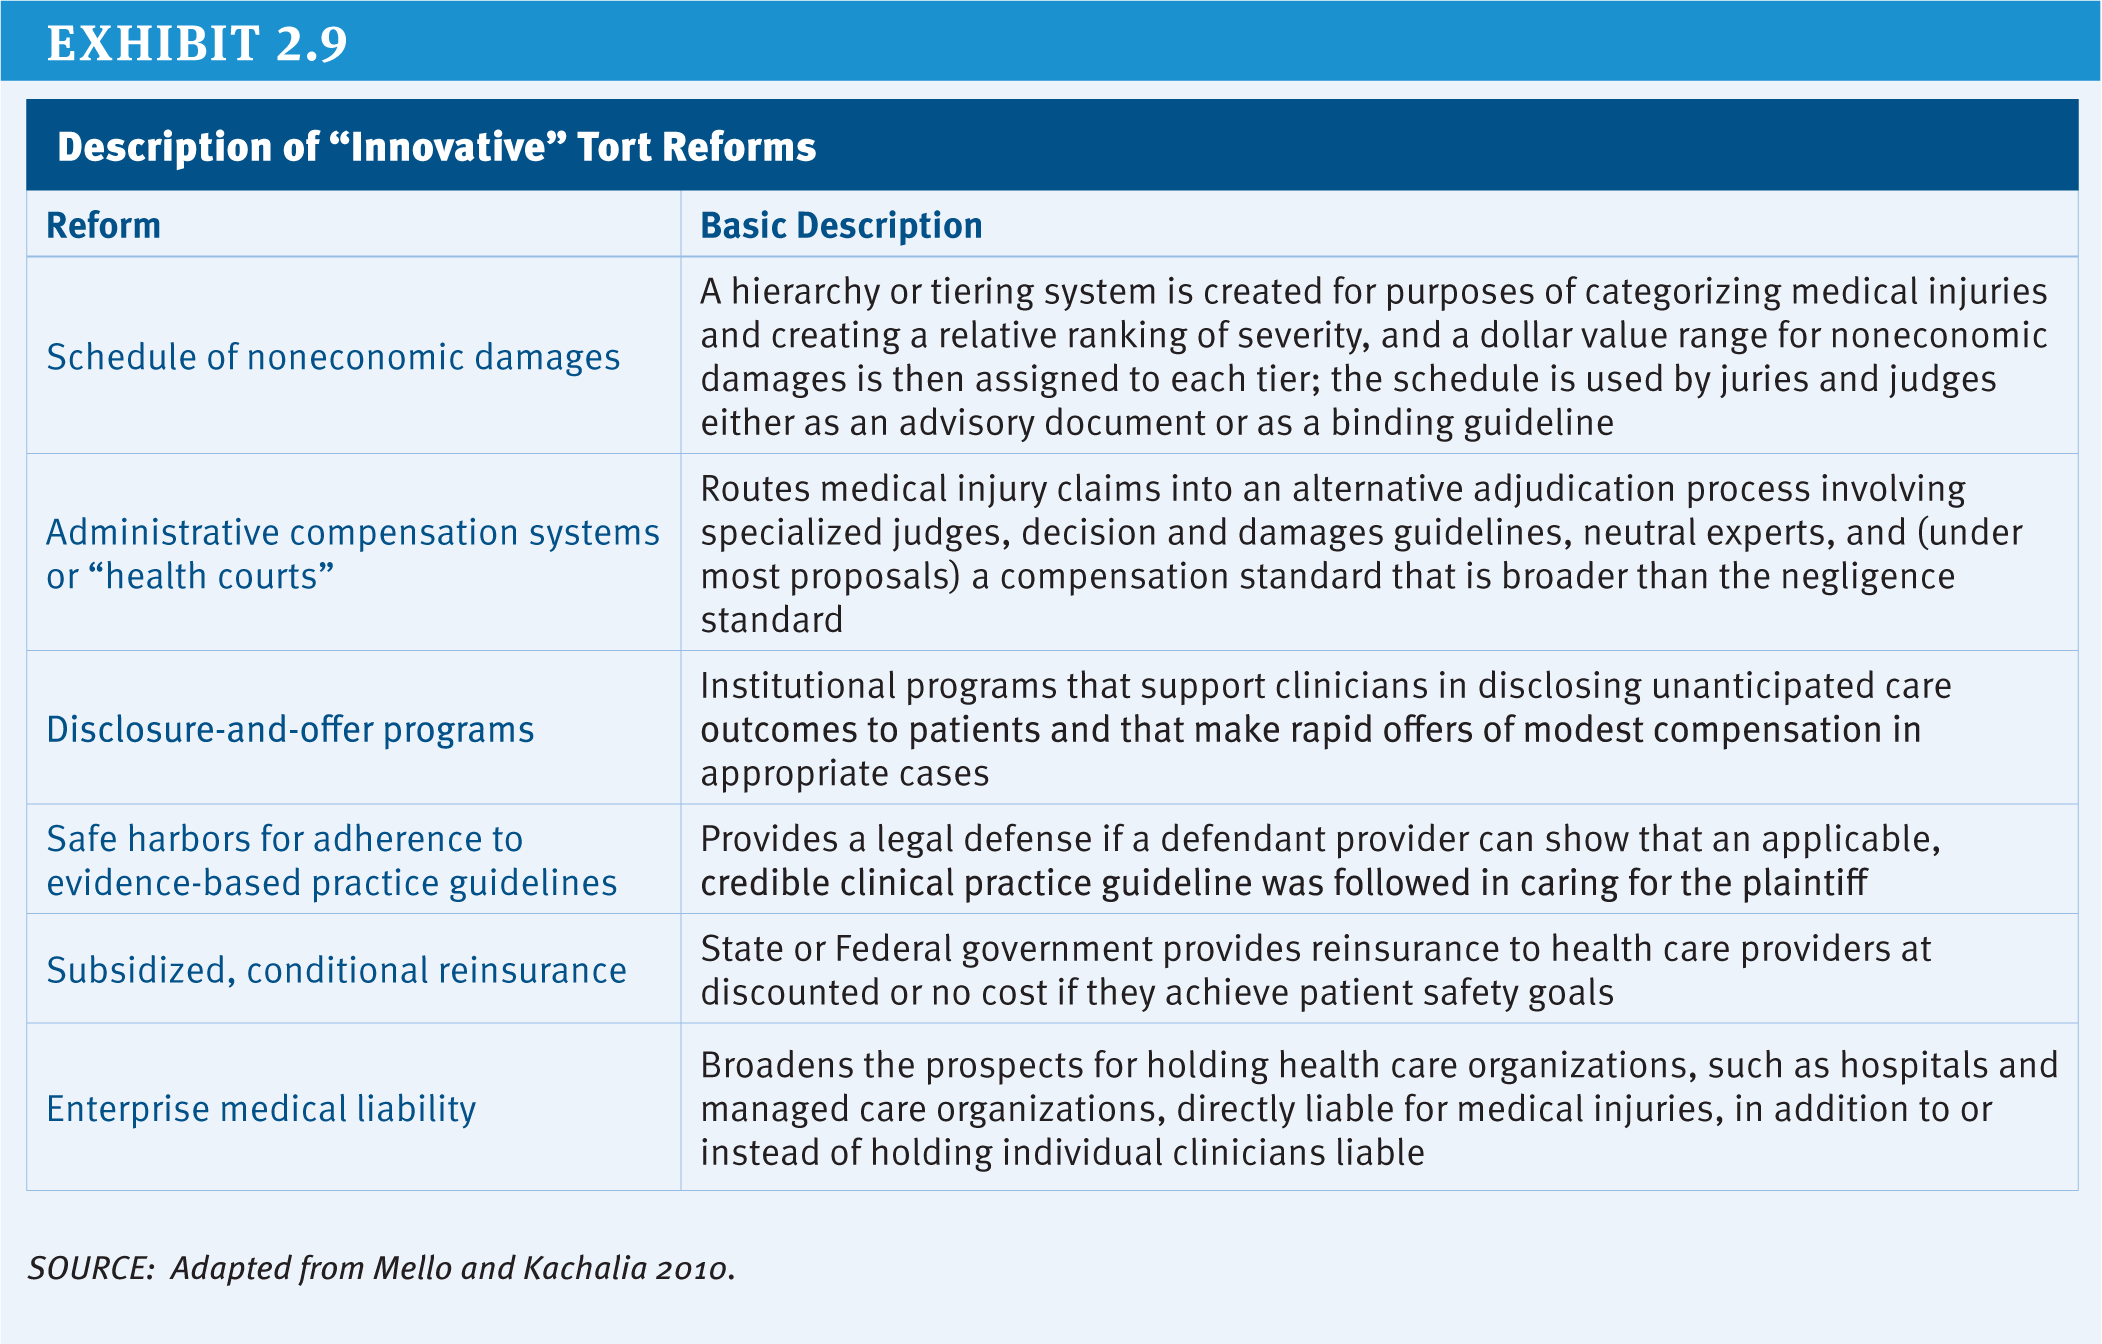
Exhibit 2.9: Description of “Innovative” Tort Reforms
Section 3: Delivery System Reform and Care for High-Need Beneficiaries
.
Delivery System Reform
Options Reviewed
This section discusses two policy options to promote delivery system reform and improve the functioning of the current delivery system, while laying the groundwork for more fundamental change:
» Accelerate implementation of payment reforms authorized under the Affordable Care Act
» Provide real-time information to improve clinical decision-making by physicians and other health professionals under current and reformed payment systems
Changing incentives to address growing quality and spending concerns—especially for patients with multiple chronic conditions and frailty—is an ongoing effort that has been gaining momentum in recent years. Many of the existing Medicare payment policies have been criticized for rewarding physicians and other providers for quantity rather than value and for lacking incentives to improve patient care by encouraging better coordination among providers (Hackbarth 2009). In recent years, Congress has taken several steps to foster delivery system reform by investing in health information technology, by creating a stronger infrastructure for comparative effectiveness research, and through numerous provisions of the Affordable Care Act (ACA) that aim to test new payment models. These efforts have the potential to change current incentives to promote greater collaboration among health professionals and institutional providers, provide greater support for primary care, discourage unnecessary and costly care, and reward providers for high-quality patient care.
The ACA includes numerous provisions focused on delivery system reform, including demonstrations that test models of care—such as medical homes, Accountable Care Organizations (ACOs), and the Independence at Home “house calls” for frail and disabled beneficiaries—and various forms of bundled payment episodes for different collaborations of providers, including hospitals and physicians, and hospitals and post-acute care facilities. The ACA also created the Center for Medicare & Medicaid Innovation (CMMI) within the Centers for Medicare & Medicaid Services (CMS) and gave CMMI the authority to incorporate successful demonstrations into Medicare without obtaining new authority from Congress if the CMS Actuary certifies, based on formal evaluation, that the demonstration increases quality without raising Medicare spending or reduces spending without a diminution in quality. The ACA provides $10 billion over 10 years to support these efforts.
Since its establishment, CMMI has launched several new initiatives (Exhibit 3.1). For instance, CMS currently is implementing and assessing two models of ACOs. The Medicare Shared Savings Program is aimed at recruiting new provider groups to test the ACO model. In 2012, CMS announced that 153 organizations were participating in the shared savings program, serving over 2.4 million Medicare patients across the country (CMS 2012). The Pioneer ACO Model is designed for health care organizations and providers that already are experienced in coordinating care for patients across care settings. As of 2012, there were 32 ACOs participating in the Pioneer ACO Model. In addition, CMMI has launched programs to improve the availability of, and compensation for, primary care, approaches to improve patient safety, and efforts to reduce preventable readmissions, and efforts to help elderly and disabled persons remain at home (CMMI 2011; GAO 2012).
CMMI is getting ready to launch a “Bundled Payments for Care Improvement” initiative, that would link payments for multiple services patients receive during an episode of care. These efforts build on earlier demonstration projects conducted by CMS, including one testing bundled payments for acute care episodes (ACEs), launched in 2009. This project was designed to test the effect of bundling Part A and Part B payments for episodes of care to improve the coordination, quality, and efficiency of care for patients receiving hip and knee joint replacements and specified cardiac procedures (CMS 2009).
Policy Options
OPTION 3.1
Accelerate implementation of payment reforms authorized under the Affordable Care Act
Some experts have suggested that the current timetable for implementing delivery system reforms is too slow and encumbered by the voluntary nature of the programs. Given broad interest in moving forward to modify payments in a way to encourage value rather than volume, these experts have proposed moving more rapidly than is currently planned from demonstration to full implementation where there is early evidence of success and a plausible case for the effectiveness of the approach if it were widely adopted (Emanuel et al. 2012). For example, proponents of a more expedited approach have urged CMMI to expand the ACE demonstration to include more types of care and services (Cutler and Ghosh 2012). Proponents also urge CMMI to put implementation of shared savings models such as ACOs on a faster track.
Those advocating more rapid adoption of new payment methods also have suggested announcing a firm date by which providers will be expected to accept new payment models or specific limits on current payment rates to provide greater certainty for providers, along with added pressure to lead providers to participate in new organizational and payment arrangements. For example, a group of experts has suggested that within 10 years, Medicare and Medicaid should strive to base at least 75 percent of payments in every region on alternatives to fee-for-service payment (Emanuel et al. 2012).
Budget effects
No cost estimate is available for this option.
Discussion
Advocates of accelerating delivery system reform argue that current fee-for-service payments encourage wasteful use of high-cost tests and procedures and that rapid change is needed to improve care outcomes, slow the growth in health care spending, and eliminate excess costs. According to this line of reasoning, until providers are certain that Medicare is moving inexorably away from current payment systems, progress will be too slow; if Medicare sends an unambiguous signal with a clear timetable, providers will have time to make changes as needed (Emanuel et al. 2012). Proponents of this option point to early results from two ACE demonstration sites that indicate that the joint hospital–physician collaboration for providing these services saves money by increasing bargaining power for equipment and supplies from vendors, as a result of the physicians agreeing to use a limited number of devices and supplies to increase their leverage over prices (MedPAC 2011). Some also point to positive results on shared savings. For example, in Massachusetts, 11 physicians groups with a total of 1,600 primary care physicians and 3,200 specialists participated in a five-year Massachusetts Blue Cross Blue Shield project testing the use of global payments to control spending and improve quality, which achieved two-year savings of 2.8 percent in medical costs (although once other payments made to the groups for quality, other bonuses, and technical support were considered, the approach actually cost more in total) (Song et al. 2012).
Others caution against moving too quickly to implement demonstrations on a large scale, however, pointing to the uneven record of past Medicare demonstration projects (CBO 2012). There is a concern that rapid adoption of shared-risk arrangements and other reforms may not achieve the desired results. These experts urge policymakers to take more time to test various models before applying them more broadly, stating that a realistic window to make major organizational change for typical provider organizations is five to seven years (Burns and Pauly 2012). They argue that “first movers” or “early adopters” may not be representative of all providers and that, even if a model is successful with such early adopters, it may not achieve the same results when applied more broadly. More concretely, some experts caution that demonstrated per case savings in the ACE demo could be offset by growth in the number of procedures performed, as suggested by early data from the demonstration sites (MedPAC 2011). Proponents of a more cautious approach recommend waiting for formal, comprehensive results and testing over a longer period of time before drawing conclusions from promising, but partial, findings.
OPTION 3.2
Provide real-time information to improve clinical decision-making by physicians and other health professionals under current and reformed payment systems
Not all providers easily fit into new organizational paradigms, such as ACOs, that may involve some level of shared risk. For example, in some areas, providers may lack the critical mass needed to support financial risk-taking, and some providers may be so specialized or serve such a unique population that paying them using a form of volume-based payment would continue to be the simplest and most reasonable approach. While Medicare tests and implements new payment models, this option could complement existing and evolving payment and delivery systems to improve quality and lower costs.
Following the lead of many commercial insurers, one option would be for Medicare to contract with vendors that specialize in data mining to allow “real-time” analysis of each beneficiary’s health data from claims to identify gaps in care, such as failure to receive recommended preventive services, prescription drug errors, medication incompatibilities, and other apparent deviations from quality care. A number of entities have developed proprietary clinical rules relying on computer algorithms to assess disease prevalence, medical care and prescription drug-use patterns, and compliance with current evidence-based clinical practice guidelines within a health plan population. Using analytic results, the vendors identify specific opportunities to suggest interventions to clinicians and patients that correct inefficient or potentially harmful care.
In one example, decision support software collects information about patients from billing records, laboratory results, and pharmacies to assemble a virtual electronic medical record (Javitt et al. 2008). It then passes this information through a set of decision rules drawn from the medical literature. When the software uncovers a potential issue of concern in the patient’s care, it produces a message to the patient’s physician identifying the issue uncovered, a suggested course of corrective action, and citation to the relevant medical literature. Physicians remain in control of the actual clinical decision-making.
As currently used by commercial plans, this approach is designed to support, rather than regulate, clinical practice by ad-dressing the complexity of care provided by the many providers who do not share a common health record. Varied approaches are used to inform clinicians and patients about actionable clinical information that suggests patient safety issues and gaps in care, as well as to provide patients with recommendations to enhance self-management of chronic conditions. For example, one vendor notifies physicians by phone when there is an urgent issue regarding care for a patient, and by fax, email, or regular mail for less urgent issues. CMS would assume the role of the health plan for traditional Medicare, presumably relying on vendors for the analytics and interventions. Rather than move to full-scale implementation of this option, a program to pilot test this option could also be adopted.
Budget effects
No cost estimate is available for this option. There would be administrative costs for performing the analytics and acting on the findings.
Discussion
This option could give providers more information, on a timely basis, to help improve patient care, following the lead of some private insurers who increasingly rely on data analytics to support physicians and other clinicians. Savings could be achieved as a result; one peer-reviewed controlled study found that the approach lowered average charges by 6 percent relative to the control group (Javitt et al. 2008).
CMS would face the challenge of developing an administrative infrastructure for obtaining the specialized services offered, and would need to address whether to work through current Medicare administrative contractors or contract directly with vendors on a national or local/regional basis. Another challenge is whether this level of clinical management from the claims payer is viewed as part of the mission of traditional Medicare; some physicians and patients might view this ostensibly supportive role as intrusive.
References
Click to expand/collapse
Lawton Burns and Mark Pauly. 2012. “Accountable Care Organizations May Have Difficulty Avoiding the Failures of Integrated Delivery Networks of the 1990s.” Health Affairs, November 2012.
Center for Medicare & Medicaid Innovation (CMMI). 2011. One Year of Innovation: Taking Action to Improve Care and Reduce Costs, 2011.
Centers for Medicare & Medicaid Services (CMS). 2012. Shared Savings Organization Fact Sheet. July 9, 2012.
Centers for Medicare & Medicaid Services (CMS). 2009. Acute Care Event (ACE) Demonstration Project Fact Sheet, 2009.
Congressional Budget Office (CBO). 2012. Lessons from Medicare’s Demonstration Projects on Disease Management, Care Coordination, and Value-Based Payment, January 2012.
David Cutler and Kaushik Ghosh. 2012. “The Potential for Cost Savings Through Bundled Episodes,” New England Journal of Medicine, March 22, 2012.
Ezekiel Emanuel et al. 2012. “A Systemic Approach to Containing Health Care Spending,” New England Journal of Medicine, September 6, 2012.
Government Accountability Office (GAO). 2012. CMS Innovation Center: Early Implementation Efforts Suggest Need for Additional Actions to Help Ensure Coordination with Other CMS Offices, November 15, 2012.
Glenn Hackbarth, Chairman, Medicare Payment Advisory Commission, 2009. Testimony before the House Committee on Energy and Commerce, March 10, 2009.
Jonathan Javitt et al. 2008. “Information Technology and Medical Missteps: Evidence From a Randomized Trial,” Journal of Health Economics, May 2008.
Medicare Payment Advisory Commission (MedPAC). 2003. Report To the Congress: Variation and Innovation in Medicare, June 2003.
Medicare Payment Advisory Commission (MedPAC). 2011. Report to the Congress: Medicare and the Health Care Delivery System. June 2011.
Zirui Song et al. 2012. “The ‘Alternative Quality Contract,’ Based On A Global Budget, Lowered Medical Spending And Improved Quality,” Health Affairs, August 2012.
High-Need Beneficiaries
Options Reviewed
This section discusses three sets of options to improve care and reduce costs for high-need Medicare beneficiaries:
» Implement Medicare models of care for high-need beneficiaries
» Implement State-based models for beneficiaries covered by Medicare and Medicaid
» Improve coverage and provision of palliative care
The search for strategies to improve care and reduce excess spending for people with high health care needs continues to be a high priority for Medicare policymakers, as it is for other health care payers and providers. Many people with Medicare live with multiple chronic conditions, fair or poor health status, and cognitive impairments (Exhibit 3.2). Definitions of high-need populations vary but typically refer to people with multiple chronic conditions, often with functional and/or cognitive impairments, who are at risk of being high users of medical services. Because of their complex needs and compromised health, they often are in greater need of care coordination and at greater risk of potentially preventable and costly hospitalizations, readmissions, and emergency room visits, among other services.
The Affordable Care Act (ACA) includes several provisions designed to test ways to improve care and reduce care costs for Medicare beneficiaries, especially those with high needs. For example, the newly created Center for Medicare & Medicaid Innovation (CMMI) within the Centers for Medicare & Medicaid Services (CMS) is authorized to test and evaluate whether different payment models can reduce spending while preserving or enhancing the quality of patient care. These include such models as Accountable Care Organizations (ACOs) and bundled payments for episodes of care. The ACA also created a Federal Coordinated Health Care Office, within CMS, to focus on those beneficiaries who are dually eligible for Medicare and Medicaid. This office is working with CMMI to test mechanisms for integrating the financing and care for dually eligible beneficiaries, many of whom have significant needs, including demonstrations to test integrated capitated and managed fee-for-service models of care for dual eligibles (the Financial Alignment Model) and models for reducing hospital admissions among nursing home residents (Initiative to Reduce Avoidable Hospitalizations of Nursing Facility Residents) (CMMI 2012). CMS also is modifying current payment policy to compensate providers for services that are focused on preventing hospital readmissions in an effort to reduce unnecessary care and costs for high-need populations.
This section discusses options to build on current efforts that test approaches to contain costs and improve care for high-need beneficiaries. In addition to the options described here, other parts of this report discuss options that would contribute to the goal of improving care management for high-need beneficiaries (see Section Three, Delivery System Reform and Section Five, Governance and Management, Option 5.13).
Policy Options
Implement Medicare Models of Care for High-Need Beneficiaries
Beneficiaries with high needs tend to be heavy users of Medicare-covered services and account for a disproportionate share of Medicare spending. People with Medicare can have significant needs for many reasons, including declining health status due to aging, sudden onset of a severe chronic condition, or the development of a disabling physical or mental condition. Although, in general, beneficiaries with such needs would be expected to require and use more services, there now is compelling evidence that some of this care reflects preventable use of hospital and related services. Between 15 percent and 20 percent of all Medicare inpatient hospital admissions, and between 25 percent and 30 percent of all readmissions within 30 days, are considered potentially preventable with timely and appropriate discharge planning and follow-up care (MedPAC 2008; Stranges and Stocks 2010).
OPTION 3.3
Scale up and test care coordination and care management approaches that have demonstrated success in improving care and reducing costs for well-defined categories of high-need beneficiaries in traditional Medicare
Under this option, CMMI would test whether specific interventions and protocols that already have proved effective in reducing costs on a relatively small scale (through a demonstration project) can be replicated and scaled up and succeed in reducing preventable hospitalizations and other services for high-need beneficiaries. CMMI would invite providers and plans to implement well-defined interventions targeted at specific subgroups of the high-need Medicare population, and would conduct ongoing analysis to identify the attributes that distinguish the most successful programs from others, with the ultimate goal of implementing successful models nationwide. With this option, CMMI would use its authority under the ACA to test the replication of proven care models that reduce costs for specific groups of beneficiaries, and ultimately use this information to broadly implement better management of high-need beneficiaries under traditional Medicare.
Although many care coordination demonstrations have not succeeded in achieving net savings and reducing utilization of unnecessary services across all demonstration sites, some of the care coordination entities participating in these demonstrations have reduced hospitalizations and, in some cases, generated savings, for specific patient subgroups. Positive results stand out for two specific populations: (1) beneficiaries living in the community whose chronic conditions and acute care needs put them at high risk for hospitalization (Brown and Mann 2011) and (2) beneficiaries living in long-term care facilities (Brown and Mann 2011; Ouslander and Berenson 2011), a subset of the Medicare population that accounts for a disproportionate share of Medicare spending due to relatively high rates of hospitalizations (Jacobson, Neuman, and Damico 2010).
There is some evidence of success with care management protocols focused on beneficiaries at high risk of hospitalization when they are targeted and include specific protocols for the intervention, such as the frequency of contact between care managers, patients, and physicians. For example, two of the 15 Medicare Coordinated Care Demonstrations achieved net savings of more than $3,000 per person per year for beneficiaries with congestive heart failure (CHF), chronic obstructive pulmonary disease (COPD), or coronary artery disease (CAD) who experienced a hospitalization in the year prior to enrollment.1 The Geriatric Resources for Assessment and Care of Elders (GRACE) care coordination model reduced net costs by about $1,500 per person per year through a 40 percent reduction in hospitalizations in the third year after the intervention started, but only for a subset of the study patients who were deemed to be at high risk of hospitalization (Counsell et al. 2009). One of the six programs participating in CMS’s Case Management for High-Cost Beneficiaries Demonstration achieved savings by reducing hospital and emergency department use, with expenditures (including fees) 12 percent lower than the comparison group during the first three years (McCall, Cromwell, and Urato 2010). For beneficiaries living in nursing homes, the Interventions to Reduce Acute Care Transitions (INTERACT 2) model demonstrated a 17 percent reduction in hospitalizations over a six-month period, with estimated savings of about $1,250 per nursing home resident (Ouslander and Berenson 2011).
This option would test whether these protocols that have demonstrated success on a relatively small scale can be appropriately targeted and replicated by a broader set of providers to achieve the quality improvements and spending reductions observed in the small-scale programs. The fact that the successful programs included very different types of organizations in different settings suggests that broader dissemination could be successful.
Budget effects
No cost estimate is available for this option.
Discussion
Achieving savings and quality improvement from better care management relies on a combination of specific techniques and their application to beneficiaries who, without them, would probably receive expensive care that could have been avoided. Without effective targeting, the costs of care coordination interventions often exceed the savings from reduced hospitalizations. While some demonstration sites have been able to reduce costs, others have not (Brown and Mann 2011). Some programs were able to reduce hospitalizations, but the savings did not offset the cost of the interventions.
While this option is based on strong evidence, it is not clear whether these models will be effective or achieve savings when scaled up and applied more broadly, if targeting falls short or critical factors of the earlier models’ successes have not been replicated. Another potential concern with this approach is that, once implemented, the models could be difficult to terminate even if they did not achieve savings; regulations that call for termination of programs that did not achieve objectives in a pre-specified timeframe could help to minimize the risk of increased spending.
OPTION 3.4
Launch new Medicare pilot programs to test promising care management protocols for beneficiaries living in the community with physical or mental impairments and long-term care needs
Under this option, CMMI would test models of care for which there is some reasonable prospect of potential savings for this population through improved care management, based on programs conducted on a smaller scale or programs that were not targeted to this population. In contrast to Option 3.3, where fairly strong evidence already has been developed and much is known about the features that successful programs need to exhibit in order to improve care for well-defined categories of people with Medicare, this option is designed to develop, through pilot programs, evidence of comparable rigor and reliability for promising interventions for beneficiaries living in the community with physical or mental impairments and long-term care needs. If some of these pilots are successful, they could then be tested through larger demonstrations to assess their potential for wider dissemination (as in Option 3.3).
As an example, CMMI could develop Medicare pilots for beneficiaries who are dependent on long-term services and supports (LTSS) and require significant amounts of medical care—approximately 15 percent of Medicare beneficiaries (Komisar and Feder 2011). Beneficiaries with chronic conditions, broadly defined, have been the focus of several recent efforts to improve care and reduce Medicare’s costs; thus far, the evidence based on evaluations of programs and demonstrations suggests that finer targeting is needed to reach beneficiaries who are at greater risk of hospitalizations. Beneficiaries with chronic conditions coupled with functional impairments, who have disproportionately high Medicare expenditures—a subgroup of whom are dually eligible for Medicare and Medicaid—represent one appropriate target group (Lewin Group 2010) (Exhibit 3.3). Such beneficiaries could be the focus of new pilots that would test whether care management directed at their full range of care needs could avert unnecessary hospitalizations and use of other expensive services—such as skilled nursing facilities and home health care—and reduce Medicare spending.
Another subset of the Medicare population with relatively high rates of hospitalizations and relatively high costs are beneficiaries with both mental disorders and other chronic conditions. The co-occurrence of mental disorders and other chronic medical conditions serves to complicate the treatment of both sets of illnesses and substantially raises the costs of caring for the affected individual (Druss and Walker 2011). Depression and anxiety disorders are the most common mental disorders that accompany such chronic conditions as diabetes, CHF, asthma, and COPD. There is some evidence that a primary care intervention, known as collaborative care, for this population can achieve savings, based on a program that has been extensively tested in the context of over 40 clinical trials and demonstration programs and was also tested on a population of older adults in the IMPACT study; the latter showed cost savings over a three-year period of about 10 percent (Unutzer et al. 2008). Key elements of that intervention were: training of primary care physicians in evidence-based depression and anxiety treatment, a well-trained and supervised care manager, longitudinal tracking of patient progress, and specialty psychiatric back-up. Another application of the model to people with diabetes and depression showed savings of 14 percent of total costs over a two-year period (Katon et al. 2008). The studies suggest that targeted application of the collaborative care approach can yield savings when applied to older adults with multiple medical and mental health conditions. This approach could be imbedded in a Medicare demonstration of case management, which would require waiving payment rules regarding more than one claim from a single provider organization in a day.
In addition, Medicare could pursue care management demonstrations targeted to beneficiaries with severe and persistent mental disorders who are entitled to Medicare because they receive Social Security Disability Insurance (SSDI) payments. Roughly 40 percent of Medicare beneficiaries under the age of 65 suffer from a major mental illness, approximately 36 percent of whom live with one or more chronic medical conditions, in addition to their mental disorder. This group of beneficiaries incurs total annual costs of $25,000 to $35,000.2 Care management of this population involves greater complexity and a more extensive set of services than is the case for older adults served by the collaborative care model. Successful models of care coordination must manage mental health, substance use disorder services, medical care, and long-term services and supports, which typically involves a team approach led by medical personnel (usually a physician and a nurse) with care managers, peer counselors, and community health workers.
Washington State recently tested this approach on a relatively small scale and, in the initial years, experienced reduced inpatient use and improved health but few costs savings; however, subsequently they experienced annual savings of about 13 percent (Mancuso et al. 2010; Paharia 2012). The state recently has moved to implement this type of approach on a larger scale. Additional demonstrations targeted to Medicare beneficiaries with severe and persistent mental disorders could help to identify interventions that are most likely to succeed in reducing preventable inpatient care and achieving savings.
The aforementioned Medicare pilots could be applied to all Medicare beneficiaries who qualify, whether or not they are also eligible for Medicaid (dual eligibles), and could test the effectiveness of the intervention for both dual eligibles and other beneficiaries. CMMI also could continue to test and refine capitated managed care approaches that focus on coordinating and managing care specifically for dual eligibles who need long-term services and supports. Some of these limited programs or pilots have demonstrated considerable promise for reducing hospitalizations and nursing home admissions, and, in some instances, costs. For example, the Commonwealth Care Alliance (CCA) in Massachusetts operates two programs that receive capitated payments under Medicare and Medicaid: (1) Senior Care Options for dually eligible seniors living in the community, and (2) the Disability Care Program, with some evidence of success in reducing hospitalization rates, nursing home admissions among seniors, and costs (Brown and Mann 2012). In addition, the Program of All-inclusive Care for the Elderly (PACE)—for beneficiaries dually eligible for Medicare and Medicaid who require a nursing home level of care—has been successful in reducing hospitalizations, but has not achieved net Medicare savings for seniors with significant long-term care needs due to relatively high capitation payments (Foster et al. 2007; Beauchamp et al. 2008). Pilots that build on the strengths and avoid the pitfalls of small capitated programs may generate the outlines of a successful policy for reducing costs and improving quality for these high-need, high-cost populations. For both the CCA programs and PACE, the challenge is to set capitated payment rates low enough to generate savings relative to traditional Medicare, but high enough for the programs to provide the personalized care coordination services that have enabled them to reduce hospitalizations and be financially viable.
This option would assess whether care management models that show some promise can succeed in improving quality and lowering costs for well-defined subgroups of beneficiaries.
Budget effects
No cost estimate is available for this option.
Discussion
Supporters of this approach observe that specifically targeting high-need subsets of the Medicare population (such as those with functional impairments or mental health needs) would improve and expand the likely success of existing Medicare care management initiatives and fill a gap in Medicare’s demonstration portfolio. This approach also would engage the Medicare program directly in efforts to support more appropriate use of Medicare-financed hospital and post-acute services for these high-cost users. By focusing this initiative on Medicare beneficiaries with specific disabilities and conditions, rather than on dual-eligible status, this approach may be more likely to achieve success. In addition, this approach could create a pathway for improving care for all high-need Medicare beneficiaries, not just for those who are dual eligibles. Proponents argue that testing small pilots prior to testing larger demonstrations may help to avoid large-scale adoption of untested and unevaluated innovations that could risk entrenchment of policies that might not improve care or reduce costs.
Others express concern that this approach—developing policy interventions through iterative steps involving pilots, refined pilots, scaled-up pilots, and careful evaluations—would take too much time and that more aggressive action is needed to address well-documented problems that exist in the current system.
OPTION 3.5
Pay PACE plans like Medicare Advantage plans
both Medicare and Medicaid. Participants must be 55 or older and certified by the state as being eligible for a nursing home level of care. PACE has evolved, first through demonstration waivers and later through statute. The program aims to keep beneficiaries living in the community and provides a comprehensive set of services including: primary, acute, and long-term care; behavioral health services; prescription drugs; and end-of-life care planning. The program includes a range of supportive services, with a key feature being adult-day care. Although the program is available in 29 states and includes 84 plans, it has remained relatively small and served about 21,000 high-needs beneficiaries nationwide in 2012 (MedPAC 2012b). Evaluations of the PACE program generally have found that the program has improved the quality of life and care for enrollees, but due to the relatively high capitated payments, the program does not reduce Medicare spending (Foster et al. 2007; Beauchamp et al. 2008).
PACE plans are paid capitated payments from both Medicare and Medicaid. Medicare payments to PACE plans differ in several ways from payments to Medicare Advantage plans, and collectively result in higher payments to PACE plans than to Medicare Advantage plans in the same market. First, payments to PACE plans are based on the higher benchmarks (i.e., the maximum amount Medicare will pay plans) that were in place for Medicare Advantage plans prior to enactment of the ACA. The ACA did not lower the benchmarks for PACE plans, but did lower the benchmarks for Medicare Advantage plans. Second, PACE plans do not submit bids, unlike Medicare Advantage plans, and instead payments are set equal to the benchmark. This results in higher payments to PACE plans because most Medicare Advantage plans submit bids that are lower than the benchmark. Third, payments to PACE plans are risk adjusted using the Medicare Advantage risk adjustment methodology but with an additional payment for frail beneficiaries in the PACE program, resulting in higher payments to PACE plans. Fourth, PACE plans are not eligible for the quality bonus payments available to Medicare Advantage plans under the ACA.
In conjunction with improvements in the Medicare Advantage risk adjustment methodology (see Section Two, Medicare Advantage), including an evaluation of whether the improvements eliminate or reduce the need for a frailty adjuster for PACE plans, this option would pay PACE plans using the current-law benchmarks for Medicare Advantage plans and allow PACE plans to qualify for quality-based bonus payments. A similar option has been recommended by MedPAC (MedPAC 2012a).
Budget effects
MedPAC estimates that these PACE changes would reduce spending by less than $1 billion over five years, if implemented no later than 2015.
Discussion
These changes would better align PACE payments with traditional Medicare spending levels and with the measurable risk of the patient population. They would also promote equity among capitated programs that coordinate care for high-need beneficiaries. These changes would yield budget savings and provide an incentive for the plans to meet quality and patient experience thresholds to qualify for the bonus payments, just like Medicare Advantage plans.
However, there is some concern that the risk adjusters, even with improvements, would not adequately account for the higher costs of meeting the special needs of this population. Others worry that bringing the payment levels down to the Medicare Advantage benchmarks, while saving money in the short-term, may slow the development of the PACE model, which remains a small component of a system for frail beneficiaries, especially if the risk adjustment and payment models do not fully accommodate the costs of the program’s participants. Finally, the quality metrics used for Medicare Advantage plans may not be appropriate for PACE plans, and some argue that it may be misguided to provide incentive payments to PACE plans based on these metrics.
Implement State-Based Models for Beneficiaries Covered By Medicare and Medicaid
Nine million low-income elderly and disabled people—roughly 20 percent of the total Medicare population—are covered under both the Medicare and Medicaid programs (Exhibit 3.4). Compared with people with Medicare who are not covered by both programs, dual eligibles are much more likely to have extensive needs for long-term services and supports. Dual eligible beneficiaries encompass some of the sickest, frailest, and most costly beneficiaries in Medicare, although not all dual eligibles are high-need. In 2008, only one in four dual eligibles had an inpatient stay, and 16 percent had relatively low Medicare spending (below $2,500) (Kaiser Family Foundation 2012). Up to 38 percent of duals have neither multiple chronic conditions nor long-term care needs (Brown and Mann 2012).
Medicare is the primary source of health insurance coverage for the dual eligible population. Medicaid supplements Medicare, paying for services not covered by Medicare, such as dental care and long-term services and supports, and helping to cover Medicare’s premiums and cost-sharing requirements. Medicare beneficiaries who also are covered by Medicaid face the challenge of navigating two health care programs that typically do not work well together due to different benefits, billing systems, enrollment, eligibility, and appeals procedures, and often different provider networks. The lack of coordination between the two programs puts beneficiaries at risk of poorly coordinated care and unnecessary emergency room visits and hospitalizations, leading to poorer care and higher costs for both Medicare and Medicaid.
States may have minimal incentive to contribute to the coordination of care for dual eligible beneficiaries because most of the savings that would result from reductions in hospitalizations would accrue to Medicare. As a result, there is growing interest in approaches to encourage greater coordination across the two programs. Beginning in 2013, special needs plans for dual eligibles (D-SNPs) are required to have contracts with the states in which they operate to improve the coordination of Medicare and Medicaid benefits for dual eligibles; it is at the state’s discretion as to whether to issue contracts to D-SNPs. This requirement for D-SNPs may help to improve the coordination of benefits, although it does not provide states with a direct financial incentive to contribute to the coordination effort.
The CMS Federal Coordinated Health Care Office, in conjunction with CMMI, is working with states to develop programs to improve the coordination of care for dual eligibles and reduce spending under Medicare and Medicaid. The Financial Alignment Model aims to integrate Medicare and Medicaid financing and services for beneficiaries who are dually eligible for Medicare and Medicaid, with savings from reduced hospitalizations and other services shared between the Federal government and the states. In 2011, 15 states received planning grants to develop proposals to integrate the financing and delivery of care for dual eligible beneficiaries. As of December 2012, more than 20 states had proposals pending with CMS to participate in the demonstration, and three states (Massachusetts, Washington, and Ohio) have signed an agreement with CMS and are expected to launch demonstrations in 2013. The demonstrations will test both capitated models (involving three-way contracts among CMS, states, and plans) and models that involve a managed fee-for service approach. The demonstrations are expected to include up to two million beneficiaries nationwide.
OPTION 3.6
Require beneficiaries who are dually eligible for Medicare and Medicaid to enroll in comprehensive Medicaid managed care plans
This option would require beneficiaries who are dually eligible for Medicare and Medicaid to enroll in comprehensive Medicaid managed care plans to receive their Medicare- and Medicaid-covered benefits. Medicaid would provide capitated payments to managed care companies, and Medicare would reimburse Medicaid for its share of the costs. The option was recommended by the National Commission on Fiscal Responsibility and Reform (Simpson-Bowles commission) as part of a plan to reduce the deficit (National Commission on Fiscal Responsibility and Reform 2010). As noted above, a demonstration is underway in some states to test the managed care option. In contrast to this option, the demonstration does not mandate that dual eligible beneficiaries enroll in managed care plans (some have passive enrollment with an opt-out) nor specify that all dual eligibles enroll in Medicaid (rather than Medicare) managed care plans. Additionally, not all states are participating in the demonstration, and some states are testing a managed fee-for-service approach rather than a capitated managed care approach that would be used in this option.
Budget effects
The Simpson-Bowles commission estimated that this option would save $1 billion in 2015 and $12 billion from 2015 to 2020. Since the commission made its recommendations, some states have planned to undertake demonstrations to improve the coordination of care for dual eligibles; the savings from this option may be smaller if implemented in conjunction with these state demonstrations.
Discussion
Proponents argue that this option would improve the quality of care for dual eligibles by providing financial incentives for states to coordinate their health and long-term care. The option, they argue, would reduce Federal and state spending by eliminating current incentives that result in duplicative and unnecessary services. Both Medicare and Medicaid could achieve savings by setting payments to managed care plans at a level that would be lower than current projected baseline spending (Lewin Group 2004). In addition, proponents note that Medicaid managed care plans have experience in managing low-income populations, and are well-positioned to improve the coordination and quality of care for dual eligibles, building on their existing provider networks (Meyer 2011).
Critics of this option argue that dual eligible beneficiaries should be entitled to the same plans and providers as all other Medicare beneficiaries, and should not be required to join Medicaid managed care plans as a condition of receiving their Medicare benefits. They also argue that the approach ignores the heterogeneity of the dual eligible population and fails to account for different health care needs of these beneficiaries. Opponents worry that the health plans could achieve savings not only by directly limiting access to care but also by paying providers at or near Medicaid rates rather than higher Medicare rates, potentially limiting access. Finally, some caution against passively enrolling beneficiaries into plans, and instead argue that dual eligibles should be required to actively make a choice as to whether to enroll in a managed care plan, in order to promote self-determination and the exercise of real options (Frank 2013).
Improve Coverage and Provision of Palliative Care
For 30 years, the Medicare hospice benefit to provide supportive end-of-life care has been a core part of Medicare. Currently, nearly half of beneficiary decedents use hospice before death. Concerns about possibly inappropriate use of hospice benefits for beneficiaries with declining health status who are not imminently likely to die, suggest the need for reconsideration of the purpose of hospice and whether access to palliative care for patients—whether or not they have a dire short term prognosis—is desirable.
Palliative care is an approach to providing care that addresses patients’ and caregivers’ quality of life, provides timely professional expertise for the seriously ill, and focuses on pain relief while offering the potential to moderate high spending near the end of life, enhance quality, and improve patient and family well-being. Interdisciplinary palliative care teams, comprised of physicians, nurses, social workers, chaplains, and others, provide the following services: assessing and treating all symptoms, including pain; establishing a plan of care that matches treatment goals to those of well-informed patients and families; mobilizing practical aid for patients and caregivers; identifying community resources to ensure a safe and secure living environment; responding to concerns and crises at all times; and promoting collaboration across a range of settings, such as hospital, home, and nursing home.
Under current law, Medicare only offers a palliative care benefit as part of the hospice benefit for people with terminal illnesses in their last six months of life. There is no payment for the professional services associated with palliative care. Many hospitals provide palliative care as part of a package of services under the diagnosis-related group payment approach. The idea of expanding palliative care coverage under Medicare has gained attention as clinicians and policymakers search for ways to improve the experiences of patients with serious illnesses and limitations. Interest also is motivated by concerns about the use of hospice benefits for beneficiaries with declining health status, who are not imminently likely to die. There is also some evidence that palliative care might result in lower Medicare spending (Meier 2012).
Palliative care is not generally or necessarily provided as an alternative to curative care but can be provided concurrently. Some patients receiving palliative care have terminal prognoses, whereas others can live many years with their disabilities. Palliative care practitioners often attempt to mobilize long-term services and supports but are not financially responsible for doing so. In the U.S. (but not within the context of Medicare specifically), palliative care is provided both within and outside of hospice programs, the latter offered independent of the patient’s prognosis and concurrent with life-prolonging and curative therapies for persons living with serious, life-threatening conditions.
The absence of generally available palliative care could be contributing to the growth of possibly inappropriate use of hospice beyond its intended use, as costs for hospice in Medicare increased over the past decade from $3 billion to $13 billion (MedPAC 2012b).
OPTION 3.7
Incorporate the capacity to provide high-quality palliative care into Medicare’s hospital conditions of participation requirements, and develop and implement quality measures to assess the performance of palliative care for Medicare beneficiaries
As of 2009, 63 percent of community hospitals with at least 50 beds and 85 percent of hospitals with more than 300 beds reported having a palliative care program, affecting roughly 2 percent of discharges (Center to Advance Palliative Care 2011). Hospital-based palliative care programs have been shown in a series of studies to improve quality and patient well-being, while reducing costs of care for this population (Meier 2012).
There has been little emphasis on palliative care in performance measurement assessments, such as the value-based purchasing program for hospitals, quality measures for nursing homes, or quality indicators for Medicare Advantage plans.
This option would require hospitals to adopt palliative care programs as a Medicare condition of participation. In addition, it would direct the Secretary of the Department of Health and Human Services (HHS) to incorporate measures of core competency in palliative care in assessing and publishing quality indicators for providers and plans. Currently, Medicare conditions of participation do not include standards for palliative care. Moreover, to the extent value-based purchasing moves from process measures (e.g., palliative care team present) to disease-specific outcomes (e.g., mortality), the measures would need to be adjusted to distinguish preventable deaths from expected deaths so that hospitals do not face perverse incentives to forgo adoption of palliative care programs that might increase their reported mortality rates.
Budget effects
No cost estimate is available for this option.
Discussion
Hospital-based palliative care programs are diffusing rapidly, but more than one-third of community hospitals with at least 50 beds do not have these programs (Meier 2011). This option encourages the continued development and diffusion of quality palliative care. It addresses an often overlooked aspect of care and provides a corrective to the current bias toward prevention and cure, which may not be consistent with a patient’s best interests or wishes. Conditions of participation and relevant performance measures for palliative care would create incentives for plans and providers to develop quality palliative care programs, and potentially give patients a new tool for assessing providers and plans in their area.
However, there could be some concerns about this option because of its potential to increase the regulatory burden on providers and plans. Some might view these requirements as unnecessary given the fairly rapid spread of palliative care even in the absence of these initiatives.
OPTION 3.8
Launch a large-scale pilot to test palliative care as a Medicare benefit
This option would create a demonstration project to test alternative ways of paying for palliative care to beneficiaries outside of a hospital episode, as a possible precursor to developing a palliative care benefit under Medicare. The demonstration would test payments and delivery system options and assess whether access to palliative care improves the quality of life for patients, reduces pain, helps patients achieve their treatment goals, minimizes inappropriate use of hospice services, and reduces Medicare spending. Unlike Medicare’s current hospice benefit, this option would not require that a physician certify that a patient is likely to die within six months. In this way, beneficial palliative care for patients in need could be introduced at any point in patients’ declining health resulting from their underlying severe chronic illnesses, regardless of their prognosis. The demonstration also would test whether a palliative care benefit would reduce the portion of hospice payments associated with ongoing palliative care rather than the more intensive care provided in the last days of life.
Budget effects
No cost estimate is available for this option. There is limited data on the spending effects of a broad palliative care benefit co-existing with ongoing curative therapy.
Discussion
When palliative care programs function well, patients are able to stay in their homes as a consequence of better family support and care coordination, rather than being hospitalized. In addition, palliative care produces more appropriate home care and hospice referrals; patients experience fewer days in intensive care units; and imaging, laboratory, specialty consultations, and procedures are avoided. Also, there is clearer guidance for all health professionals who may treat patients about patient preferences regarding resuscitation and other aggressive attempts at patient “rescue.”
Some studies demonstrate spending reductions as a result of care plans that reflect the informed wishes of patients and families, leading to a reduction of emergency room visits and readmissions, with more appropriate and timely referral to community hospice for those patients who have terminal conditions and to other programs that can provide supports for all patients (Meier 2012). However, these small-scale studies are not sufficient to permit assessment of the spending effects that would result from a broad expansion of palliative care in Medicare.
The evidence that increased palliative care could reduce spending is preliminary and would need to be confirmed through a large-scale demonstration before adopting a new benefit. Consistent with Option 3.3, such a demonstration could be combined with testing a narrower application of the current Medicare hospice benefit, under auspices of the CMMI, that reserves the more intensive supports of hospice for true end-of-life care.
OPTION 3.9
In conjunction with launching a large-scale pilot testing palliative care as a Medicare benefit, narrow the hospice benefit so that it serves only patients truly at the end-of-life with an identifiable short prognosis
Over the past decade, the average length-of-stay in hospice has increased from 54 days to 86 days, due almost entirely to a large increase in the proportion of hospice participants with lengths of stay longer than six months (MedPAC 2012b). In 2000, 10 percent of hospice patients had stays of 141 days or longer; in 2010, the top 10 percent all had stays of over 240 days. Among the concerns are the rapid change in the distribution of hospice diagnoses; lengths-of-stay greatly exceeding the physician’s expected prognosis certification of six months or less; and reports of seeming routine referrals to hospice from some nursing homes and assisted living facilities. Concerns have risen about rapid growth in the number of people “discharged alive” from hospice, which in some states approaches or exceeds 50 percent of beneficiaries entering hospice. This option, combined with the palliative care benefit described in Option 3.8, would restrict hospice eligibility to beneficiaries to those who are truly in the last weeks or days of life.
Budget effects
No cost estimate is available for this option.
Discussion
Providing a more broadly available palliative care benefit, paid at a much lower level than hospice currently, while also providing a more restricted-access hospice benefit, could reduce the long lengths-of-stay currently experienced in hospice while encouraging earlier referral to palliative care, which could be provided concurrently with curative care. Because palliative care does not involve bedside nursing, home health, or other “hands-on” services, but rather is focused on recommendations for symptom relief, shared decision making and care planning, and care coordination, this approach could counter the misuse of the current hospice benefit to provide additional hands-on staff in nursing homes and other residential care environments.
Creating two separate, complementary programs would add substantial complexity to care of those who would benefit from palliative care, only some of whom might also benefit from a more targeted hospice program. Instead of streamlining care for this high-need population, new regulatory barriers might be created because of the added complexity and concerns about possibly paying twice for similar services.
References
Click to expand/collapse
Jody Beauchamp, Valerie Cheh, Robert Schmitz, Peter Kemper, and John Hall. 2008. The Effect of the Program of All-Inclusive Care for the Elderly (PACE) on Quality: Final Report, Mathematica Policy Research, February 12, 2008.
Randall Brown and David R. Mann. 2011. Best Bets for Reducing Medicare Costs for Dual Eligible Beneficiaries, Kaiser Family Foundation, November 2011.
Randall Brown et al. 2012. “Six Features of Medicare Coordinated Care Demonstration Programs that Cut Hospital Admissions of High-Risk Patients,” Health Affairs, June 2012.
Center for Medicare & Medicaid Innovation (CMMI), Centers for Medicare & Medicaid Services (CMS). 2012. Fact Sheet: CMS Initiative to Reduce Avoidable Hospitalizations Among Nursing Facility Residents, 2012.
Center to Advance Palliative Care. 2011. America’s Care of Serious Illness: A State-by-State Report Card on Access to Palliative Care in Our Nation’s Hospitals, May 2011.
Steven R. Counsell et al. 2009. “Cost Analysis of the Geriatric Resources for Assessment and Care of Elders Care Management Intervention,” Journal of the American Geriatrics Society, August 2009.
Benjamin Druss and Elizabeth Walker. 2011. Mental Disorders and Medical Comorbidity, Research Synthesis Report #21, Robert Wood Johnson Foundation, 2011.
Federal Coordinated Health Care Office, Centers for Medicare & Medicaid Service (CMS). 2012. Medicare-Medicaid Financial Alignment Demonstration—Standards & Conditions, January 2012.
Leslie Foster, Robert Schmitz, and Peter Kemper. 2007. The Effects of PACE on Medicare and Medicaid Expenditures: Final Report, Mathematica Policy Research, August 29, 2007.
Richard Frank. 2013. “Using Shared Savings to Foster Coordinated Care for Dual Eligibles,” New England Journal of Medicine, January 2, 2013.
Gretchen Jacobson, Tricia Neuman, and Anthony Damico. 2010. Medicare Spending and Use of Medical Services for Beneficiaries in Nursing Homes and Other Long-Term Care Facilities: A Potential for Achieving Medicare Savings and Improving the Quality of Care, Kaiser Family Foundation, October 2010.
Kaiser Family Foundation. 2012. Medicare’s Role for Dual-Eligible Beneficiaries, April 2012.
Wayne Katon et al. 2008. “Long Term Effects On Medical Costs Of Improving Depression Outcomes In Patients With Depression And Diabetes,” Diabetes Care, 2008.
Harriet Komisar and Judy Feder. 2011. Transforming Care for Medicare Beneficiaries with Chronic Conditions and Long-Term Care Needs: Coordinating Care Across All Services, Georgetown University, October 2011.
Lewin Group. 2004. Medicaid Managed Care Cost Savings: A Synthesis of Fourteen Studies, Prepared for America’s Health Insurance Plans, July 2004.
Lewin Group. 2010. Individuals Living in the Community with Chronic Conditions and Functional Limitations: A Closer Look. Prepared for the Office of the Assistant Secretary for Planning & Evaluation, United States Department of Health and Human Services, January 2010.
David Mancuso et al. 2010. Washington Medicaid Integration Partnership, RDA Report 9.100 Department of Social and Health Services, State of Washington.
Nancy McCall, Jerry Cromwell, and Carol Urato. 2010. Evaluation of Medicare Care Management for High-Cost Beneficiaries (CMHCB) Demonstration: Massachusetts General Hospital and Massachusetts General Physicians Organization (MGH), Final Report, Submitted by RTI International to the Centers for Medicare & Medicaid Services, September 2010.
Medicare Payment Advisory Commission (MedPAC). 2008. Report to the Congress: Reforming the Delivery System, June 2008.
Medicare Payment Advisory Commission (MedPAC). 2011. Report to the Congress: Medicare Payment Policy, March 2011.
Medicare Payment Advisory Commission (MedPAC). 2012a. Report to the Congress: Medicare and the Health Care Delivery System, June 2012.
Medicare Payment Advisory Commission (MedPAC). 2012b. Report to the Congress: Medicare Payment Policy, March 2012.
Diane Meier. 2011. “Increased Access to Palliative Care and Hospice Services: Opportunities to Improve Value in Health Care,” The Milbank Quarterly, 2011.
Diane Meier. 2012. Improving Health Care Value Through Increased Access to Palliative Care, National Institute for Health Care Management Foundation, April 2012.
Harris Meyer. 2011. “A New Care Paradigm Slashes Hospital Use and Nursing Home Stays for the Elderly and the Physically and Mentally Disabled,” Health Affairs, March 2011.
National Commission on Fiscal Responsibility and Reform. 2010. The Moment of Truth: Report of the National Commission on Fiscal Responsibility and Reform, December 2010.
Joseph G. Ouslander and Robert A. Berenson. 2011. “Reducing Unnecessary Hospitalizations of Nursing Home Residents,” New England Journal of Medicine, September 29, 2011.
Indira Paharia. 2012. “Behavioral Health Integration for Dual Eligibles in Managed Care, Presentation,” Molina Healthcare, 2012.
Deborah Peikes et al. 2012. “How Changes in Washington University’s Medicare Coordinated Care Demonstration Pilot Ultimately Achieved Savings,” Health Affairs, June 2012.
Elizabeth Stranges and Carol Stocks. 2010. Potentially Preventable Hospitalizations for Acute and Chronic Conditions, 2008. Healthcare Cost and Utilization Project, Agency for Healthcare Research and Quality, November 2010.
Jurgen Unutzer et al. 2008. “Long-term Cost Effects of Collaborative Care for Late-life Depression,” American Journal of Managed Care, February 2008.
Patient engagement
Options Reviewed
This section discusses two sets of policy options Medicare could adopt to increase patient and family caregiver engagement:
» Approaches and incentives for providers and plans
» Approaches and incentives for patients
Advances in medicine and expanded consumer options have added many responsibilities for patients and family caregivers even while improving the prospects for better outcomes. Increasingly, people are being asked to engage more actively and knowledgeably in many different aspects of their care to ensure that it is consistent with their preferences and delivers the best possible results. Increasing patients’ active and knowledgeable participation in their care is considered by some as a potentially powerful strategy to achieve the goals of improved patient experience, population health, and efficiency.3
Employers, health plans, and clinicians have developed approaches to patient engagement with mixed results. Many of these efforts are aimed at changing specific health-related behaviors, such as diet and exercise recommendations or compliance with treatment regimens. Others try to spread the use of shared decision making (SDM) to help patients participate more actively in their overall care. Still others seek to expand the transparency of health care costs and quality ratings to help consumers make informed decisions about providers and care (Catalyst for Payment Reform 2012).
People with Medicare are considered a prime group who could benefit from increased engagement. Many have multiple chronic conditions, are frequent users of medical care services, and often have additional vulnerabilities and limitations in navigating their health care options.
Background
Patient engagement has been defined as “actions people take for their health and to benefit from health care” and includes such behaviors as: finding good clinicians and care facilities; communicating with clinicians; paying for care; making good treatment decisions; participating in treatment; making and sustaining lifestyle behavior changes; getting preventive care; planning for care at the end of life; and seeking health knowledge (Gruman et al. 2010). As part of patient engagement, some experts also include patients’ financial responsibility for their health care decisions and utilization of care. In this respect, some have proposed to require people with Medicare to share more of the financial burden of Medicare spending to give them a greater stake in their health care (for an example of proposals in this area, see Antos 2012). This section does not address cost sharing in the context of efforts to enhance patient engagement in Medicare; for a discussion of options related to changes in Medicare beneficiary cost sharing, see Section One, Beneficiary Cost Sharing.
People’s willingness and ability to take action on their own behalf are influenced by many factors. For example, those who are seriously ill have difficulty coordinating their care among multiple clinicians. Patients with limited health literacy or math skills often cannot understand information regarding medications and other care regimens. Cognitive deficits and changes in hearing, sight, and mobility undermine people’s confidence in learning new ways to interact with the health care system. Patient participation in care is also affected by health care organizations and health professionals. It is daunting for people to ask questions of clinicians who cut them off or are unresponsive (Frosch et al. 2010). Information comparing insurance plans and benefits and the quality of facilities and doctors often is difficult to comprehend and the lack of price information poses additional barriers. In addition to all of these factors, the complexity of the Medicare program makes informed choice difficult: too many choices have been shown to reduce the quality of people’s decision making (Schwartz 2005).
At the same time, the potential benefits of care on people’s health and functioning can be negatively affected when they have low levels of active engagement. Different measures of the level of engagement by the population in general and of those over age 65 in particular show that only between one-quarter and one-third are active, confident, knowledgeable participants in their care (Williams and Heller 2007; Hibbard and Cunningham 2008).
Experts have suggested a number of ways to increase patient engagement that might reduce costs. One strategy is to support increased patient engagement through shared decision making for preference-sensitive treatment choices. The Affordable Care Act (ACA) includes several provisions in this area. For example, the ACA requires the Secretary of the Department of Health and Human Services (HHS) to establish a program that develops, tests, and disseminates certificated patient decision aids to help patients and caregivers better understand and communicate their preferences about reasonable treatment options, and funds an independent entity to develop consensus-based standards and certify patient decision aids for use by Federal health programs and other entities (Informed Medical Decisions Foundation 2010; Lee and Emanuel 2013). The Center for Medicare & Medicaid Innovation (CMMI) is focusing some attention in this area as well. These activities build on efforts by private employers, insurers, and patient advocates in both public and private health care settings.
A 2008 study suggested that implementing shared decision making for 11 procedures would yield more than $9 billion in savings nationally over 10 years (Lee and Emanuel 2013). There also is some evidence that being informed about risks and benefits of different test and treatment options may have an impact on the cost of some of patients’ decisions (Arterburn 2012). For example, an effort by leading physician organizations to identify tests and procedures that have little or no benefit to patients may encourage physicians to use more evidence-based approaches to tests and discuss recommendations with their patients, thus reducing unnecessary care (Cassel and Guest 2012).
While Medicare spending may not be reduced significantly through patient engagement alone, it may be difficult for some other efforts that reduce costs to be as effective as they otherwise could be without taking into account the role of the patient in financially consequential decisions about care. While no single policy option is likely to make all the difference in this area, a mix of policy changes could lead to changes in engagement among people with Medicare and those who care for them. There are no official cost estimates for the options discussed in this section, but the ways in which some of the options could generate savings to the Medicare program and beneficiaries are discussed below, where applicable.
Policy Options
Approaches and Incentives for Providers and Plans
OPTION 3.10
Increase provider payments for time spent interacting with patients in traditional Medicare and Medicare Advantage
Many have called for a rebalancing of provider payments, especially to physicians, so that cognitive services are more lucrative than they are today, especially in comparison to procedures. This option would change the balance in payments to increase sup-port for cognitive medicine, giving doctors and other clinicians more time to engage with their patients. This approach could foster greater efforts in shared decision making between providers and patients.
Budget effects
No cost estimate is available for this option. The option could be designed to be budget neutral within the constraints of total physician fee schedule spending. This option might produce savings for both the Medicare program and beneficiaries to the extent that it helps patients, with encouragement from their providers, to manage their chronic conditions, avoid expensive and painful complications, and prevent new conditions from arising.
Discussion
Genuine patient engagement by clinicians—in shared decision making or discussion about strategies for managing chronic conditions, for example—takes time. Lack of time is a complaint of both patients and clinicians. It is possible that a shift in payment policy could reduce incentives to order or recommend tests and procedures, thus producing savings. For example, a cardiologist could, after discussion with a patient, try medication combined with diet and exercise to manage the problem, rather than immediately inserting a stent, an expensive and often overused approach to treating coronary artery disease. A number of decision support tools that summarize evidence and risk trade-offs targeted to physicians and patients have been developed to clarify treatment options, and more are being developed as part of the ACA (Lee and Emanuel 2013). Such tools might streamline complex shared decision making. Multiple strategies to support this kind of engagement could be adopted, including incentives for clinicians and, in particular, the ability of clinicians to invest the time and attention to help patients see the benefits of self-management, to develop the skills and strategies to act, and to increase patients’ confidence that they can be successful at it.
There is some concern, however, that merely providing a financial incentive for cognitive (as opposed to procedural) services would not guarantee that clinicians are able to use this time effectively or productively. There is evidence that many physicians lack the training, skills, or interest to engage in two-way discussions about treatment plans (Levinson, Lesser, and Epstein 2010). Acquiring these skills takes additional time and effort. Many patients, particularly older people who are comfortable with having their physicians maintain greater control over treatment decisions, may be similarly reluctant to abandon their traditional roles, especially when they feel ill and unable to participate in a shared decision making process.
OPTION 3.11
Emphasize patient access and use in Meaningful Use requirements for electronic medical records
The American Recovery and Reinvestment Act of 2009 supported adoption of health information technology—including electronic health records—by hospitals and clinicians through Medicare and Medicaid incentive payments and tied those payments to evidence of “meaningful use” of those records. Considerable attention has already been paid to this approach in the policies and actions of the Office of the National Coordinator (ONC) for Health Information Technology. This approach could be enhanced over time, with patient engagement requirements stepped up at each phase of the program.
This option would require traditional Medicare to enhance requirements for incorporating patient access and use in Meaningful Use requirements for Federally-funded electronic health/medical records (EHRs). Within Medicare Advantage, plans could be required to have network providers that met Meaningful Use standards for patient access to, and control over, EHRs.
Budget effects
No cost estimate is available for this option.
Discussion
Interoperable, transportable, electronic health records—and their off-shoot, personal EHRs—are expected to reduce some barriers to care coordination and continuity that now by default fall to patients and families who may be dealing with multiple co-morbidities. Clinician-patient communication and care coordination may be eased by meaningful access of patients to their health information through secure e-mail and other online tools. However, implementation of EHRs generally has been slow and physician adoption mixed. Currently, personal EHRs appear primarily to attract patients who are Web-savvy and already engaged in their health care (Miller 2012), which could make it difficult for providers to engage a greater number of their Medicare patients in this manner.
OPTION 3.12
Identify and incorporate measures of patient engagement in patient surveys and in provider and plan payment
Medicare increasingly is tying at least some portion of payments to providers and plans to their performance on sets of quality measures. But there are few measures of engagement in use (Williams and Heller 2007; Hibbard and Cunningham 2008). To address this issue, one option would be to require Medicare to identify or develop robust measures of patient engagement and use patient engagement metrics in pay-for-performance and shared savings plans. Medicare Advantage plans could be required to use patient engagement metrics as one aspect of selecting and rewarding providers. If such measures are based on patient reports, they could be added to the Medicare Current Beneficiary Survey (MCBS) or the Consumer Assessment of Healthcare Providers and System (CAHPS) survey.
Budget effects
No cost estimate is available for this option.
Discussion
Use of such measures of patient engagement could enable Accountable Care Organizations, medical homes, hospitals, and clinics to better target their efforts to support their patients’ participation in their care. Such data also could be used in comparative quality reports, reinforcing the notion that patient engagement is a priority and providing information to patients. However, developing and testing robust measures would take time and resources. Additional time would be needed to in-corporate them into public reports and to choose and implement specific measures as the basis for plan payment adjustment. Additional questions on surveys also would increase the burden for respondents, and would need to go through review and endorsement by the National Quality Forum.
OPTION 3.13
Promote greater involvement of Quality Improvement Organizations (QIOs) in patient engagement strategies
The patient engagement metrics described above also could become a focal point in the Scope of Work (SOW) of the Medicare Quality Improvement Organizations (QIOs). Medicare contracts with QIOs in each State and outlines its expectations through the SOW every three years. Attention to patient engagement could be incorporated for a series of SOWs. This option would promote greater involvement of QIOs with providers to increase opportunities and reduce barriers to patient engagement within traditional Medicare, using improvements in these patient engagement measures as QIO outcomes. Within Medicare Advantage, Medicare could require that implementation of patient engagement strategies become part of the QIO Medicare Advantage audit..
Budget effects
No cost estimate is available for this option.
Discussion
There is potential for this work to be linked to support of cost reduction efforts, such as reducing rehospitalization rates, by, for example, using emerging discharge planning strategies built on patient engagement foundations.4 However, QIO staff would need time to learn about engagement and how to help providers achieve it. Many QIOs have little experience working with patients and family members. They would need to either train their own staff in this area (which could be facilitated across QIOs by CMS through appropriate contractors) or acquire new staff who bring such experience. Either could be challenging and some would argue would shift the focus of QIOs from other priorities, such as reducing medical errors.
Approaches and Incentives for Patients
OPTION 3.14
Increase the use of comparative information within Medicare by improving the quality and promotion of public reports
Medicare has made large investments in developing measures of and public reports on health care performance and sharing the results with the public through its “Compare” websites. There is little evidence that many beneficiaries know about and use this information to choose plans or providers, however. While efforts are underway to improve performance reporting, standards for performance reporting could be developed by an independent expert group of report designers, sponsors, researchers, and users, and more vigorous action to promote their existence and location to ensure that they are responsive to audience needs could help.
This option would require Medicare to provide beneficiaries with more meaningful comparative quality and cost information using available and emerging evidence on the measures, language, and displays people find easiest to understand and use, and set standards that performance reports must meet. Within Medicare Advantage, plans could be required to provide members with detailed comparative quality information on clinicians and facilities in their network and provide accurate comparative out-of-pocket cost and quality information to their members for a range of services.
Budget effects
No cost estimate is available for this option.
Discussion
The availability of appropriate cost information could be especially supportive of patient engagement that leads to lower costs. Research indicates that most people believe more care and more expensive care equates to higher quality care. An emerging direction in public reporting is to combine presentation of quality and cost information (Hibbard et al. 2012). When cost and quality data are combined and the results framed appropriately, people feel more comfortable choosing less expensive treatments and providers. This approach could therefore help produce savings within Medicare. Improvements in the availability, dissemination, and content of such reports could help steer people on Medicare to higher-quality and higher-value health care. Public reports also could get the attention of plans and hospitals even when they do not shift market share and could lead organizations to improve their performance to maintain their reputation (Hibbard, Stockard, and Tusler 2005).
There are costs associated with public reporting, however, not only to the Medicare program but to all those whose performance is assessed. Making major changes to the “Compare” websites’ underlying platforms also could be difficult and time-consuming. There is no certainty that public reporting of comparative performance, even if done well with a focus on value, would result in reduced costs. And to date, those entities that design such reports have not found effective ways to encourage widespread consumer use. This may be a particular concern for the Medicare population, given the relatively high rate of cognitive impairment among people with Medicare—people for whom finding, understanding, and using comparative information could prove difficult. Moreover, research suggests that even when Medicare consumers have comparative information available to them—such as the Medicare Plan Finder website—they do not always make use of that information in steering themselves to the lowest-cost option (Abaluck and Gruber 2011; Zhou and Zhang 2012).
OPTION 3.15
Implement more effective and sustained education of the Medicare population about various aspects of the program, including coverage options, using multiple media
CMS currently engages in a particular form of regular education of people with Medicare with respect to their benefits and coverage options: home delivery by mail of the annual Medicare & You handbook to all households where at least one person with Medicare resides. Over time, however, Medicare has grown much more complicated; people with Medicare now are confronted with more choices than ever before. In the face of a wide array of complex choices, some people are just as likely to either fail to decide or make a decision seemingly at odds with their preferences and self-interest (Zhou and Zhang 2012). Such complexity is a barrier to engagement (Consumers Union 2012). It presents challenges to even the most sophisticated, well-educated users of Medicare and is an even greater challenge to those who are ill, who experience changes in vision and hearing, who have low literacy and numeracy skills, or who are alone.
To address this issue, one option would be to implement more effective and sustained education of the Medicare population about their coverage options, using multiple media chosen on the basis of rigorous audience segmentation and testing, rather than focusing solely or largely on continued use of the Medicare & You handbook.
Budget effects
No cost estimate is available for this option.
Discussion
his option could lower beneficiary costs by helping people choose providers and plans that reduce their out-of-pocket costs and increase their financial security without spending more on non-Medicare premiums than they need to. This could be more likely to happen if it becomes easier for people to understand the financial consequences of their health care coverage choices and if public reports include meaningful comparative measures of price (to the beneficiary) in relation to quality. Simplification of Medicare’s benefit design and Medicare’s available coverage options also could help (see Section Four, Benefit Redesign), as could the use of tested presentations that hide complexity and highlight concrete consequences of plan choice on out-of-pocket expenses, which people on Medicare find easy to understand (Sofaer, Kenney, and Davidson 1992). At the same time, it is important to recognize the value of choice, at least in principle, in supporting innovation and the ability of people to find a coverage option that is best suited to their needs.
Marketing and public education efforts of this kind could be expensive. The messages also would need to focus on behaviors most likely to generate savings, or the effort could merely add to rather than reduce costs. Rigorous evaluation would be useful to ensure Medicare gets a return on such investments.
OPTION 3.16
Create a Federal-level Medicare patient and family council; require all hospitals, rehabilitation facilities, hospice agencies, home health agencies, Accountable Care Organizations, medical homes, and Medicare Advantage plans to create such councils
One way to ensure that Medicare and the facilities that participate in the program reduce barriers to patient engagement and facilitate patient and family participation in their care is to include them in planning, oversight, and governance. There are now requirements for resident and family councils in nursing homes and dialysis centers; QIOs and End Stage Renal Disease Network Organizations also are required to have patient and family councils (CMS 2005). Medicare could add (perhaps using the Conditions of Participation, where applicable) a requirement that all hospitals, rehabilitation facilities, hospice agencies, home health agencies, Accountable Care Organizations, medical homes, and Medicare Advantage plans have patient and family councils that are given significant influence over organizational decisions, especially with respect to creating and sustaining opportunities for meaningful engagement. To model this behavior, HHS could create a Federal-level Medicare Patient and Family Council that is composed of people who actively use the Medicare benefit, including seniors, people with disabilities, and family caregivers.
Budget effects
No cost estimate is available for this option.
Discussion
There is considerable knowledge and experience available to guide such an effort. For example, the Institute for Patient and Family Centered Care provides training, technical assistance, and tools to hospitals and others going in this direction.5 However, experience also shows that when poorly done, family councils can do more harm than good. Key elements include: picking actual patients and family members; assigning experienced staff who are accountable to the councils as well as the parent organization; providing lay participants with strong initial and refresher training on topics they will be addressing; and having a written mandate that clearly specifies the group’s roles, responsibilities, and terms of office for individuals.
References
Click to expand/collapse
Jason T. Abaluck and Jonathan Gruber. 2011. “Choice Inconsistencies Among the Elderly: Evidence from Plan Choice in the Medicare Part D Program,” American Economic Review, June 2011.
Joseph Antos. 2012. Medicare Makeover: Five Responsible Reforms to Make Medicare Healthy, American Enterprise Institute, December 17, 2012.
David Arterburn et al. 2012. “Introducing Decision Aids at Group Health was Linked to Sharply Lower Hip and Knee Surgery Rates and Costs,” Health Affairs, September 2012.
Christine Cassel and James Guest. 2012. “Choosing Wisely: Helping Physicians and Patients Make Smart Decisions about their Care,” Journal of the American Medical Association, May 2, 2012.
Catalyst for Payment Reform. 2012. Price Transparency: An Essential Building Block for a High-Value, Sustainable Health Care System, November 1, 2012.
Centers for Medicare & Medicaid Services (CMS). 2005. Statement of Work (SOW) for End Stage Renal Disease Network Organizations, Section C, 2005.
Consumers Union. 2012. What’s Behind the Door: Consumers’ Difficulties Selecting Health Plans, Consumers Union Health Policy Brief, January 2012.
Dominick Frosch et al. 2012. “Authoritarian Physicians and Patients’ Fear of Being Labeled ‘Difficult’ Among Key Obstacles to Shared Decision Making” Health Affairs, May 2012.
Jessie Gruman et al. 2010. “From Patient Education to Patient Engagement: Implications for the Field of Patient Education,“ Patient Education and Counseling, March 2010.
Judith Hibbard and Peter Cunningham. 2008. How Engaged are Consumers in their Health and Health Care, and Why Does it Matter? Center for Studying Health System Change, October 2008.
Judith Hibbard, Jean Stockard, and Martin Tusler. 2005. “Hospital Performance Reports: Impact on Quality, Market Share and Reputation,” Health Affairs, July 2005.
Judith Hibbard et al. 2012. “An Experiment Shows that a Well-Designed Report on Costs and Quality Can Help Consumers Choose High Value Health Care,” Health Affairs, March 2012.
Informed Medical Decisions Foundation. 2010. Summary of Section 3506 of the Affordable Care Act.
Barbara L. Kass-Bartelmes and Ronda Hughes. 2003. Advance Care Planning: Preferences for Care at the End of Life, Agency for Healthcare Research and Quality (AHRQ), Research in Action, Issue 12, March 2003.
Emily Oshima Lee and Ezeziel J. Emanuel. 2013. “Shared Decision Making to Improve Care and Reduce Costs,” New England Journal of Medicine, January 3, 2013.
Wendy Levinson, Cara Lesser, and Ronald Epstein. 2010. “Developing Physician Communication Skills for Patient-Centered Care,” Health Affairs, July 2010.
Robert Miller. 2012. “Satisfying Patient-Consumer Principles for Health Information Exchange: Evidence from California Case Studies,” Health Affairs, March 2012.
Barry Schwartz. 2005. The Paradox of Choice: Why More is Less, Harper Perennial, January 18, 2005.
Anna Sinaiko and Meredith Rosenthal. 2010. “Consumer Experience with a Tiered Physician Network: Early Evidence,” American Journal of Managed Care, 2010.
Shoshanna Sofaer, Erin Kenney, and Bruce Davidson. 1992. “The Impact of the Illness Episode Approach on Medicare Beneficiaries’ Health Insurance Decisions,” Health Services Research, December 1992.
Sunyna Williams and Amy Heller. 2007. “Patient Activation among Medicare Beneficiaries: Segmentation to Promote Informed Decision Making,” International Journal of Pharmaceutical and Healthcare Marketing, 2007.
Chao Zhou and Yuting Zhang. 2012. “The Vast Majority of Medicare Part D Beneficiaries Still Don’t Choose the Cheapest Plans That Meet Their Medication Needs,” Health Affairs, October 2012.
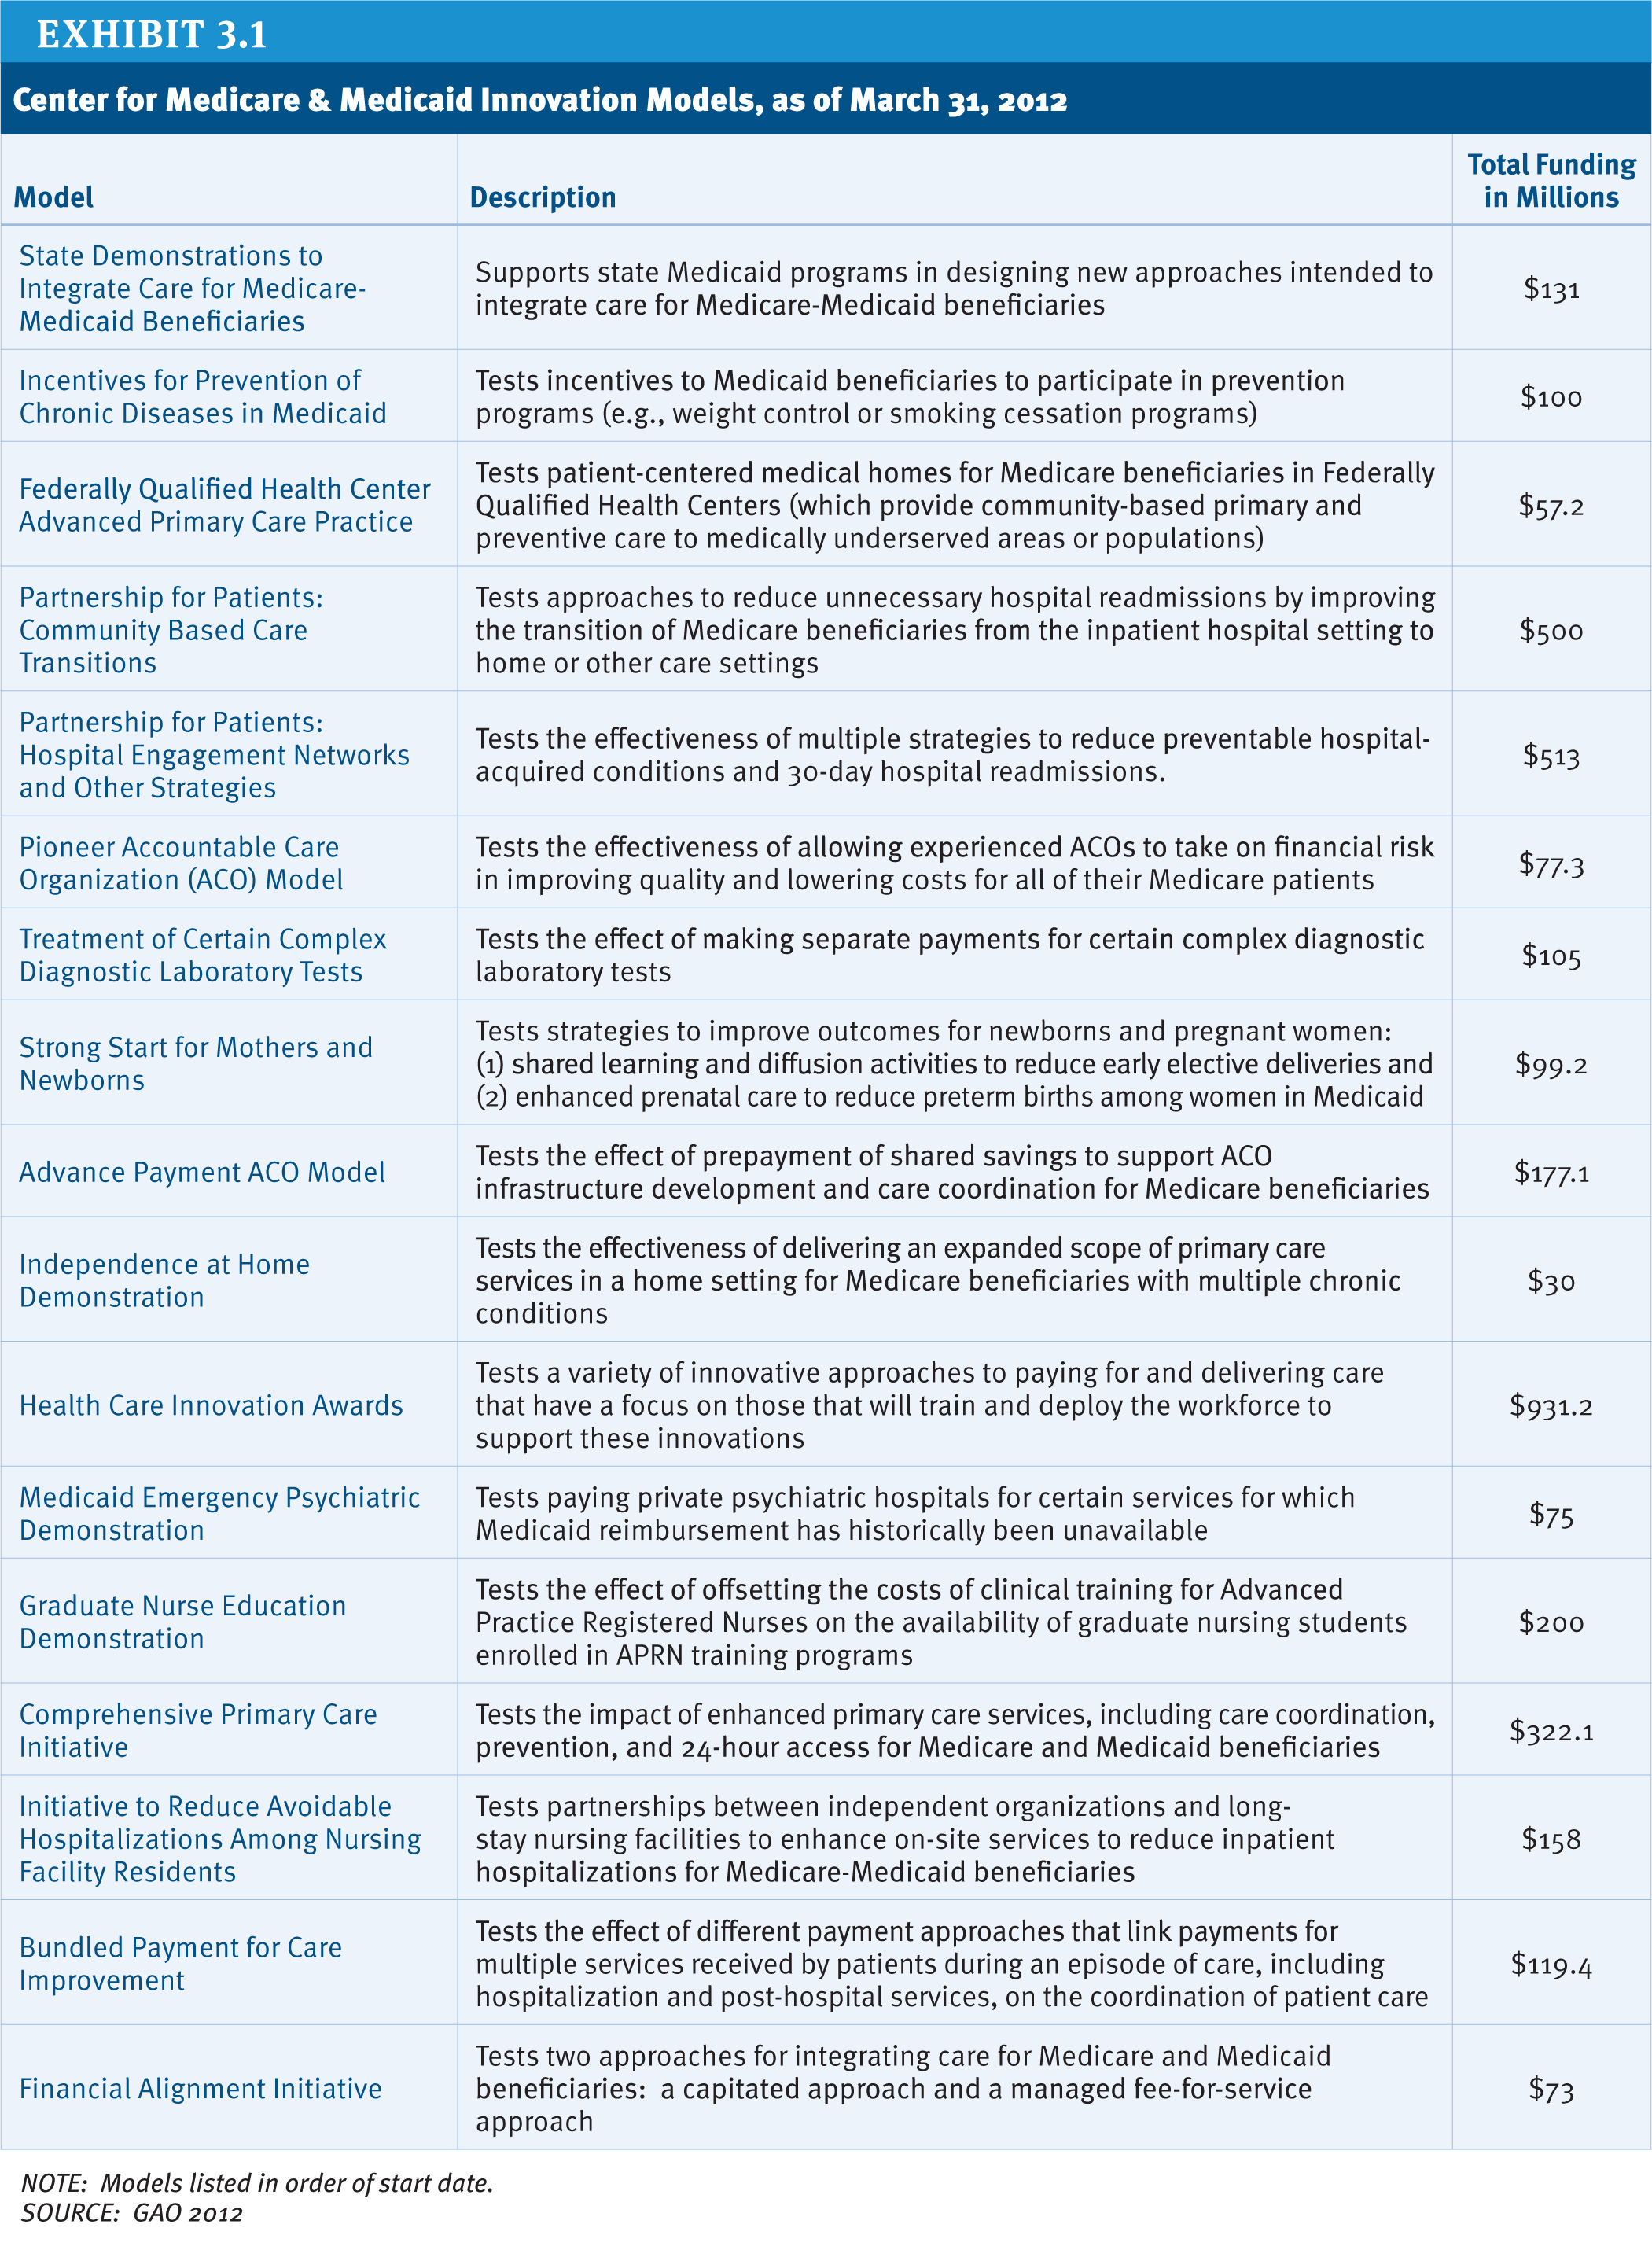
Exhibit 3.1: Center for Medicare & Medicaid Innovation Models, as of March 31, 2012
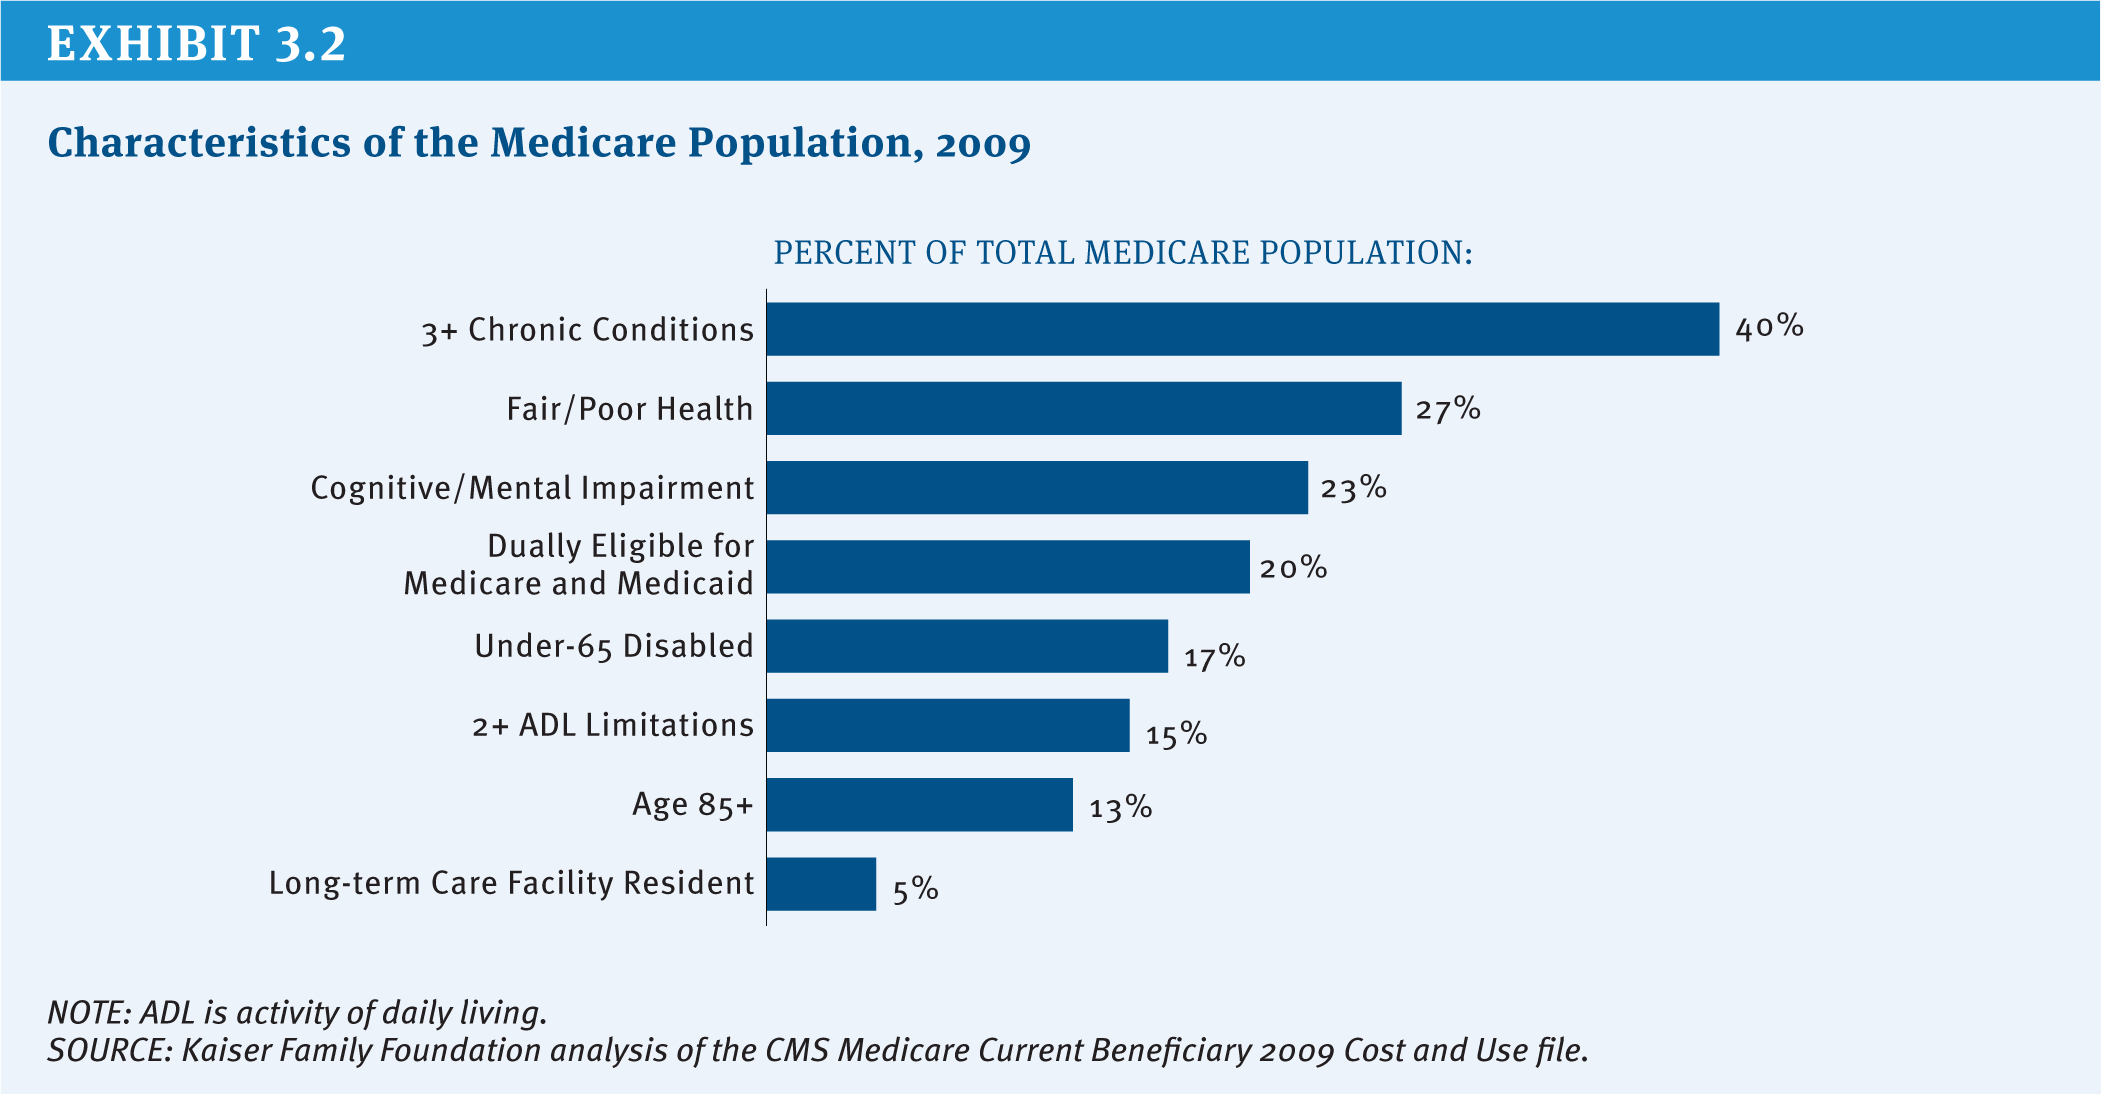
Exhibit 3.2: Characteristics of the Medicare Population, 2009
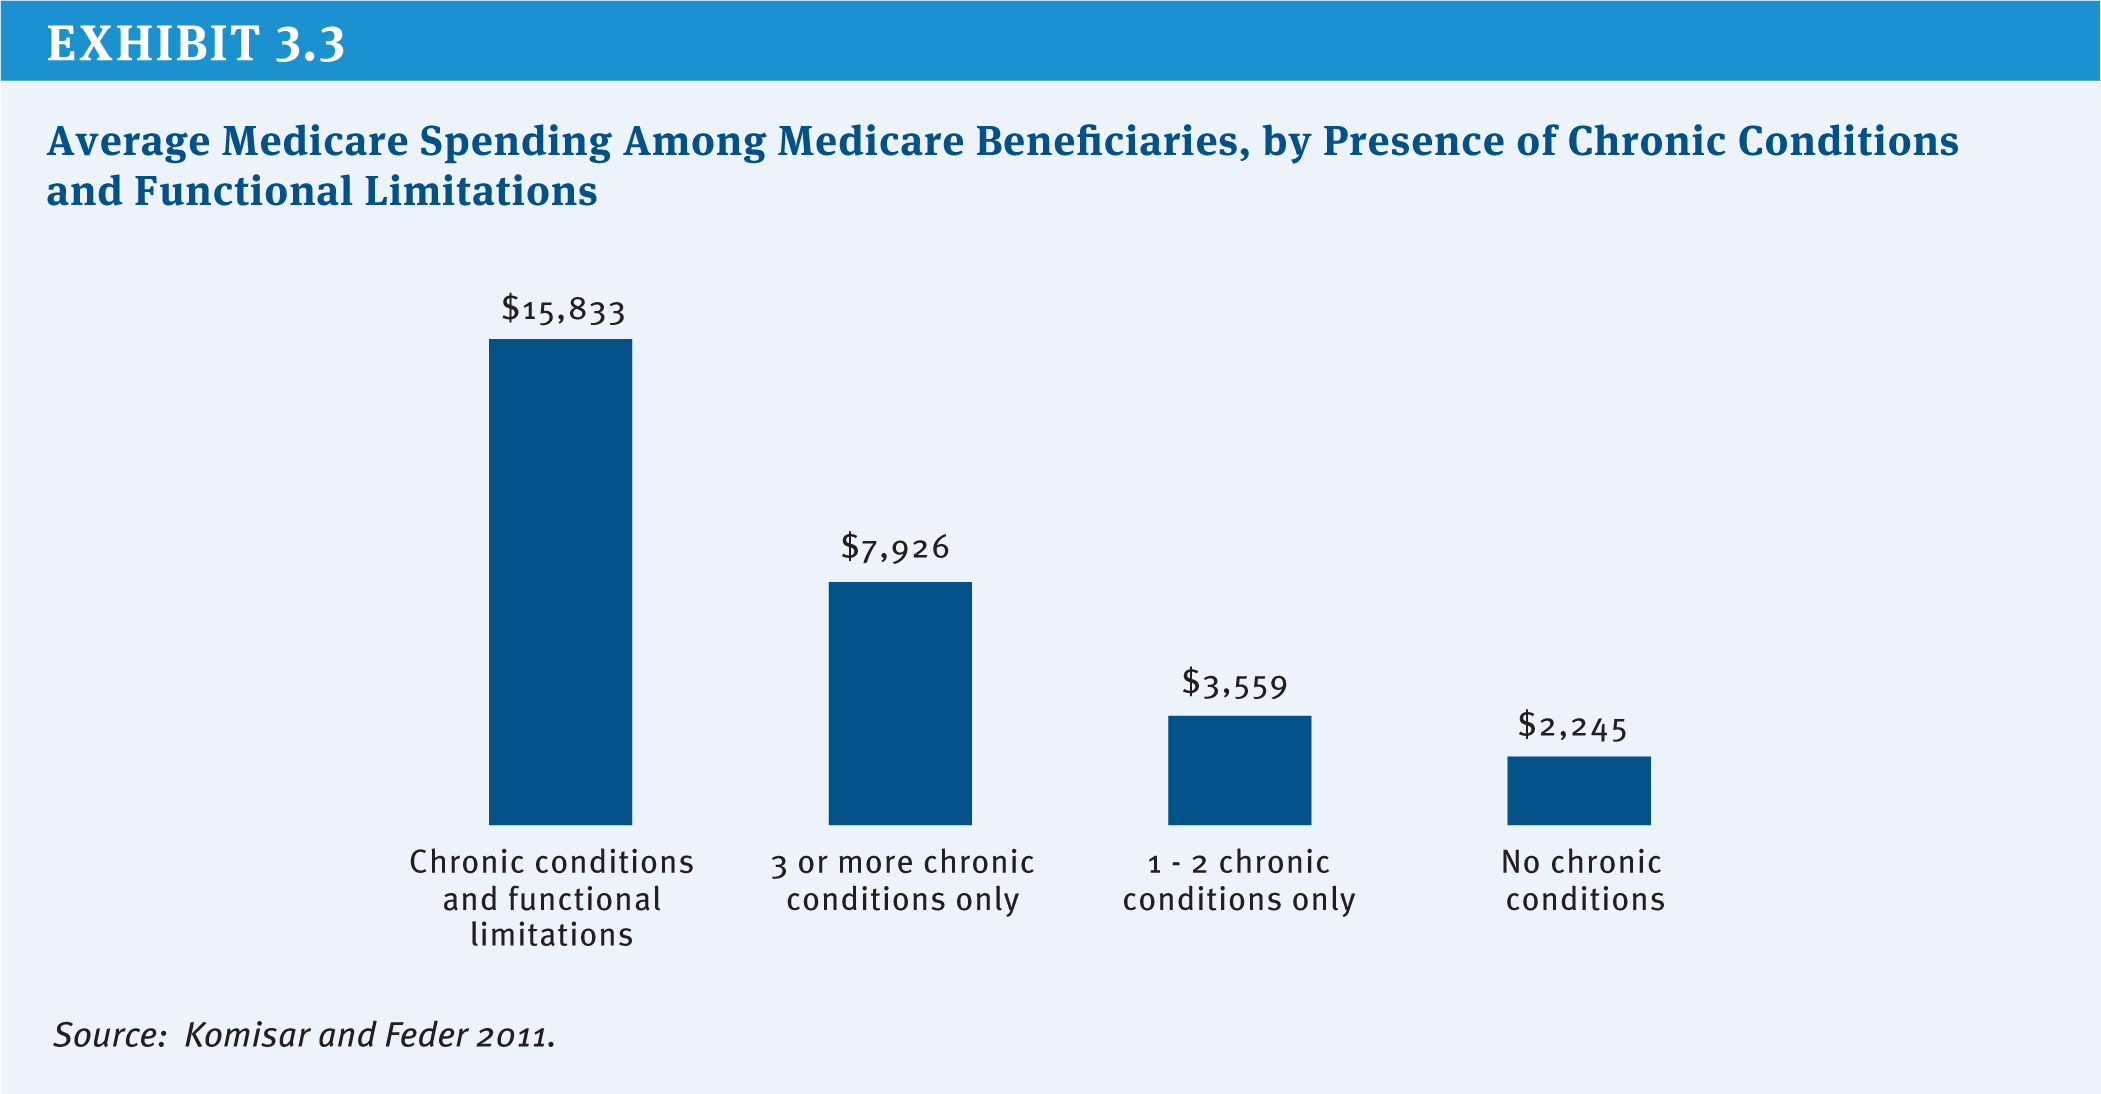
Exhibit 3.3: Average Medicare Spending Among Medicare Beneficiaries, by Presence of Chronic Conditions and Functional Limitations
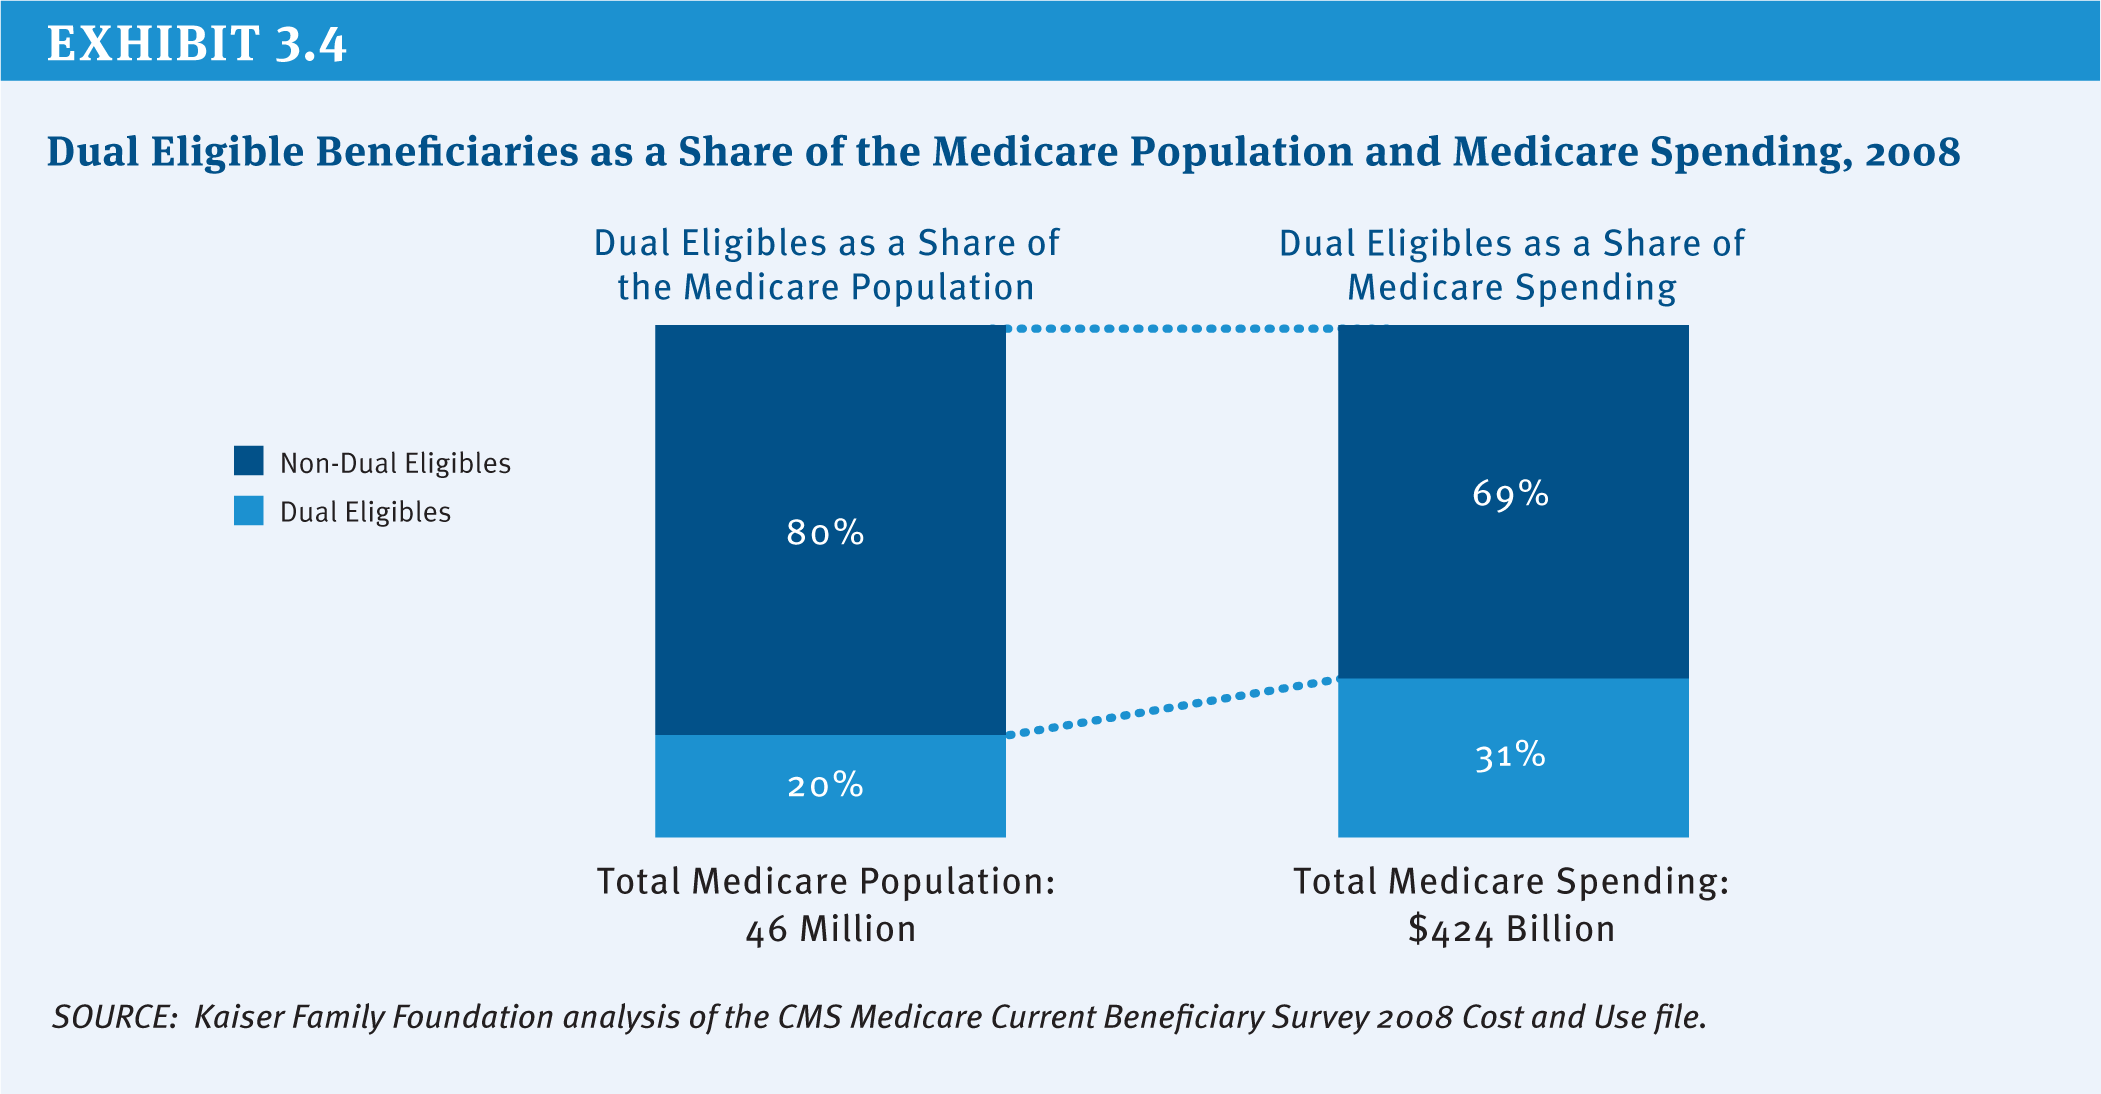
Exhibit 3.4: Dual Eligible Beneficiaries as a Share of the Medicare Population and Medicare Spending, 2008
Section 4: Medicare Program Structure
Benefit Redesign
Options Reviewed
This section discusses two policy options for redesigning Medicare’s benefit package:
» Restructure Medicare’s traditional benefit design with a unified deductible, modified cost sharing, and a limit on out-of-pocket spending, possibly in conjunction with policies to discourage or restrict supplemental coverage
» Provide a new government-administered plan with a comprehensive benefit package, as an alternative to traditional Medicare and Medicare Advantage
Medicare’s benefits were designed by Congress through a series of statutes beginning with the original 1965 law. Under current law, traditional Medicare covers services under three separate parts: Part A (hospital and other inpatient services), Part B (physician, preventive, and other outpatient services), and Part D (prescription drug coverage provided by private plans).1 Traditional Medicare has separate cost-sharing requirements that vary by the type of service, and there is no limit on annual or lifetime out-of-pocket spending (Exhibit 4.1).2 The traditional Medicare program provides less generous coverage on average than typical large employer health plans—including the most common plan offered under the Federal Employees Health Benefits Program (FEHBP)—largely due to Medicare’s relatively high Part A deductible, the lack of a spending limit for Part A and Part B services, and less generous drug coverage (Kaiser Family Foundation 2012a).
Most people with Medicare also have some type of supplemental insurance to help cover Medicare’s cost-sharing requirements. In 2009, nearly a quarter of beneficiaries (24%) purchased a Medigap policy to supplement traditional Medicare and more than one-third (35%) had an employer-sponsored supplemental plan (these numbers include the 5 percent of beneficiaries who have both).3 Currently, insurers can offer 10 types of Medigap policies, the most common of which (Plans C and F) cover most of Medicare’s cost-sharing obligations. The typical employer-sponsored supplemental plan requires enrollees to pay some degree of deductible and cost sharing. Additionally, some low-income beneficiaries are enrolled in Medicaid and receive help paying Medicare’s premiums and/or cost-sharing requirements.
Medicare’s traditional benefit design could be restructured in ways that could achieve savings, modernize and simplify the benefit design, and provide a new limit on beneficiaries’ out-of-pocket spending. Proposals to restructure Medicare’s benefit design would simplify the program’s cost-sharing requirements, provide greater protection against very high out-of-pocket spending, and reduce the need for supplemental insurance. For example, one proposal would combine the Part A and Part B deductibles, establish a uniform coinsurance rate for most Medicare-covered services, and create an out-of-pocket spending limit. Some, but not all, of the proposals to restructure Medicare’s benefit design also seek to reduce Federal spending. Achieving savings without increasing cost sharing for the average beneficiary may be difficult without incorporating other reforms.
Policy Options
OPTION 4.1
Restructure Medicare’s benefit design with a unified deductible, modified cost sharing, and a limit on out-of-pocket spending, possibly in conjunction with policies to discourage or restrict supplemental coverage
There are many ways in which Medicare’s cost sharing could be modified; this section discusses three approaches:
» Option 4.1a: Establish a combined deductible, uniform coinsurance rate, and a limit on out-of-pocket spending.
» Option 4.1b: Establish a combined deductible, uniform coinsurance rate, and a limit on out-of-pocket spending, along with Medigap reforms.
» Option 4.1c: Establish a combined deductible, varying copayments, and a limit on out-of-pocket spending in a way that will not change aggregate beneficiary liabilities, along with a surcharge on supplemental plans.
These options would produce Federal savings directly by shifting costs to beneficiaries and third-party payers and indirectly by creating financial incentives to reduce utilization of services. Although not discussed here, benefit-restructuring proposals could be modified (e.g., with lower combined deductibles or reduced coinsurance requirements for certain services) to minimize costs for beneficiaries. Doing so would likely mean lower Federal savings. Similarly, some or all of the savings could be used to provide additional premium and cost-sharing assistance to low-income or otherwise vulnerable beneficiaries. The new benefit design could also include an income-related out-of-pocket spending limit, with greater protections for lower-income beneficiaries, although implementing this option (e.g., identifying beneficiaries’ incomes) could be administratively complex.
A restructured benefit design also could be implemented in conjunction with other reforms that are intended to modernize the benefits provided by the program (see Section Five, Coverage Policy). For instance, such a policy might include preferred provider networks with tiered cost sharing to encourage beneficiaries to seek higher-value providers, requirements that beneficiaries pay more for certain services with less-costly but functionally-equivalent alternatives, or other reforms. To the extent that these reforms produce efficiencies, savings could be increased or beneficiary cost-sharing obligations could be reduced.
OPTION 4.1A
Establish a combined deductible, uniform coinsurance rate, and a limit on out-of-pocket spending
In a 2011 report, the Congressional Budget Office (CBO) evaluated a restructured benefit design that would include the following:
A $550 combined deductible for Part A and Part B services. This is higher than the current Part B deductible ($147 in 2013) but lower than the current Part A deductible ($1,184 per benefit period in 2013).
A uniform 20 percent coinsurance rate. Beneficiaries are required to pay a 20 percent coinsurance for most Part B services. This option would replace copayments for inpatient and skilled nursing facility (SNF) stays, and introduce new cost sharing for clinical lab services, home health services, the first 60 days of a hospital stay, and the first 20 days of a SNF stay.4
A new annual out-of-pocket spending limit of $5,500, after which Medicare would cover all of a beneficiary’s annual medical expenses.
The National Commission on Fiscal Responsibility and Reform (the Simpson-Bowles commission) recommended a similar approach. None of the proposals put forward to date have included Part D in the restructured benefit design.
Budget effects
CBO estimated that if this option were implemented in 2013, savings would be $32 billion over 10 years (2012–2021) (CBO 2011).
Discussion
This option would achieve Federal savings and increase aggregate spending for beneficiaries and third-party payers. Some beneficiaries would have lower costs (e.g., beneficiaries with very high costs who would benefit from the limit on out-of-pocket spending), but most people with Medicare would pay more (Exhibit 4.2). Out-of-pocket costs would increase for those beneficiaries who use fewer services, primarily because of the higher deductible for those who only use Part B services.
The impact of these benefit design changes also would be affected by beneficiaries’ supplemental coverage (Medigap, retiree coverage, Medicaid, or none). Beneficiaries with supplemental coverage could be insulated from higher cost-sharing requirements if their plans covered all or some of the new costs, but would likely face higher premiums if Medigap insurers and employers raised premiums in response to higher costs covered by their plans. Beneficiaries without supplemental coverage—roughly 4.1 million beneficiaries in 2013—would be exposed to large changes in out-of-pocket spending, with about two-fifths (42 percent) spending at least $250 more in 2013 (Kaiser Family Foundation 2011c).
This option likely would reduce the demand for care by making some beneficiaries responsible for a greater share of their health expenses. However, studies have shown that people forgo both unnecessary and necessary care in response to higher cost sharing. Beneficiaries who forgo needed care may require new services—such as hospitalizations—over the long term (Swartz 2010).
OPTION 4.1B
Establish a combined deductible, uniform coinsurance rate, and a limit on out-of-pocket spending, along with Medigap reforms
Some have proposed combining a restructured benefit design with policies to restrict or place a surcharge on supplemental coverage in order to achieve greater Medicare savings. CBO has evaluated a policy that combines (1) a new benefit design with a $550 combined deductible, a uniform 20 percent coinsurance, and a $5,500 spending limit (as in Option 4.1a above) with (2) Medigap coverage restrictions that eliminate Medigap coverage of the first $550 and limit coverage to 50 percent of the next $4,950 (see Section One, Beneficiary Cost Sharing). The Simpson-Bowles commission included a similar combination of changes in its recommendations (National Commission on Fiscal Responsibility and Reform 2010).5
Budget effects
CBO estimated that combining the restructured benefit design with restrictions on first-dollar Medigap coverage as described would save $93 billion over 10 years (2012–2021), if implemented in 2013 (CBO 2011). Greater savings are expected under this option relative to Option 4.1a as a result of expected reductions in utilization when beneficiaries with Medigap are faced with higher out-of-pocket cost sharing.
Discussion
As discussed under Option 4.1a, a restructured benefit design by itself would likely reduce out-of-pocket spending for a group of beneficiaries who otherwise would incur relatively high out-of-pocket costs in the absence of a limit on out-of-pocket spending, while increasing spending for a larger number of beneficiaries who use relatively few services. Adding restrictions on Medigap policies likely would decrease Medigap premiums (because plans would cover fewer expenses) and Part B premiums (due to the expectation that beneficiaries would use less care when facing cost-sharing requirements directly). As a result, about half of all beneficiaries would be expected to pay more under this combined option, compared with 71 percent paying more under Option 4.1a (Kaiser Family Foundation 2011c) (Exhibit 4.3).
However, restricting Medigap coverage also would require enrollees to pay a greater share of their medical expenses on their own. For some enrollees with high levels of utilization, including a relatively large share of those with one or more hospitalizations, the higher cost-sharing obligations would more than offset any reductions in premiums. The prohibition of first-dollar Medigap coverage also would expose enrollees to more uncertainty about their future medical expenses, which could be a drawback for all policyholders, even those who would save money in the short-term.
There is some debate about supplemental plans’ impact on beneficiaries’ use of care and, in turn, on Medicare expenses (MedPAC 2012). If having Medigap coverage has a smaller impact on utilization than some assume, savings to Medicare from Medigap restrictions could be smaller than projected.
OPTION 4.1C
Establish a combined deductible, varying copayments, and a limit on out-of-pocket spending in a way that will not change aggregate beneficiary liabilities, along with a surcharge on supplemental plans
The Medicare Payment Advisory Commission (MedPAC) has recommended that Congress develop a new Medicare benefit design with an annual limit on out-of-pocket spending that differs in several ways from the options described above (MedPAC 2012). MedPAC suggested that the new benefit design should not affect aggregate beneficiary cost-sharing liability, whereas Options 4.1a and 4.1b do not have this restriction. MedPAC also recommended establishing copayments that vary by the type of service or provider, rather than a uniform coinsurance rate, noting that copayments are easier for beneficiaries to understand. Instead of restricting Medigap coverage, MedPAC recommended placing a surcharge on all supplemental plans, including employer-sponsored retiree plans. Finally, MedPAC was open to either a combined or separate Part A and Part B deductible.
As an example, MedPAC evaluated a benefit design that would include: a $5,000 out-of-pocket spending limit, a $500 combined Part A and Part B deductible, and copayments for inpatient hospital stays ($750 per admission), skilled nursing facility stays ($80 per day), home health care ($150 per episode), primary care ($20 per visit), specialty care ($40 per visit), and other cost-sharing requirements varying by service type. The illustrative design also included a 20 percent surcharge on supplemental plan premiums, which would apply to both Medigap and retiree health plan premiums.
Budget effects
MedPAC estimated that this illustrative benefit design would have reduced 2009 Medicare spending by 0.5 percent (approximately $2.5 billion, based on 2009 total outlays) if supplemental plan enrollees maintained their coverage despite the 20 percent surcharge (MedPAC 2012).6 MedPAC estimated greater Medicare savings if some or all supplemental plan enrollees dropped their coverage in response to the surcharge.
Discussion
According to MedPAC, more beneficiaries would see their out-of-pocket spending increase by at least $250 than would see their spending decrease by that amount under the new benefit design (separate from the supplemental surcharge), although most beneficiaries would see changes in spending of less than $250. Beneficiaries who use few Part B services, who are not hospitalized during the year, and who have supplemental coverage would be more likely than others to see annual out-of-pocket spending increases of $250 or more. People with Medicare who have higher than average health care expenses and do not have supplemental coverage would be more likely than others to see annual out-of-pocket savings of at least $250.
The impact of adding a supplemental plan premium surcharge would depend on the number of people who drop their supplemental coverage in response to the new surcharge. If all beneficiaries with employer/Medigap coverage elected to pay the surcharge and maintain their coverage, Medicare would achieve savings from the surcharge while enrollees incurred higher costs. If everyone dropped their coverage, enrollees would be required to pay more cost sharing out of their own pockets but would also no longer need to pay plan premiums. Taken together, this would tend to reduce spending for supplemental plan enrollees who have low levels of utilization in a given year (because reductions in premiums would more than offset any increase in cost sharing), but could increase spending for supplemental plan enrollees who use many services (because new out-of-pocket costs could outweigh the premium reductions). Under both scenarios, net Part B expenses would likely decline (either due to income from the surcharge or expected reductions in care if beneficiaries drop supplemental coverage and pay cost sharing on their own), and Part B premiums would decrease for all beneficiaries as a result.
There is some debate as to whether the supplemental plan surcharge should apply to employer-sponsored plans. Some support doing so in order for the surcharge to apply to all supplemental policies rather than Medigap policies only. Also, employer coverage tends to be more common among beneficiaries with comparatively higher incomes who more likely could afford the surcharge. Others argue that retiree plans should be excluded, given that employees may have sacrificed additional earnings during their working years in exchange for retiree benefits, and because the typical retiree plan does not have first-dollar coverage. Some might prefer to restrict the surcharge on Medigap policies to Plans C and F, but exempt other policy types that do not offer first-dollar coverage (see Section One, Beneficiary Cost Sharing).
OPTION 4.2
Provide a new government-administered plan with a comprehensive benefit package, as an alternative to traditional Medicare and Medicare Advantage
In 2005, several experts proposed a new, alternative Medicare option that would include a more comprehensive benefit package as a way of improving the benefit design for beneficiaries and potentially achieving program savings (Davis et al. 2005). It would merge Part A and Part B coverage into a single benefit package along with Part D drug coverage. This approach would provide coverage on top of the standard package, which could mitigate the need for supplemental insurance. For instance, the comprehensive package might have lower deductibles and cost sharing and could include an annual limit on beneficiary out-of-pocket liabilities for covered inpatient and outpatient services. Enrollees would cover the cost of any new benefits through an additional monthly premium, although lower-income enrollees could receive government assistance for coverage under this option.
A more recent version of this approach also would incorporate incentives for beneficiaries to seek care from “high-value” providers and care systems, in addition to the reforms discussed above (Commonwealth Fund 2013). For example, the more recent plan would lower cost-sharing requirements for enrollees who register with a primary care practice or medical home, and (eventually) for enrollees who obtain care from accountable care networks (such as accountable care organizations, or ACOs). Alternatively, the plan could encourage beneficiaries to seek higher-value providers by establishing a preferred provider network with tiered cost-sharing requirements. The plan also could incorporate coverage and payment innovations intended to improve the value of care, such as by adopting “least costly alternative” approaches or relying on new value-based payment systems, among other changes (see Section Four, Delivery System Reform and Section Five, Coverage Policy). As proposed by The Commonwealth Fund, new Medicare beneficiaries automatically would be enrolled in the new plan, unless they opt for traditional Medicare or Medicare Advantage. As in the earlier version of this option, beneficiaries who enroll in this new plan would pay a premium set at a level that would offset any changes in Federal spending associated with the new plan. Finally, the more recent version of this option also includes Medigap restrictions, by which Medigap policies are prohibited from covering the first $250 of beneficiary cost-sharing requirements and are required to maintain copayments for physician ($20) and emergency room ($50) visits.7
Budget effects
No cost estimate is available for this option. This option is designed to be budget neutral for the Federal government by requiring enrollees to cover any new costs through the premium.
Discussion
This option would offer comprehensive coverage through a single Medicare plan, which could be simpler for beneficiaries than receiving care through some combination of traditional Medicare (Part A and Part B), Part D, and a supplemental plan. Combining multiple programs into one could also make it easier for Medicare to implement care coordination innovations and would reduce the cost of coordinating between coverage types. Such an approach might be a less expensive choice for beneficiaries than Medigap for obtaining supplemental coverage, since the government-administered plan would be expected to have lower administrative expenses and could include reforms intended to encourage higher-value care. Beneficiaries also could see savings on prescription drugs if Medicare were able to leverage lower prescription drug prices than are currently obtained by private Part D plans.
By allowing beneficiaries to purchase a comprehensive and expanded benefit package, this approach could enable traditional Medicare to better compete with private Medicare Advantage plans, given that Medicare Advantage plans today typically provide benefits covered under Parts A, B, and D in a single plan, have a limit on out-of-pocket spending, and often provide extra benefits and care management. This approach also would allow Medicare to introduce coverage, payment, and cost-sharing reforms in a more limited way before applying them to all of traditional Medicare (if at all).
The appeal of this type of government-administered plan to beneficiaries would depend in part on the cost of the expanded coverage compared with the cost and generosity of existing coverage options. This new plan could reduce demand for supplemental coverage; however, it also could attract a disproportionate share of sicker and more expensive enrollees. If so, premiums would be expected to rise and enrollment to decline, which could diminish the prospect of Medicare savings and threaten the plan’s stability over the longer term. This plan also could have difficulty building enrollment if beneficiaries with other forms of supplemental coverage were unwilling to reconsider their plan choices. Automatic enrollment of new beneficiaries (with the ability to opt-out) could, to some extent, address these concerns about enrollment and selection, as could new restrictions on Medigap coverage. Other policy changes also might be needed to ensure the viability of the new program.8
One concern about a new government-administered plan is that adding another coverage option to the existing set of Medicare options could be a source of confusion for beneficiaries.9 Another concern is that, while this option could allow traditional Medicare to better compete with Medicare Advantage plans by offering lower cost-sharing requirements or by including care management, it could also be the case that Medicare would have an “unfair” competitive advantage. For example, a government-administered plan could set lower provider payment rates than many private insurers, could have lower administrative expenses, and could have a marketing advantage. While some might view these factors as explicit benefits of the new plan option, others might view them as tilting the marketplace towards the government-administered plan and away from Medicare Advantage plans. Finally, determining the premium could be an administrative challenge, given that Medigap and Medicare Advantage plan premiums vary geographically and Medigap premiums are often age-rated, while premiums for the traditional Medicare program (both standard and income-related Part B premiums) are uniform nationwide.
References
Click to expand/collapse
Katherine Baicker and Dana Goldman. 2011. “Patient Cost-Sharing and Health Care Spending Growth,” Journal of Economic Perspectives, Spring 2011.
The Commonwealth Fund Commission on a High Performance Health System (Commonwealth Fund). 2013. Confronting Costs: Stabilizing Spending While Moving Toward a High Performance Health Care System, January 2013.
Congressional Budget Office (CBO). 2010. Medicare Baseline, August 25, 2010.
Congressional Budget Office (CBO). 2011. Reducing the Deficit: Spending and Revenue Options, March 2011.
Karen Davis, Marilyn Moon, Barbara Cooper, and Cathy Schoen. 2005. “Medicare Extra: A Comprehensive Benefit Option for Medicare Beneficiaries,” Health Affairs, October 2005.
Kaiser Family Foundation. 2011a. Medigap Reform: Setting the Context, September 2011.
Kaiser Family Foundation. 2011b. Medigap Reforms: Potential Effects of Benefit Restrictions on Medicare Spending and Beneficiary Costs, July 2011.
Kaiser Family Foundation. 2011c. Restructuring Medicare’s Benefit Design: Implications for Beneficiaries and Spending, November 2011.
Kaiser Family Foundation. 2012a. How Does the Benefit Value of Medicare Compare to the Benefit Value of Typical Large Employer Plans: A 2012 Update, April 2012.
Kaiser Family Foundation. 2012b. Medicare Advantage 2013 Spotlight: Plan Availability and Premiums, November 2012.
Kaiser Family Foundation. 2012c. Medicare Part D: A First Look at Part D Plan Offerings in 2013, November 2012.
Medicare Payment Advisory Commission (MedPAC). 2012. Report to the Congress: Medicare and the Health Care Delivery System, June 2012.
National Commission on Fiscal Responsibility and Reform. 2010. The Moment of Truth: Report of the National Commission on Fiscal Responsibility and Reform, December 2010.
Katherine Swartz. 2010. Cost-Sharing: Effects on Spending and Outcomes, Robert Wood Johnson Foundation, December 2010.
Premium Support
Options Reviewed
This section reviews key policy decisions related to premium support proposals and discusses three options for setting Federal contributions:
» Set Federal contributions per beneficiary at the lesser of the second lowest private plan bid in a given area or average spending per capita under traditional Medicare in the area
» Set Federal contributions per beneficiary at the average plan bid in a given area (including traditional Medicare as a plan), weighted by enrollment
» Set Federal base year payments equal to average traditional Medicare per capita costs and limit the growth per person to an economic index, such as the consumer price index (CPI)
One approach to Medicare reform that has garnered a fair amount of attention would transform Medicare from a program that offers a defined set of benefits to one that offers a defined Federal government contribution toward the purchase of health insurance. First proposed for Medicare in the early 1980s, this approach has been proposed in a variety of forms with various labels, including “defined contribution,” “premium support,” “defined support” and “vouchers.” Typically, proposals of this nature provide a fixed Federal payment per enrollee and give beneficiaries the opportunity to choose among plans based on their own preferences for premiums, benefits, and other plan attributes. Proponents say this approach would promote greater competition among insurance plans and produce stronger incentives to reduce Medicare spending. Critics argue it would shift costs to Medicare beneficiaries and erode their entitlement to a defined set of guaranteed benefits.
Background
Under the current Medicare program, beneficiaries legally are entitled to a defined set of benefits and can choose to receive those benefits under traditional Medicare or through a private Medicare Advantage plan. In 2012, 27 percent of Medicare beneficiaries enrolled in a Medicare Advantage plan, with the remaining 73 percent of beneficiaries enrolled in the traditional Medicare program. Traditional Medicare pays providers directly using a variety of payment methods. In contrast, Medicare Advantage plans receive a capitated, per beneficiary amount for providing Part A and Part B benefits, based on benchmark amounts varying by county. The plans in turn pay providers and are not obligated to use traditional Medicare payment methods or levels. If Medicare benchmarks exceed the bids submitted by plans to provide Medicare benefits, plans receive a portion of the difference, which they are required to use to provide additional benefits to enrollees. (For a more complete discussion, see Section Two, Medicare Advantage.)
In recent years, the idea of transforming Medicare into some form of premium support system has received greater attention as part of broader efforts to slow the growth in Medicare spending and reduce the Federal deficit. For example, in 1999, some members of the National Bipartisan Commission on the Future of Medicare advanced a premium support proposal. Ultimately, the Commission was unable to agree on a plan but some members—Senators John Breaux (D-LA) and Bill Frist (R-TN) and Rep. Bill Thomas (R-CA)—introduced a premium support bill in Congress.
More recently, premium support proposals have been put forward by Rep. Paul Ryan (R-WI), Chairman of the House Budget Committee. The Bipartisan Policy Center Debt Reduction Task Force—co-chaired by former Senator Pete Domenici (R-NM) and former U.S. budget director Alice Rivlin—proposed a different model. The National Commission on Fiscal Responsibility and Reform (Simpson-Bowles commission) recommended a target for total Federal health spending, and mentioned premium support as an option to consider if costs grew faster than the target.
Under premium support, rather than being entitled to a defined set of benefits, all beneficiaries would be entitled to a defined contribution that would be used to cover the cost of either a private plan or traditional Medicare. Proponents say that under this system, market competition would constrain Medicare spending by giving plans incentives to restrain costs and giving beneficiaries incentives to choose lower cost plans. Critics say a premium support system would erode current law protections, shifting cost and risk from the Federal government to elderly and disabled beneficiaries. They also question whether a premium support system would achieve savings unless it is paired with strict limits on Federal spending. There also is debate over the extent to which the government can or should regulate private plans in a premium support system, whether competition would result in lower cost plans, and the role of traditional Medicare under a premium support system.
A shift from the current program to a system of premium support would entail a number of policy choices, each of which could have significant implications for the coverage provided to beneficiaries, and for program spending.
Key Policy Issues for Premium Support Proposals
Among the policy issues are:
» Benefits. Premium support proposals vary in the extent to which they specify the required benefits. Some would give broad discretion to plans within fiscal constraints, subject to approval by government. Others would require plans to provide benefits that are at least actuarially equivalent—but not necessarily identical—to benefits currently covered under Parts A and B of Medicare. A third approach would build on the Medicare Advantage model, requiring plans to cover Part A and Part B benefits, with cost-sharing that is actuarially equivalent (with some constraints for specific services). If plans are permitted to provide benefits that are actuarially equivalent to the defined Medicare benefit package, without constraints, there is some concern that plans might impose higher cost sharing or not cover services used mainly by sicker, higher-risk individuals, which could discourage enrollment and raise costs for beneficiaries who use these services.
» Role of traditional Medicare. Some premium support proposals would phase out the traditional Medicare program while others would maintain the traditional program in some manner as one of the plans beneficiaries could consider. The traditional Medicare program could be included in premium support in different ways. For instance, it could be retained it in its current form with a uniform national premium, or it could be administered as a set of local plans throughout the country that would bid to compete with private plans in each area. A traditional Medicare plan could also have independent management to give it greater flexibility to compete with private plans in local markets (Antos et al 2012). In all cases, a key distinction from current policy is that if traditional Medicare is retained as a bidding plan and if the traditional Medicare bid is higher than the bids of private plans, beneficiaries would pay a higher premium to remain in traditional Medicare. Restructuring traditional Medicare into a set of local plans on par with private plans could make it more difficult for traditional Medicare to leverage lower prices and could raise concerns about the explicit lack of uniformity and consistency in the program.
» Caps on the growth in Medicare spending per beneficiary. Some premium support proposals include a strict limit on the growth in payments per beneficiary to ensure constraints on Medicare spending. The extent to which a cap achieves savings will depend on whether it is applied to the growth in aggregate Medicare spending or Medicare spending per beneficiary, the index used to constrain spending growth (e.g., the Consumer Price Index (CPI), gross domestic product (GDP) plus 1%), and the relationship between the target growth rate and the expected growth in Medicare spending. Another question is how a cap on Medicare spending growth would be enforced and the extent to which beneficiary premiums and/or additional assistance for low-income beneficiaries would be affected if the cap were breached. Some have proposed a “softer” cap on spending that would trigger action by Congress or other officials, although it is not clear how such a cap would be enforced or if it would produce scoreable savings. (For a more complete discussion of options to cap Medicare spending, see Section Five, Spending Caps.)
» Subsidies for low-income beneficiaries. Premium support proposals often include additional subsidies for low-income beneficiaries. Key questions include who would be eligible for such assistance; the nature of the assistance they would receive (premiums and/or cost sharing subsidies); the interaction with the Medicaid program for people who are dually eligible for Medicare and Medicaid; and the choice of health plans for low-income beneficiaries. One approach would establish medical savings accounts for low-income beneficiaries, with the government contributing a set amount into a beneficiary’s account that could be used to cover out-of-pocket health expenses, including plan cost-sharing requirements. Another would be to have Medicare or Medicaid cover all premiums or cost sharing for certain services. Strategies for providing additional support to low-income beneficiaries have important implications for Federal spending (Medicare and Medicaid), State expenditures (Medicaid), and low-income beneficiaries’ out-of-pocket spending, plan choices, and access to providers.
» Risk adjustment. Most premium support proposals would “risk adjust” payments to account for beneficiaries’ predicted spending based on their relative health risk, including age, race, diagnoses based on the prior year of medical claims, as well as disabilities, institutional status, and Medicaid status. With perfect risk adjustment, plans would not be penalized for enrolling sicker than average beneficiaries, or financially rewarded for enrolling healthier than average enrollees. While risk adjustment methods are improving, they are not perfect; recent studies demonstrate that Medicare Advantage plans continue to receive favorable selection despite the long-term use of a risk adjuster (Brown et al. 2011; MedPAC 2012). In the absence of a sufficiently robust risk adjustment system, plans, including traditional Medicare, that attract sicker, high-cost beneficiaries could experience an increase in premiums due to adverse selection, and could ultimately become unsustainable.
» Marketplace regulation. The extent to which the marketplace is regulated would have important implications for beneficiaries (for a discussion of options to establish an oversight structure, see Section Five, Governance and Management). Premium support proposals vary in the extent and means by which the marketplace would be regulated. Most premium support proposals would require plans to accept any beneficiary who applied without regard to age or health status, prevent plans from charging higher premiums to sicker beneficiaries, and limit the extent to which premiums could vary by age (if at all). Some envision a more structured oversight authority—like the Centers for Medicare & Medicaid Services (CMS) or the Office of Personnel Management (OPM)—to set requirements for benefits, marketing practices and other consumer protections, while others prefer allowing plans greater flexibility in benefit design, marketing, and other activities.
» Special Medicare payment supports. Medicare’s support for indirect medical education (IME) and graduate medical education (GME), as well as disproportionate share hospitals (DSH) and special adjusters for providers in rural communities is another important consideration for premium support proposals. Under current law, Medicare plays a key role in funding IME, GME and DSH as well as rural provider support and it is not clear how such costs would be financed if Medicare is converted to a premium support system. If these costs are included in the calculation of traditional Medicare spending (as a plan bid), then traditional Medicare would be incurring costs that are not covered by private plans, putting traditional Medicare at a financial disadvantage. If the costs of IME, GME, DSH, and rural supplements are excluded from the costs of traditional Medicare, then it raises the questions of how these costs would be covered and by whom.
Policymakers have also debated the timing of implementation of a premium support proposal. Some have suggested establishing a premium support system that would take effect a decade from now in order to protect people who are currently in the program or will be eligible within that 10-year window. However, if not implemented prior to 2023, this approach would do little to address deficit concerns within the traditional 10-year budget window. An alternative approach is to proceed in the short term with a demonstration project that would have private Medicare Advantage plans competitively bid against each other (traditional Medicare would not submit a bid) to test and improve the model before applying it to the entire Medicare population.
Policy Options
Setting Federal Contributions to Plans Under Premium Support
The methodology for determining the amount paid by the Federal government per Medicare beneficiary is a critical variable for understanding the expected effects on outlays, beneficiaries’ out-of-pocket spending, traditional Medicare, and private health plans. Following are three methodologies that have been discussed in recent policy proposals.
OPTION 4.3
Set Federal contributions per beneficiary at the lesser of the second lowest private plan bid in a given area or average spending per capita under traditional Medicare in the area
Under this approach, plans would bid to compete in local areas, such as counties, as is the case today with Medicare Advantage. Each year, the Federal government would pay plans an amount (known as “the benchmark”) that would be no higher than the second lowest private plan bid in a given area, or average traditional Medicare costs in that area. Beneficiaries who chose a plan with a bid above the Federal contribution would pay a higher premium, and those who chose a plan with a bid below the benchmark would pay less.
Budget effects
No cost estimate is available for this option. Medicare savings would vary based on some of the decisions cited above. A model advanced by Rep. Ryan, for example, would place a limit on Medicare spending equal to the rise of the gross domestic product plus 0.5 percent (GDP+0.5%) beginning after 2023. The Congressional Budget Office (CBO) estimated Rep. Ryan’s proposal would reduce projected growth in Medicare spending from 7 percent of GDP to 4.75 percent of GDP in 2050 and reduce Medicare spending for the average 66-year-old in 2030 from $9,600 a year to $7,400 (in 2011 dollars) (CBO 2012).10
Discussion
The effects of this approach would vary widely across the country, depending on the relationship between traditional Medicare costs and plan bids. In areas where traditional Medicare costs are high relative to plan bids, beneficiaries would pay more for traditional Medicare than they would pay under the current system. In areas where traditional Medicare costs currently are lower than private plan bids, beneficiaries in traditional Medicare would likely not pay higher premiums, but those in private plans would be expected to pay more unless they switched to traditional Medicare. According to a 2012 analysis by the Kaiser Family Foundation, about half of all beneficiaries enrolled in the traditional Medicare program would pay higher Medicare premiums under a fully implemented system, unless they switched to a low-cost plan in their area (Kaiser Family Foundation 2012). If this approach to premium support were to be enacted in conjunction with a cap on Medicare per capita spending, Federal savings could increase as would premiums and/or other out-of-pocket costs.
OPTION 4.4
Set Federal contributions per beneficiary at the average plan bid in a given area (including traditional Medicare as a plan), weighted by enrollment
Under the Federal Employees Health Benefits Program (FEHBP), the Federal government contributes the lesser of 72 percent of the weighted average plan premium, or 75 percent of a plan’s premium. If employees choose a plan that bids below the weighted average bid, they pay a lower premium; if they choose a plan with higher costs, they pay more. Medicare could take a similar approach and have each plan, including traditional Medicare, submit a bid and the Federal contribution would be equal to the average bid in each area, weighted by plan enrollment, with enrollees paying the difference between the plan bid and the contribution.
Budget effects
In 2008, CBO estimated that a premium support system with the Federal contribution set at 100 percent of the average plan bid would reduce Medicare spending by an estimated $161 billion over 2010–2019 (had it been implemented in 2012) (CBO 2008).11 Some have proposed setting the payment at 88 percent (rather than 100 percent) of the average bid in a given area, weighted by enrollment (Heritage 2011). Such an approach would further reduce spending.
Discussion
If Medicare payments per beneficiary are set to equal the weighted average bid, then Federal contributions would be more sensitive to the underlying cost of care and to beneficiary plan preferences than they would if the contribution was based on the lesser of the second lowest cost plan or traditional Medicare (as outlined in Option 4.3). For example, if the majority of beneficiaries in an area chose to enroll in a higher-cost plan, Medicare spending per beneficiary would be higher than they would be if payments were tied to the lowest cost plan in the area.
OPTION 4.5
Set Federal base year payments equal to average traditional Medicare per capita costs and limit the growth per person to an economic index
Under this approach, Medicare would calculate a payment per beneficiary in a base year and index these payments over time by a measure of inflation (e.g., the Consumer Price Index for Urban areas (CPI-U) or GDP), without regard to the growth in health care spending per beneficiary or geographic variations in the growth of health care spending. The payment would be applied toward the cost of a private plan, and beneficiaries would be responsible for any costs above the government contribution.12
Budget effects
No cost estimate is available for this option. The savings from this approach would depend on the index used to increase the Medicare contribution over time. Although CBO did not provide a cost estimate of Rep. Ryan’s Fiscal Year (FY) 2012 proposal, it is estimated that, within nine years of implementation, the Federal contribution for a typical 65-year-old would be about 22 percent lower than under CBO’s “alternative fiscal scenario” (CBO 2011).13 This would occur because the Federal contribution would rise slower than the costs of private plans, which would shift costs onto beneficiaries.
Discussion
This option would provide the greatest predictability for the Federal budget because payments would not be affected by variations in health care spending, plan bidding strategies, or beneficiaries’ plan choices. However, this option would shift financial risk onto beneficiaries, and could result in significant additional costs for people with Medicare. CBO estimated that if Rep. Ryan’s FY 2012 proposal were implemented in 2022, out-of-pocket spending would increase by $6,240 for a typical 65-year-old in that year (largely because the expected costs of providing benefits would be greater under private plans than under traditional Medicare) (CBO 2011).
References
Click to expand/collapse
American Enterprise Institute (AEI). 2012. Competitive Bidding Can Help Solve Medicare’s Fiscal Crisis, February 2012.
Joseph Antos, Mark V. Pauly, and Gail R. Wilensky. 2012. “Bending the Cost Curve through Market-Based Incentives.” New England Journal of Medicine, August 2, 2012.
Jason Brown, Mark Dugan, Ilyana Kuziemko, and William Woolston. 2011. “How Does Risk Selection Respond to Risk Adjustment? Evidence from the Medicare Advantage Program,” National Bureau of Economic Research, April 2011.
Congressional Budget Office (CBO). 2008. Budget Options, Volume 1: Health Care, December 2008.
Congressional Budget Office (CBO). 2011. Long-Term Analysis of a Budget Proposal by Chairman Ryan, April 5, 2011.
Congressional Budget Office (CBO). 2012. The Long-Term Budgetary Impact of Paths for Federal Revenues and Spending Specified by Chairman Ryan, March 2012.
The Heritage Foundation. 2011. The Second Stage of Medicare Reform: Moving to a Premium Support Program, November 2011.
Kaiser Family Foundation. 2011. Proposed Changes to Medicare in the “Path to Prosperity,” April 2011.
Kaiser Family Foundation. 2012. Transforming Medicare into a Premium Support System: Implications for Beneficiary Premiums, October 2012.
Medicare Payment Advisory Commission (MedPAC). 2012. Report to the Congress: Medicare and the Health Care Delivery System, June 2012.
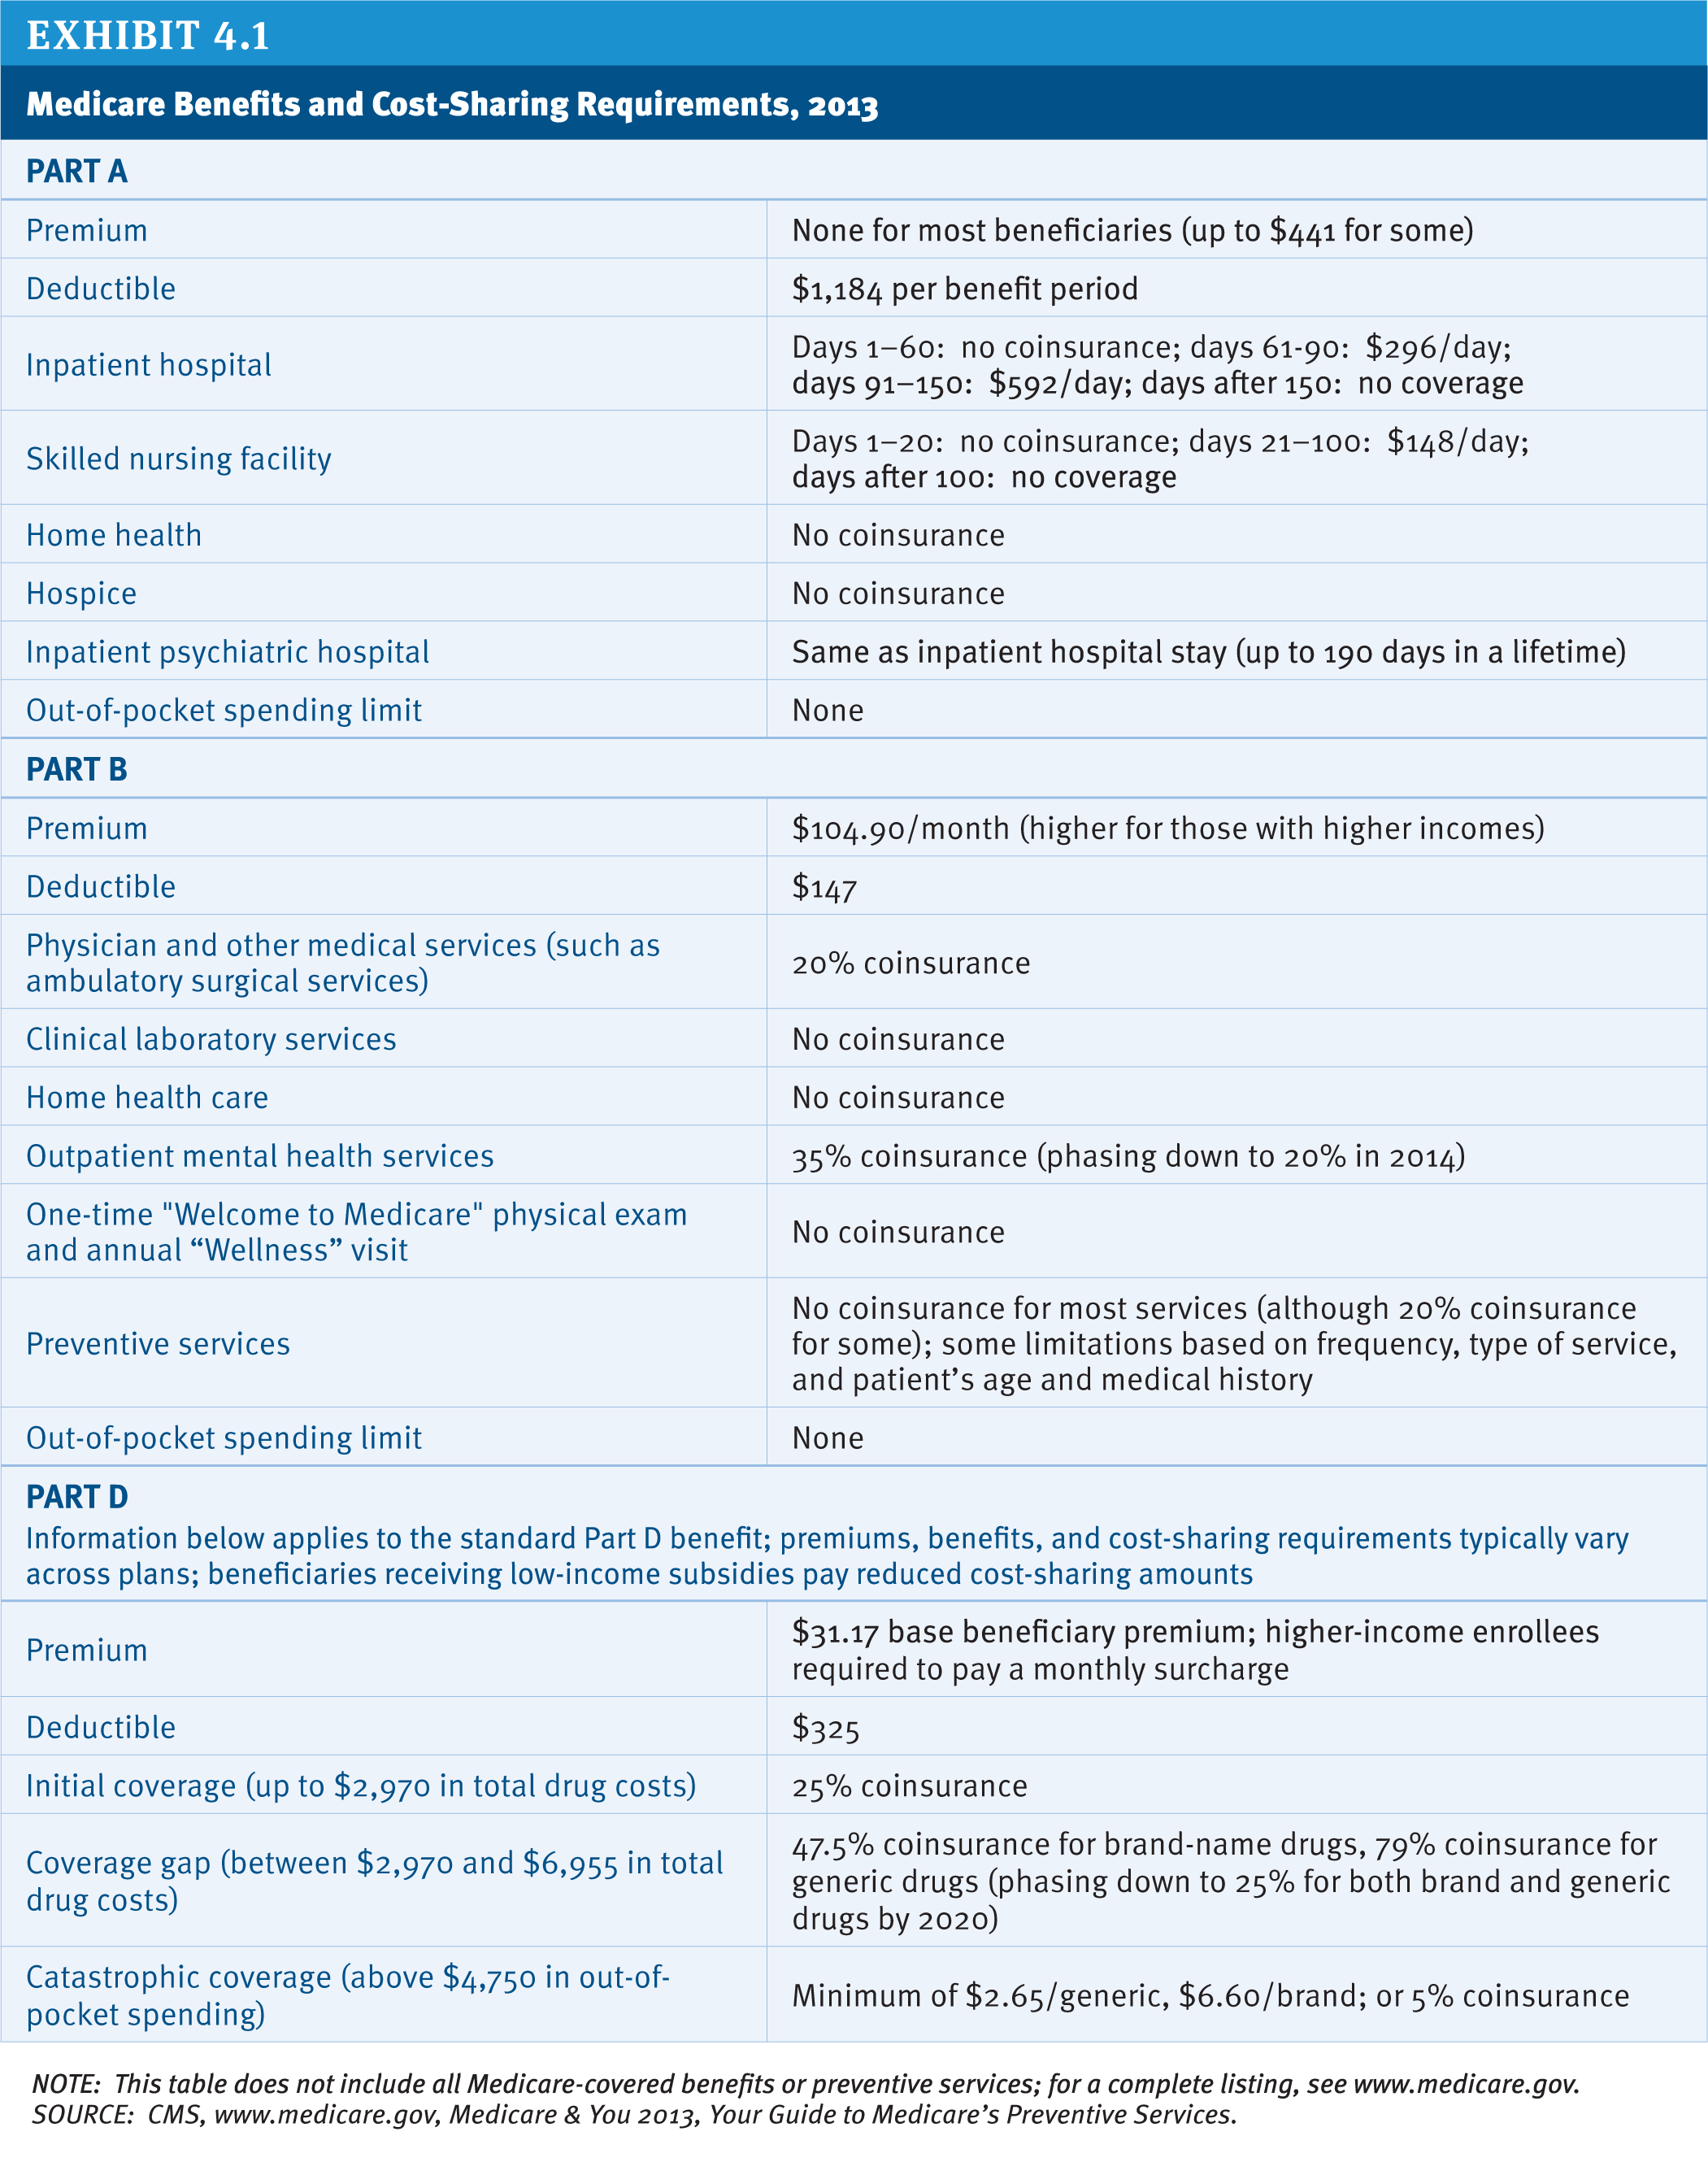
Exhibit 4.1: Medicare Benefits and Cost-Sharing Requirements, 2013
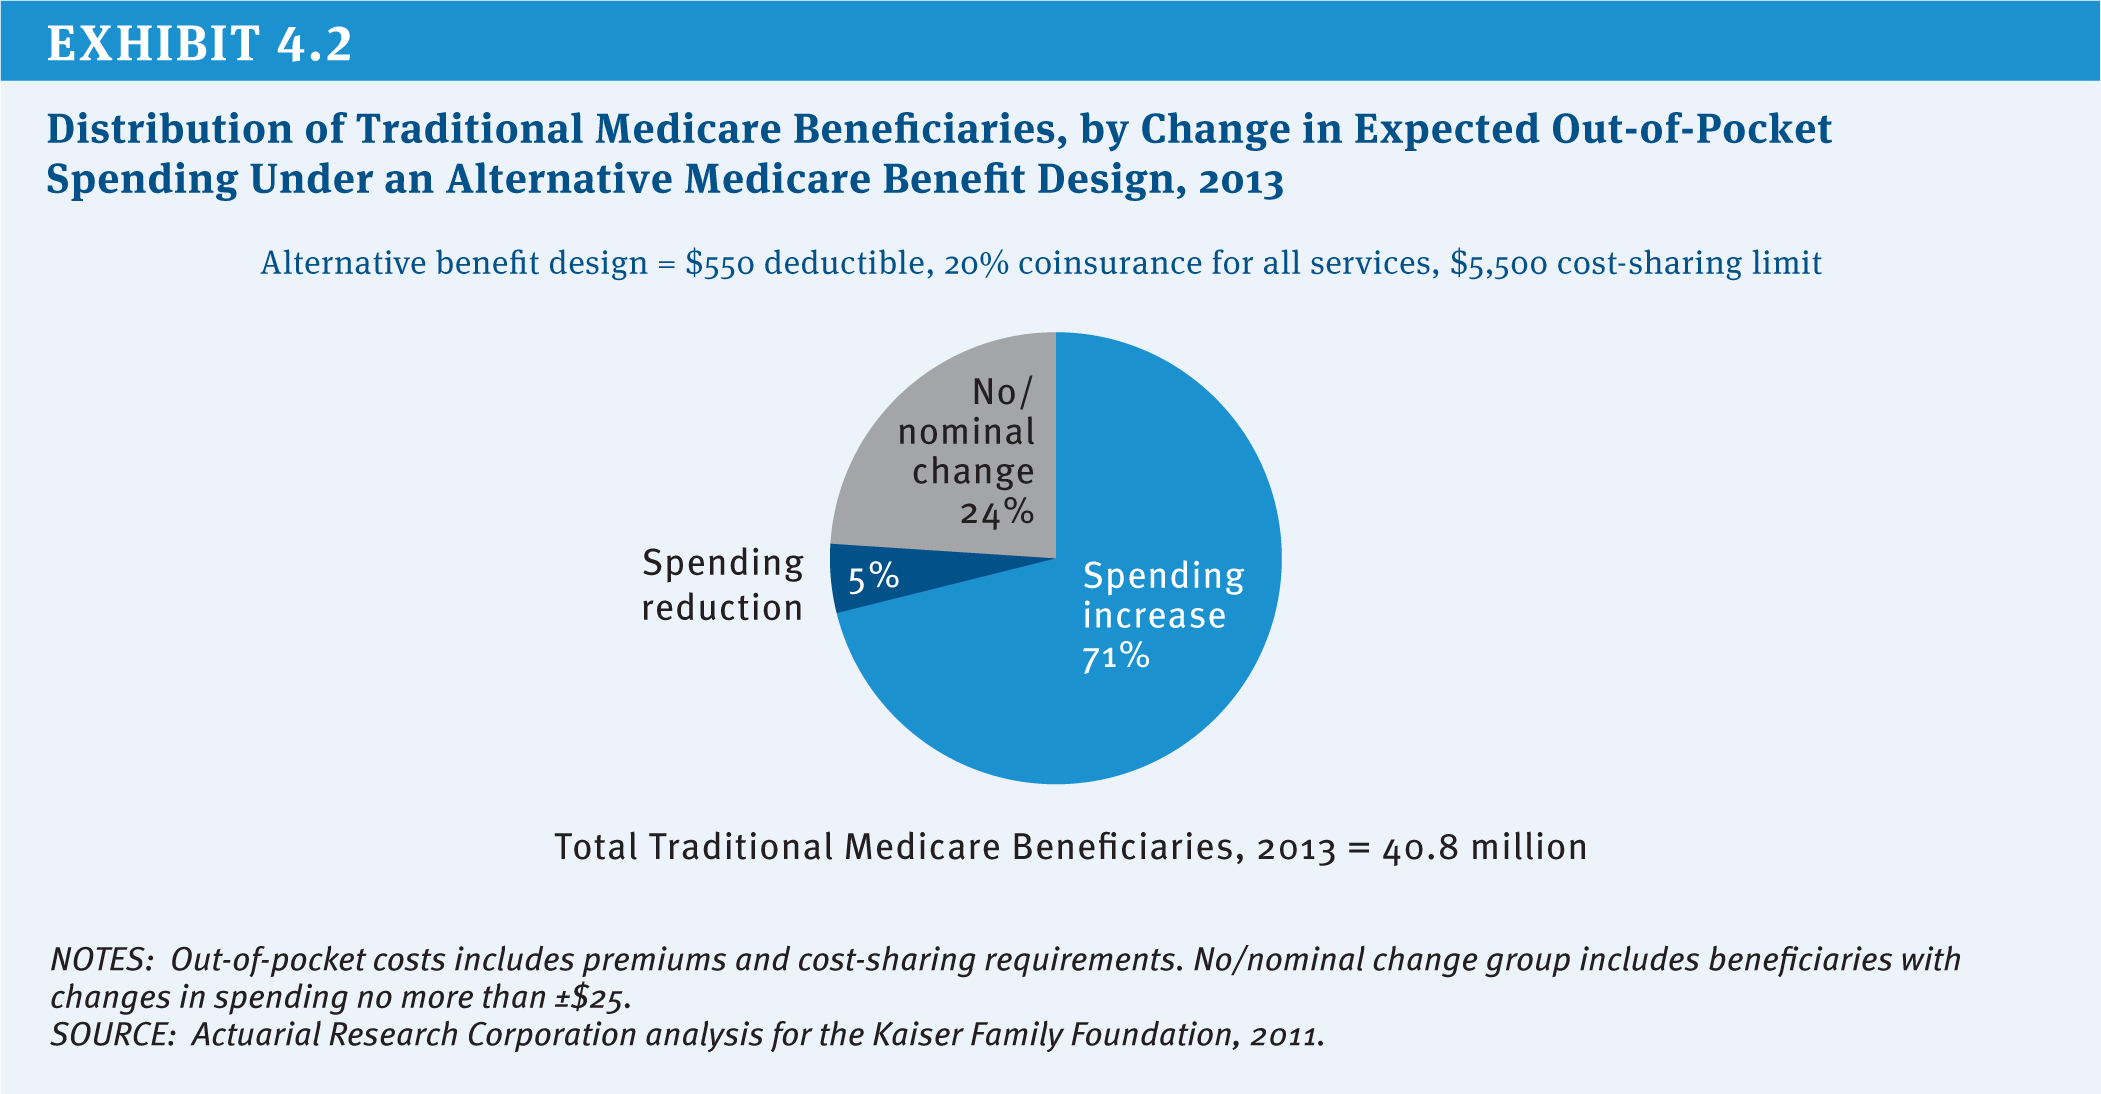
Exhibit 4.2: Distribution of Traditional Medicare Beneficiaries, by Change in Expected Out-of-Pocket Spending Under an Alternative Medicare Benefit Design, 2013
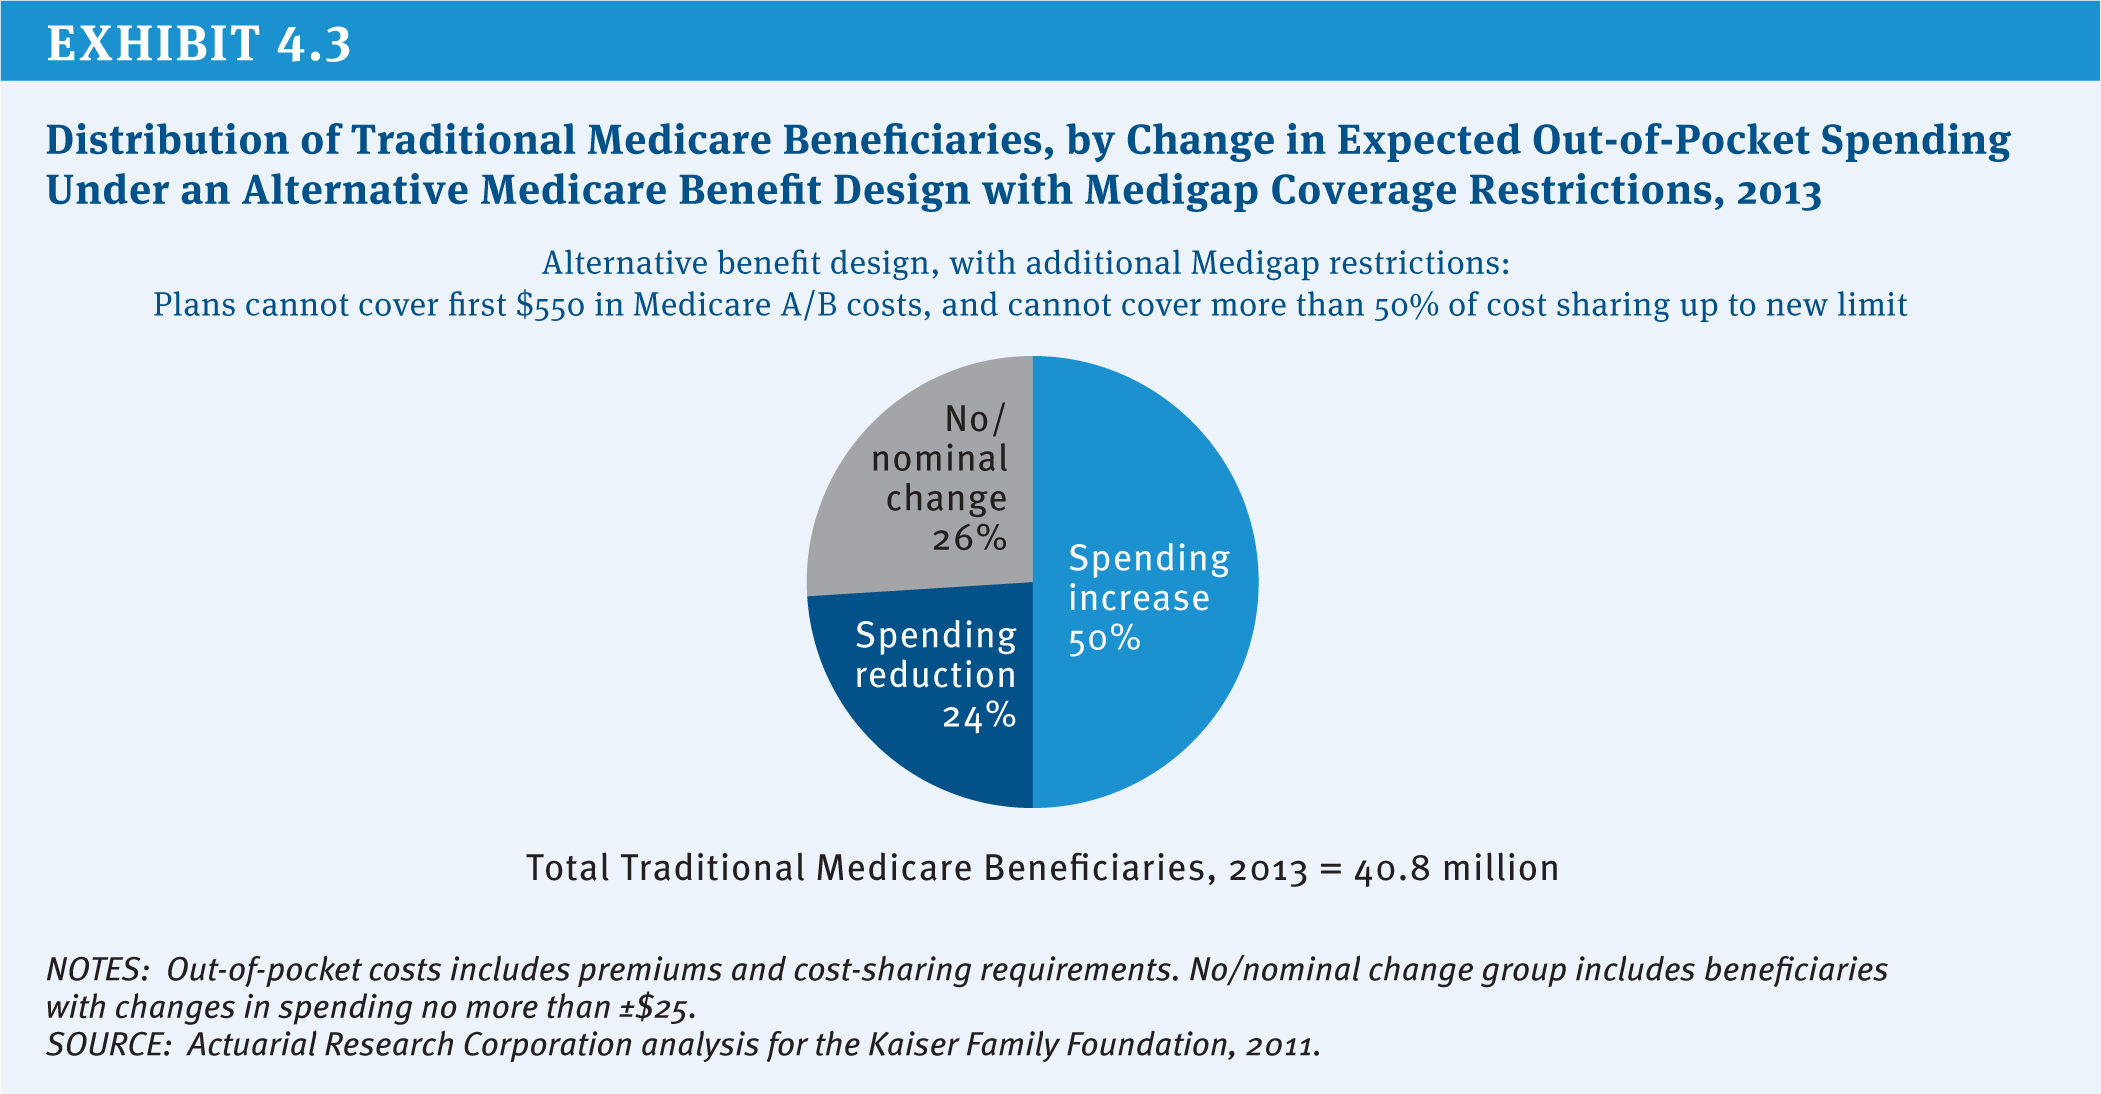
Exhibit 4.3: Distribution of Traditional Medicare Beneficiaries, by Change in Expected Out-of-Pocket Spending Under an Alternative Medicare Benefit Design with Medigap Coverage Restrictions, 2013
Section 5: Medicare Program Administration
Spending Caps
Options Reviewed
This section reviews the following options:
» Reduce the long-term target growth rate for Independent Payment Advisory Board (IPAB) recommendations from GDP+1% to GDP+0.5%
» Introduce a hard cap on Medicare per capita spending growth tied to the GDP per capita growth rate
» Introduce a hard cap on the total Federal health care spending per capita growth rate tied to the GDP per capita growth rate
Placing a limit on Medicare spending growth is one response to concerns about increases in Medicare spending and rising health care costs. Several provisions in the Affordable Care Act (ACA) have had the effect of reducing the projected Medicare spending growth rate over the next decade compared to past growth. On a per person basis, Medicare spending is projected to grow at a slower rate than private health insurance spending and considerably slower than historical growth in Medicare spending. Although there is concern that the program may be unable to sustain such low per capita growth rates over the long term, there also are concerted efforts around the delivery system and payment reforms designed to help control spending growth that were set in motion by the ACA. Recent data indicate historically low or flat growth in volume, which some observers attribute to the recent economic downturn, while others suggest that recent efforts to reform the delivery of care may also be taking hold (White and Ginsburg 2012).
Nevertheless, with Medicare enrollment projected to increase by 70 percent over the next 25 years and with projected increases in health care costs affecting Medicare as it does other payers, total Medicare spending is projected to increase at an annual rate of 5.6 percent over the next decade, considerably faster than the growth in per capita spending and the projected growth in the economy, and thus represents a growing share of the economy, the Federal budget, and the nation’s total health spending.
This section examines policy options related to imposing a cap on the Medicare per capita spending growth rate, beginning with a discussion of how current law incorporates spending limits and budget enforcement mechanisms within Medicare and of various design elements related to proposed spending limits. It describes three options to constrain per capita Medicare spending, using the gross domestic product (GDP) per capita growth rate as a benchmark for Medicare per capita spending growth. This section does not include options to place a system-wide cap on total U.S. health care spending growth, which would involve broader approaches and constraints on spending by public and private entities that are beyond the scope of this report. This section also does not address specific payment mechanisms that establish some form of spending limit within traditional Medicare, such as bundled payments or global budgets. For a discussion of these options, see Section Two, Provider Payments.
Background
Health care costs—including Medicare costs—historically have grown faster than the U.S. economy. Between 2000 and 2011, for example, Medicare per capita spending grew at an annual rate of 6.9 percent, compared with a 2.9 percent annual growth in gross domestic product (GDP) per capita. Since enacting Medicare in 1965, Congress frequently has acted to curb Medicare spending through a series of laws that revised provider payment rates and systems, increased beneficiary cost sharing, or raised revenues through changes in tax law. These changes have, at times, slowed annual Medicare spending growth and extended the solvency of the Medicare Part A Trust Fund. Some of these savings have, however, proved to be more short-term in nature and the upward curve of Medicare spending growth has remained relatively steady.
As part of the ACA, Congress enacted $716 billion in 10-year Medicare savings (2013–2022), reducing the projected Medicare per capita spending growth rate to historically low levels. Between 2012 and 2021, average annual Medicare spending per beneficiary is projected to grow by 3.9 percent, less than the projected growth in per capita private health insurance spending (5.0 percent) and about the same as per capita GDP growth (4.0 percent) (Kaiser Family Foundation 2012b) [exhibit 5.1].
Current law incorporates several limits on Medicare spending and mechanisms to trigger spending reductions if spending exceeds certain targets. These are:
» The Sustainable Growth Rate (SGR), enacted as part of the Balanced Budget Act of 1997, is used in determining annual updates to Medicare physician payments based, in part, on the estimated 10-year average annual growth in real GDP per capita (among other factors). Based on this calculation, if actual spending exceeds the SGR target, the next annual physician payment update is reduced; conversely, if spending is lower than the target, the update is increased. Strict adherence to the SGR formula would have resulted in significant cuts in Medicare physician payment rates but Congress has acted several times to override those reductions.
» The Medicare Modernization Act of 2003 added a “Medicare solvency trigger” requiring the Medicare Board of Trustees to annually report whether general revenues are projected to finance 45 percent or more of Medicare spending in any of the next seven years. If so, the Trustees are required to issue a “Medicare funding warning.” In response, the President is to submit legislation and Congress is to consider this legislation on an expedited basis. Such a warning has been issued each year since 2006 but no legislation has been specifically enacted to address it. During the 111th Congress, the House of Representatives passed a resolution to disregard any such funding warning issued by the Board of Trustees; the resolution was not in effect for the 112th Congress.
» The Affordable Care Act established an Independent Payment Advisory Board (IPAB). Beginning in 2015, if the projected five-year average growth rate in Medicare per beneficiary spending exceeds a per capita target growth rate, based on general and medical inflation (2015–2019) or GDP (2020 and beyond) IPAB is required to make recommendations on how to reduce growth. The ACA imposed limits on how much of a reduction IPAB can recommend and a prescribed time period for statutory review and revision. For the 113th Congress, the House of Representatives has passed a rule to disregard the fast-track procedures established for considering IPAB recommendations.
Yet even with the various constraints on Medicare spending imposed under current law, total Medicare spending is projected to rise from 3.1 percent of GDP in 2012 to 5 percent in 2037 (CBO 2012). Imposing a budget cap on Medicare spending could achieve greater budget certainty and more control over future growth in program spending. The specific approaches that have been suggested for limiting Medicare spending growth differ along several important dimensions [exhibit 5.2]:
» What benchmark is used as the spending target? Different benchmarks can be used as the measure to which the Medicare spending growth rate is compared. The most commonly discussed benchmarks include GDP (a measure of national economic output) and the Consumer Price Index (CPI, a measure of overall inflation). These benchmarks can be measured overall or on a per capita basis, which would adjust for population size and growth. In most proposals, the limit is based on the annual per capita rate of growth in GDP plus one percentage point or 0.5 percentage points (GDP+1%; GDP+0.5%).
» Is the limit is a “hard” or “soft” cap? Different approaches to enforcement include whether the spending limit is “hard” or “soft.” Both the Medicare solvency trigger and IPAB are examples of “soft” caps because they require additional action to achieve any savings. IPAB’s target growth rate itself is not a cap on annual Medicare spending growth, but rather a benchmark that triggers whether Medicare spending reductions are needed. In contrast, for “hard cap” approaches, a benchmark growth rate is used as an actual limit on Medicare spending growth. An example of a hard cap appeared in the Fiscal Year 2013 House Budget Resolution, which included a cap on Medicare per capita spending growth of GDP+0.5% as part of a proposal to transform Medicare to a premium support system (House Budget Committee 2012).
» How would savings be achieved if spending exceeded the cap? Whatever process is established for decision-making about spending reductions, the main question then is where the spending reductions would be made. For example, would the burden fall on providers in the form of payment reductions, on plans in the form of restrictions on premium increases, on beneficiaries in the form of increases in cost sharing or premiums, on taxpayers in the form of higher taxes or other new revenues, or on other areas of the Federal budget? In addition to specifying the actions that would be required, protections could be established to prevent spending reductions from directly affecting some or all beneficiaries or certain types of providers. Under current law, for example, IPAB is prohibited from recommending changes that would restrict benefits or eligibility, increase cost sharing or premiums, ration care, or (for a period of time) reduce payments for certain providers.
» What entity determines whether the cap has been exceeded and what actions would be taken as a result? Decisions also are needed about what action(s) would be taken and by whom if the limit is exceeded. For example, would the Executive Branch submit proposed changes to Congress for approval? Would Congress be charged with developing a legislative response, or would this authority be delegated to some other group or agency (such as an independent board like IPAB)? In the case of IPAB, the chief actuary of CMS is responsible for calculating the Medicare spending growth rate and the target growth rates against which Medicare spending growth is measured, while the Secretary of Health and Human Services (HHS) is required to submit recommendations to Congress if IPAB fails to do so by the date specified in the law, and is authorized to carry out the Board’s recommendations if Congress fails to act in the required timeframe, or an alternative that has been enacted (Kaiser Family Foundation 2011).
Alternatively, the response could be taken out of the hands of elected officials altogether, through such mechanisms as automatic sequestration or automatic revenue increases. However, there is nothing that can prevent Congress from stepping in at any time to revise any targets or caps or mitigate the potential effects of enforcement of a target or cap that has been exceeded.
For any of these approaches, other important questions are the time period over which Medicare spending and the target growth rate would be evaluated (e.g., using a five-year period over which an average annual rate of growth is calculated), and the entity (or entities) in charge of calculating the Medicare spending limit (OMB, CBO, or another independent authority).
Policy Options
Several options proposed recently incorporate some measure for limiting Medicare spending growth or triggering Medicare spending growth reductions. Three options are discussed.
OPTION 5.1
Reduce the long-term target growth rate for Independent Payment Advisory Board (IPAB) recommendations from GDP+1% to GDP+0.5%
President Obama’s Fiscal Year (FY) 2013 budget proposal included a provision to reduce the Medicare savings trigger in the IPAB process in 2020 and beyond from GDP+1% to GDP+0.5%, thereby setting a lower bar for measuring whether savings would be needed. (Some have also proposed lifting the restrictions on what IPAB can recommend and allowing the IPAB to make recommendations to reduce total Federal health spending, not just Medicare spending; for a more detailed discussion of these ideas, see Section Five, Governance and Management).
Budget effects
The President’s FY 2013 budget did not separately score any savings in the 10-year budget window for the proposal to revise the IPAB target growth rate for Medicare, and CBO did not separately score this proposal. However, CBO has projected, based on current projections, that IPAB will not be required to make savings recommendations in the coming decade because Medicare spending is not projected to exceed the GDP+1% target. Lowering the GDP growth rate target to GDP+0.5% could mean that IPAB would need to make Medicare savings recommendations sooner.
Discussion
The proposal to lower IPAB’s target growth rate and the IPAB process in general, are driven by a budgetary concern about growth in Medicare spending—in particular over the long term. One concern with this approach is identifying the “right” growth rate to strive for to constrain Medicare spending growth without falling too far below marketplace trends in payment and potentially jeopardizing beneficiary access to providers.
The way that the GDP growth rate is incorporated into the IPAB process may be a more measured approach toward the goal of setting some kind of limit on Medicare spending growth than “hard cap” options. In the IPAB process, the target growth rate of GDP+1% (or GDP+0.5% under this option) is not a fixed cap on Medicare spending. Instead, if Medicare spending growth exceeds the target growth rate, the Board’s recommendations must achieve savings totaling the lesser of either: 1) the amount by which projected spending exceeds the target (expressed as a percent of projected Medicare spending), or 2) total projected Medicare spending for the year multiplied by 0.5 percent in 2015, 1.0 percent in 2016, 1.25 percent in 2017, and 1.5 percent in 2018 and beyond. Therefore, regardless of the magnitude of the average annual growth rate of Medicare or how different from the GDP growth rate, any spending reduction triggered by IPAB can never exceed a maximum of 1.5 percent of projected Medicare spending after 2018.
The statutory limits on IPAB recommendations also limit its purview to spending reductions in payments to providers and plans (with some exceptions on the providers subject to reductions prior to 2020). It is uncertain whether IPAB may address other aspects of payment beyond plan and provider payment rates, and the law does not specify what other proposals IPAB could recommend to achieve savings beyond payment reductions. Some have expressed concern that deep provider spending reductions could have an indirect effect on beneficiaries’ access to care, but the current law is clear in prohibiting measures that would more directly target beneficiaries in terms of cutting benefits or increasing out-of-pocket spending to achieve the required savings. (For a discussion of additional issues related to the role, structure, and scope of IPAB, see Section Five, Governance and Management.)
OPTION 5.2
Introduce a hard cap on Medicare per capita spending growth tied to the GDP per capita growth rate
Some recent proposals would place a “hard” cap on the Medicare per capita spending growth rate at the rate of growth in GDP plus a specified percentage point (GDP+1% or GDP+0.5%). A similar approach is included in several premium support proposals, where a benchmark is used to set a fixed limit on the annual growth in the government’s premium support payment for Medicare beneficiaries, but proposals differ in terms of the specific growth rate that would be used, as well as along several other dimensions (Kaiser Family Foundation 2012a). For a discussion of premium support proposals, see Section Four, Premium Support.
Budget effects
No cost estimate is available for this option. A hard cap could be calibrated to achieve whatever Federal savings were desired.
Discussion
Setting a fixed limit on annual Medicare per capita spending growth based on the GDP per capita growth rate would provide a predictable spending path and guarantee savings in years when Medicare per capita spending growth is projected to be higher. Setting a hard cap on per capita spending growth also could create an environment of predictable budgetary discipline that could help payers and providers get health care cost growth under control.
However, there may be acceptable and even desirable reasons to have a relatively higher Medicare per capita spending growth rate, such as to accommodate spending on important but costly advances in medical technology, breakthroughs in treatments, or unanticipated spending to treat pandemic disease outbreaks. In such cases, placing restrictions on the per capita growth rate could force spending reductions in ways that could negatively affect beneficiaries in terms of shifting costs and restricting access, discouraging provider participation in Medicare, and jeopardizing other important safety-net features of the program.
According to the Government Accountability Office (GAO), mandatory spending programs are not amenable to simple budget caps because such caps do not deal with the underlying structure of the program and hence would not address longer-term growth trends that may be a cause for concern (GAO 2011). Congress could, of course, override or revise the caps, but such action would increase spending under current budget rules. And in years when economic growth exceeds Medicare spending growth on a per capita basis, this option would call for no budget restraint, which could lessen the pressure to address flaws in the health care payment and delivery system that recent reforms are designed to address.
The implications of caps as part of a premium support system are unknown. If the bidding systems envisioned by the sponsors succeed in limiting cost growth below the level set by the caps, the caps would have little effect other than as a clear target and backup enforcement mechanism. If the result of bidding under premium support plans is that many plans (or traditional Medicare) are unable to limit their cost growth to the GDP+0.5% (or GDP+1%) cap, the result could be automatic payment reductions and/or premium increases in traditional Medicare and higher beneficiary premiums for private plans, benefit constraints, more limited access to providers through tighter networks, lower provider payments, or some combination of these changes (CBO 2011).
The experience with creating the SGR, a formula-based approach to setting Medicare payment levels for physician reimbursement, provides lessons about adopting a similar approach in order to place limits on overall Medicare spending growth. While the SGR is intended to control the growth in total Medicare spending for physician services, the formula has been widely criticized and never enforced. When spending has exceeded the target, it would trigger deep projected cuts in payment rates which the Congress has typically chosen to override and replace with small fee increases covering brief periods of time. Most times Congress has acted to override the SGR it has had to reduce Medicare spending in other areas. The result has been uncertainty for physicians and their patients, and a weakening of the original cost-containment goals of the SGR. However, while the physician payment updates have not been in line with the steep reductions called for under the SGR formula, the payment updates likely have not been as generous as they might otherwise have been had the formula not been in place.
OPTION 5.3
Introduce a hard cap on the total Federal health care spending per capita growth rate tied to the GDP per capita growth rate
While several recent proposals to impose fiscal discipline on Federal health spending primarily target only Medicare, another option would be to impose a cap on total Federal health care spending, including Medicare, Medicaid, the Children’s Health Insurance Program (CHIP), the Federal Employees Health Benefits Program (FEHBP), TRICARE (for members of the military), health insurance exchange subsidies, and the tax subsidy for employer-sponsored health benefits. For instance, the Simpson-Bowles commission proposed that if total Federal health care costs exceeded the target growth rate of GDP+1%, the President and Congress would have to act to lower spending.
Budget effects
No cost estimate is available for this option. As with Option 5.2, a hard cap could be calibrated to achieve whatever Federal savings were desired.
Discussion
According to the GAO, covering the full range of Federal programs and activities under a single budget cap could strengthen the effectiveness of controls and enforcement of budget limits (GAO 2011). Including all Federal health care spending within a budget limit would give the government greater control and certainty regarding a sizeable portion of the Federal budget. Moreover, if health care cost growth is a concern for the U.S. health system overall, then capping Medicare spending growth may raise concerns related to equity, access to care, and quality of care for Medicare beneficiaries. Targeting only Medicare spending could produce a growing disparity between Medicare and other public and private payer reimbursement rates, which could result in access problems among Medicare beneficiaries.
A downside to limiting total Federal health spending with a GDP-based cap is that it would include Medicaid, where program spending operates in a countercyclical manner, rising when the economy is faring poorly. Likewise, TRICARE spending can vary substantially as the nation increases and decreases its defense commitments in response to international events. Also, it is not clear how the limit on the employer tax exclusion would be administered—would it be applied retroactively, across all employers (and employees) equally, and in proportion to the tax subsidy each employer received? Moreover, a budget cap applied to all Federal health care spending could result in spending reductions in all areas even if spending was rising rapidly in only one or a few programs or areas.
References
Click to expand/collapse
Congressional Budget Office (CBO). 2011. Long-Term Analysis of a Budget Proposal by Chairman Ryan, April 5, 2011.
Congressional Budget Office (CBO). 2012. The 2012 Long-Term Budget Outlook, June 2012.
Government Accountability Office (GAO). 2011. Budget Process: Enforcing Fiscal Choices, May 4, 2011.
House Budget Committee. 2012. The Path to Prosperity, Fiscal Year 2013 Budget Resolution, March 2012.
Kaiser Family Foundation. 2011. The Independent Payment Advisory Board: A New Approach to Controlling Medicare Spending, April 2011.
Kaiser Family Foundation. 2012a. Comparison of Medicare Premium Support Proposals, March 2012.
Kaiser Family Foundation. 2012b. Medicare Spending and Financing Fact Sheet, October 2012.
Chapin White and Paul Ginsburg. 2012. “Slower Growth in Medicare Spending—Is This the New Normal?” New England Journal of Medicine, March 22, 2012.
Coverage Policy
Options Reviewed
This section discusses several policy options for improving Medicare coverage policy and the often related payment and service use that derives from coverage:
» Increase CMS’ authority to expand evidence-based decision-making
» Mandate coverage with evidence development
» Adopt least costly alternative (LCA) and reference pricing for certain covered services
» Implement prior authorization as a condition of coverage when appropriate
» Allow CMS to use cost considerations in making coverage determinations
While Medicare’s basic benefit package is spelled out in statute, including such broad categories as inpatient care, outpatient care, and physicians’ services, decisions about coverage of a specific treatment or technology are made by the Centers for Medicare & Medicaid Services (CMS) and the contractors who review, process, and adjudicate Medicare claims. According to the Medicare statute, Medicare will not pay for items or services that are “not reasonable and necessary for the diagnosis or treatment of illness or injury or to improve the functioning of a malformed body member.”
The process of making Medicare coverage determinations involves examining the available clinical evidence to decide which technologies, services, and treatments demonstrate added-value in medical care and should therefore be covered for payment and under what circumstances. Advances in medicine, whether in the form of new technology or new uses of established technology for diagnosis and treatment, are a leading reason for health care spending growth, both for Medicare and other public and private payers. Furthermore, even widely adopted and used technologies and services may not meet evidence-based tests of effectiveness. Medicare coverage determinations can act as a policy lever to influence both the appropriate use of medical technology and the creation of better evidence to support clinical and health policy decisions. It is a critical element of Medicare’s value-based purchasing philosophy in which the quality of health care services, not quantity, is the driving force (Tunis et al. 2011).
In the view of many, the current process for making Medicare coverage decisions falls short, with some decisions to cover and pay for services made despite a lack of evidence that they actually improve patient outcomes and sometimes resulting from pressure from suppliers and providers of the services (Gillick 2004; Redberg and Walsh 2008). The Medicare process for approving and paying for new services or modified application of existing covered services has been controversial, with some believing that CMS is missing many opportunities for making more accurate judgments about which services actually benefit patients, thereby reducing wasted and sometimes harmful care and spending. Others believe that some decisions of the coverage policy process result in care rationing by interfering with the primacy of patient-physician decision-making on what best serves the patient’s well-being.
Background
Most of the thousands of health care services covered under Medicare have not been subject to a coverage decision. When faced with a coverage decision for a particular service, Medicare has two options: (1) issue a National Coverage Decision (NCD); or (2) issue a Local Coverage Decision (LCD). Medicare now has thousands of LCDs and a growing body of NCDs (Foote and Town 2007); CMS issues about 10-15 NCDs a year. Coverage policies can grant or limit coverage of or exclude items and services from Medicare. Development of LCDs and NCDs requires adherence to structured rules for how they are to be produced, with specified opportunities for affected stakeholder and public input. The resulting coverage policies establish what is supposed to be evidence-based guidance on the appropriate use, if any, for technologies and medical procedures. Medicare Advantage plans are obligated to follow coverage policies that are established as part of traditional Medicare.
When paying for episodes of care, as with diagnosis-related groups for a hospital stay, the attending physicians and hospital generally determine the mix of services offered, including whether particular technologies and procedures will be used. As a result, operationally, coverage determinations generally are reserved for those services which are not part of a bundled payment, unless access to the new technology is a primary reason for the hospital admission, or which are likely to have a major impact on cost and/or quality and safety, whether provided in a bundled payment or not. While LCDs sometimes address requests for new technologies, most policies consider new uses for established technologies and establish utilization guidance for common services. Indeed, most of the coverage activity of Medicare Administrative Contractors (MACs) involves establishing utilization guidelines for widely diffused technologies to try to prevent misuse or overuse.
CMS and the MACs often render more nuanced judgments on coverage that place restrictions based on clinical characteristics and setting of care. These so-called “conditions of coverage” have become the norm in NCDs. Yet, studies have suggested that clinicians’ actual practices do not adhere to the evidence-based conditions of coverage in many cases, leading to the likelihood that patients are receiving unapproved interventions that may not benefit them, but which come at a large cost, despite the intent of coverage policy to protect against this outcome (Foote and Town 2007). The MACs lack the resources to assure compliance with coverage conditions; moreover, until recently the Recovery Audit Contractors (RACs), which seek to identify and recover improper Medicare payments, were prohibited from considering coverage adherence in their activities. That prohibition has been lifted, and some expect the RACs to play an increasing role to assess compliance with conditions of coverage given the potentially large savings that could accrue.
While most national coverage decisions result in a positive decision, recent research indicates that many NCDs are based on “fair” or “poor” evidence (Neumann et al. 2008). The lack of high quality evidence for Medicare services means that the vast majority of technologies and services bypass systematic, evidence-based review.
Policy Options
OPTION 5.4
Increase the authority of the Centers for Medicare & Medicaid Services (CMS) to expand evidence-based decision-making
As noted earlier, Medicare coverage policies are often made without strong or relevant evidence, often relying on a small number of studies that lack rigor. Many studies lack head-to-head comparisons with existing diagnosis and treatment options, as comparative effectiveness studies would produce, and many typically do not examine the benefits and harms of technologies for a Medicare-relevant population that includes seniors with multiple comorbidities and younger beneficiaries with disabilities. Moreover, the coverage process has rarely been used proactively to increase the availability and use of high-value services that have been underused, such as smoking cessation programs, or to reduce the use of services that are obsolete or harmful.
One option to address concerns about Medicare coverage policy would be to provide CMS with greater authority (and funding, if necessary) to incorporate high-quality evidence relevant to Medicare services in the coverage determination process. Relying more on the expert advice from the Medicare Evidence Development and Coverage Advisory Committee (MEDCAC), CMS could identify critical research priorities to improve the evidence base and provide these recommendations to the National Institutes of Health (NIH), Agency for Healthcare Research and Quality (AHRQ), and Patient Centered Outcomes Research Institute (PCORI), as well as private sector research funders for consideration. As an alternative or in addition to this option, CMS could have its own research budget to support relevant research on specific questions related to Medicare coverage. For example, research has shown that some high-growth Medicare services, including sleep studies and spinal injections for back pain, lack a strong evidence base and exemplify substantial practice variation. Clinical experts suggest that these services are being provided inappropriately in many cases (Buntin et al. 2008). This option would transfer more responsibility for coverage decisions to CMS itself to produce evidence-based approaches to making uniform national coverage determinations, rather than relying on the MACs.
Budget effects
No cost estimate is available for this option.
Discussion
An enhanced CMS role on coverage would permit the agency to engage more in establishing a comparative effectiveness agenda relevant to its unique considerations regarding topic selection. The MEDCAC could help CMS craft a more systematic approach to identifying topics for review as NCDs and to develop a research agenda for services for which additional comparative effectiveness research should receive priority. Opponents of expanding CMS’s centralized authority are concerned about the substitution of centralized authority for individual clinicians to determine what interventions best serve patients’ interests. An element of that concern is based on the argument that evidence from clinical studies may be relevant for an average population but perhaps not for an individual patient. Critics also suggest that centralizing CMS’s authority to make coverage policy could lead to varying interpretations of evidence if the agency were under financial pressure to reduce spending. More practically, it is possible that the process of obtaining high-quality evidence could slow down Medicare coverage decisions and, in some cases, could lead to a rejection of new items and services under Medicare, negatively affecting patient care and potentially becoming a disincentive to innovation.
OPTION 5.5
Mandate coverage with evidence development
Often a new technology has important potential for materially improving the health of Medicare beneficiaries although proof of effectiveness has not been produced. The potential health improvement is such that it may not be reasonable to wait until high-quality evidence is developed. In these cases, Medicare has adopted an approach called “coverage with evidence development” (CED), which permits beneficiaries to receive services in the absence of demonstrable evidence of effectiveness, while contributing to developing the needed evidence base. In some cases, the subsequent evidence would provide a basis for removing or limiting the coverage that had been granted. Under the current draft policy for CED, this process links coverage with a requirement that patients receiving the service are enrolled in a clinical trial. This approach permits automatic review of high-quality evidence and a formal determination about coverage in an NCD.
Medicare has applied CED in more than a dozen NCDs in the past 15 years, yet data from the required studies have been used to set coverage policy in only two cases: for lung reduction surgery to treat late-stage emphysema in 2003, with the subsequent NCD based on the results of a randomized clinical trial conducted by NIH, and the use of positron emission tomography (PET) for cancer in 2009 based on oncologists’ reports to the National Oncology PET Registry (the registry approach was previously permitted as part of the CED policy). In both cases, Medicare made positive coverage policies that were likely more permissive than was justified by the available evidence prior to the studies (Buntin et al. 2008). In many other cases that would appear to be candidates for CER, appropriate trials or registries were never designed, funded, or implemented.
Although CMS has issued guidance attempting to clarify current the authority for CED, each application has involved internal legal debate at CMS (Tunis et al. 2011). Without a clear legal mandate to pursue CED, CMS’s efforts have been ad hoc, with no formal process for selecting topics, limited learning from one initiative to the next, and supported by limited resources and staff. To address this issue, one option would be to provide a specific legislative mandate to support the CED process within the Medicare coverage determination process.
Budget effects
No cost estimate is available for this option.
Discussion
Without a clearer legal mandate to pursue CED and additional resources to support data collection, the approach will likely languish. Clinical trials generally are considered the scientifically preferred approach for obtaining the requisite information on which to base a sound coverage determination. Opponents argue that CED inappropriately raises the threshold of evidence needed to obtain a positive coverage decision and slows access to medical advances. Furthermore, requiring entry into a formal clinical trial intentionally limits access for some beneficiaries, either because the trial is limited geographically, because they fail to meet the trial’s patient eligibility criteria, or because they are randomized into the control group.
OPTION 5.6
Adopt least costly alternative (LCA) and reference pricing for certain covered services
CMS generally does not attempt to factor relative effectiveness or cost compared to alternatives in setting payment rates for a covered service. At the same time, MACs have been selectively adjusting prices based on clinical effectiveness evidence for more than 15 years for certain items, including durable medical equipment and a few Part B drugs. Examples include manual wheelchairs, power mobility devices, seat lift mechanisms, supplies for tracheostomy care, and anti-androgen drugs for patients with advanced prostate cancer (MedPAC 2010). Through this approach, known as reference pricing, beneficiaries are allowed to obtain the more costly item if they pay the difference between the approved payment amount for the reference item and the amount for the more costly item.
A recent court decision (Hays v. Sebelius) overturned CMS’s use of the least-costly alternative (LCA), a form of reference pricing, for certain items. The court ruled that because Congress did not specifically authorize LCA approaches when enacting the Medicare Modernization Act of 2003, CMS could not use its broad “reasonable and necessary” authority to do so for pharmaceuticals. In response, Medicare has abandoned the approach in most circumstances.
This option would provide specific statutory authority for adopting LCA for functionally equivalent services in specified circumstances. Under this approach, beneficiaries could still choose the more costly service, but would be liable for the difference between the payment Medicare would make for the least costly alternative and the actual price for the higher-cost alternative.
Some, including MedPAC, have considered an even more robust use of LCA in Medicare, although MedPAC itself has not endorsed the approach (MedPAC 2010). In one version of this option, after a suitable time period needed to generate sufficient evidence, a service judged to be clinically equivalent to another covered alternative would be assigned a payment level equal to that lower-cost alternative (Pearson and Bach 2010). That is, rather than pay based on the actual cost as Medicare does now, services with equivalent clinical effectiveness would be paid the reference (least costly) price. This option goes further by considering a reference price for different interventions that available evidence suggests are clinically equivalent, even though they may be very different on a number of other parameters, such as their mode of administration, their biological mechanisms of action, and patient preferences. In this broader concept, clinical equivalence and LCA pricing then might be applied to interventions that use different treatment modalities, e.g., drugs, surgery, radiation, etc.
Budget effects
MedPAC estimated that the narrow approach to LCA would save $1 billion over 10 years (MedPAC 2011a). No cost estimate is available for the more expansive approach.
Discussion
A rationale for this option is that Medicare beneficiaries and taxpayers should not pay more for a service when a similar service can be used to treat the same condition and produce the same outcome at a lower cost. A more expansive use of LCA than has been applied in the past offers the potential for cost savings because the consideration of clinical equivalence is much broader than LCA’s historically limited use.
Of concern, however, is that this more expansive LCA places a particularly high burden on the strength of the evidence available to determine clinical equivalence, including whether results found in controlled, study environments are replicated when a medication or other intervention is used broadly outside of the research environment. For example, the evidence needed to determine functional equivalence might need to address whether a medication requiring more frequent administration produces the equivalent outcomes as another one with less frequent administration requirements. It often takes many years to produce high-quality evidence to demonstrate comparative effectiveness, yet the proposed approach provides a limited window before a product or service is considered equivalent. Indeed, in some circumstances, paying the lowest price would effectively make the more costly alternative prohibitively expensive, effectively freezing the development of additional evidence and removing the item from the market. The potentially negative impact of LCA on beneficiaries includes facing limited access and/or higher out-of-pocket costs because the item, service, or treatment modality they prefer is not the reference item.
In addition, the more expansive use of LCA might ignore important patient perspectives on equivalence. Although in clinical terms, interventions using different modalities, e.g., surgery vs. drug therapy, might produce comparable outcomes, different patients would likely have different preferences regarding these choices, raising questions about whether these interventions truly are functionally equivalent.
OPTION 5.7
Implement prior authorization as a condition of coverage when appropriate
While commercial health plans and self-funded employer plans have successfully implemented prior authorization for selected services, Medicare has rarely applied this utilization management approach. Recently, MedPAC recommended the use of prior authorization for practitioners who order substantially more advanced imaging services than other physicians treating comparable patients (MedPAC 2011b). According to a recent report by the Government Accountability Office (GAO), doctors who referred patients for tests involving advanced imaging machines that they or a family member owned cost Medicare more than $100 million in 2010 (GAO 2012). It was estimated that providers who self-referred patients for advanced imaging made about 400,000 more referrals than they would have had they not had a financial interest in the imaging equipment.
In addition, the ACA called for a three-year demonstration of prior authorization for motorized wheel chairs prescribed in selected states. The demonstration addresses fraudulent billing as well as inappropriately documented claims paperwork. Since 2009, CMS found it was billed a total of $2.9 billion in fraudulent claims for motorized wheelchairs and that nearly 93% of claims for motorized wheelchairs did not meet paperwork requirements for coverage.
An option could be to require CMS to contract with qualified contractors to perform prior authorization on selected high-cost, high-volume services when there is evidence to suggest that services are used inappropriately. Criteria for conducting prior authorization would be evidence-based and subject to public comment before adoption and would change based on emerging studies. Prior authorization could include exemptions for clinicians and facilities whose profiles demonstrate that their care patterns comply with applicable conditions of coverage and appropriateness criteria.
Budget effects
No cost estimate is available for this option. There is extensive experience with the use of prior authorization by private plans with evidence of cost-effectiveness, suggesting that Medicare could achieve savings under this option.
Discussion
Prior authorization can be effective and reasonably non-intrusive if targeted to services with high unit costs and evidence or high likelihood of substantial inappropriate use; if objective information which may be easily transmitted to reviewers (such as imaging, lab data, and medical reports) are available; if applied in non-urgent or emergency circumstances where there is no patient risk from delays; and for clinical circumstances where there is strong evidence on which to base an objective determination of the appropriateness. Rather than conducting pre- or post-payment review to determine whether conditions of coverage are met, requiring prior authorization would be more effective in ensuring the requested service was in fact reasonable and necessary. Prior authorization would avoid the difficulty of denying payment after resources have already been committed, or trying to collect funds already paid out to providers for services inappropriately delivered.
However, there would be significant increased costs associated with contracting with clinically and organizationally qualified contractors to perform prior authorization. Some providers and patient advocates would likely oppose the introduction of prior authorization rules for Medicare, raising concerns about new administrative burdens and arbitrary denials of needed services. Similar concerns about the use of prior authorization by private health plans in the 1990s led to a significant managed care “backlash” that led many plans to back off such use.
OPTION 5.8
Allow CMS to use cost considerations in making coverage determinations
Accumulated evidence sometimes demonstrates that new, costly technologies offer little or no clinical benefit to patients compared with available alternative and less costly technologies. The Medicare statute does not explicitly address costs, thus leaving ambiguity about whether the “reasonable and necessary” language of the statute can accommodate cost considerations in coverage decisions. In 1989 and again in 2000, CMS sought public comment on proposed rules that would have allowed the agency to consider costs. In both instances, opposition from providers led CMS to withdraw the proposals.
In a recent example, the clinical trial of sipuleucel-T (Provenge) for use in hormone-refractory, metastatic prostate cancer demonstrated an improved survival of 4.1 months compared to a placebo. Priced at about $30,000 per treatment, with a usual course of three treatments, Medicare coverage came at a cost of nearly $100,000 per patient for this short-term average extension of life (Kantoff et al. 2010).
Yet, current interpretation of law would preclude CMS in any way from considering whether this cost represents a prudent use of funds. Both CBO and MedPAC have recently expressed the opinion that regardless of the legal interpretation of the current statute, CMS would require clear statutory authority to formally consider costs in determining whether to cover and pay for services (CBO 2007; MedPAC 2008). In the ACA, Congress expressly prohibited Medicare from considering costs in making coverage decisions. This option would give CMS legislative authority to use cost considerations in making coverage determinations.
Budget effects
No cost estimate is available for this option.
Discussion
The basic reason to consider costs is to achieve higher value for Medicare spending. A concern is that in some cases, services provided at high cost do not improve patient well-being and sometimes even subject patients to potential harm. The aim of an option to establish a more disciplined process for considering costs, but falling short of basing coverage on the results of cost-effectiveness analysis (CEA), would be to achieve higher value. A number of methodological issues make reliance solely on CEA, and the common output of CEA, the calculation of cost per quality-adjusted life year, problematic (Gold et al. 2007). Many other countries do not use CEA formally to determine whether a new service should be covered and paid for, but they do use CEA results as information to be considered in coming to a decision on coverage (Neuman and Greenberg 2009; Garber and Sox 2010).
Opponents argue that any consideration of costs in making coverage determinations raises the specter of care rationing. As with the Least Costly Alternative option, actively considering costs, with the possibility of denying coverage for services that do not have a sufficiently high pay-off in terms of improved health outcomes, places a high burden on the strength of the evidence available to make such judgments. This concern could be ameliorated somewhat if CMS had access to more comparative effectiveness studies, particularly controlled clinical trials, on which to base judgments that include cost and quality trade-offs.
References
Click to expand/collapse
Melinda Buntin, Steve Zuckerman, Robert Berenson, et al. 2008. “Volume Growth in Medicare: An Investigation of Ten Physician Services,” RAND Health and The Urban Institute, Working Paper Prepared for the Assistant Secretary for Planning and Evaluation, U.S. Department of Health and Human Services, 2008.
Congressional Budget Office (CBO). 2007. Research on the Comparative Effectiveness of Medical Treatments, December 2007.
Susan Bartlett Foote and Robert J. Town. 2007. “Implementing Evidence-Based Medicine Through Medicare Coverage Decisions,” Health Affairs, November 2007.
Alan Garber and Harold Sox. 2010. “The Role of Costs in Comparative Effectiveness Research,” Health Affairs, October 2010.
Muriel Gillick. 2004. “Medicare Coverage for Technological Innovations: Time for New Criteria?” New England Journal of Medicine, May 20, 2004.
Marthe Gold, Shoshanna Sofaer, and Taryn Siegelberg. 2007. “Medicare and Cost-Effectiveness Analysis: Time to Ask the Taxpayers,” Health Affairs, September/October 2007.
Government Accountability Office (GAO). 2003. Medicare: Divided Authority for Policies on Coverage of Procedures and Devices Results in Inequities, 2003.
Government Accountability Office (GAO). 2012. Higher Use of Advanced Imaging Services by Providers Who Self-Refer Costing Medicare Millions, 2012.
Philip Kantoff, Celestia Higano, Neal Shore, et al. 2010. “Sipuleucel-T Immunotherapy for Castration-Resistant Prostate Cancer,” New England Journal of Medicine, July 29, 2010.
Medicare Payment Advisory Commission (MedPAC). 2003. Report to the Congress: Medicare Payment Policy, March 2003.
Medicare Payment Advisory Commission (MedPAC). 2008. Report to the Congress: Reforming the Delivery System, June 2008.
Medicare Payment Advisory Commission (MedPAC). 2010. Report to the Congress: Enhancing Medicare’s Ability to Innovate, June 2010.
Medicare Payment Advisory Commission (MedPAC). 2011a. “Moving Forward from the Sustainable Growth Rate (SGR) System,” Letter to Chairmen and Ranking Members of Congressional Committees of Jurisdiction, October 14, 2011.
Medicare Payment Advisory Commission (MedPAC). 2011b. Report to the Congress: Medicare and the Health Care Delivery System, June 2011.
Peter J. Neumann, Maki S. Kamae, and Jennifer A. Palmer. 2008. “Medicare’s National Coverage Decisions for Technology,” Health Affairs, November 2008.
Peter J. Neumann and Dan Greenberg. 2009. “Is the United States Ready for QALYs?” Health Affairs, September/October 2009.
Steven D. Pearson and Peter B. Bach. 2010. “How Medicare Could Use Comparative Effectiveness Research In Deciding On New Coverage And Reimbursement,” Health Affairs, October 2010.
Rita Redberg and Judith Walsh. 2008. “Pay Now, Benefits May Follow: The Case of Cardiac Computed Tomographic Angiography,” New England Journal of Medicine, November 27, 2008.
Sean R. Tunis, Robert A. Berenson, Steve E. Phurrough, and Penny E. Mohr. 2011. Improving the Quality and Efficiency of the Medicare Program Through Coverage Policy, The Urban Institute, August 2011.
Governance and Management
Options Reviewed
This section reviews options for changes to Medicare governance and management in three areas:
» Changes to IPAB and CMMI
» Revise CMS governance and oversight authority
» Enhance the administrative capacity of CMS
Medicare governance and management issues have been an element of reform discussions for many years. At issue is the degree of authority and autonomy the Centers for Medicare & Medicaid Services (CMS), or others in the Executive Branch, should have in administering the Medicare program within statutory parameters. Congress ultimately is responsible for setting policy and funding levels for the Federal government, and the Executive Branch is responsible for implementing those laws within the funding constraints that are established. Concerns have arisen about the ability of Congress to deal with the often exceptionally detailed technical Medicare policy issues in a timely manner in what is often an intensely political environment. Some have expressed concern with Congress’ tendency to intervene when the agency makes a decision that key stakeholders find troublesome. There also are concerns about the ability of CMS to manage the current program while pursuing innovations needed in a changing marketplace. Finally, CMS has tight resource constraints.
The Affordable Care Act (ACA) included two policies designed, in part, to address concerns about Medicare governance and management. It creates an Independent Payment Advisory Board (IPAB), and sets annual targets for the growth rate in total Medicare spending. If spending is not within those targets, the law requires IPAB to issue recommendations to bring spending in line with those targets. Those recommendations must be considered by Congress on a fast-track basis and, if the Congress fails to act, the Secretary of the Department of Health and Human Services (HHS) must implement the recommendations, also on a fast-track basis.
The ACA also established a new Center for Medicare & Medicaid Innovation (CMMI) with $10 billion in funding over 10 years and a mandate to test a variety of models for payment and delivery system reform for Medicare and Medicaid. The law authorizes CMS to broadly disseminate those changes if certain cost and quality criteria are met.
Policy Options
Changes to IPAB and CMMI
Creation of IPAB, in particular, has generated concerns and led to conflicting proposals, ranging from efforts to repeal or strengthen it. Concerns about CMMI have also been a topic of debate.
OPTION 5.9
Revise authority of or eliminate the Independent Payment Advisory Board (IPAB)
IPAB is a 15-member board tasked with recommending Medicare spending reductions to Congress if projected spending growth exceeds target levels. Members are to be nominated by the President and confirmed by the Senate. The law sets a target for the growth rate in Medicare spending per capita. For 2015 to 2019, the target is the average of general and medical inflation. For 2020 and beyond, the target is the increase in the gross domestic product (GDP) plus one percentage point. If Medicare spending exceeds the target, the law requires IPAB to make specific recommendations to bring spending in line with those targets in that year. IPAB cannot recommend reductions of more than 0.5 percent of Medicare spending in 2015, 1.0 percent in 2016, 1.25 percent in 2017, and 1.5 percent in 2018 and subsequent years. The board is prohibited from recommending changes in premiums, benefits, eligibility, taxes, or other changes that would result in rationing. If IPAB cannot agree on recommendations, the HHS Secretary is responsible for making recommendations to reach the statutory spending target. Recommendations by IPAB or the Secretary must be considered by Congress on a fast-track basis, and if the Congress fails to reject them or to come up with alternatives that reach the same level of savings, HHS must implement the recommendations, also on a fast-track basis.
There is no statutory timetable for the President to submit nominations to the board, and the concerns about IPAB raise a strong possibility of resistance to confirmation of nominees. The first year of potential activity by IPAB is 2013. In April of 2013, the CMS Actuary will make the first determination of whether spending is within the target for the initial effective year, 2015. If spending exceeds the target, IPAB would develop its recommendations during the remainder of 2013 and transmit them to Congress in January 2014. The Secretary would begin to implement the recommendations, in the absence of Congressional action, in August 2014, effective for 2015.
OPTION 5.9A
Broaden IPAB’s authority
Some have proposed giving IPAB more authority by allowing it to weigh in on a broader array of issues including those affecting different provider groups. For example, the Simpson-Bowles commission recommended broadening IPAB’s authority to include payment rates for all providers since some provider types are exempted from IPAB recommendations before 2020 under current law. The Obama Administration proposed extending its authority to include recommendations on value-based benefit design, as did the Domenici-Rivlin Debt Reduction Task Force.1 Others have suggested expanding IPAB’s authority to include private sector health payments.
Budget effects
No cost estimate is available for this option.
Discussion
Advocates for broadening IPAB’s authority suggest that if an independent board is to be in place, its authority should not be limited to just some providers or to managing payment rates and ignoring new or innovative ways to address broader concerns over health care cost growth system-wide. Instead, such a board could advance more substantial reforms affecting other aspects of Medicare that may be difficult to consider in a political environment. Some also would extend its authority to include private sector changes as well so as to address total costs and ensure that Medicare payments do not fall too much out of line with private payment rates. Concern about extending IPAB’s authority reflects the general concerns about IPAB: in particular, that this entity should not be empowered to make changes beyond Medicare payment rates in order to advance structural or benefit changes, with fast-track consideration, because such major policy decisions should rest with the Congress, not an appointed body.
OPTION 5.9B
Change to multi-year targets and savings
The spending targets and scoring of IPAB recommendations could be set over a multi-year period rather than for a single year as under current law. For example, rather than look just to the single “implementation year,” the test of projected Medicare spending, and IPAB’s required savings recommendations, could be on a multi-year basis.
Budget effects
No cost estimate is available for this option.
Discussion
Under current law, IPAB recommendations are required to achieve savings in a single year (the “implementation year”). For example, in 2013, the CMS actuary is required to determine if projected spending in 2015 will exceed the target, and if so, IPAB would be required to develop recommendations to reduce spending by a certain amount in 2015. (The only longer-term requirement is that the recommendations cannot increase total Medicare spending over the baseline over a 10-year period.)
However, focusing on savings in only one year may lead to standard and easily scoreable short-term recommendations, such as payment update reductions, rather than long-term delivery system reforms and other approaches that could achieve savings over a multiple-year period but might not produce the requisite savings in any single year. Long-term reforms may require several years to implement before scoreable savings accrue, so could not be used by IPAB or by Congress to reach the one-year target for spending reductions. Yet these approaches may be the type of reforms that are more likely to put Medicare on a sustainable long-term path than provider payment cuts alone. A concern with this option is that it is harder to score some of these long-term reforms, and savings are less certain to be achieved. It would be important to ensure that moving to a longer timeframe for achieving savings would not mean that the required level of savings was less likely to be achieved.
OPTION 5.9C
Repeal or revise the authority of IPAB
Proposals have been made to repeal IPAB (its targets and its enforcement). During the 112th Congress, the House of Representatives voted for such a repeal but the Senate did not act on the legislation. Congress did, however, reduce IPAB’s mandatory appropriation for Fiscal Year 2012 funded through the ACA from $15 million to $5 million.
Budget effects
When the ACA was enacted in 2010, CBO estimated that IPAB would save $15.5 billion between 2015 and 2018. Based on the current projections, CBO indicates that Medicare spending will be below the targets and therefore the IPAB process will not be triggered. However, CBO estimates that repeal of IPAB would cost about $3.1 billion over 10 years (2013–2022), based on the assumption that there is a probability that its Medicare spending projections may be wrong (CBO 2012b).
Discussion
Those who propose repealing IPAB say it is unwise to empower a group of unelected officials to make decisions about Medicare policy and that those decisions should be made by Congress through the traditional legislative process. Those favoring retaining IPAB argue that a “back-up” mechanism is needed in the event per-capita Medicare spending accelerates. They also believe independent experts would be more immune to political pressures and lobbying than either the Congress or the Administration.
OPTION 5.10
Revise or eliminate the Center for Medicare & Medicaid Innovation (CMMI)
CMMI has authority to test a wide range of innovations and broadly disseminate those that CMS determines meet tests of costs and quality. CMMI has in its first two years implemented a wide range of programs, such as tests of Pioneer Accountable Care Organizations, a multi-payer Comprehensive Primary Care Initiative, and State Innovation models. The ACA also provides CMMI with mandatory appropriations totaling $10 billion over 10 years. CBO estimated that the savings generated by innovations would offset the spending, with a net savings estimate of $1.3 billion over 10 years. While the debate over CMMI is not as heated as the debate over IPAB, similar options could be considered—either repeal or restrain CMMI’s authority, or enhance CMMI’s authority.
Budget effects
No cost estimates are available for these options.
Discussion
Arguments to repeal CMMI or constrain its authority focus on several issues. There are concerns about the initial mandatory 10-year funding rather than subjecting CMMI activities to the year-by-year appropriations process that most Federal programs are subject to. There are questions about how CMMI uses the breadth of its demonstration authority in both Medicare and Medicaid without Congressional review, and concerns about particular demonstration programs. Finally, the ability of CMS to broadly disseminate models that it tests raises questions about the balance between Executive branch and Congressional responsibilities for deciding about nationwide programmatic changes.
Advocates for more rapid innovation in Medicare see CMMI as a needed accelerator of that agenda, which has been constrained for years by a lack of funding for innovation and constraints on the authority of CMS both to test models and to more broadly disseminate models that appear to be successful. At a minimum, advocates of CMMI suggest that the center be given an opportunity to test its value in pursuing innovations that achieve its mission of lowering spending while increasing, or at least not reducing, the quality of care.
OPTION 5.11
Provide more independent administration of CMS
Organizations including the National Academy of Social Insurance (NASI), the National Academy of Public Administration, and the Bipartisan Commission on the Future of Medicare, and other independent policy experts have examined Medicare’s governance and administration and offered an array of alternative administrative models. These include making CMS an independent agency or creating an independent board to oversee Medicare and perhaps health care more broadly, based on models such as the Securities and Exchange Commission or the Federal Reserve Board.
Under the independent agency approach, CMS would be removed from the Department of Health and Human Services and made an independent agency, bringing its current funding and staff as well as appropriate allocations of funding and staff from other HHS offices that focus in part on CMS issues. The CMS Administrator would continue to be appointed by the President and confirmed by the Senate, but would have a fixed-term appointment spanning two presidential terms, and there would be an independent board providing him or her advice and oversight (NASI 2002).2
Budget effects
No cost estimate is available for this option.
Discussion
There are tradeoffs involved in such a shift. The CMS administrator would be accountable to the President, with the standing that accompanies that position, and would no longer be subject to HHS oversight, direction, or interference. But the agency would lose the substantive input and political buffer of a Cabinet Secretary overseeing and protecting the agency. It is unclear whether Congress would be more or less likely to intervene in agency decisions, and whether having a separate independent advisory board would provide a balanced combination of substantive advice and protection from political interference. The fixed term for the administrator would be designed to span presidential terms, providing leadership continuity. However, that would result in a key agency with substantial impact on the Federal budget being led in some years by someone who may or may not be in agreement with the priorities of the incumbent President.
A key question in such a design would be whether the CMS Administrator and the agency would have powers in administering payment policy, such as authority to test and implement payment reform models of the type under consideration at CMMI. Becoming an independent agency would not lessen the difficulties inherent in defining and separating out those policy decisions that appropriately belong in the political arena, due to the magnitude of Medicare’s programmatic and economic impact on health care and the economy, from those that may best be left to administrative discretion.
OPTION 5.12
Establish oversight structure for premium support model
The premium support model (see Section Four, Premium Support) typically is accompanied with new mechanisms for oversight of the program, including:
» a new structure to oversee competition among health plans, and
» a new approach for administering Medicare on a regional basis as one of the competing plans.
One approach would have a board or other mechanism oversee and manage competition among private health insurers and traditional Medicare (Butler and Moffit 1995; National Bipartisan Commission on the Future of Medicare 1999; Antos et al. 2012). Advocates compare this model to the current oversight by the Office of Personnel Management (OPM) of the Federal Employees Health Benefits Program (FEHBP), as well as to the new Health Insurance Exchanges established under the Affordable Care Act. Depending on the premium support design, this entity could have responsibilities ranging from approval of benefit plans to setting and managing the annual and periodic open enrollment periods, as well as overseeing the plans that are serving the program.
The premium support model also requires attention to how to administer traditional Medicare as a competing plan. Under one scenario, traditional Medicare would be run nationally and bid locally. An alternative approach that has been advanced would have traditional Medicare run by regional administrators with a degree of autonomy over payment and possibly even elements of benefit design.
Budget effects
No cost estimate is available for this option.
Discussion
Proponents cite the experience of OPM in overseeing FEHBP as a model. Premium support advocates believe that CMS should not be in a position to manage one competitor (traditional Medicare) and at the same time fairly oversee a competitive market that includes private plans competing with that traditional program.
Critics worry that Medicare, with its vulnerable beneficiaries, is more complex than FEHBP. The combination of an OPM-like oversight structure with CMS administering the traditional program could present a problem of dual accountability for Medicare and could leave skeptics asking: Who ultimately is responsible for Medicare?
Administering Medicare on a regional basis would allow traditional Medicare to compete against private insurers in regional markets in a premium support model, thereby remaining a viable option for beneficiaries. This could, however, lead to a greater degree of variability in Medicare around the nation. There are questions about oversight and the capacity of regional officials to make these decisions and still achieve a degree of national autonomy for the program.
Enhance CMS Administrative Capacity
OPTION 5.13
Enhance CMS administrative capacities through contractors
Medicare operates largely through Medicare Administrative Contractors (MACs), private sector entities (typically related to or affiliated with insurers) that contract with CMS to administer the program and pay claims. CMS could turn to such entities, or other contractors, to more actively manage the program in a manner analogous to the way that large employers use third-party administrators to manage employer-sponsored health benefits.
The options can range along a spectrum from management of a particular service to a broader model that provides a range of care management functions. One option for a particular service is to contract with radiology benefit managers to administer prior authorization for advanced imaging services. Such administrators already have experience with this function in the private sector, approving payments for specific advanced imaging services ordered by physicians based on recommended guidelines for clinical practice. (For a discussion of the more general use of prior authorization, see Section Five, Coverage Policy.)
Medicare could contract for a more aggressive set of care management tools. These could range from high-cost case management and chronic care management approaches to network management and consumer engagement (UnitedHealth Center for Health Reform & Modernization 2013).
Budget effects
CBO has estimated that prior authorization for advanced imaging services under Medicare would produce net savings of $1 billion over 10 years (2010–2019) (CBO 2008). However, in 2012, CBO estimated that a proposal in President Obama’s Fiscal Year (FY) 2013 Budget to require prior authorization for advanced imaging would not produce budget savings over the 10-year budget window (2013–2022) (CBO 2012a). No cost estimate is available for the broader approach to contracting for care management.
Discussion
These approaches seek to make management of Medicare more analogous to the care management approaches used in private sector health plans. In particular, they attempt to focus on more appropriate utilization, which entails more attention to preventive measures and adherence to prescription medicine and other care recommendations, as well as attention to high-cost case management and clinical guidelines for interventions whose benefit may be less clear.
At the same time, there is a need for clear evidence of both clinical relevance and sustained cost containment. Introducing such approaches into traditional Medicare would be a major change for providers and patients, and would require a degree of acceptance in order to be sustainable. Some have suggested providing such approaches as an option for beneficiaries, who could choose between such a more managed Medicare program or the more traditional approach, presumably with some shared savings if the managed approach lowers spending. Finally, any such approach would require processes for appropriate adjudication of appeals.
OPTION 5.14
Increase CMS resources
CMS’s operating capacity has been constrained as its responsibilities have increased but its staffing and administrative funding have not. While Medicare’s programmatic dollars are funded as entitlements, the administrative budget must compete for annual appropriations. Today, CMS operates with about 4,500 full-time employees while overseeing more than $835 billion in annual spending, including $550 billion in Medicare spending. In 1977, CMS had a staff of 4,000 and annual spending of about $30 billion. Concerns about CMS resources are long-standing. In 1999, 14 national health care leaders (including former CMS Administrators from both parties) published an open letter attributing the agency’s management difficulties to an unwillingness to “provide the resources and flexibility necessary to carry out its mammoth assignment” (Open Letter to Congress and Executive 1999). One option would be to fund the CMS administrative budget fully out of the Medicare Part A trust fund so that the funding is not competing for annual appropriations.
Budget effects
No cost estimate is available for this option. The budget effects can be calibrated to specific levels of increased spending. For example, if Medicare’s spending for administration was 2 percent of program spending instead of the current 1.5 percent, administrative spending would increase by about $2.6 billion.
Discussion
The argument for an increase in funding is the need to not only administer the current program effectively for beneficiaries and taxpayers, but also to implement the types of changes identified in this report. However, given Federal budget constraints, action to increase spending would compete with other policy needs and funding priorities.
References
Click to expand/collapse
Joseph R. Antos, Mark V. Pauly and Gail Wilensky. 2012. “Bending the Cost Curve through Market-Based Incentives,” New England Journal of Medicine, August 1, 2012.
Stuart M. Butler and Robert E. Moffit. 1995. “The FEHBP as a Model for a New Medicare Program,” Health Affairs, Winter 1995.
Congressional Budget Office (CBO). 2008. Budget Options, Volume 1: Health Care, December 2008.
Congressional Budget Office (CBO). 2012a. Analysis of the President’s FY 2013 Budget, March 2012.
Congressional Budget Office (CBO). 2012b. Cost Estimate, H.R. 452: Medicare Decisions Accountability Act of 2011, March 2012.
Lynn Etheredge. 1997. “Promarket Regulation: An SEC-FASB Model,” Health Affairs, November/December 1997.
National Academy of Social Insurance (NASI). 2002. Improving Medicare’s Governance and Management, July 2002.
National Academy of Social Insurance and National Academy of Public Administration. 2009. Designing Administrative Organizations for Health Reform, 2009.
National Bipartisan Commission on the Future of Medicare. 1999. Building a Better Medicare for Today and Tomorrow, March 1999.
Open Letter to Congress and the Executive. 1999. “Crisis Facing HCFA & Millions of Americans,” Health Affairs, January/February 1999.
Hoangmai H. Pham, Paul B. Ginsburg, and James M. Verdier. 2009. “Medicare Governance and Payment Policy,” Health Affairs, September/October, 2009.
UnitedHealth Center for Health Reform & Modernization. 2013. Medicare and Medicaid: Savings Opportunities from Health Care Modernization, Working Paper 9, January 2013.
Program Integrity
Options Reviewed
This section discusses options to reduce fraud and abuse in Medicare, organized in the following categories:
» Raise the requirements that certain high-risk provider groups must meet in order to enroll and stay enrolled in Medicare
» Institute new pre-payment screens for high-risk providers
» Increase post-payment review of suspicious claims
» Expand enforcement sanctions and penalties
» Improve Medicare administration through better contractor oversight, data sharing, and funding levels that maximize return on investment
» Increase efforts to identify fraud and abuse in Medicare Part C (Medicare Advantage) and Part D (the prescription drug program)
» Revisit physician ownership rules to mitigate over-utilization
Finding ways to reduce fraud and abuse is essential for reducing health care costs and protecting Medicare beneficiaries. The sheer size of the Medicare program is, perhaps, one of the biggest challenges in fighting Medicare fraud and abuse. On each business day, Medicare’s contractors process about 4.5 million claims from 1.5 million providers. Each month, Medicare contractors review 30,000 enrollment applications from health care providers and medical equipment suppliers. Adding to this complexity, Medicare is designed to enroll “any willing provider,” and must pay most claims within 30 days. This leaves relatively few resources to review claims to ensure that they are accurate and complete and submitted by legitimate providers.
The scope of fraud and abuse in Medicare, while substantial, has not been fully documented. By its very nature, fraud is difficult to detect, as those involved are engaged in intentional deception. For example, fraud may involve providers submitting a claim with false documentation for services not provided, while the claim on its face may appear valid. Fraud also can involve efforts to hide ownership of companies or kickbacks to obtain beneficiary information or provide services to beneficiaries. In 2011, the Government Accountability Office (GAO) estimated that improper payments in Medicare—which include fraud, abuse, and erroneous payments—accounted for almost $48 billion in Fiscal Year 2010 (GAO 2011b). Efforts to find and fight fraud and abuse in Medicare have made considerable progress in recent years.
Background
Combatting Medicare fraud and abuse requires a comprehensive strategy of prevention, detection and enforcement. While each of these plays a critical role, in recent years more attention has been placed on prevention, or pre-payment fraud-fighting activities. Pre-payment detection strategies are preferred because the time and resources required to recover funds after they are paid out is inordinately high, and the amount of actual recoveries is often low. In Fiscal Year (FY) 2011, the combined efforts by the Centers for Medicare & Medicaid Services (CMS), the Department of Justice, and the Office of Inspector General (OIG) at the Department of Health and Human Services (HHS) resulted in criminal health care fraud charges against 1,430 defendants, 743 criminal convictions, 977 new investigations of civil health care fraud, and the recovery of $4.1 billion (Levinson 2012). CMS officials stated that during the same year, the agency revoked the Medicare billing privileges of 4,850 providers and suppliers and deactivated an additional 56,733 billing numbers.
Most recently, CMS has implemented a “twin pillar strategy” to keep bad providers and suppliers out of Medicare and remove wrongdoers from the program once they are detected. The first pillar, the Fraud Prevention System, required under the Small Business Jobs Act of 2010, applies predictive analytic technology—including historical data and algorithms—on claims prior to payment to identify aberrant and suspicious billing patterns. According to CMS, the system screens all fee-for-service claims on a national basis, for the first time allowing the agency to identify fraud schemes operating in both Medicare Parts A and B and across the country. The second pillar is its Automated Provider Screening system, which conducts routine and automated screening checks of providers and suppliers against thousands of private and public databases. This gives CMS the ability to more efficiently identify ineligible providers or suppliers before they are enrolled or revalidated in Medicare.
CMS carries out a large part of its fraud prevention program through the use of various contractors, with each playing a role in administering and protecting the integrity of Medicare.
» Medicare Administrative Contractors (MACs) are the central point of contact for providers within traditional Medicare, and are primarily responsible for processing claims, conducting provider screening and enrollment activities, and auditing hospital cost reports. They also develop automated edits to identify and address claim coding errors, medically unlikely claims, unusually high volumes of particular claims types, and patterns of errors that could be a telltale sign of fraud.
» Zone Program Integrity Contractors (ZPICs) investigate leads provided by MACs. CMS has created seven program integrity zones that align with the MAC jurisdictions. Some of the ZPICs’ main responsibilities are to develop investigative leads generated from the Fraud Prevention System and other sources, perform data analysis to identify cases of suspected fraud and abuse, provide support for ongoing investigations, and make referrals to law enforcement for potential prosecution. Because the ZPICs are exclusively dedicated to the prevention, detection and recovery of potential fraud, waste and abuse, they coordinate closely with the MACs to implement administrative actions such as claims edits, payment suspensions and revocations. They also refer overpayments they identify to the MACs for collection.
» Recovery Audit Contractors (RACs) seek to identify improper Medicare payments of all types. In 2003, CMS conducted a demonstration of recovery audit contractors, whose job it was to review, audit, and recover questionable Medicare payments. The demonstration showed that using RACs to identify and collect overpayments was an effective approach, and CMS began using RACs nationwide in March 2009. Unlike other Medicare contractors, RACs are paid only on a contingent fee basis and keep a percentage of the overpayments they collect, depending on the degree of collection difficulty. When a RAC identifies an improper payment that may, in fact, be the result of a fraudulent claim, it refers the case to law enforcement for investigation.
Medicare program integrity activities are funded in statute, largely through the Health Care Fraud and Abuse Control (HCFAC) and Medicare Integrity Programs (MIP), which were both established by the Health Insurance Portability and Accountability Act (HIPAA) of 1996. Beginning in FY 2009, Congress also approved additional discretionary funds to enhance these efforts, in part to address increased responsibilities to oversee Medicare’s prescription drug benefit. The Affordable Care Act (ACA) further increased HCFAC mandatory funding by $350 million over a 10-year period (2011–2020), and increased funding for MIP each year by the percentage increase in the consumer price index for all urban consumers (CPI-U).3 HCFAC funds are directed to the enforcement and prosecution of health care fraud, whereas MIP funding supports the program integrity activities undertaken by CMS contractors.
Prior to HIPAA, funding for Medicare’s program integrity activities was taken from CMS’s annual program management budget, which was subject to the appropriations process. This sometimes led to fluctuations in funding, as monies originally intended to support program integrity functions were redirected to fund ongoing Medicare operations. HIPAA assured CMS of stable funding that it could commit to Medicare anti-fraud activities. Since then, Medicare has experienced a positive return on investment for funds allocated to program integrity.
Besides direct efforts by CMS and its contractors, those with inside knowledge of providers’ activities (whistleblowers under the False Claims Act) contribute in identifying Medicare fraud and in effecting the recovery of millions of dollars. Beneficiaries also can be alert for possible irregularities in Medicare. Earlier this year, CMS revised its quarterly summary notices in an attempt to make errors easier for beneficiaries to identify.
In addition to efforts to address fraud and abuse in Medicare Parts A and B, there is much discussion about what can be done to prevent and detect fraud in Medicare Part C (Medicare Advantage) and Part D (the prescription drug benefit), both of which involve private plans in the delivery of Medicare benefits. In 2013, 2,074 Medicare Advantage plans are offered across the country, along with 1,031 stand-alone prescription drug plans. According to the HHS OIG, the MA organizations it reviewed identified about 1.4 million incidents of potential Part C and Part D fraud and abuse in 2009 (HHS OIG 2012a). However, it found that 95 percent of these incidents were identified by only three of the MA organizations.
Only recently has CMS selected contractors to oversee and conduct reviews of Medicare Advantage program integrity. In 2008, CMS expanded the Medicare drug integrity contractors‘ (MEDIC) responsibilities to include not only Part D, but also Part C program integrity activities. CMS requires Medicare Advantage and Medicare Part D prescription drug plan sponsors to have compliance plans detailing their fraud and abuse detection activities. CMS issued guidance on elements required in these plans, which includes internal monitoring and auditing procedures, and prompt responses to detected offenses. The HHS OIG and the GAO have reported deficiencies in CMS oversight of these compliance plans (HHS OIG 2012a; GAO 2011a).
The Small Business Jobs Act of 2010 and the ACA expanded CMS’ and other agencies’ fraud-fighting authority. These legislative initiatives subject providers and suppliers to enhanced screening before allowing them to participate in Medicare, establish new Medicare claims review requirements, and increase funding for anti-fraud activities. The estimated Medicare savings attributed to these authorities have already been incorporated into the Congressional Budget Office (CBO) Medicare baseline, so additional opportunities to achieve additional scoreable savings may be limited.
Policy Options
Raise the Requirements that Certain High-Risk Provider Groups Must Meet in Order to Enroll and Stay Enrolled in Medicare
In a September 2012 report, GAO found that durable medical equipment suppliers and home health agencies together accounted for 34 percent of the criminal health care fraud investigations ongoing in 2010 (GAO 2012a). These two provider types often score in CMS’ high-risk category and many are therefore subject to the most intense scrutiny.
As described earlier, CMS contracts with MACs to identify ineligible providers and suppliers before they enroll or re-enroll in Medicare. In 2011, MACs processed approximately 19,000 provider and supplier enrollment applications per month. This activity is essential in reducing payments to those who would otherwise defraud the program. The ACA directed the HHS Secretary to establish different levels of screening based on risk. CMS has recently initiated a provider screening program that assigns providers to a limited, moderate, or high-risk category. These categories, in turn, guide the intensity of scrutiny. For example, providers and suppliers in all three risk categories must undergo licensure checks, while those in moderate- and high-risk categories are subject to unannounced site visits. Using this tool, CMS is working to revalidate the enrollment of all existing 1.5 million Medicare providers and suppliers by 2015.
The options described below would augment CMS’ screening program and could provide CMS with better information to perform its gatekeeping activities.
OPTION 5.15
Expand disclosure requirements for new and existing Medicare providers
OPTION 5.15A
Disclose additional information on enrollment application
The ACA requires providers and suppliers to disclose affiliations with other providers that have: uncollected debt; been or are subject to payment suspension under a Federal health care program; been excluded from participation under Medicare or certain other programs; or had their billing privileges denied or revoked at the time of initial enrollment or revalidation. Implementing regulations were expected by November 2011 (GAO 2012c). CMS developed a draft rule to implement this requirement, but it has not been finalized because providers and suppliers have objected to the sensitivity of the information requested and have raised concerns about its ultimate use. They also are concerned about how CMS will maintain the privacy and security of the information they submit. CMS could work with providers to resolve these concerns and proceed with finalizing its rule.
OPTION 5.15B
Disclose use of high-risk banking arrangements
When CMS identifies an improper payment made to a provider, it can face a variety of barriers in recovering the funds. One of these barriers is providers’ use of high-risk banking arrangements, such as “sweep” accounts that immediately transfer funds from a financial account to an investment account in another jurisdiction. If CMS knew about these arrangements beforehand it would be in a better position to act quickly when payment recovery was warranted. CMS could require providers to disclose their use of sweep accounts and other high-risk banking arrangements upon enrolling in the program.
Budget effects
No cost estimate is available for Option 5.15a. CBO has estimated Option 5.15b (requiring disclosure of high-risk banking arrangements) as having no budget impact over 10 years. The President’s FY 2013 Budget also determined that this disclosure requirement would have no 10-year budget impact.
Discussion
Providers are concerned about sharing their fiduciary information—including high risk banking arrangements—and government agencies have an obligation to protect and use that information only for the purposes of administering their programs. CMS could develop a process that assures providers that their information will be safeguarded.
OPTION 5.16
Expand requirements for updating enrollment records and for re-enrolling high-risk providers
OPTION 5.16A
Impose civil monetary penalties for failure to update enrollment records
All providers and suppliers are required to update their enrollment records to remain in compliance with Medicare rules. CMS uses these updates in its efforts to reduce fraud and abuse by acting on updated information such as adverse actions. CMS could improve the quality of its provider records if it sought legislation to institute civil monetary penalties for providers and suppliers who fail to update their enrollment records.
OPTION 5.16B
Require certain providers to re-enroll in Medicare more frequently than every three years
Another way for CMS to stay on top of its high-risk providers is to review their qualifications during the re-enrollment process. CMS contracts with the National Supplier Clearinghouse (NSC) to perform site visits and other enrollment functions to assure that suppliers meet Medicare enrollment standards. In studies performed in South Florida and Los Angeles County, the HHS OIG found a high rate of medical equipment suppliers that did not maintain physical facilities or were not accessible during regular business hours (HHS OIG 2011a). The HHS OIG determined that serious problems with medical equipment providers persist. CMS could strengthen its enrollment process by requiring suppliers in areas particularly vulnerable to fraud and abuse to re-enroll with NSC more frequently than every three years.
OPTION 5.16C
Require certain providers to pay an additional enrollment fee
In an effort to further prevent questionable providers and suppliers from billing Medicare, CMS has implemented a new site visit verification process. The site visit inspectors verify enrollment-related information and collect specific information based on pre-defined checklists. CMS could require payment of an additional enrollment fee if, during regular business hours, a supplier’s facility is closed or inaccessible.
Budget effects
CBO has estimated Option 5.16a (instituting civil monetary penalties on providers who do not update their enrollment records) as having no 10-year budget impact; however, the Office of Management and Budget (OMB) estimated a similar option in the President’s FY 2013 Budget at $90 million savings over 10 years (2013–2022). No cost estimate is available for Option 5.16b or Option 5.16c.
Discussion
While CMS is initiating a variety of new activities to assure that only qualified providers are enrolling in Medicare, the HHS OIG and GAO continue to report billing problems with medical equipment suppliers and other high-risk providers (HHS OIG 2011c; GAO 2012d). Adding additional requirements at a time when CMS is in the process of re-enrolling all of its providers and suppliers may put additional strains on the agency’s resources. However, given that current requirements for suppliers and other high-risk providers have not been successful in curbing billing problems, CMS could benefit from legislation and additional oversight tools that would encourage providers and suppliers to comply with Medicare rules. Providers and suppliers who are already concerned about the increased burden associated with the re-enrollment process would want assurance that these new activities were limited to egregious issues.
OPTION 5.17
Expand the use and effectiveness of surety bonds
OPTION 5.17A
Expand the types of providers subject to the surety bond requirement
In identifying ways to protect Medicare, the idea of requiring the submission of a surety bond as a condition of enrollment in Medicare has been discussed for the last 15 years. Since 2009, CMS has required medical equipment suppliers and home health agencies to obtain and submit surety bonds. The ACA extended CMS’ authority to impose surety bond requirements, consistent with an entity’s billing volume, to all Medicare providers. CMS is considering imposing a surety bond requirement on independent diagnostic testing facilities and outpatient rehabilitation facilities (GAO 2011c; GAO 2012d). To further protect Medicare, CMS could propose a rule to add additional types of at-risk providers that would be required to submit a surety bond as a condition of enrollment.
OPTION 5.17B
Follow through on surety bond collections
Although medical equipment suppliers are required to obtain and submit a surety bond in the amount of at least $50,000, CMS has yet to collect on any of these bonds as of April 2012. CMS could do more to follow through on collections from surety bond companies to recover overpayments made to medical equipment suppliers.
Budget effects
No cost estimates are available for these options. In a report issued in September 2012, the HHS OIG estimated that CMS could have recouped at least $39 million in overpayments from home health agencies over 4 years if it had implemented the rule requiring that home health providers have $50,000 surety bonds in order to participate in Medicare (HHS OIG 2012c).
Discussion
Developing clear and workable instructions to CMS’ contractors on how to pursue collection on surety bonds would be necessary before expanding the use of surety bonds. Once an effective collection process is in place, CMS could extend this requirement to other provider types. The HHS OIG also urged CMS to go a step further and raise the surety bond requirement above $50,000 for those home health providers with high Medicare payments. Requiring the use of surety bonds would guarantee CMS’ ability to recoup some portion of the overpayments made to these providers.
On the other hand, home health industry representatives assert that the process of obtaining a surety bond is costly, and surety bonds for home health agencies have not been readily available. Industry representatives also believe that if this provision were put into place, it should only apply to new home health agencies, and not those already enrolled in good standing in Medicare. Industry representatives also stated that it would most likely be more difficult for CMS to collect on the surety bonds than for CMS to simply receive a $50,000 check. The fact that CMS has been working with its MACs to develop a process to collect on surety bonds, and has not yet collected on any so far, indicates that collection may indeed be a more complicated process than would first be apparent.
OPTION 5.18
Apply a moratorium on certification of new home health agencies
Home health agencies provide services to beneficiaries who are homebound and need skilled nursing care or therapy. In 2011, about 3.4 million Medicare beneficiaries received home health services from almost 11,900 home health agencies. In 2010, Medicare spent about $19.4 billion on home health services (MedPAC 2012). There has been significant growth in the number of home health agencies participating in Medicare. The number of participating home health agencies has increased by about 430 agencies per year since 2000 when prospective payment was introduced. Much of the growth has occurred in California, Texas, and Florida. This option would apply a permanent Federal moratorium on Medicare certification of new home health agencies. An exceptions process would allow certification for new agencies in areas lacking access or choice. An alternative would be to tie the length of the moratorium to the time required to change the payment system to eliminate the potential for excess profits that attract too many agencies and for CMS to develop the capacity to assure that all certified agencies are fully capable of meeting the home health conditions of participation.
Budget effects
No cost estimate is available for this option.
Discussion
The Medicare segment of the home health industry is sizable. Many states lack certificate-of-need policies that may constrain the proliferation of unnecessary supply of home health agencies. With no evidence of access problems and considerable evidence of volume manipulation and fraudulent billing, a moratorium on new certification could help limit spending.
However, a moratorium will not eliminate the capacity of existing agencies to expand, mitigating the effect of the limit in most areas. The exceptions process will allow the entry of new home health agencies in areas not already served by multiple providers, although this process would involve administrative costs and require the development of specific approval criteria and evidence thresholds. Furthermore, a moratorium can only reinforce, not replace, the changes in payment incentives and enforcement of payment integrity that are essential to discourage inappropriate expansion of service.
The ACA provides the HHS Secretary authority to suspend payments and entry of new home health agencies in counties where there is evidence of significant fraud. MedPAC has recommended that the HHS Secretary use this authority (MedPAC 2012). While exercise of this authority would address some of the current fraudulent behavior, it would have no impact on unscrupulous providers from beginning operations in other counties.
Institute New Pre-Payment Screens for High-Risk Providers
There is widespread agreement that having strong pre-payment systems in place is a more efficient and successful approach to addressing fraud within Medicare than by identifying improper payments after they have been made. When a medical review edit reveals a billing error or claim anomaly, contractors may conduct manual pre-payment reviews, request additional medical documentation from the provider or supplier, or contact beneficiaries to verify that the services were actually provided.
In June 2011, CMS began screening all claims in traditional Medicare using its predictive modeling Fraud Prevention System. The system builds profiles of providers, networks, billing patterns, and beneficiary utilization that enable CMS to create risk scores for each provider, estimate the likelihood of fraud, and flag potentially fraudulent claims and billing patterns for more thorough review prior to releasing payment. The system automatically prioritizes claims, providers, beneficiaries, and networks that are generating the most alerts and highest risk scores. CMS is leveraging the benefits of its new system to complement, but not replace, the work of its analysts.
OPTION 5.19
Institute pre-payment reviews of certain high-risk claims
The vast majority of Medicare claims are paid quickly, within the 30-day prompt payment window, and as a result, claims are subject to limited review before they are paid. Most pre-payment reviews consist of coding validity checks and medical review conducted by computer edits. Medical record reviews by trained professionals are conducted on as few as 1 percent of all claims in the traditional program. Because there is a limit on the number of claims a particular reviewer can handle, the goal for CMS is to refine its pre-payment strategy—i.e., to identify potentially egregious claims for review while minimizing the number of “false positives” that it flags. This would reduce the burden both on providers who submit claims, and contractors who are responsible for reviewing them and making a determination about their legitimacy.
OPTION 5.19A
Institute pre-payment review for hospices with a high proportion of patients with long stays
Medicare began offering a hospice benefit in 1983. The benefit covers palliative and support services for terminally ill beneficiaries who have a life expectancy of six months or less if the terminal illness follows its normal course. More than 1.1 million Medicare beneficiaries received hospice services in 2010. According to MedPAC, in recent years, Medicare spending for hospice care has increased dramatically, reaching about $13 billion in calendar year 2010, more than quadrupling since 2000.
In a March 2012 report, MedPAC found that hospice length of stay varies considerably across providers, with a subset having much longer stays for patients of similar diagnoses as other providers (MedPAC 2012). MedPAC indicated that the increase in length of stay for patients with the longest stays is cause for concern. According to MedPAC, at the extreme, some providers may be offering hospice as a long-term care benefit rather than as an end-of-life benefit. To address this concern, CMS could implement focused medical review of hospice claims for providers with a high share of patients with stays over 180 days.
OPTION 5.19B
Institute pre-payment review on a broader selection of mobility device claims
Medicare spent about $700 million in 2011 for power wheelchairs and a CMS official estimated 80 percent were paid in error (Taylor 2012). According to the HHS OIG, erroneous payments for power wheelchairs that were not medically necessary and therefore should not have been covered by Medicare cost the program $95 million in the first half of 2007 (HHS OIG 2011b). In 2011, the HHS OIG reported that a high percentage of power wheelchair claims in its sample were not documented as medically necessary in physicians’ records, and, in some cases, physicians’ records actually contradicted suppliers’ records.
In September 2012, CMS instituted a demonstration program using prior-authorization and pre-payment review on power mobility devices in seven states. If found to be effective in reducing fraudulent and erroneous claims, CMS could perform pre-payment review of power wheelchair claims more broadly by reviewing records from sources in addition to the supplier to determine whether power wheelchairs are medically necessary.
OPTION 5.19C
Design and implement an electronic medical ordering system
Many current systems for ordering medical services lack mechanisms to determine whether the service is medically necessary or even if the patient has seen a practitioner. For example, a study published in 2010 revealed that when a clinician had to personally sign into the computer system to order a CT, MRI, or nuclear medicine examination, the incidence of inappropriate examinations that were later scheduled and performed decreased from about 5 percent to under 2 percent (Vartanians et al. 2010). To address this issue, Congress could pass legislation that would allow Medicare to create an electronic Medicare claims ordering system that required claims for high-risk services, such as medical supplier and home health, to be submitted electronically prior to payment. This could result in significant savings by preventing improper payments for claims without a certified clinician, the appropriate approval level, or proper documentation.
Budget effects
No cost estimate is available for Option 5.19a (instituting pre-payment review on hospice claims for long stays). CBO has estimated Option 5.19b (conducting pre-payment review of power mobility claims) as having no 10-year budget impact, while OMB estimated this option at $140 million in savings over 10 years (2013–2022). Both CBO and OMB estimated Option 5.19c (creating an electronic claims ordering system) as having no 10-year budget impact.
Discussion
While pre-payment review is an effective approach that creates a level of assurance that the claim is legitimate, providers see these requests for additional documentation or response to detailed questions as an additional time-consuming and costly paperwork burden. Pre-payment review also can be a challenge to CMS and its contractors who are responsible for reviewing claims that are flagged in the system. By law, Medicare must pay most claims within 30 days, which leaves relatively little time to review them to ensure that they are submitted by legitimate providers and are accurate and complete.4
Increase Post-Payment Review Activities on Suspicious Claims
CMS performs post-payment reviews of claims, meaning that medical documentation is requested for claims that have already been processed and paid. Post-payment review can be performed in cases where a high claims payment error rate and/or potential overutilization has been identified through data analysis. Post-payment review can be done at the provider’s location, or at CMS contractors’ medical review departments. Upon review of the documentation, medical review clinicians make a determination that either affirms the original payment or denies the payment in part or in full. If any part of the claim is denied, an overpayment is assessed and funds are recouped from the provider.
OPTION 5.20
Institute post-payment reviews of certain high-risk claims
OPTION 5.20A
Institute post-payment review on home health agencies with inordinately high outlier payments
Home health agencies are paid a predetermined, adjusted rate for 60-day episodes of home health care. Medicare makes additional “outlier” payments to home health agencies that supply services to beneficiaries who incur unusually high costs. The HHS OIG has reported that some geographic areas in the country contained home health agencies that accounted for an inordinately high percentage of outlier payments (HHS OIG 2011a). For example, it found that, in 2008, over 85 percent of home health providers that received outlier payments of over $100,000 per beneficiary were located in Florida’s Miami-Dade County.
To address potential fraud in the use of outlier payments, the ACA capped these payments at 10 percent of total payments per home health agency, and 2.5 percent of total aggregate home health payments. As a further step to identify potential fraud, and to assess the effectiveness of the outlier payment cap, CMS and its contractors could identify and review home health providers that exhibit aberrant outlier payment patterns and take action as appropriate..
OPTION 5.20B
Increase post-payment review on payments for chiropractic services
Medicare payment for chiropractic services is limited to active/corrective manual manipulations of the spine to correct subluxations. The chiropractor must document treatment, and when improvement is no longer possible, the service is considered maintenance and not medically necessary under Medicare rules. While chiropractors should not be submitting claims for maintenance therapy, they often do so, and many of these claims get paid. To address this issue, CMS could evaluate chiropractic billing patterns and use its predictive analytic technology to better identify maintenance and other erroneous claims that do not meet Medicare’s definition of medical necessity.
Budget effects
No cost estimates are available for these options. In a 2009 report, the HHS OIG found that Medicare inappropriately paid $178 million for chiropractic claims in 2006, representing 47 percent of claims meeting its review criteria (HHS OIG 2009).
Discussion
Post-payment review is CMS’ primary strategy for identifying patterns of potentially fraudulent billing for further investigation. Medicare post-payment reviews are extremely challenging for health care providers because an adverse determination often leads to a calculation of an overpayment based on a sample of claims that are denied, and then the sampling can be extrapolated to the universe of claims submitted by the provider. Medicare tries to recoup outstanding debt by reducing present or future Medicare payments and applying the amount withheld to the indebtedness. Post-payment reviews can be arduous and time-consuming for both the provider and CMS. And although CMS may pursue recoupment, actually collecting overpayments often is unsuccessful.
Expand Enforcement Sanctions and Penalties
CMS has a range of sanctions and penalties that it can employ in combatting fraud. For example, it can impose civil penalties, criminal penalties, and exclusions from Federal health care programs on those who engage in certain types of misconduct. ACA authorizes the imposition of several new civil monetary penalties and exclusions.
OPTION 5.21
Strengthen and expand sanctions and penalties
OPTION 5.21A
Institute intermediate sanctions for home health agencies
Home health agencies participating in Medicare must comply with 15 conditions of participation and 69 standards, many of which focus on patient care. Noncompliance with one or more conditions of participation is cause for termination from participation in the Medicare program. The HHS OIG has reported that termination is the only sanction available to CMS, and due to its severity, has rarely been used (HHS Inspector General March 2011). The Omnibus Budget Reconciliation Act of 1987 directed CMS to implement intermediate sanctions for home health agencies.
On July 13, 2012, CMS published proposed regulations establishing intermediate sanctions as an alternative to termination, which would include civil monetary penalties; suspension of payment for all new admissions and new payment episodes; temporary management of home health agencies; directed plans of correction; and directed in-service training (CMS 2012). Final rules would create an incentive for home health agencies to better comply with the conditions of participation.
OPTION 5.21B
Impose stronger penalties for theft and use of beneficiaries’ Medicare identification numbers
Theft and use of beneficiaries’ Medicare identification numbers results in a proliferation of fraudulent claims submitted to Medicare for payment and creates an inaccurate picture of the beneficiary’s claims history and health status. In an effort to protect beneficiaries from illegal distribution of their identification numbers, penalties for the unlawful distribution of Medicare beneficiary identification numbers could be strengthened.
OPTION 5.21C
Exclude providers affiliated with sanctioned entities
In reviewing a provider’s application to bill Medicare, CMS can exclude individuals who have an ownership or controlling interest in another sanctioned entity. It is not uncommon for people affiliated with that sanctioned entity to independently start a company and apply for a Medicare billing number. Congress could enact legislation to exclude individuals who are officers or managing employees of any affiliated entity from participation in Medicare if that entity was affiliated with the sanctioned entity at the time of the conduct which was the basis for its conviction or exclusion.5
Budget effects
No cost estimate is available for Option 5.21a. CBO estimated Option 5.21b (strengthening penalties for theft and use of Medicare identification numbers) as having no 10-year budget impact, and OMB also determined that this option has no 10-year budget impact. CBO estimated Option 5.21c (excluding individuals who are affiliated with a sanctioned entity) as having no 10-year budget impact. However, OMB estimated a similar option in the President’s FY 2013 Budget at $60 million savings over 10 years (2013–2022).
Discussion
Perpetrators of fraud and abuse are estimated to cost the Medicare program huge amounts of money each year. In that regard, it is hard to argue against enhanced sanctions and penalties directed at Medicare fraud and abuse. Since the government began to crack down on Medicare fraud in the early 1990s, the HHS OIG, Justice and other Federal law enforcement agencies have reported billions of dollars of recoveries and program savings. However, enforcement of fraud and abuse has generated substantial complaints from Medicare providers.
Improve Medicare Administration Through Better Contractor Oversight, Data Sharing, and Funding Levels that Maximize Return on Investment
A clear, strong, and consistent oversight program is important in ensuring that Medicare’s program integrity contractors are performing up to CMS’s standards. Different types of contractors have various roles and responsibilities, cover regions which vary in size, demographics, and activity level, and respond to different types of program integrity challenges. As a result, ensuring consistently high contractor performance requires CMS to develop specific workload and performance standards. Two other elements for a strong fraud and abuse control program are close coordination and data sharing on the part of various governmental and private agencies that have a stake in Medicare, and sufficient funding for CMS to carry out its program integrity activities.
OPTION 5.22
Establish new quantitative measures for the evaluation of Medicare contractors
As described earlier, ZPICs are replacing CMS’s Program Safeguard Contractors and will perform Medicare Parts A and B program integrity work in seven newly established geographical zones. Medicare has contracted with the National Benefit Integrity Medicare Drug Integrity Contractor (NBI MEDIC) to perform specific program integrity functions for Parts C and D. Its primary role is to identify potential fraud and abuse. But the HHS OIG found that CMS did not have an objective way to measure their performance (HHS OIG 2011d).
The HHS OIG also has found that RACs have a disincentive to refer suspected fraud to law enforcement because they are paid by contingency fees based on the amount of overpayments they collect, and referring a case as suspected fraud causes delays in recovering the RAC’s portion of the overpayment while the case is being investigated. The HHS OIG reported that between 2005 and 2008, RACs identified more than $1.03 billion in Medicare improper payments, but only referred two cases of potential fraud to CMS (HHS OIG 2010).
CMS could establish clearly defined quantitative measures to evaluate all of its contractors across common sets of standards and assure that its standards align with agency expectations. These data could allow CMS to compare and systematically access performance variation across contractors. CMS could also encourage its highest performing contractors to share their results and successful strategies with the others.
Budget effects
No cost estimate is available for this option.
Discussion
Developing sound and useful metrics for evaluating CMS’ contractors is a difficult task. After CMS determines and communicates the standards and activity levels it expects its contractors to attain, its evaluations have to reflect the different demographics and challenges that various contractors face. Oversight is made even more difficult when a company that is hired to pay claims also has a subsidiary that is submitting claims to Medicare. Numerous provider societies have raised concerns about different operational guidelines and standards among the contractors and the associated burdens on providers.
Despite these challenges, it is CMS’ responsibility to develop a sound evaluation program that measures contractors’ performance consistently, accurately, and in a timely manner. CMS needs accurate metrics to develop a risk-based contractor oversight program that maximizes resources devoted to this activity.
OPTION 5.23
Improve data sharing with other entities that have a stake in Medicare
OPTION 5.23A
Improve data sharing among various governmental entities
In 2008, beneficiaries who were dually eligible for Medicare and Medicaid represented 20 percent of the Medicare population, but 31 percent of Medicare spending (Kaiser Family Foundation 2012). Medical claims for these beneficiaries are particularly vulnerable to fraud and abuse, largely because their care is funded by both programs. As a result, providers potentially can bill both programs for the same service, or bill one or both programs when no service was provided at all.
CMS has an on-going initiative to share Medicare and Medicaid claims data to detect aberrant billing patterns that may not be evident when analyzing the data separately. However, in an April 2012 report, the HHS OIG concluded that this program produced limited results and few fraud referrals (HHS Inspector General April 2012). A report issued by the National Association of State Medicaid Directors on Federal and state data sharing in general, attributed the lack of successful results to the fact that state and Federal roles in the operation and oversight of program integrity efforts have blurred over time, creating overlap, inefficiencies, and confusion (National Association of State Medicaid Directors 2012). The report also found that existing Federal and state databases and data warehouses are not coordinated, are difficult to navigate, and present limitations in accessing valuable investigative information.
CMS could develop new avenues, and improve existing ones, for sharing claims data between Medicare and state Medicaid programs. CMS also could work with states to construct clear and workable protocols to share background checks and other information on providers who bill both programs.
OPTION 5.23B
Improve data sharing among public and private entities
Information sharing can extend beyond governmental entities, to private insurers as well. However, according to the National Health Care Anti-Fraud Association, there often is a reluctance to share information because regulators are unsure about their authority to do so (National Health Care Anti-Fraud Association 2012).
Recently, the Obama Administration announced a new voluntary, collaborative arrangement uniting public and private organizations to share information and best practices in combatting health care fraud. To build on existing momentum, CMS, the HHS OIG, and private insurers could develop more formal mechanisms to exchange information about emerging fraud schemes and trends.
Budget effects
No cost estimates are available for these options.
Discussion
Better information sharing has the potential to reduce fraud in Medicare and other public and private health care programs, and it can also improve care for Medicare patients. While there is consensus that better information sharing would enhance CMS’s efforts to identify potentially fraudulent or improper claims, there are longstanding concerns about the proper way to navigate the privacy laws that cover health care information.
OPTION 5.24
Maximize return on investment by seeking full funding for program integrity activities
The Administration’s FY 2013 budget seeks a total of $1.9 billion through both mandatory ($1.3 billion) and discretionary ($610 million) funding streams, which is allocated to the Health Care Fraud and Abuse Control and Medicare Integrity Programs. Funds from the health care fraud and abuse control account are distributed among the HHS OIG, other HHS agencies, and law enforcement partners at the Department of Justice and the Federal Bureau of Investigation. Programs supported by HCFAC mandatory funds have returned far more money to the Medicare Trust Funds than the dollars spent. Its 3-year rolling average return on investment is now 7.2 to 1. The Medicare Integrity Program return on investment averages 14 to 1, and its activities have yielded an average of almost $10 billion annually in recoveries, claims denials, and accounts receivable over the past decade.
CMS actuaries conservatively project that for every new dollar spent by HHS to combat health care fraud, about $1.50 is saved or averted. Based on these projections, the $610 million in Health Care Fraud and Abuse Control discretionary funding, as part of a multi-year investment, will yield Medicare and Medicaid savings of $5.2 billion over 5 years and $11.3 billion over 10 years.
Program integrity and anti-fraud resources increased from an estimated $0.9 billion in FY 1999 to approximately $1.9 billion in FY 2010, and the number of fraud enforcement actions for new civil and criminal actions have more than quadrupled through FY 2010 (CRS 2011). The Congressional Research Service (CRS) has reported that CMS has not done enough to identify, monitor, and report on its fraud and abuse activities, and provide sufficient detail on its funding decisions and results (CRS 2011).
Budget effects
No cost estimate is available for this option.
Discussion
Return on investment is one measure of how successfully CMS is carrying out its program integrity responsibilities and to weigh the benefits of fully funding its programs. Obtaining additional funding could be easier if it were linked to a detailed plan outlining how the funds would be used and outcomes evaluated.
Increase Efforts to Identify Fraud and Abuse in Medicare Part C (Medicare Advantage) and Part D (the Prescription Drug Program)
OPTION 5.25
Increase efforts to monitor Medicare Advantage and Part D organizations’ identification and reporting of fraud and abuse
In 2012, more than one-quarter of Medicare beneficiaries (approximately 13 million people) were enrolled in a Medicare Advantage (MA) plan and Medicare payments to these plans was $122 billion. Medicare Advantage plans also offer prescription drug coverage under Part D and the majority of people in Medicare Advantage are enrolled in Medicare Advantage drug plans. Another 19.4 million Medicare beneficiaries are enrolled in stand-alone Medicare Part D plans. CBO estimates that Part D spending was $60 billion in 2012.
While CMS requires Medicare Advantage and Part D organizations to have compliance plans that include measures to detect, correct, and prevent fraud and abuse, it does not require these organizations to report the results of their efforts to CMS. The HHS OIG reviewed data from 170 Medicare Advantage organizations that offered plans in 2009 and questioned whether all Medicare Advantage organizations are implementing their programs to effectively detect and address potential fraud and abuse (HHS OIG 2012a). Similar concerns have been raised regarding Part D plans. To reduce the potential for fraud, CMS could review Medicare Advantage and Part D organizations’ compliance plans so that all potential Part C and Part D fraud and abuse incidents are identified; develop guidance for Medicare Advantage and Part D organizations that defines what is meant by a fraud and abuse incident, and ensure that Medicare Advantage and Part D organizations are responding appropriately when they identify fraud and abuse incidents. In 2010, Part D sponsors began to voluntarily report to CMS data about their antifraud and abuse activities. CMS could finalize the mandatory self-reporting provision that it proposed.
Budget effects
No cost estimate is available for this option.
Discussion
The Medicare Advantage and Part D programs have become significant components of Medicare, both in cost and enrollment; however, prior to the HHS OIG’s 2012 report, no study had examined potential fraud and abuse identified by Medicare Advantage organizations. The HHS OIG had several recommendations for CMS to adopt a broader approach to review Medicare Advantage and Part D organizations’ antifraud efforts, including requiring all plans to report data on their antifraud activities. The HHS OIG also recommended that CMS require all Medicare Advantage and Part D plans to refer potential fraud and abuse incidents that warrant further investigation to CMS.
Revisit Physician Ownership Rules to Mitigate Over-Utilization
Numerous studies have demonstrated that physician self-referral is associated with the ordering of more services (GAO 2012b). For example, the Government Accountability Office (GAO) investigated the role of self-referral with regard to magnetic resonance imaging (MRI) and computed tomography (CT) services from 2004–2010 and found the number of self-referred MRI services increased by more than 80 percent compared with a 12 percent increase for non-self-referred MRI services. For CT services, the growth of self-referred services more than doubled, while non-self-referred CT services increased by about 30 percent.
The Ethics in Patient Referrals Act, also known as the “Stark law,” prohibits physicians from referring Medicare patients to entities with which they have a financial relationship for such services as imaging, radiation therapy, home health care, durable medical equipment, clinical lab tests, and physical therapy. The law allows for a few exceptions including cases in which the ancillary services are provided in the same office. This so-called in-office ancillary services (IOAS) exception allows physicians to provide most designated health services to patients within their own offices if the practice qualifies as a group practice. The rationale for the IOAS exception was to permit seamless and continuous patient care while supporting patient convenience to obtain services at one time and/or from a trusted source.
OPTION 5.26
Narrow the in-office ancillary services (IOAS) exception of the Stark self-referral regulation to group practices that assume financial risk
Many physician practices have bought advanced imaging and sophisticated radiation therapy equipment and brought physical therapy services into their practice; as a result, the volume of such services has grown sharply. Given the evidence of substantially increasing volume, some have suggested narrowing the exception. One option would narrow the IOAS exception to group practices that assume financial risk by participating in an ACO. This approach could be phased in over five years. An alternative, as recommended by MedPAC, would be to adopt a prior authorization program for practitioners who order a substantially larger than average number of advanced imaging services, regardless of whether they benefit financially through self-referral.
Budget effects
No cost estimate is available for this option.
Discussion
The rationale for the remaining exception to the IOAS proposed in this option is that for groups assuming financial risk, the volume-based incentives to generate unneeded services would be counter to their financial interests. Currently, risk arrangements are not available to most group practices in Medicare. However, under the Shared Savings Program and Pioneer ACO demonstration, all ACOs have to be in at least two-sided shared savings arrangements by year four, while others would receive risk-based global payments earlier. With the expected spread of ACOs, only group practices participating in these ACOs would be eligible for the remaining IOAS exception.
However, MedPAC found it difficult to craft a more limited exception that could distinguish between group practices that actually improve coordination, quality, and efficiency by decreasing fragmented care and those that meet the criteria for the exception while at the same time taking advantage of it to self-refer additional services of marginal clinical value, thereby increasing costs (MedPAC 2011). MedPAC’s alternative recommendation to adopt a prior authorization program for advanced imaging services is an attempt to limit unnecessary imaging procedures, but would not address the rapid growth of self-referral services other than imaging.
A challenging issue in implementing a policy to narrow the IOAS exception is deciding when a group has a bona fide opportunity to become a member of a high quality ACO. Another concern is that for groups which lose the IOAS exception, patients may be unnecessarily inconvenienced and in some cases choose not to follow through on a referral to a provider outside of the practice. Practices not abusing the exception and their patients could be unfairly penalized and access to care would be compromised to some extent. It is also likely that there would be opposition to this option from many providers who have not abused the IOAS exception to increase unnecessary ancillary services.
References
Click to expand/collapse
Centers for Medicare & Medicaid Services (CMS). 2012. “Medicare Program; Home Health Prospective Payment System Rate Update for Calendar Year 2013, Hospice Quality Reporting Requirements, and Survey and Enforcement Requirements for Home Health Agencies,” Federal Register, Volume 77 Issue 135, Friday, July 13, 2012.
Congressional Budget Office (CBO). 2012. Analysis of the President’s FY 2013 Budget, March 2012.
Congressional Research Service (CRS). 2011. Medicare Program Integrity: Activities to Protect Medicare from Payment Errors, Fraud, and Abuse, June 23, 2011.
Government Accountability Office (GAO). 2011a. CMS Conducted Fraud and Abuse Compliance Plan Audits, But All Audit Findings Are Not Yet Available, February 2011.
Government Accountability Office (GAO). 2011b. Improper Payments: Reported Medicare Estimates and Key Remediation Strategies, July 28, 2011.
Government Accountability Office (GAO). 2011c. Medicare and Medicaid Fraud, Waste, and Abuse: Effective Implementation of Recent Laws and Agency Actions Could Help Reduce Improper Payments, March 9, 2011.
Government Accountability Office (GAO). 2012a. Health Care Fraud: Types of Providers Involved in Medicare, Medicaid, and the Children’s Health Insurance Program Cases, September 7, 2012.
Government Accountability Office (GAO). 2012b. Higher Use of Advanced Imaging Services by Providers Who Self-Refer Costing Medicare Millions, September 28, 2012.
Government Accountability Office (GAO). 2012c. Medicare Program Integrity: CMS Continues Efforts to Strengthen the Screening of Providers and Suppliers, April 10, 2012.
Government Accountability Office (GAO). 2012d. Medicare: Progress Made to Deter Fraud, but More Could Be Done, June 8, 2012.
HHS Office of Inspector General (OIG). 2009. Inappropriate Medicare Payments for Chiropractic Services, May 2009.
HHS Office of Inspector General (OIG). 2010. Recovery Audit Contractors’ Fraud Referrals, February 2010.
HHS Office of Inspector General (OIG). 2011a. Compendium of Unimplemented Recommendations, March 2011.
HHS Office of Inspector General (OIG). 2011b. Most Power Wheelchairs in the Medicare Program Did Not Meet Medical Necessity Guidelines, July 7, 2011.
HHS Office of Inspector General (OIG). 2011c. Program Integrity Problems with Newly Enrolled Medicare Equipment Suppliers, December 2011.
HHS Office of Inspector General (OIG). 2011d. Zone Program Integrity Contractors’ Data Issues Hinder Effective Oversight, November 10, 2011.
HHS Office of Inspector General (OIG). 2012a. Medicare Advantage Organizations’ Identification of Potential Fraud and Abuse, OEI -03-10-00310, February 2012.
HHS Office of Inspector General (OIG). 2012b. The Medicare-Medicaid (Medi-Medi) Data Match Program, April 17, 2012.
HHS Office of Inspector General (OIG). 2012c. Surety Bonds Remain an Unused Tool to Protect Medicare from Home Health Overpayments, September 27, 2012.
Kaiser Family Foundation. 2012. Medicare’s Role for Dual Eligibles, April 2012.
Daniel R. Levinson, Inspector General, U.S. Department of Health and Human Services. 2012. Testimony before the Senate Finance Committee, “Anatomy of a Fraud Bust: From Investigation to Conviction,” April 24, 2012.
Medicare Payment Advisory Commission (MedPAC). 2011. Report to the Congress: Medicare and the Health Care Delivery System, June 2011.
Medicare Payment Advisory Commission (MedPAC). 2012. Report to the Congress: Medicare Payment Policy, March 2012.
National Association of State Medicaid Directors. 2012. Rethinking Medicaid Program Integrity: Eliminating Duplication and Investing in Effective, High-value Tools, March 2012.
National Health Care Anti-Fraud Association. 2012. Solutions and Suggestions for How to Better Prevent and Combat Waste, Fraud and Abuse in the Medicare and Medicaid Programs, June 2012.
Office of Management and Budget (OMB). 2012. Fiscal Year 2013 Budget of the U.S. Government: Cuts, Consolidations, and Savings, February 2012.
Deborah Taylor, Chief Financial Officer and Director, Office of Financial Management, Centers for Medicare & Medicaid Services, U.S. Department of Health and Human Services. 2012. “Eliminating Waste and Fraud in Medicare: An Examination of Prior Authorization Requirements for Power Mobility Devices,” Statement before the Senate Special Committee on Aging, 2012.
Vartan Vartanians, Christopher Sistrom, Jeffrey Weiburg, et al. 2010. “Increasing the Appropriateness of Outpatient Imaging: Effects of a Barrier to Ordering Low-yield Examination,” Radiology, June 2010.
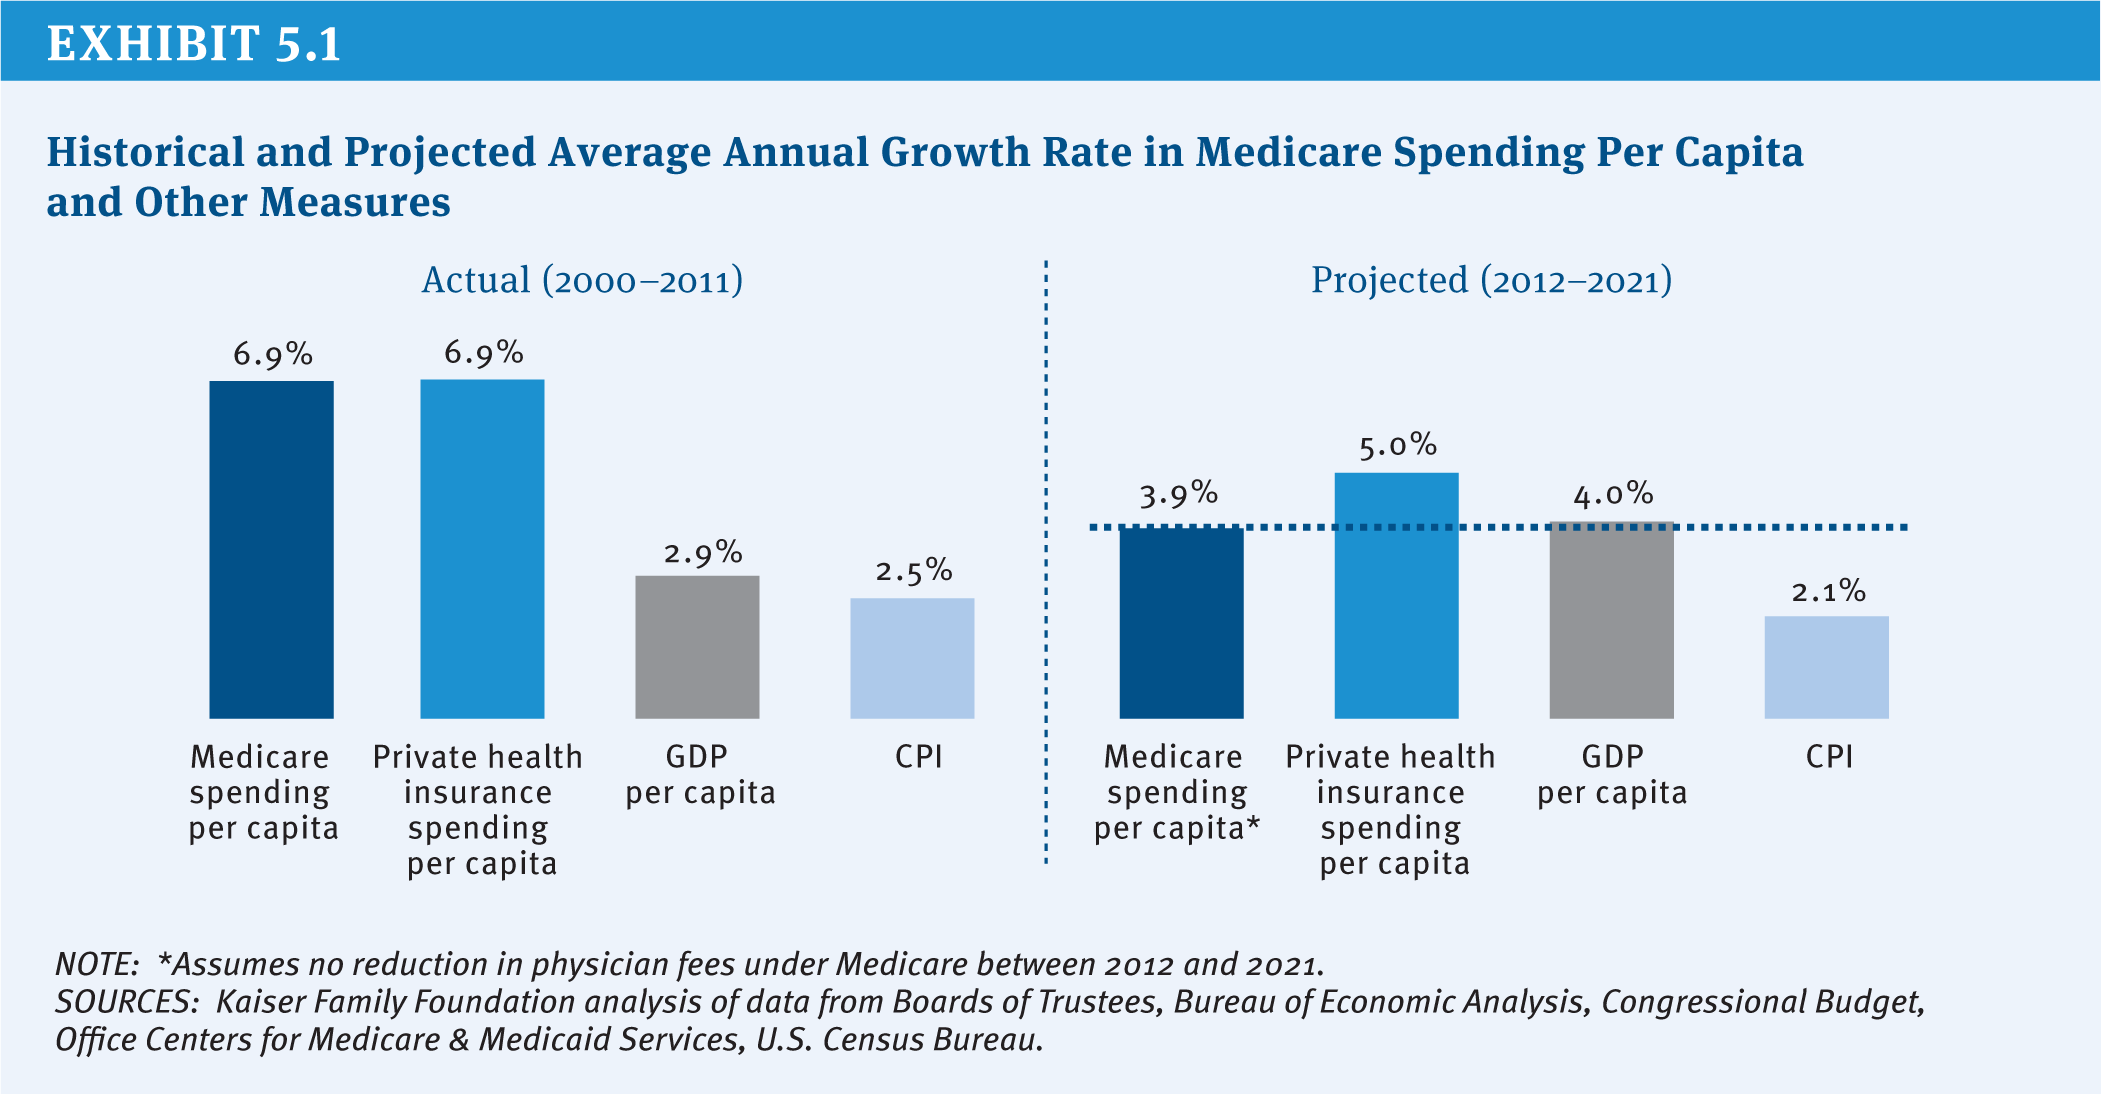
Exhibit 5.1: Historical and Projected Average Annual Growth Rate in Medicare Spending Per Capita and Other Measures
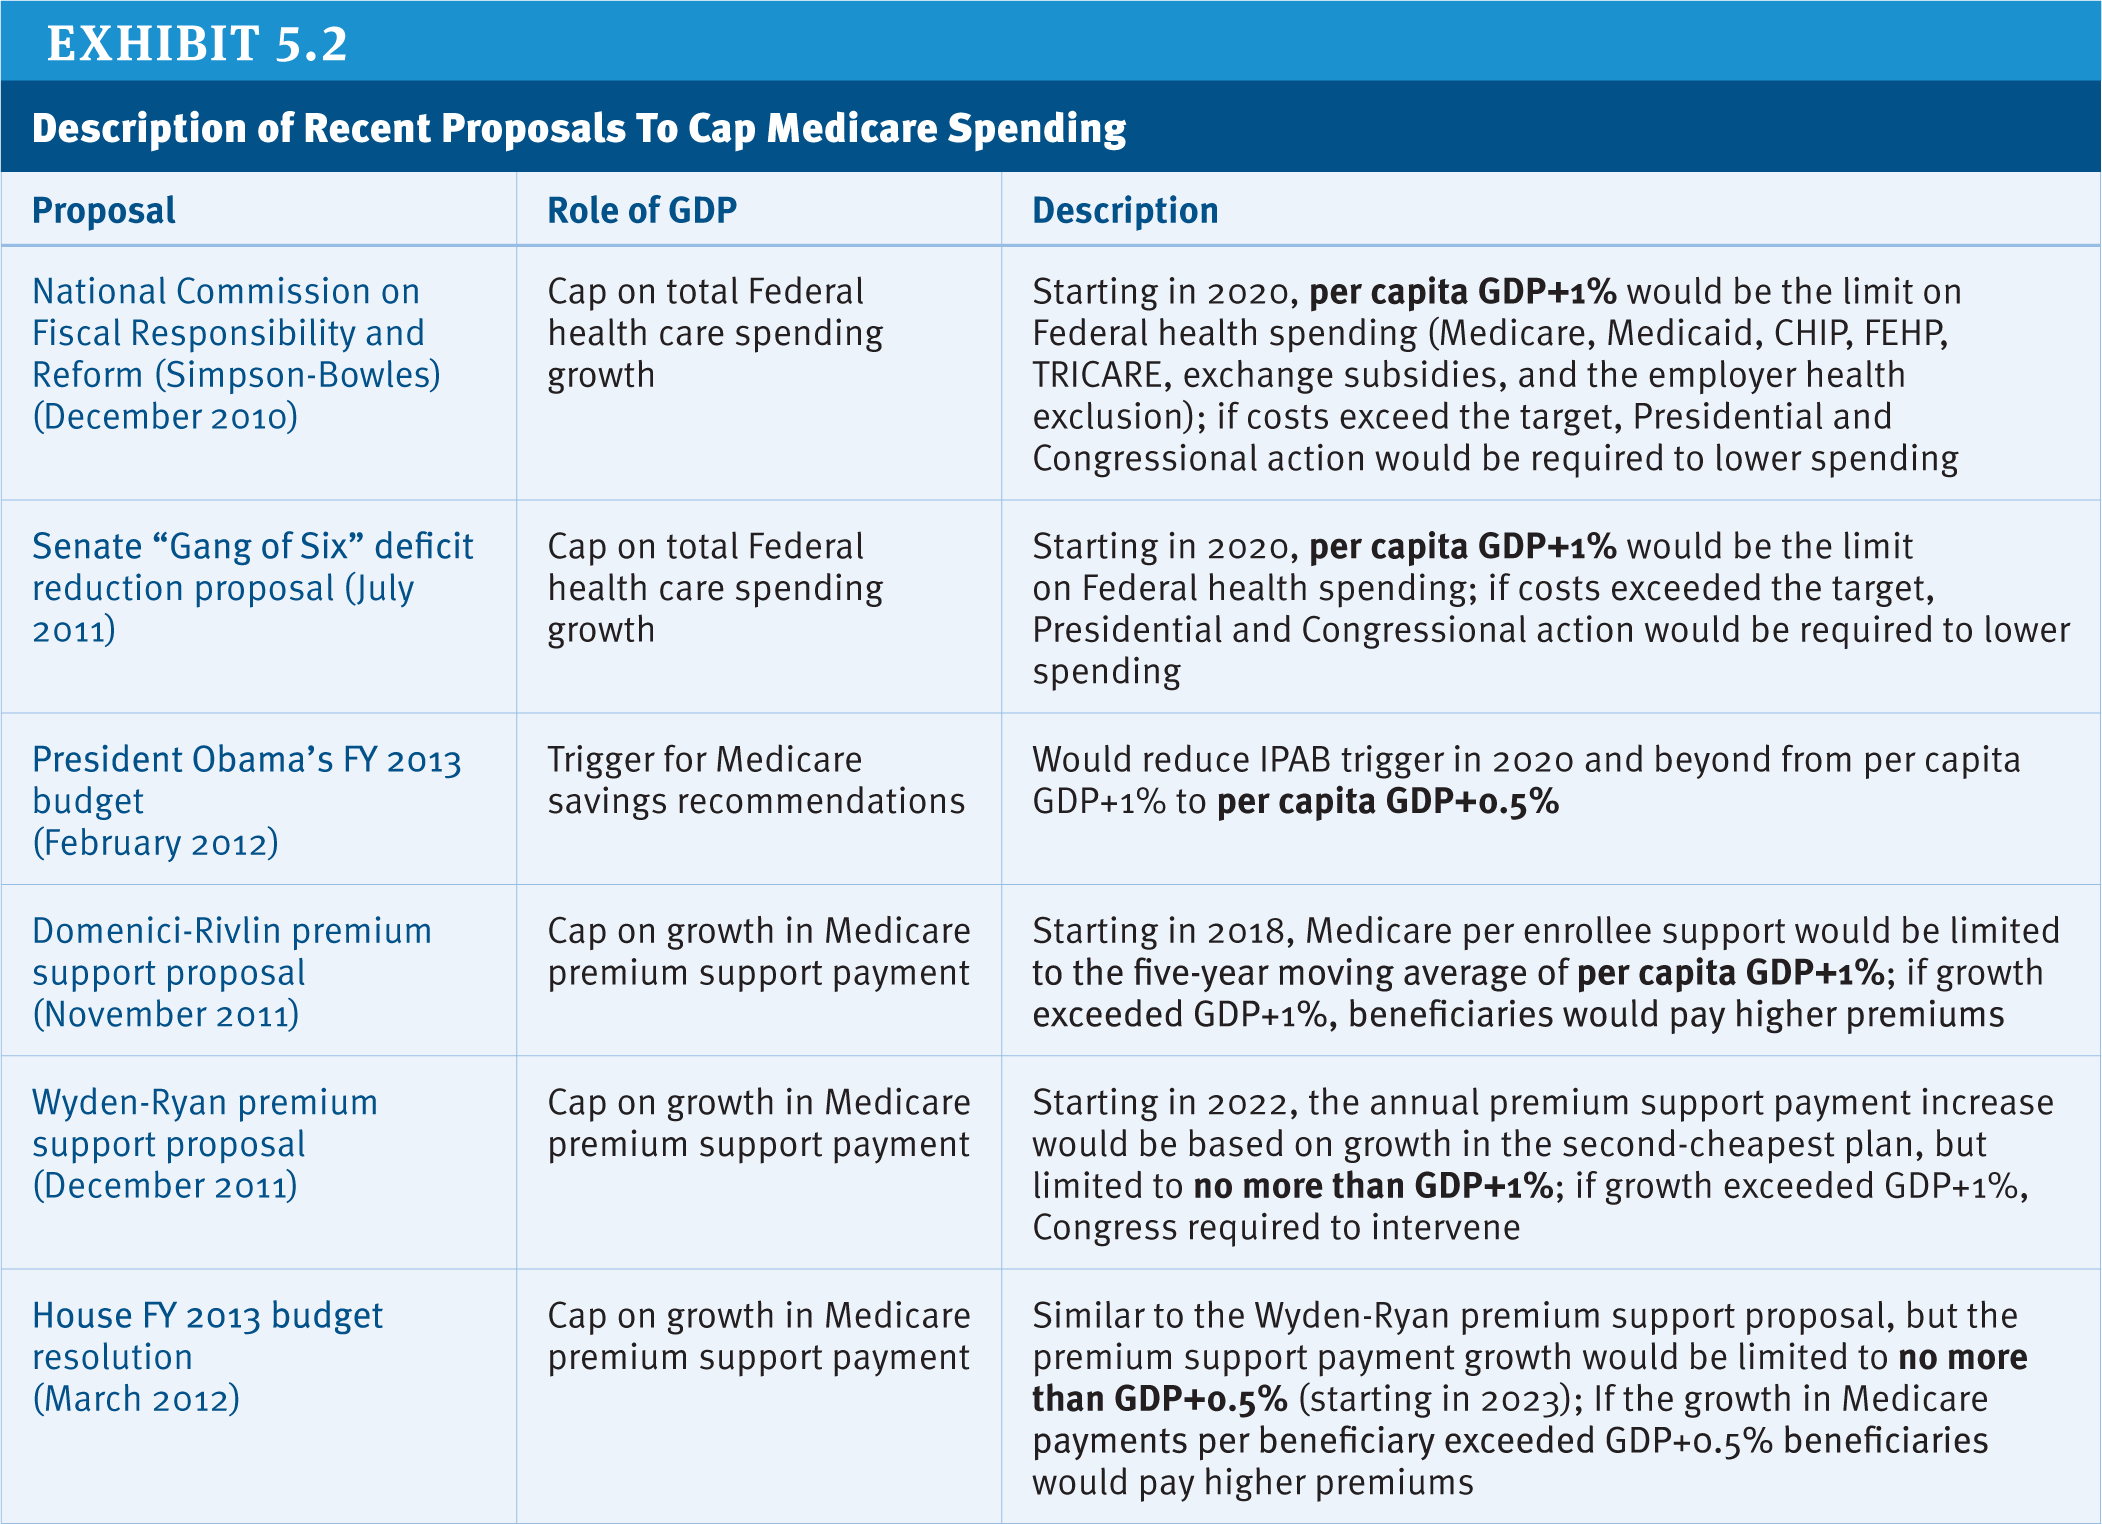
Exhibit 5.2: Description of Recent Proposals To Cap Medicare Spending
Appendices
Table of Medicare Options and Budget Effects
This table provides information about potential budget effects for the options included in this report. In general, the estimates in the table and text are from official and publicly available government sources, including publications from the Congressional Budget Office (CBO), the Medicare Payment Advisory Commission (MedPAC), the Office of Management and Budget (OMB), and the Department of Health and Human Services Office of Inspector General (HHS OIG). In a few cases, estimates from other sources are presented and noted accordingly. Estimates may differ in terms of the budget window and the year of implementation because they were drawn from different sources and published in different years. Some of these options have potential to achieve savings but do not have estimates from the official and publicly available government sources we relied on; in such cases, we note that estimates are “not available.” Some estimates were produced before subsequent changes in law, including provisions in the 2010 Affordable Care Act (ACA) and the American Taxpayer Relief Act of 2012.
References
Click to expand/collapse
Daniel Budnitz et al. 2011. “Emergency Hospitalizations for Adverse Drug Events in Older Adults,” New England Journal of Medicine, November 24, 2011.
Centers for Medicare & Medicaid Services (CMS). 2012. Competitive Bidding Update—One Year Implementation Update, April 17, 2012.
Congressional Budget Office (CBO). 2010. Effects of Using Generic Drugs on Medicare’s Prescription Drug Spending, September 2010.
Congressional Budget Office (CBO). 2011a. Cost Estimate, H.R. 5, Health Efficient, Accessible, Low-cost, Timely Healthcare (HEALTH) Act of 2011, March 10, 2011 and May 23, 2011.
Congressional Budget Office (CBO). 2011b. Cost Estimate, S. 27: Preserve Access to Affordable Generics Act, November 2011.
Congressional Budget Office (CBO). 2011c. Long-Term Analysis of a Budget Proposal by Chairman Ryan, April 5, 2011.
Congressional Budget Office (CBO). 2011d. Reducing the Deficit: Spending and Revenue Options, March 2011.
Congressional Budget Office (CBO). 2012a. Cost Estimate, H.R. 452: Medicare Decisions Accountability Act of 2011, March 2012.
Congressional Budget Office (CBO). 2012b. Estimate of the Effects of Medicare, Medicaid, and Other Mandatory Health Provisions Included in the President’s Budget Request for Fiscal Year 2013, March 2012.
Congressional Budget Office (CBO). 2012c. The Long-Term Budgetary Impact of Paths for Federal Revenues and Spending Specified by Chairman Ryan, March 2012.
Congressional Budget Office (CBO). 2012d. Medicare Baseline, March 2012.
Congressional Budget Office (CBO). 2012e. Medicare’s Payments to Physicians: The Budgetary Impact of Alternative Policies Relative to CBO’s March 2012 Baseline, July 2012.
Congressional Budget Office (CBO). 2012f. Offsetting Effects of Prescription Drug Use on Medicare’s Spending for Medical Services, November 2012.
Congressional Budget Office (CBO). 2012g. Raising the Ages of Eligibility for Medicare and Social Security. January 2012.
Congressional Budget Office (CBO). 2012h. Raising the Excise Tax on Cigarettes: Effects on Health and the Federal Budget, June 2012.
Government Accountability Office (GAO). 2012. Medicare: High-Expenditure Part B Drugs, October 12, 2012.
The Heritage Foundation. 2011. The Second Stage of Medicare Reform: Moving to a Premium Support Program, November 2011.
HHS Office of Inspector General (OIG). 2009. Inappropriate Medicare Payments for Chiropractic Services, May 2009.
HHS Office of Inspector General (OIG). 2011. Letter to Senator Herb Kohl, October 6, 2011.
HHS Office of Inspector General (OIG). 2012a. Comparison of Fourth-Quarter 2011 Average Sales Prices and Average Manufacturer Prices: Impact on Medicare Reimbursement for Second Quarter 2012, August 2012.
HHS Office of Inspector General (OIG). 2012b. Surety Bonds Remain an Unused Tool to Protect Medicare from Home Health Overpayments, September 27, 2012.
Medicare Payment Advisory Commission (MedPAC). 2010. Report to the Congress: Medicare Payment Policy, March 2010.
Medicare Payment Advisory Commission (MedPAC). 2011a. Moving Forward from the Sustainable Growth Rate (SGR) System, October 2011.
Medicare Payment Advisory Commission (MedPAC). 2011b. Report to the Congress: Medicare Payment Policy, March 2011.
Medicare Payment Advisory Commission (MedPAC). 2012a. Report to the Congress: Medicare and the Health Care Delivery System, June 2012.
Medicare Payment Advisory Commission (MedPAC). 2012b. Report to the Congress: Medicare Payment Policy, March 2012.
Medicare Payment Advisory Commission (MedPAC). 2012c. Staff presentation by Dan Zabinski and Ariel Winter, “Addressing Medicare Payment Differences Across Settings: Ambulatory Care Services,” October 4, 2012.
National Commission on Fiscal Responsibility and Reform. 2010. The Moment of Truth: Report of the National Commission on Fiscal Responsibility and Reform, December 2010.
Office of Management and Budget (OMB). 2012a. Fiscal Year 2013 Budget of the U.S. Government, February 2012.
Office of Management and Budget (OMB). 2012b. Fiscal Year 2013 Budget of the U.S. Government: Cuts, Consolidations, and Savings, February 2012.
List of Acronyms Used in This Report
ACA Affordable Care Act (see also PPACA)
ACE acute care episode
ACO accountable care organization
AHRQ Agency for Healthcare Research and Quality
ALS amyotrophic lateral sclerosis
ARC Actuarial Research Corporation
ASC ambulatory surgical center
ASP average sales price
AMP average manufacturer price
ATRA American Taxpayer Relief Act of 2012
AWP average wholesale price
BBA Balanced Budget Act of 1997
CAD coronary artery disease
CAH critical access hospitals
CAHPS Consumer Assessment of Healthcare Providers and Systems (survey)
CBO Congressional Budget Office
CCA Commonwealth Care Alliance
C-CPI chained consumer price index
CEA cost effectiveness analysis
CED coverage with evidence development
CHF congestive heart failure
CHIP Children’s Health Insurance Program
CMMI Center for Medicare & Medicaid Innovation
CMS Centers for Medicare & Medicaid Services
COLA cost of living adjustment
COPD chronic obstructive pulmonary disease
CPI consumer price index
CPI-U consumer price index for urban consumers
CPS Current Population Survey
CPT Current Procedural Terminology
CRS Congressional Research Service
CT computed tomography
CTA computed tomography angiography
DME durable medical equipment
DMEPOS durable medical equipment, prosthetics, orthotics, and supplies
DRG diagnosis related group
DSH disproportionate share hospital
D-SNP dual eligible special needs plan
EHR electronic health record
ESRD end stage renal disease
FDA Food and Drug Administration
FEHBP Federal Employees Health Benefits Program
FPL federal poverty level
FTC Federal Trade Commission
FY Fiscal Year
GAO Government Accountability Office
GDP gross domestic product
GME graduate medical education
GRACE Geriatric Resources for Assessment and Care of Elders
HCFAC Health Care Fraud and Abuse Control (program)
HEALTH Act Help Efficient, Accessible, Low-Cost, Timely Healthcare Act
HHA home health agency
HHS (Department of) Health and Human Services
HI Hospital Insurance (trust fund)
HIT health information technology
HITECH Health Information Technology for Economic and Clinical Health (Act)
HIPAA Health Insurance Portability and Accountability Act of 1996
HMO health maintenance organization
HSA hospital service area
ICU intensive care unit
IME indirect medical education
INTERACT Interventions to Reduce Acute Care Transitions
IOAS in-office ancillary services
IOM Institute of Medicine
IPAB Independent Payment Advisory Board
IRF inpatient rehabilitation facility
LCA least costly alternative
LCD Local Coverage Decision
LIS Low-Income Subsidy
LTCH long-term care hospital
LTSS long term services and supports
MA Medicare Advantage
MAC Medicare Administrative Contractor
MCBS Medicare Current Beneficiary Survey
MEDCAC Medicare Evidence Development and Coverage Advisory Committee
MEDIC Medicare drug integrity contractor
MedPAC Medicare Payment Advisory Commission
MEI Medicare Economic Index
MIP Medicare Integrity Program
MMA Medicare Modernization Act of 2003
MPRR multiple procedure payment reduction
MRA magnetic resonance angiography
MRI magnetic resonance imaging
MTM medication therapy management
NASI National Academy of Social Insurance
NBI MEDIC National Benefit Integrity Medicare Drug Integrity Contractor
NCD National Coverage Decision
NCHC National Coalition on Health Care
NCHS National Center for Health Statistics
NIH National Institutes of Health
NSC National Supplier Clearinghouse
OACT Office of the (Medicare) Actuary
OIG (HHS) Office of Inspector General
OMB Office of Management and Budget
ONC Office of the National Coordinator (for Health Information Technology)
OPD outpatient department
OPM Office of Personnel Management
PACE Program of All-inclusive Care for the Elderly
PCORI Patient Centered Outcomes Research Institute
PDP prescription drug plan
PE practice expense
PEN parenteral and enteral nutrition
PET positron emission tomography
PL Public Law
PPACA Patient Protection and Affordable Care Act (see also ACA)
PPO preferred provider organization
PPS prospective payment system
QIO Quality Improvement Organization
RAC Recovery Audit Contractor
RBRVS Resource-Based Relative Value Scale
RTI Research Triangle Institute
RUC Relative (Value) Update Committee
RVU relative value unit
SDM shared decision making
SGR Sustainable Growth Rate
SMI Supplementary Medicare Insurance (trust fund)
SNF skilled nursing facility
SNP special needs plan
SOW scope of work
SSDI Social Security Disability Insurance
TEFRA Tax Equity and Fiscal Responsibility Act of 1982
VBID value-based insurance design
VBP value-based purchasing
ZPIC Zone Program Integrity Contractor
Endnotes
Introduction
Preface and Introduction
CBO defines “excess cost growth” as the extent to which nominal health care costs per person increase at a faster rate than potential GDP per person.
Kaiser Family Foundation analysis of data from Medicare Trustees, Office of Management and Budget, Congressional Budget Office, Centers for Medicare & Medicaid Services, and U.S. Bureau of the Census.
Report
Section 1: Medicare Eligibility, Beneficiary Costs, and Program Financing
People younger than age 65 qualify for Medicare if they have received Social Security Disability Insurance payments (SSDI) payments for 24 months, or if they have end-stage renal disease (ESRD) or amyotrophic lateral sclerosis (ALS).
This option was proposed with corresponding changes in eligibility for Social Security benefits that are not discussed here.
In 2012, approximately one in four Medicare beneficiaries was enrolled in Medicare Advantage plans, which have different cost-sharing structures than traditional Medicare. Medicare Advantage plans are required to provide all Medicare-covered services, subject to requirements of actuarial equivalence, and must provide a limit on out-of-pocket spending (not to exceed $6,700).
Not all beneficiaries in traditional Medicare would face an increase in cost-sharing obligations that year because some would not be enrolled in Part B. Others would not incur medical expenses that exceed the deductible amount under current law.
Part of the motivation for eliminating the coinsurance and deductible for home health services (among other changes) in 1972 and 1980 was to reduce hospital costs and address concerns about underutilization of the home health benefit at the time (Benjamin 1993).
This broader change to the benefit package was intended to have a neutral impact overall on beneficiary cost-sharing liabilities.
Based on Kaiser Family Foundation analysis of the CMS Medicare Current Beneficiary Survey 2009 Cost and Use file.
Based on Kaiser Family Foundation analysis of the CMS Medicare Current Beneficiary Survey 2009 Cost and Use file.
Based on Kaiser Family Foundation analysis of the CMS Medicare Current Beneficiary Survey 2009 Cost and Use file.
Based on Urban Institute analysis for the Kaiser Family Foundation.
Federal and state spending on the Medicaid program would increase if Part B premiums were increased, as would Federal spending on the LIS program if Part D premiums were increased. However, state contributions to the LIS program (known as “clawback” payments) are not directly tied to the Part D premium, meaning that a Part D premium increase would not directly affect state spending.
Broad-based increases in general revenue, through income taxes or otherwise, also would contribute to the funds available to help finance the Medicare program; however, that menu of changes is not addressed here.
This estimate is the result of subtracting two separate revenue estimates from the Joint Committee on Taxation (JCT), one for $86.8 billion from the new 0.9 percent additional Medicare payroll tax alone (from the March 11, 2010 publication “Estimated Revenue Effects Of The Manager’s Amendment To The Revenue Provisions Contained In The “Patient Protection And Affordable Care Act,” As Passed By The Senate On December 24, 2009”; JCX-10-10) and one for $210.2 billion for both tax provisions combined (from the March 20, 2010 publication, “Estimated Revenue Effects Of The Amendment In The Nature Of A Substitute To H.R. 4872, The “Reconciliation Act Of 2010,” As Amended, In Combination With The Revenue Effects Of H.R. 3590, The “Patient Protection And Affordable Care Act (‘PPACA’),” As Passed By The Senate, And Scheduled For Consideration By The House Committee On Rules On March 20, 2010”; JCX-17-10); JCT did not publish a stand-alone estimate of the 3.8 percent tax provision.
The CBO estimates are all net revenue effects, which take into account revenue losses from income and payroll taxes that result when excise taxes are increased.
The Joint Committee on Taxation estimates the total revenue loss from exclusion of employer contributions for health care, health insurance premiums, and long-term care insurance premiums including cafeteria plans to be $128 billion for Fiscal Year 2011 and $725 billion for the 5-year period from 2011–2015.
Section 2: Medicare Payments to Plans and Providers
Because payment for drugs in Medicare Part A is bundled with other services delivered in institutional settings, no separate options are presented for Part A.
Spending on drugs under Part B was about $19 billion in 2010. Projected amounts are not available for 2013, but the growth trend has been modest in recent years. Estimates are not readily available for drug spending in Part A, since the costs are bundled inside the hospital prospective payment system.
Benchmark plans are PDPs with bids below a certain amount (the benchmark) that are available to LIS enrollees for no premium.
Calculated from the CMS Dashboard.
The estimate of 13 percent is based on a comparison of per-person spending for specialty drugs compared to traditional drugs, as reported by Express Scripts for its book of business (Express Scripts, Inc. 2012). Although specialty drugs are not exactly the same as biologics, this estimate is generally consistent with other estimates.
This estimate is based on combining 13 percent of Part D spending with about three-fourths of Part B spending. A separate estimate by IMS for 2011 found that 23 percent of drug spending was for biologics; see IMS Institute for Healthcare Informatics 2012.
Updates based on the market basket or Medicare economic index (MEI) rely on measures of the resource costs assumed to be required to deliver a service. CPI and C-CPI, on the other hand, have no direct relationship to production costs. They are convenient proxies for inflation and have the advantage of tracking price changes in the general economy, which rise slower than health care costs
CMS reduced ESRD payments in 2012 by up to 2 percent for facilities that did not meet the established performance standards in 2010 for three quality measures. The performance standard for each facility is the lesser of the national average performance on the measure in 2008 or that facility’s performance on each measure during 2007.
For example, savings of 0.1 percent could be realized if one percent of spending in these services is contributed to a VBP pool combined with providers’ performance failing to “earn back” 10 percent of the pool contributions.
This general approach was one element of a 1999 Breaux-Thomas Medicare reform proposal considered by the National Bipartisan Commission on the Future of Medicare, under which, among many other things, a government-run fee-for-service plan “could operate on the basis of contracts negotiated with local providers on price and performance, just as is the case with private plans” in any region “where the price control structure of the government run plan is not competitive.” The Breaux-Thomas reform proposal did not receive the minimum 11 votes needed to formally recommend it to the Congress or the President. See http://thomas.loc.gov/medicare/index.html for additional details about this commission.
Medicaid covers cost sharing for Medicare beneficiaries who are fully Medicaid eligible (“full dual eligibles”) and for other beneficiaries with incomes up to 120% of the federal poverty level.
Section 3: Delivery System Reform and Care for High-Need Beneficiaries
The Health Quality Partners program achieved net savings of $3,500 per person per year; the Washington University Hospital Program achieved net savings of $3,400 per person per year ,but only for participants who had multiple hospitalizations in the year prior to enrollment) (Peikes et al. 2012). Two other models in the Medicare Care Coordination Demonstration also reduced hospitalizations significantly, but not by enough to generate net savings to Medicare when the care coordination fee was considered (Brown et al. 2012)
Estimate reflects total spending (primarily Medicare spending); based on analysis of the CMS Medicare Current Beneficiary Survey 2008 Cost and Use file
See Institute for Healthcare Improvement Triple Aim Initiative: www.ihi.org/offerings/Initiatives/TripleAim/Pages/default.aspx
The Agency for Healthcare Research and Quality (AHRQ) has supported the development, by the American Institutes for Research and its partners, of a Hospital Guide to Patient and Family Engagement. One of the engagement strategies included is an “IDEAL” discharge effort that builds on other evidence-based discharge planning reforms, but with more focus on patient and family engagement.
See The Institute for Patient- and Family-Centered Care website: www.ipfcc.org/.
Section 4: Medicare Program Structure
Medicare Part C, also known as Medicare Advantage, is a voluntary program through which Medicare contracts with private health plans to deliver all Part A and B benefits; some MA plans also provide Part D benefits.
In contrast to traditional Medicare, all Medicare Advantage plans are required to provide an out-of-pocket spending limit on Medicare-covered services. The 2013 spending limit is not to exceed $6,700. Part D also provides a catastrophic spending limit, after which enrollees generally pay only 5 percent of drug costs.
Estimates from Kaiser Family Foundation analysis of the Centers for Medicare & Medicaid Services Medicare Current Beneficiary Survey 2009 Cost and Use file.
This discussion assumes that preventive and hospice services would continue to be exempt from cost sharing.
Unlike the option modeled by CBO, the Simpson-Bowles commission included a 5 percent coinsurance after $5,500 in out-of-pocket spending, up to a spending limit of $7,500.
The dollar savings estimate is derived by applying 0.5 percent to total Medicare outlays in 2009 of $499 billion (CBO 2010).
This option also would put in place requirements for shared decision making, with financial penalties for specialists who fail to engage beneficiaries in discussions about available treatment options.
For instance, requiring Medigap policies to charge the same premium regardless of age (also known as “community-rating”) would make it more difficult for Medigap plans to draw younger beneficiaries away from this option. A risk adjustment procedure would have a similar result by shifting resources away from plans serving relatively low-risk populations to those insuring high-risk populations. This type of plan could also charge a late enrollment penalty in order to encourage beneficiaries to enroll when they are first eligible.
Currently, beneficiaries can choose from among traditional Medicare, Medicare Advantage plans (with an average of 20 plans per market in 2013), and Part D plans (with an average of 31 plans per region in 2013) (Kaiser Family Foundation 2012b; Kaiser Family Foundation 2012c).
One study conducted by researchers Roger Feldman, Robert Coulam and Bryan Dowd suggests this approach could achieve $339 billion in savings over 10 years, based on an analysis that used the 25th percentile of plan bids to approximate the second lowest plan bids in an area (AEI 2012). Another study estimated savings of more than $700 billion over 10 years if the Federal contribution were instead tied to the lowest cost plan in an area (this also assumes repeal of the Affordable Care Act) (The Heritage Foundation 2011).
These estimates were produced prior to the enactment of the Affordable Care Act, which reduced payments to Medicare Advantage plans. Additionally, the ACA reduced payments to providers under traditional Medicare, in addition to other changes, which would result in a lower “bid” for traditional Medicare under current law.
This approach was reflected in Representative Ryan’s FY 2012 budget proposal that did not include traditional Medicare as an option (unlike Rep. Ryan’s FY 2013 budget proposal), and would have indexed Medicare payments per beneficiary to CPI-U. Under the proposal, the payment made on behalf of Medicare beneficiaries to private plans would be based on projected average per capita Medicare spending in 2022 that would be adjusted for health status, age, and income. The government contribution would then increase annually based on the CPI-U.
CBO’s alternative fiscal scenario incorporated several changes to current law that are “widely expected to occur or that would modify some provisions of law that might be difficult to sustain for a long period”, including the assumption that Medicare spending would be higher under the alternative fiscal scenario than under the extended-baseline scenario in 2022 because 1) payment rates for physicians’ services were projected to grow at the same rate as the Medicare economic index rather than at the lower rates of the sustainable growth rate mechanism, and 2) several policies that would restrain spending were assumed not to be in effect after 2020.
Section 5: Medicare Program Administration
This bipartisan task force, co-chaired by former Senate Budget Committee Chairman Pete Domenici (R-NM) and Alice Rivlin, former Clinton Budget Director, Congressional Budget Office Director and Vice Chair of the Federal Reserve, was launched in January 2010 by the Bipartisan Policy Center to develop a long-term plan to place the U.S. on a sustainable fiscal path.
While this report focuses on Medicare, this option presumes that CMS would become an independent agency, with its responsibilities continuing to include Medicare, Medicaid, and CHIP; implementation of ACA insurance reforms and Exchanges; and associated programs.
Discretionary spending requires the Congress to pass an annual appropriations bill, typically for a fixed period (usually a year). On the other hand, mandatory spending refers to spending enacted by law, but not dependent on an annual or periodic appropriations bill.
The ACA broadened CMS’ authority to suspend Medicare payments to a provider when there is a “credible allegation of fraud” unless there is “good cause not to suspend payments.” This provision gives CMS much more leverage to obtain settlements, as the suspension of payments to a provider could mean all or most of the provider’s Medicare cash flow would cease until an investigation is resolved.
This proposal was first introduced as H.R. 675 “Strengthening Medicare Anti-Fraud Measures Act of 2011” proposed by Rep. Wally Herger (R-CA) on February 2, 2011 with 30 co-sponsors.