Medicaid Enrollment & Spending Growth: FY 2017 & 2018
States adopted budgets for state fiscal year (FY) 2018 as Congress debated legislative proposals that created a lot of uncertainty about the future of the Affordable Care Act (ACA), financing for the Medicaid expansion as well as overall financing for the Medicaid program. The federal debate was playing out as states grappled with other Medicaid budget issues related to the economy, health care costs, implementation of delivery system reforms, and addressing emerging public health issues like the opioid epidemic. This brief discusses Medicaid enrollment and spending trends for FY 2017 and FY 2018 based on interviews and data provided by state Medicaid directors as part of the 17th annual survey of Medicaid directors in all 50 states and the District of Columbia. The survey was conducted by the Kaiser Family Foundation (KFF) and Health Management Associates (HMA) from June 2017 to August 2017, during the same timeframe that Congress was debating legislative proposals with significant implications for Medicaid. Key findings are described below and in a companion report. The methodology used to calculate enrollment and spending growth as well as additional information about Medicaid financing can be found at the end of the brief.
FY 2017: Following peaks in enrollment and spending growth in 2015 due to the implementation of the ACA, Medicaid enrollment growth slowed to 2.7 percent nationally in FY 2017, down from 3.9 percent in FY 2016 (Figure 1). Total spending growth was stable at 3.9 percent, up only slightly from 3.5 percent the previous year. State Medicaid spending experienced a slight uptick from 2.4 percent in FY 2016 to 3.5 percent in FY 2017, as states that implemented the Medicaid expansion started to pay 5 percent of the costs of those enrollees in January 2017 (mid-way through the state fiscal year). However, state spending growth for Medicaid was slower than overall state general fund growth in FY 2017.

Figure 1: Medicaid enrollment growth continues to slow in FY 2017 and FY 2018; however, states project an uptick in spending in FY 2018.
FY 2018: For FY 2018, states on average project Medicaid enrollment growth to dip to 1.5 percent and total spending to increase by 5.2 percent. States attributed slower enrollment growth projections to tapering ACA related enrollment, a stable economy, and the processing of delayed redeterminations. States pointed to high cost prescription drugs and policy decisions to increase payment rates for specific provider groups as factors contributing to higher projected spending growth. Growth in the state share of Medicaid spending is expected to be slightly higher on average than for total spending due to formula-driven FMAP changes (that occur based on lagged personal income data) and, in 32 expansion states, the full-year effect of the state share for expansion enrollees, which increases from 5 percent to 6 percent in January 2018.
Future Outlook: States indicated that they could face budget challenges as reductions to disproportionate share hospital payments go into effect in October 2017, if Congress fails to reauthorize the Children’s Health Insurance Program (CHIP) and if legislative proposals under consideration to restructure Medicaid financing were to be enacted into law. As states started FY 2018 and looking ahead, many were concerned about volatility in state revenues that affects states ability to finance the state share of Medicaid.
Context
Medicaid provided coverage to about one in five Americans, or about 74 million as of June 2017.1 Total Medicaid spending was $553 billion in FY 2016 with 63 percent paid by the federal government and 37 percent by states.2 Medicaid accounts for one in six dollars spent in the health care system, but more than 50 percent of long-term care spending and 10 percent of prescription drug spending.3 The key factors affecting total Medicaid spending and enrollment changes over the last decade have been the lingering effects of The Great Recession followed by the implementation of the Affordable Care Act (ACA). As of September 2016, 32 states including DC have adopted the ACA Medicaid expansion, with Louisiana implementing at the beginning of FY 2017. Under the law, the federal government provided 100 percent of the cost of expansion for calendar years 2014-2016, gradually phasing down to 95 percent in CY 2017, 94 percent in CY 2018, 93 percent in CY 2019, and 90 percent in CY 2020 and beyond.
Medicaid enrollment and spending growth are counter-cyclical, influenced by broader changes in the economy. For example, during and after the “Great Recession,” which began in 2008, states experienced high unemployment and major declines in revenue along with significant increases in Medicaid enrollment and spending. The U.S. unemployment rate peaked at 10 percent in October 2009. With economic recovery, the unemployment rate has gradually declined to 4.4 percent in August 2017, relieving pressure on Medicaid enrollment growth. In FY 2016, aggregate state general fund spending and revenues surpassed peak levels from 2008 in real terms (after adjusting for inflation).4 However, recent analysis of revenues shows slow state revenue growth in 2016 and volatility in revenues at the start of 2017. Changes in income tax revenue may be related to shifts in the timing of payment of these taxes in anticipation of lower tax rates in 2017 from federal tax reform legislation. Sales tax revenue was weak at the start of 2017 and corporate tax revenues were declining (Figure 2).5
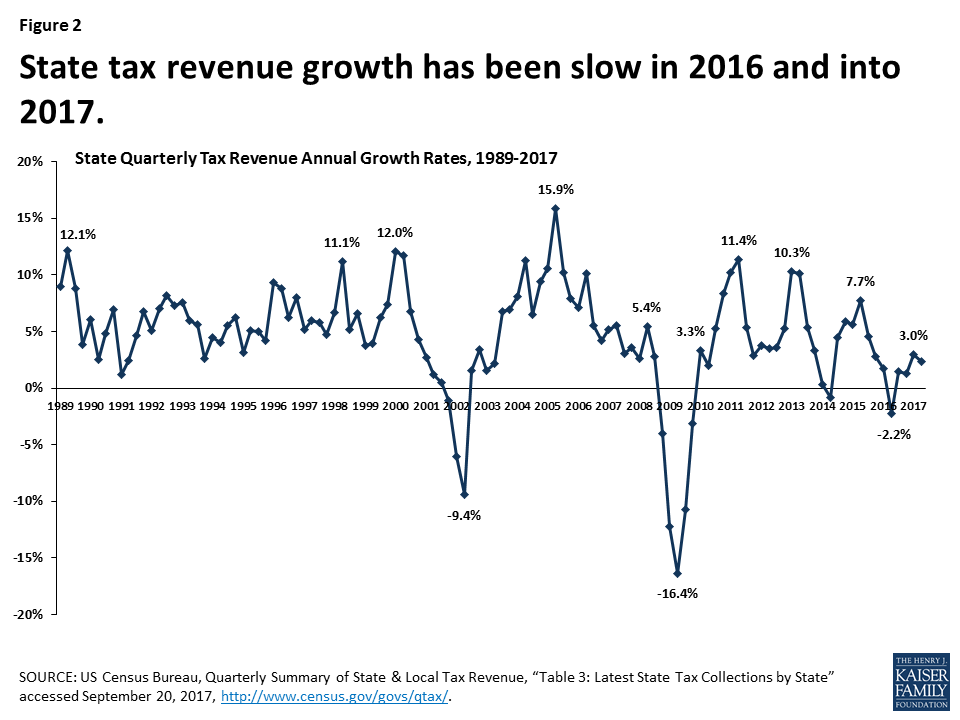
Figure 2: State tax revenue growth has been slow in 2016 and into 2017.
Underneath the national trends is a lot of state variation. Unemployment rates range from below three percent in North Dakota, Colorado, Hawaii, New Hampshire, Nebraska, and Idaho to higher than six percent in New Mexico, the District of Columbia, and Alaska. The Rockefeller Institute estimates total state tax revenue growth of 2 percent for FY 2017 based on three quarters of data. Thirty-eight states reported growth in the first three quarters of FY 2017, while twelve states reported declines, with the greatest declines in North Dakota and Wyoming. Declines in oil prices have resulted in declines in state tax revenue in oil dependent states. Recent hurricanes in Texas and Florida are expected to result in fiscal issues for those states in the months to come.6
Key Findings
Trends Through FY 2017
Medicaid enrollment growth continued to slow in FY 2017 and spending growth was stable. Historically, Medicaid enrollment drives growth in in Medicaid spending, and enrollment increases during economic downturns or major policy changes (Figure 3). High growth in FY 2015 was due to the implementation of the ACA and recent trends in FY 2016 and FY 2017 reflect the tapering of ACA related enrollment and the delayed effects of improvements in the economy. A number of states noted that the resolution of eligibility redetermination as new systems came online also contributed to slowing enrollment growth.
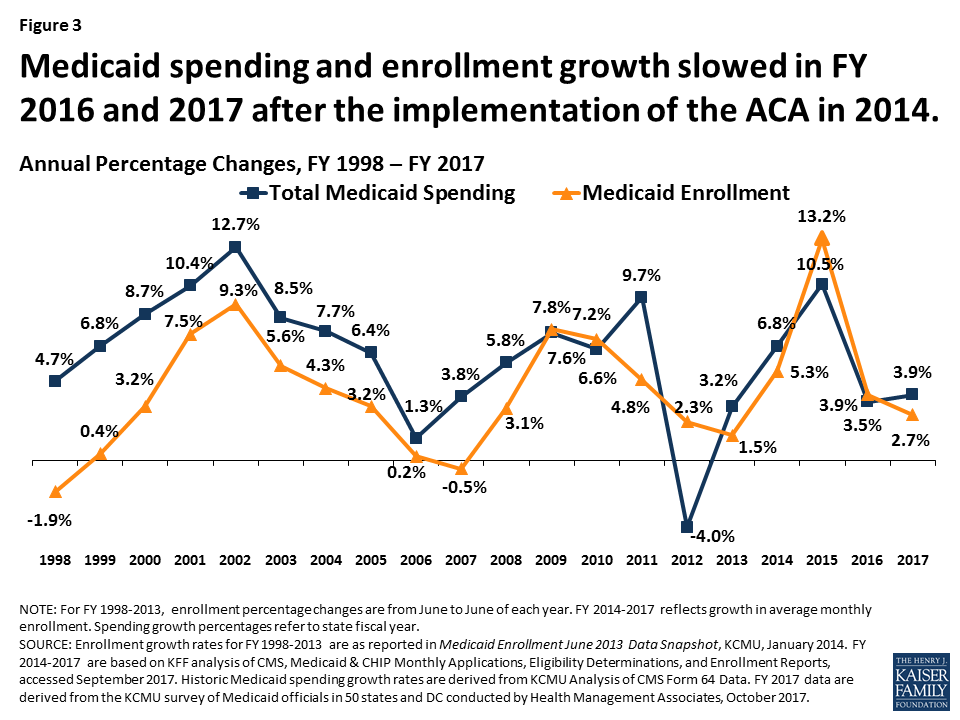
Figure 3: Medicaid spending and enrollment growth slowed in FY 2016 and 2017 after the implementation of the ACA in 2014.
Slower enrollment growth trends along with efforts to control costs due to budget pressures contributed to lower total spending growth. Slower state revenue growth in FY 2017 added pressure on states to control Medicaid costs. Medicaid officials identified the high costs for prescription drugs, especially for specialty drugs, as well as policy decisions to increase payment rates to specific provider groups as factors putting upward pressures on total Medicaid spending.
State spending growth experienced an uptick in FY 2017 as expansion states were required to start paying for a share of new adults. Historically, total spending and the state share of Medicaid spending grow in tandem except when there have been changes in federal match rate. Following the implementation of the ACA, state spending growth was lower than total spending growth because the federal government was paying 100 percent of the costs of the expansion group. Mid-way through FY 2017, expansion states began to pay 5 percent of the costs of the new group that resulted in slightly higher state spending growth compared to FY 2016; however the rate of growth for state Medicaid spending (3.5 percent) was still below growth for total Medicaid spending (3.9 percent). State spending growth for Medicaid was lower than overall state general fund growth in FY 2017 of 4.8 percent (Figure 4).
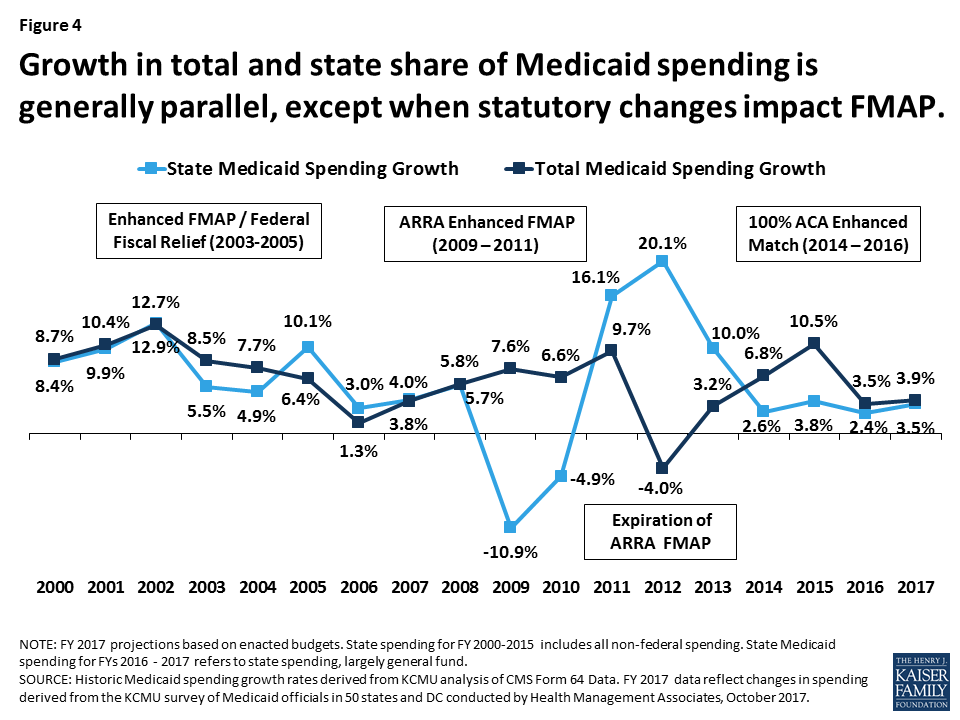
Figure 4: Growth in total and state share of Medicaid spending is generally parallel, except when statutory changes impact FMAP.
Projections for FY 2018
States project low enrollment growth and higher spending growth in FY 2018. For FY 2018, states project that enrollment growth will slow, while total spending growth will increase. While this trend is not typical, this has occurred in the past, particularly a few years after an economic downturn as enrollment continues to trend downward and spending trends up as states restore rate or benefit cuts. For FY 2018 several factors account for the differential in enrollment and spending growth. A sluggish but stable economy may contribute to slower enrollment growth, and states are no longer seeing the increases associated with the implementation of the ACA. A number of states reported that new eligibility systems were able to process backlogs and delayed redeterminations that also resulted in downward enrollment growth. Factors driving higher spending growth include faster growth in the aged and disabled enrollment groups that account for a larger share of program spending, high cost prescription drugs, and provider rate increases. In addition, high growth projected in a few large states drives the national weighted average higher. (Figure 5)
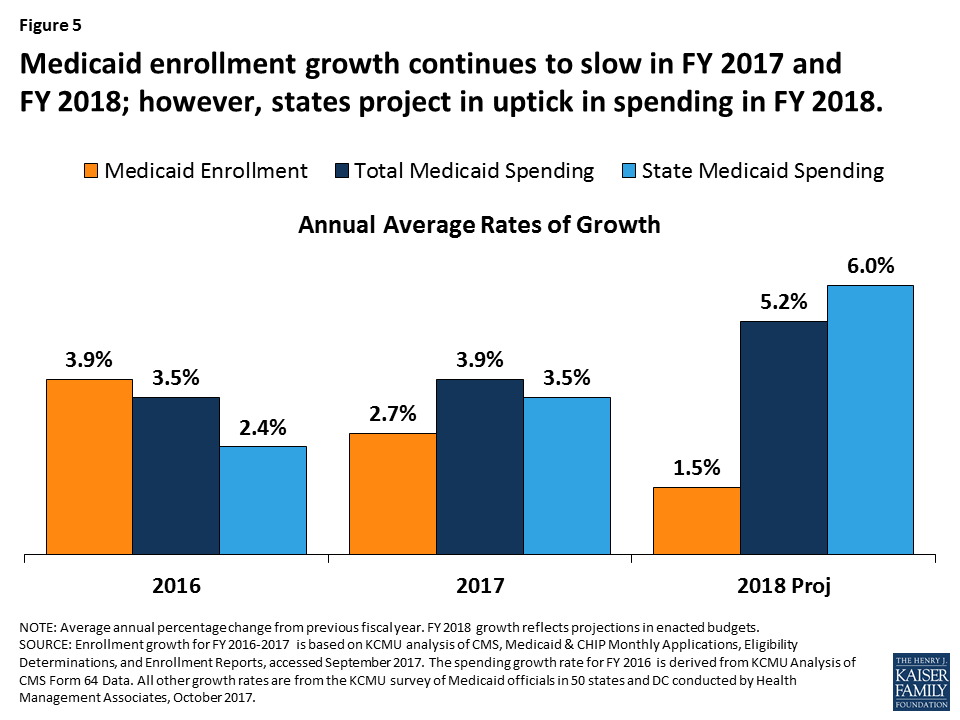
Figure 5: Medicaid enrollment growth continues to slow in FY 2017 and
FY 2018; however, states project in uptick in spending in FY 2018.
State spending growth in FY 2018 is expected to slightly exceed total spending growth in FY 2018 due to traditional FMAP changes and phase-in of the state share of Medicaid for the expansion. Twelve states had reductions in the formula driven FMAP for Medicaid which would increase state spending relative to total spending. Kansas, Indiana, and Oklahoma saw reductions in their FMAP of more than 1 percent. The federal match rate (or FMAP) is calculated annually for each state using a formula set in the statute that relies on lagged personal income data. Even small changes in a state’s FMAP can mean large changes in the amount of state funds needed to maintain current programs. In addition, starting in January 2017, expansion states paid five percent of the costs of the new adult group. Since this was implemented part-way into FY 2017, the full effects of the increase will be experienced in FY 2018. The state share for the expansion group will increase from 5 percent to 6 percent for calendar 2018 (Figure 4).
Nearly all states are counting on Congressional action to reauthorize CHIP to avoid budget shortfalls that could have implications for Medicaid. Nearly all (48 of 50) responding states (including DC) assumed continuation of federal CHIP funding in their FY 2018 state budgets. In addition, 34 of 42 responding states assumed that this funding would continue with the 23 percentage point enhanced federal match that was included in the ACA. Nearly two-thirds of states did not budget for scheduled reductions in Medicaid disproportionate share (DSH) payments. While DSH reductions were originally scheduled to go into effect in FY 2014, legislation delayed the reductions to federal FY 2018 (October 1, 2017). CMS released a proposed rule to allocate the $2 billion DSH reduction in July 2017.7
Conclusion and Looking Ahead
As states began the 2018 state fiscal year much was in flux and much uncertainty remains. Revenues were volatile and states were facing major uncertainty about the outcome of federal legislation that would repeal and replace the ACA and fundamentally change the financing structure of Medicaid; both would reduce federal funding for states to operate their Medicaid programs. However, the recent legislative debate highlighted how difficult it is to gain consensus on major changes to Medicaid and the ACA, that these changes have significant implications for individuals as well as states and providers, and that Medicaid has broad general support and intense support from special populations served by the program. The debate also highlighted how current flexibility in the design and structure of the Medicaid program has resulted in variation across states, made greater by state decisions about whether to implement the ACA Medicaid expansion. In addition, health status, demographic and state fiscal circumstance further complicate proposals to impose per enrollee caps or uniform growth rates across all states.
Looking ahead, the federal budget for FY 2018, legislation to improve ACA market stability and other efforts to reform the tax code may open the door to additional debate around Medicaid and its role. Other changes without legislation are likely to occur through administrative actions that change Medicaid through approval new waivers and regulations. Other administrative changes to the Marketplace could also have potential implications for Medicaid. Finally, emergency assistance to provide relief to states and territories hit hardest by recent hurricanes as well as for efforts to address the opioid epidemic could bring additional resources to some states. All of these legislative and administrative actions could have implications for state budgets and the Medicaid program in FY 2018 and beyond.