2017 Employer Health Benefits Survey
The Kaiser Family Foundation and the Health Research & Educational Trust (Kaiser/HRET) conduct this annual survey of employer-sponsored health benefits. HRET, a nonprofit research organization, is an affiliate of the American Hospital Association. The Kaiser Family Foundation designs, analyzes, and conducts this survey in partnership with HRET, and also funds the study. Kaiser contracts with researchers at NORC at the University of Chicago (NORC) to work with the Kaiser and HRET researchers in conducting the study. Kaiser/HRET retained National Research, LLC (NR), a Washington, D.C.-based survey research firm, to conduct telephone interviews with human resource and benefits managers using the Kaiser/HRET survey instrument. From January to June 2017, NR completed full interviews with 2,137 firms.
SURVEY TOPICS
The survey includes questions on the cost of health insurance, health benefit offer rates, coverage, eligibility, enrollment patterns, premium contributions,4 employee cost sharing, prescription drug benefits, retiree health benefits, and wellness benefits.
Kaiser/HRET asks each participating firm as many as 400 questions about its largest health maintenance organization (HMO), preferred provider organization (PPO), point-of-service (POS) plan, and high-deductible health plan with a savings option (HDHP/SO).5 We treat exclusive provider organizations (EPOs) and HMOs as one plan type and report the information under the banner of “HMO”; if an employer sponsors both an HMO and an EPO, they are asked about the attributes of the plan with the larger enrollment. Similarly, starting in 2013, plan information for conventional (or indemnity) plans was collected within the PPO battery. Less than one percent of firms that completed the PPO section had more enrollment in a conventional plan than in a PPO plan. Firms with 50 or more workers were asked: “Does your firm offer health benefits for current employees through a private or corporate exchange?” Employers were still asked for plan information about their HMO, PPO, POS and HDHP/SO plan regardless of whether they purchased health benefits through a private exchange or not.
Firms are asked about the attributes of their current plans during the interview. While the survey’s fielding period begins in January, many respondents may have a plan whose 2017 plan year has not yet begun [Figure M.1]. In some cases, plans may report the attributes of their 2016 plans and some plan attributes (such as HSA deductible limits) may not meet the calendar year regulatory requirements.
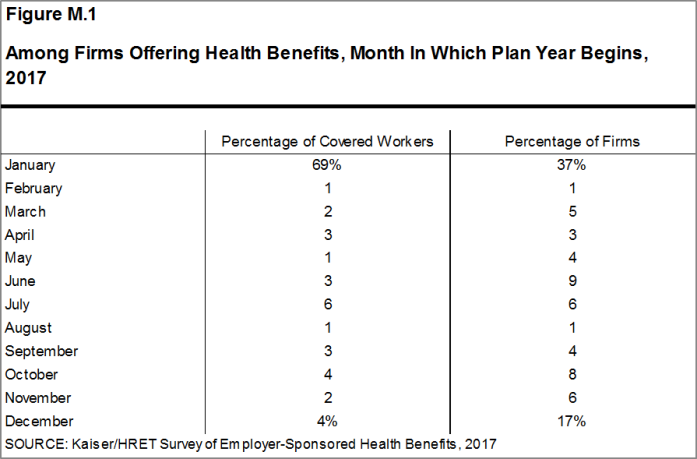
Figure M.1: Among Firms Offering Health Benefits, Month In Which Plan Year Begins, 2017
RESPONSE RATE
After determining the required sample from U.S. Census Bureau data, Kaiser/HRET drew its sample from a Survey Sampling Incorporated list (based on an original Dun and Bradstreet list) of the nation’s private employers and from the Census Bureau’s Census of Governments list of public employers with three or more workers. To increase precision, Kaiser/HRET stratified the sample by ten industry categories and six size categories. Kaiser/HRET attempted to repeat interviews with prior years’ survey respondents (with at least ten employees) who participated in either the 2015 or the 2016 survey, or both. Firms with 3-9 employees are not included in the panel to minimize the impact of panel effects on the offer rate statistic. As a result, 1,427 of the 2,137 firms that completed the full survey also participated in either the 2015 or 2016 surveys, or both.6 The overall response rate is 33%.7 Response rates are calculated using a CASRO method, which accounts for firms that are determined to be ineligible in its calculation. Beginning in 2012, the calculation of the response rates was adjusted to be slightly more conservative than previous years.
While the Kaiser/HRET survey similar to other employer and household surveys has seen a general decrease in response rates over time, the decrease between the 2016 and 2017 response rates is not solely explained by this trend. In order to improve statistical power among sub-groups, including small firms and those with a high share of low income workers, the size of the sample was expanded from 5,732 in 2016 to 7,895 in 2017. As a result, the 2017 survey includes 204 more completes than the 2016 survey. While this generally increases the precision of estimates (for example, a reduction in the standard error for the offer rate from 2.2% to 1.8%), it has the effect of reducing the response rate. In 2017, non-panel firms had a response rate of 17%, compared to 62% for firms that had participated in one of the last two years.
To increase response rates, firms with 3-9 employees were offered an incentive for participating in the survey. A third of these firms were sent a $5 Starbucks gift card in the advance letter, a third were offered an incentive of $50 in cash or as a donation to a charity of their choice after completing the full survey, and a third of firms were offered no incentive at all. Our analysis does not show significant differences in responses to key variables among these incentive groups.
The vast majority of questions are asked only of firms that offer health benefits. A total of 1,832 of the 2,137 responding firms indicated they offered health benefits. The response rate for firms that offer health benefits is also 33%.
We asked one question of all firms in the study with which we made phone contact but where the firm declined to participate. The question was “Does your company offer a health insurance program as a benefit to any of your employees?”. A total of 3,938 firms responded to this question (including 2,137 who responded to the full survey and 1,801 who responded to this one question). These responses are included in our estimates of the percentage of firms offering health benefits.8 The response rate for this question is 61%.
Beginning in 2014, we collected whether firms with a non-final disposition code (such as a firm that requested a callback at a later time or date) offered health benefits. By doing so we attempt to mitigate any potential non-response bias of firms either offering or not offering health benefits on the overall offer rate statistic. In 2017, 640 of the 1,801 firm responses that solely answered the offer question were obtained through this pathway.
FIRM SIZE CATEGORIES AND KEY DEFINITIONS
Throughout the report, figures categorize data by size of firm, region, and industry. Unless otherwise specified, firm size definitions are as follows: small firms: 3 to 199 workers; and large firms: 200 or more workers. Figure M.2 shows selected characteristics of the survey sample. A firm’s primary industry classification is determined from Survey Sampling International’s (SSI) designation on the sampling frame and is based on the U.S. Census Bureau’s North American Industry Classification System (NAICS). A firm’s ownership category and other firm characteristics used in figures such as 3.3 and 6.22 are based on respondents’ answers. While there is considerable overlap in firms in the “State/Local Government” industry category and those in the “public” ownership category, they are not identical. For example, public school districts are included in the service industry even though they are publicly owned.
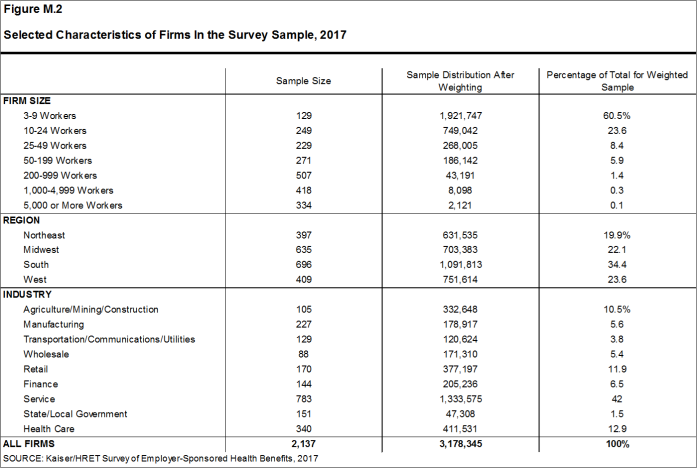
Figure M.2: Selected Characteristics of Firms In the Survey Sample, 2017
Figure M.3 presents the breakdown of states into regions and is based on the U.S Census Bureau’s categorizations. State-level data are not reported both because the sample size is insufficient in many states and we only collect information on a firm’s primary location rather than where all workers may actually be employed. Some mid- and large-size employers have employees in more than one state, so the location of the headquarters may not match the location of the plan for which we collected premium information.
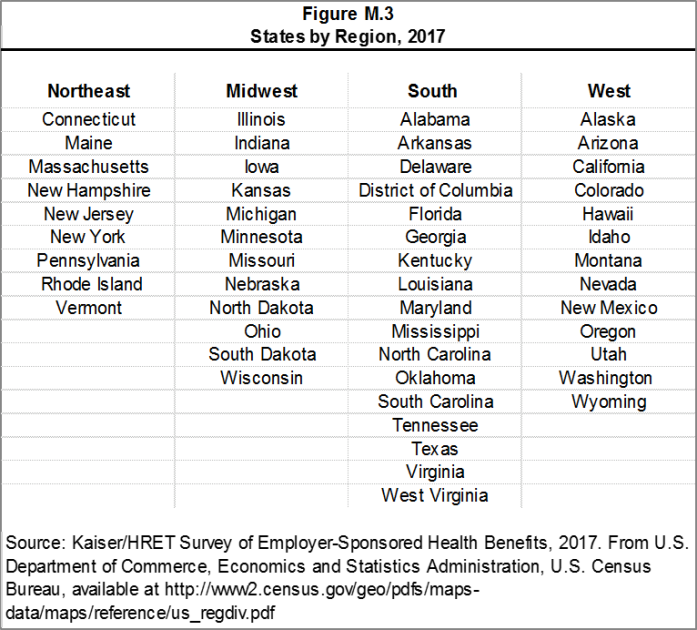
Figure M.3: States by Region, 2017
Figure M.4 displays the distribution of the nation’s firms, workers, and covered workers (employees receiving coverage from their employer). Among the three million firms nationally, approximately 60.5% employ 3 to 9 workers; such firms employ 7.8% of workers, and 3.1% of workers covered by health insurance. In contrast, less than one percent of firms employ 5,000 or more workers; these firms employ 35.5% of workers and 39.9% of covered workers. Therefore, the smallest firms dominate any statistics weighted by the number of employers. For this reason, most statistics about firms are broken out by size categories. In contrast, firms with 1,000 or more workers are the most influential employer group in calculating statistics regarding covered workers, since they employ the largest percentage of the nation’s workforce.
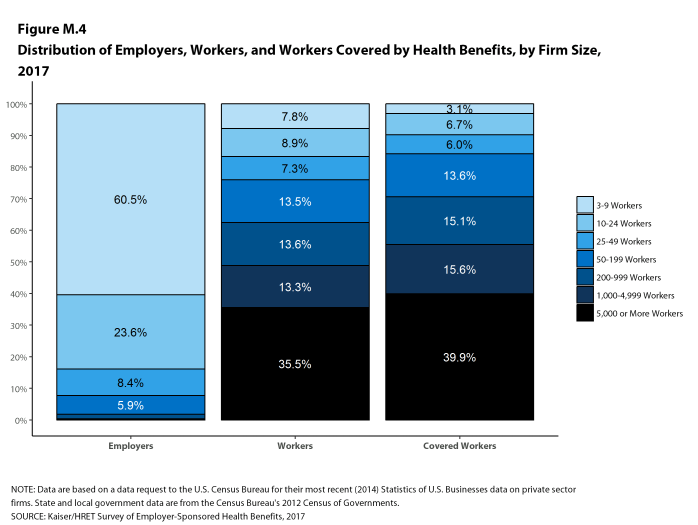
Figure M.4: Distribution of Employers, Workers, and Workers Covered by Health Benefits, by Firm Size, 2017
Throughout this report, we use the term “in-network” to refer to services received from a preferred provider. Family coverage is defined as health coverage for a family of four.
The survey asks firms what percentage of their employees earn less than a specified amount in order to identify the portion of a firm’s workforce that has relatively low wages. This year, the income threshold is $24,000 per year for lower-wage workers and $60,000 for higher-wage workers. These thresholds are based on the 25th and 75th percentile of workers’ earnings as reported by the Bureau of Labor Statistics using data from the Occupational Employment Statistics (OES) (2016).9 The cutoffs were inflation-adjusted and rounded to the nearest thousand. Prior to 2013, wage cutoffs were calculated using the now-eliminated National Compensation Survey.
ROUNDING AND IMPUTATION
Some figures in the report do not sum to totals due to rounding. In a few cases, numbers from distribution figures may not add to the numbers referenced in the text due to rounding. Although overall totals and totals for size and industry are statistically valid, some breakdowns may not be available due to limited sample sizes or a high relative standard error. Where the unweighted sample size is fewer than 30 observations, figures include the notation “NSD” (Not Sufficient Data). Estimates with high relative standard errors are reviewed and in some cases not published. Many breakouts by subsets may have a large standard error, meaning that even large differences are not statistically different. Statistics among small firms and those weighted by the number of firms tend to have more variability.
To control for item nonresponse bias, Kaiser/HRET imputes values that are missing for most variables in the survey. On average, 5% of observations are imputed. All variables are imputed following a hotdeck approach. The hotdeck approach replaces missing information with observed values from a firm similar in size and industry to the firm for which data are missing. In 2017, there were eleven variables where the imputation rate exceeded 20%; most of these cases were for individual plan level statistics. When aggregate variables were constructed for all of the plans, the imputation rate was usually much lower. There are a few variables that Kaiser/HRET has decided not to impute; these are typically variables where “don’t know” is considered a valid response option (for example, the percentage of workers respondents believe are covered by Medicaid). Some variables are imputed based on their relationship to each other. For example, if a firm provided a worker contribution for family coverage but no premium information, a ratio between the family premium and family contribution was imputed and then the family premium was calculated. In addition, there are several variables in which missing data are calculated based on respondents’ answers to other questions (for example, employer contributions to premiums are calculated from the respondent’s premium and the worker contribution to premiums).
Since 2014, we estimate separate single and family coverage premiums for firms that provide premium amounts as the average cost for all covered workers, instead of differentiating between single and family coverage. This method more accurately accounts for the portion that each type of coverage contributes to the total cost for the one percent of covered workers who are enrolled at firms affected by this adjustment.
SAMPLE DESIGN
We determined the sample requirements based on the universe of firms obtained from the U.S. Census Bureau. Prior to the 2010 survey, the sample requirements were based on the total counts provided by Survey Sampling Incorporated (SSI) (which obtains data from Dun and Bradstreet). Since 2010, we define Education as a separate sampling category for the purposes of sampling, rather than as a subgroup of the Service category. In the past, Education firms were a disproportionately large share of Service firms. Education is controlled for during post-stratification, and adjusting the sampling frame to also control for Education allows for a more accurate representation of both the Education and Service industries.
In past years, both private and government firms were sampled from the Dun and Bradstreet database. Beginning in 2009, Government firms were sampled from the 2007 Census of Governments. This change was made to eliminate the overlap of state agencies that were frequently sampled from the Dun and Bradstreet database. The sample of private firms is screened for firms that are related to state/local governments, and if these firms are identified in the Census of Governments, they are reclassified as government firms and a private firm is randomly drawn to replace the reclassified firm. The federal government is not included in the sample frame.
Finally, the data used to determine the 2017 Employer Health Benefits Survey sample frame include the U.S. Census’ 2013 Statistics of U.S. Businesses and the 2012 Census of Governments. At the time of the sample design (December 2016), these data represented the most current information on the number of public and private firms nationwide with three or more workers. As in the past, the post-stratification is based on the most up-to-date Census data available (the 2014 update to the Census of U.S. Businesses was purchased during the survey fielding period).
WEIGHTING AND STATISTICAL SIGNIFICANCE
Because Kaiser/HRET selects firms randomly, it is possible through the use of statistical weights to extrapolate the results to national (as well as firm size, regional, and industry) averages. These weights allow us to present findings based on the number of workers covered by health plans, the number of total workers, and the number of firms. In general, findings in dollar amounts (such as premiums, worker contributions, and cost sharing) are weighted by covered workers. Other estimates, such as the offer rate, are weighted by firms. Specific weights were created to analyze the HDHP/SO plans that are offered with a Health Reimbursement Arrangement (HRA) or that are Health Savings Account (HSA)-qualified. These weights represent the proportion of employees enrolled in each of these arrangements.
Calculation of the weights follows a common approach. We trimmed the weights in order to reduce the influence of weight outliers. First, we grouped firms into size and offer categories of observations. Within each strata, we identified the median and the interquartile range of the weights and calculated the trimming cut point as the median plus six times the interquartile range (M + [6 * IQR]). Weight values larger than this cut point are trimmed to the cut point. In all instances, very few weight values were trimmed. Finally, we calibrated the weights to U.S. Census Bureau’s 2014 Statistics of U.S. Businesses for firms in the private sector, and the 2012 Census of Governments as the basis for calibration / post-stratification for public sector firms. Historic employer-weighted statistics were updated in 2011.
In 2017, weights were not adjusted using the nonresponse adjustment process described in previous years’ methods. As in past years, Kaiser/HRET conducted a small follow-up survey of those firms with 3-49 workers that refused to participate in the full survey. Based on the results of a McNemar test, we were not able to verify that the results of the follow-up survey were comparable to the results from the original survey. In 2010 and 2015, the results of the McNemar test were also significant and we did not conduct a nonresponse adjustment.
Between 2006 and 2012, only limited information was collected on conventional plans. Starting in 2013, information on conventional plans is collected under the PPO section and therefore, the covered worker weight is representative of all plan types for which the survey collects information.
The survey collects information on physician office visits for each plan type. Different plan types at the same firm may have different cost-sharing structures (e.g., copayments or coinsurance). Because the composite variables (using data from across all plan types) are reflective of only those plans with that provision, separate weights for the relevant variables were created in order to account for the fact that not all covered workers have such provisions. As discussed below, changes in the 2017 survey have reduced the number of variable-specific weights used.
To account for design effects, the statistical computing package R and the library package “survey” were used to calculate standard errors.10,11 All statistical tests are performed at the .05 confidence level, unless otherwise noted. For figures with multiple years, statistical tests are conducted for each year against the previous year shown, unless otherwise noted. No statistical tests are conducted for years prior to 1999.
Statistical tests for a given subgroup (firms with 25-49 workers, for instance) are tested against all other firm sizes not included in that subgroup (all firm sizes NOT including firms with 25-49 workers, in this example). Tests are done similarly for region and industry; for example, Northeast is compared to all firms NOT in the Northeast (an aggregate of firms in the Midwest, South, and West). However, statistical tests for estimates compared across plan types (for example, average premiums in PPOs) are tested against the “All Plans” estimate. In some cases, we also test plan-specific estimates against similar estimates for other plan types (for example, single and family premiums for HDHP/SOs against single and family premiums for HMO, PPO, and POS plans); these are noted specifically in the text. The two types of statistical tests performed are the t-test and the Wald test. The small number of observations for some variables resulted in large variability around the point estimates. These observations sometimes carry large weights, primarily for small firms. The reader should be cautioned that these influential weights may result in large movements in point estimates from year to year; however, these movements are often not statistically significant. Standard Errors for most key statistics are available in a technical supplement available at http://www.kff.org/ehbs.
2017 SURVEY
In 2017, we continued to make revisions to how the survey asks employers about their prescription drug coverage. In most cases, information reported in Prescription Drug Benefits (Section 9) is not comparable with previous years’ findings. Over time, plans have developed more complex benefit designs. In order to better capture information on specialty drugs, we elected to ask about these drugs separately from the cost sharing on other tiers. We modified the question about the number of tiers a firm’s cost-sharing structure has to ask specifically about tiers that do not exclusively cover specialty drugs. Average copayment and coinsurance values are still reported among workers with three or more tiers, two tiers, or the same cost sharing regardless of drug class, but none of these tiers includes cost sharing for tiers that exclusively cover specialty drugs. Forty-five percent of firms with drug coverage cover specialty drugs but do not have a tier that only covers this class of drugs. In these cases, cost sharing among specialty drugs is still captured with the plan’s other drug classes.
Figures 9.1 and 9.2 report the distribution of cost-sharing structures including any tiers for specialty drugs. This analysis adds the number of tiers the firm reported by any tiers they may have for specialty drugs. Therefore, a firm with two tiers and a tier exclusively for specialty drugs is considered a three tier plan in this analysis, but a two tier plan when reporting average cost sharing values. Even if a firm has multiple specialty-only tiers, we collect information on only one.
Similar to 2016, we no longer require that a firm’s cost-sharing tiers be sequential, meaning that the second tier copayment was higher than the first tier, the third tier was higher than the second, and the fourth was higher than the third. As drug formularies have become more intricate, many firms have minimum and maximum amounts attached to their copayments and coinsurance, leading us to believe it was no longer appropriate to assume that a firm’s cost sharing followed this sequential logic.
To reduce the length of survey, in several areas, including stoploss coverage for self-funded firms and cost sharing for hospital admissions, outpatient surgery, and emergency room visits, we revised the questionnaire to ask respondents about the attributes of their largest health plan rather than each plan type they may offer. This expands on the method we used for prescription drug coverage in 2016. Therefore, for these topics, aggregate variables represent the attributes of the firm’s largest plan type, and are not a weighted average of all of the firms plan types. In previous surveys, if a firm had two plan types, one with a copayment and one with a coinsurance for hospital admissions, the covered worker weight was allotted proportionally toward the average copayment and coinsurance based on the number of covered workers with either feature. With of this change, comparison among plans types is now a comparison of firms where any given plan type is the largest. The change only affects firms that have multiple plan types (58% of covered workers). After reviewing the responses and comparing them to prior years where we asked about each plan type, we find that the information we are receiving is similar to responses from previous years. For this reason, we will continue to report our results for these questions weighted by the number of covered workers in responding firms.
Starting in 2017, respondents were allowed to volunteer that their plans did not cover outpatient surgery or hospital admissions. Less than 1% of respondents indicated that their plan did not include coverage for these services. Cost sharing for hospital admissions, outpatient surgery and emergency room visits was imputed by drawing a firm similar in size and industry within the same plan type.
In 2017, HSA-qualified health plans are not allowed to have separate per-person deductibles below the minimum family deductible ($2,600 in 2017). Some firms reported per-person deductibles below this limit; in these cases, firms were re-contacted, and in some instances, respondents confirmed these responses. We elected not to edit these deductibles to the legal minimum.
Beginning in 2017, values below 3% are not shown on graphical figures to improve the readability of those graphs. The underlying data for all estimates presented in graphs is available at http://www.kff.org/ehbs.
Annual inflation estimates are usually calculated from April to April. The 12 month percentage change for May to May was 2%.12
HISTORICAL DATA
Data in this report focus primarily on findings from surveys jointly authored by the Kaiser Family Foundation and the Health Research & Educational Trust, which have been conducted since 1999. Prior to 1999, the survey was conducted by the Health Insurance Association of America (HIAA) and KPMG using a similar survey instrument, but data are not available for all the intervening years. Following the survey’s introduction in 1987, the HIAA conducted the survey through 1990, but some data are not available for analysis. KPMG conducted the survey from 1991-1998. However, in 1991, 1992, 1994, and 1997, only larger firms were sampled. In 1993, 1995, 1996, and 1998, KPMG interviewed both large and small firms. In 1998, KPMG divested itself of its Compensation and Benefits Practice, and part of that divestiture included donating the annual survey of health benefits to HRET.
This report uses historical data from the 1993, 1996, and 1998 KPMG Surveys of Employer-Sponsored Health Benefits and the 1999-2016 Kaiser/HRET Survey of Employer-Sponsored Health Benefits. For a longer-term perspective, we also use the 1988 survey of the nation’s employers conducted by the HIAA, on which the KPMG and Kaiser/HRET surveys are based. The survey designs for the three surveys are similar.
Published: September 19th, 2017. Last Updated: 2017-09-14
- HDHP/SO premium estimates do not include contributions made by the employer to Health Savings Accounts or Health Reimbursement Arrangements.↩
- HDHP/SO includes high-deductible health plans with a deductible of at least $1,000 for single coverage and $2,000 for family coverage and that offer either a Health Reimbursement Arrangement (HRA) or a Health Savings Account (HSA). Although HRAs can be offered along with a health plan that is not an HDHP, the survey collected information only on HRAs that are offered along with HDHPs. For specific definitions of HDHPs, HRAs, and HSAs, see the introduction to Section 8.↩
- In total, 139 firms participated in 2015, 274 firms participated in 2016, and 1,014 firms participated in both 2015 and 2016.↩
- Response rate estimates are calculated by dividing the number of completes over the number of refusals and the fraction of the firms with unknown eligibility to participate estimated to be eligible. Firms determined to be ineligible to complete the survey are not included in the response rate calculation.↩
- Estimates presented in Figures 2.1, 2.2, 2.3, 2.4, 2.5, and 2.26 are based on the sample of both firms that completed the entire survey and those that answered just one question about whether they offer health benefits.↩
- General information on the OES can be found at http://www.bls.gov/oes/oes_emp.htm#scope. A comparison between the OES and the NCS is available at https://www.bls.gov/opub/mlr/2013/article/lettau-zamora.htm↩
- Analysis of the 2011 survey data using both R and SUDAAN (the statistical package used prior to 2012) produced the same estimates and standard errors.↩
- A supplement with standard errors for select estimates can be found online at Technical Supplement: Standard Error Tables for Selected Estimates, http://ehbs.kff.org↩
- Bureau of Labor Statistics, Consumer Price Index, U.S. City Average of Annual Inflation (April to April), 2000-2017; [cited 2017 July 21] http://data.bls.gov/timeseries/CUUR0000SA0?output_view=pct_1mth↩