Medicare Part D: A First Look at Prescription Drug Plans in 2017
Part D Plan Availability
In 2017, beneficiaries across the country continue to have a substantial number of Part D plan choices.
- The average beneficiary will have a choice of 22 PDPs in 2017, down from 26 in 2016 and 55 at the peak in 2007 (Figure 1).1 This count includes two plans per region that are under sanction and thus not open to new enrollment. In 2016, beneficiaries had access to 16 Medicare Advantage prescription drug plans, on average.
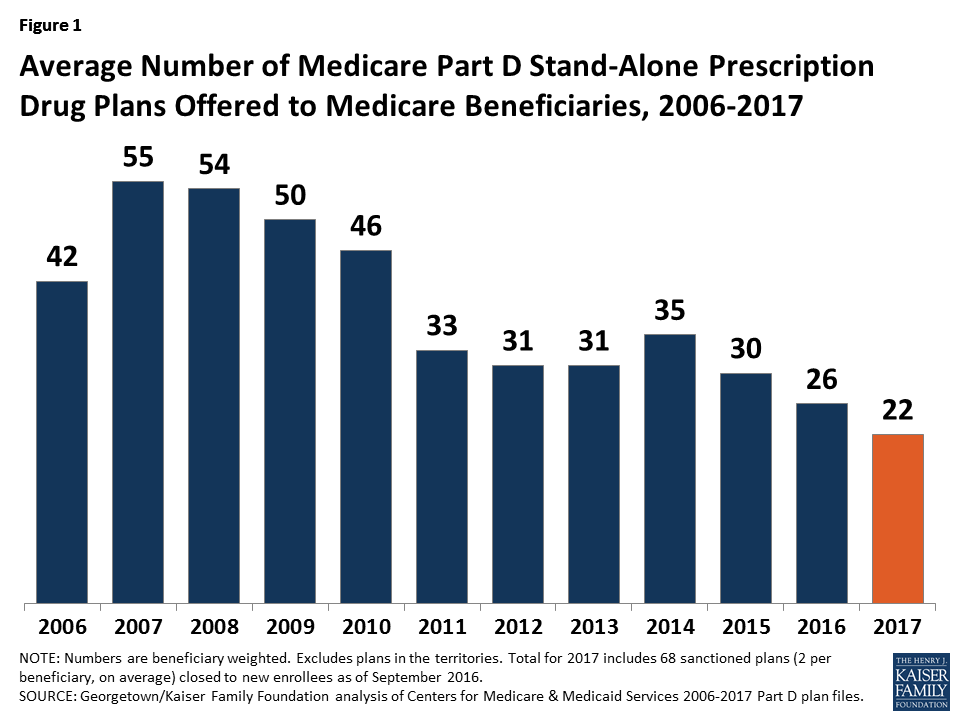
Figure 1: Average Number of Medicare Part D Stand-Alone Prescription Drug Plans Offered to Medicare Beneficiaries, 2006-2017
- The number of PDPs per region in 2017 will range from a low of 18 PDPs in Alaska to a high of 24 PDPs in five regions (Figure 2; Appendix 1, Table A1). The number of plans is lower in every region compared to 2016; the largest reduction in 2017 (six PDPs) is in South Carolina, the smallest (one PDP) is in Alaska.
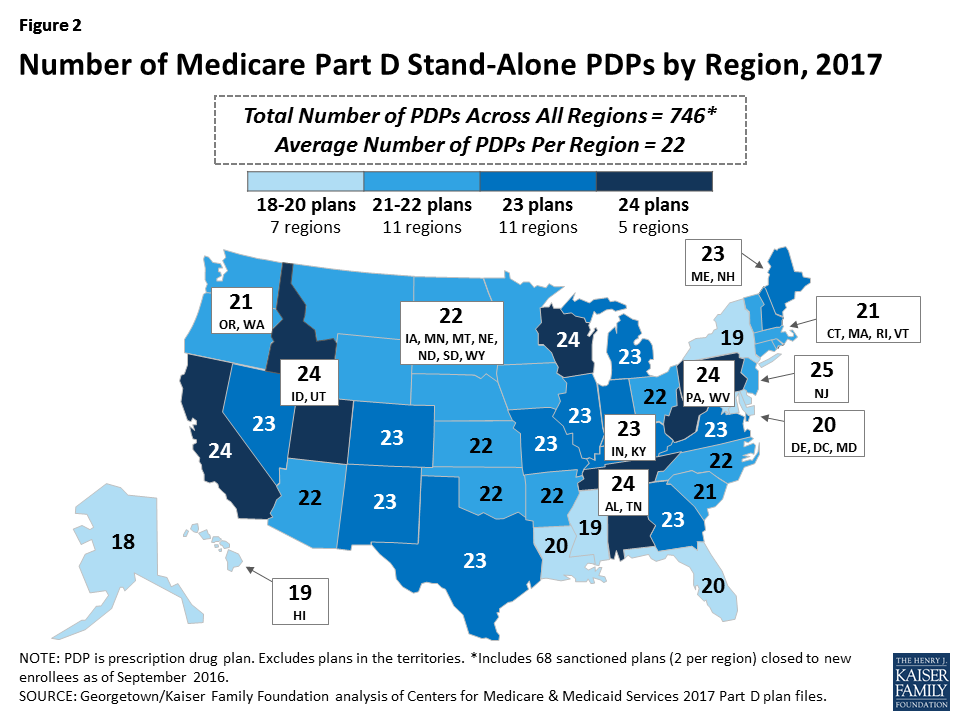
Figure 2: Number of Medicare Part D Stand-Alone PDPs by Region, 2017
- A total of 746 PDPs will be offered nationwide in 2017, down by 16 percent from the 886 PDPs offered in 2016 and the lowest number of PDPs in the program’s history (Figure 3). The total number of PDPs in 2017 represents less than half the number offered at the peak level of 1,875 plans in 2007. The reduction in plan availability over time reflects both the cumulative effect of mergers among plan sponsors and the response to CMS policies that encourage plan sponsors to eliminate low-enrollment plans and to drop multiple PDPs that are not meaningfully different from each other.
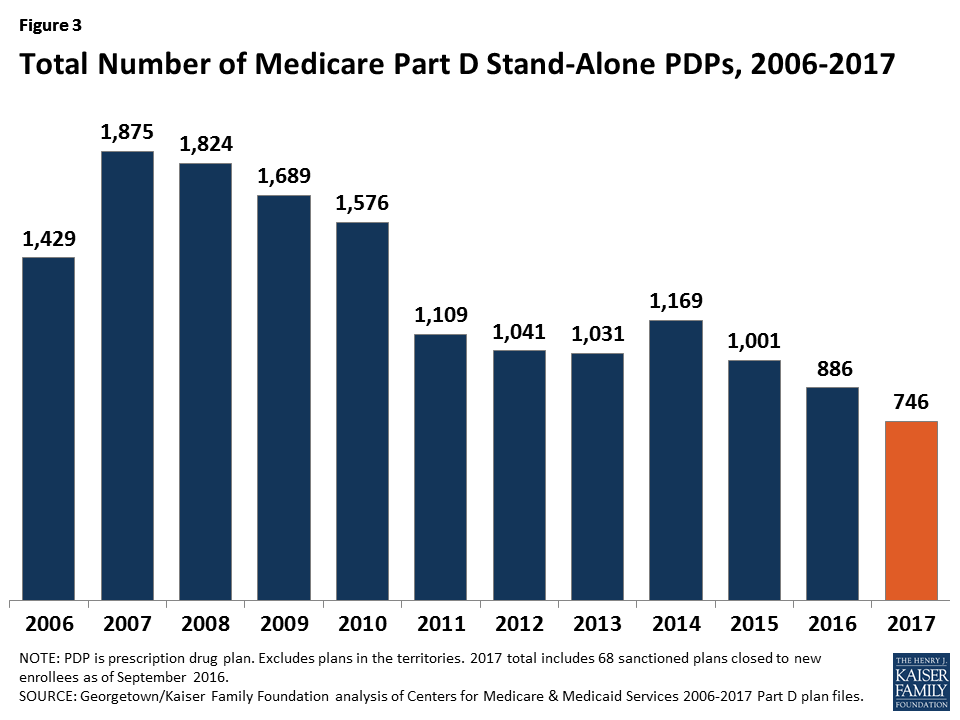
Figure 3: Total Number of Medicare Part D Stand-Alone PDPs, 2006-2017
- In 2017, there are eight plan sponsors offering 19 PDPs on a national basis. These sponsors account for 86 percent of all PDPs in the market and 93 percent of all PDP enrollees; most of the remaining PDPs are offered by Blue Cross Blue Shield plans in different regions (10 percent of plans, 7 percent of enrollment) or by other local or regional sponsors (4 percent of plans, but less than 1 percent of enrollment). The number of national or near-national plan sponsors is down from 18 in 2009, as a result of corporate acquisitions and some firms exiting the market after not achieving a substantial market share. In addition, more sponsors are now offering only two PDPs, whereas it was more common to offer three in the program’s early years.
- Plan counts for 2017 include two PDPs offered by Cigna in each region that are under sanction. In January 2016, the 68 PDPs offered by Cigna were placed under a sanction that banned marketing activities and all new enrollments. Its PDPs have about 950,000 enrollees in September 2016. The sanction will remain through the open enrollment period.
For 2017, only five new PDPs are entering the market (three new local PDPs in the Alabama/Tennessee and Michigan regions and the expansion by one plan sponsor into two additional regions), and 134 PDPs are exiting the program.2
- Among the 134 exiting plans, most are a result of market exits by two plan sponsors previously offering PDPs in most regions. United American, a plan sponsor since 2006, terminated its 91 PDPs; its 122,000 enrollees are being transferred to SilverScript PDPs unless they elect different plans. PDPs offered by Stonebridge Life in 30 regions under the Transamerica name (6,700 enrollees) are terminated. In addition, six PDPs offered by local sponsors (a total of 3,700 enrollees) left the program.
- PDPs previously offered by Symphonix Health, with about 400,000 enrollees, have been acquired by UnitedHealth. Some of these PDPs will operate under the Symphonix Value Rx name, while others will be rebranded by UnitedHealth as AARP MedicareRx Walgreens.
Premiums
National Premium Trends
The national average monthly PDP premium is expected to increase for the second year in a row—by 9 percent for 2017—after several years when premiums were essentially flat. Even if a number of beneficiaries switch or are reassigned to lower-premium plans for 2017, the average premium is likely to be higher in 2017 than in 2016, and the two-year increase over the 2015 average premium will mark a significant shift upward. Although beneficiaries and others tend to focus on premiums as the primary measure of plan cost, an individual’s total Part D costs are affected by the plan’s deductible, cost sharing, and whether their current drugs are on formulary.
- The projected average monthly PDP premium for 2017 will be $42.17 (Figure 4).3 This represents a 9 percent projected increase ($3.60) from the weighted average monthly premium of $38.57 in 2016, and a 62 percent increase from $26.04 in 2006, the first year of the Medicare Part D drug benefit. The 2017 estimate is weighted by September 2016 enrollment and assumes that beneficiaries remain in their current plan after the open enrollment period. It does not take into account the impact of the Low-Income Subsidy (LIS) which lowers or eliminates premiums for qualifying beneficiaries. The 62 percent increase in the weighted average PDP premium between 2006 and 2017 is significantly higher than the increase over these years in the medical care consumer price index (CPI) (45 percent) and the CPI for all items (23 percent).
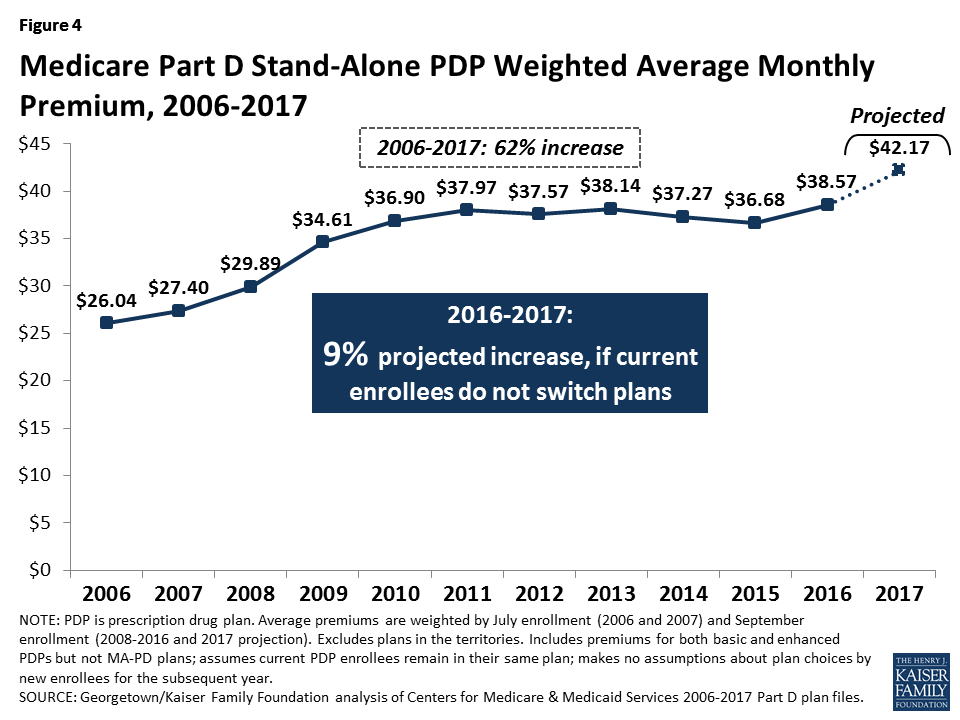
Figure 4: Medicare Part D Stand-Alone PDP Weighted Average Monthly Premium, 2006-2017
- CMS reported that the average premium for standard Part D coverage offered by PDPs and Medicare Advantage drug plans will “remain stable” at an estimated $34 in 2017.4 The premium reported here differs from the CMS-published premium because it is based on PDPs only and includes PDPs offering both basic and enhanced coverage; enhanced plans typically have higher premiums than basic plans. Our premium estimate does not make any assumptions about plan changes by current PDP enrollees, reassignment of Low-Income Subsidy (LIS) enrollees by CMS, or enrollment decisions by new PDP enrollees.
–
In prior years, the average premium calculated after taking into account enrollment decisions made during the open enrollment period has been 4 percent to 6 percent lower than the projection made assuming beneficiaries remain in their current plan. The difference is a result of existing enrollees switching to a lower premium plan, new enrollees choosing low-premium plans, and reassignments of some LIS beneficiaries to cheaper plans. For example, the weighted average premium in February 2016, after plan elections for 2016 went into effect, was $39.21, which is about 5 percent ($2.25) below the projected premium of $41.46 calculated prior to enrollment changes.5 Applying a similar adjustment to our projected premium for 2017 would produce a lower average premium after open enrollment, but one that would still be higher than in any previous year.
- The weighted average premium in 2017 for enhanced benefit PDPs ($57.13) is much higher than for PDPs offering the basic benefit ($31.81), assuming no change in enrollment.6
- Beneficiaries who qualify for the Low-Income Subsidy pay reduced premiums, net of the subsidy; they pay no premium if they select a benchmark plan, as described below. Taking into account these LIS subsidies, nearly half (46 percent) of all PDP enrollees will pay a monthly premium of less than $20 in 2017, assuming no plan changes (Figure 5). Because of the subsidy, 92 percent of LIS enrollees are expected to pay premiums of less than $20 per month in 2017. By contrast, only 16 percent of non-LIS enrollees will have premiums this low.
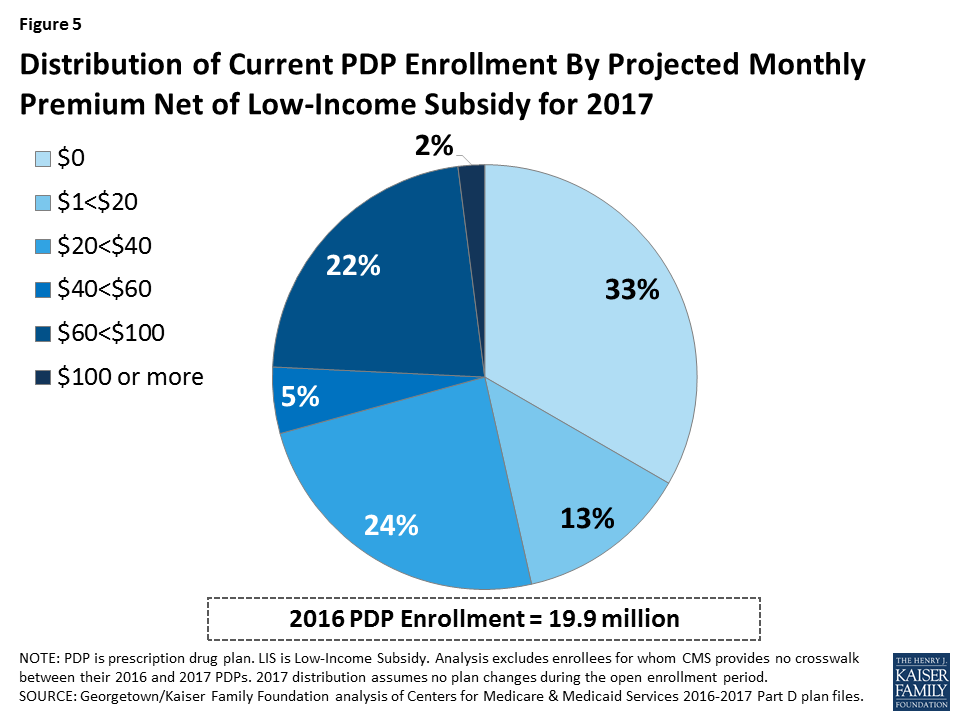
Figure 5: Distribution of Current PDP Enrollment By Projected Monthly Premium Net of Low-Income Subsidy for 2017
- Fully one-third of all PDP enrollees receive drug coverage for no premium because of the LIS. But one quarter of all current PDP enrollees will pay $60 or more for monthly premiums in 2017 if they do not change plans.
- A growing share of PDP enrollees are paying premiums that are well above the national average. In 2017, over one-third of PDP enrollees not receiving the LIS (40 percent) are projected to have premiums of at least $60 per month if they stay in their current plans—a substantial increase from the 31 percent of enrollees paying premiums at this level in 2016 (Figure 6). Among them, nearly 470,000 (4 percent of non-LIS enrollees) are projected to pay premiums of at least $100 per month. By contrast, 16 percent of these PDP enrollees are scheduled to pay premiums of less than $20 per month.
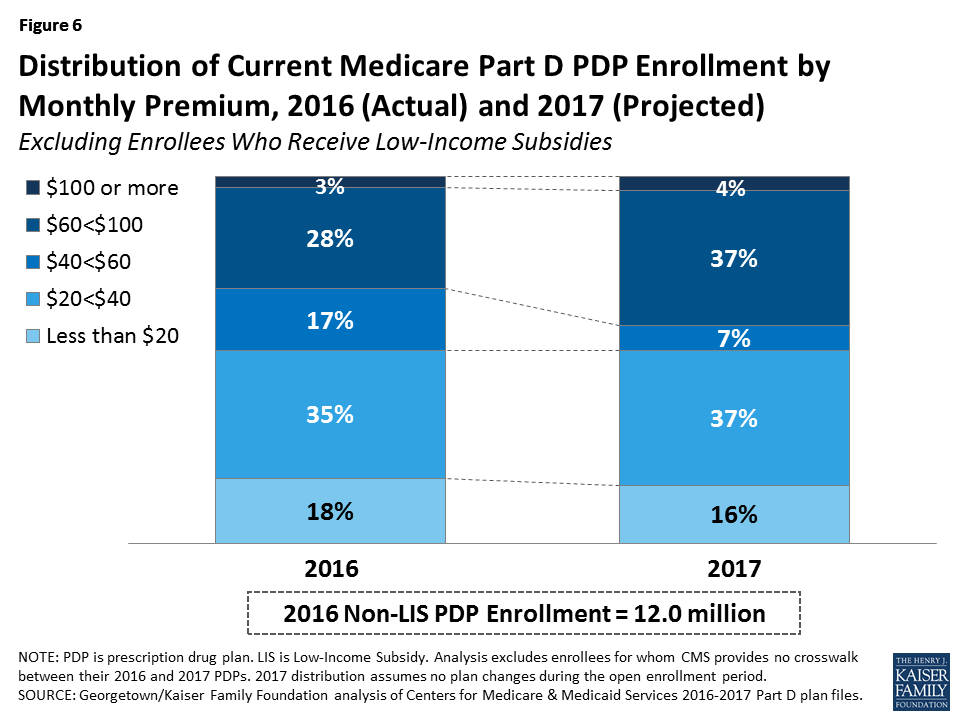
Figure 6: Distribution of Current Medicare Part D PDP Enrollment by Monthly Premium, 2016 (Actual) and 2017 (Projected)
Premium Variation and Changes for PDPs with the Most Enrollees
PDP premiums will continue to vary widely by plan in 2017, as in previous years (Figure 7, Table 1).

Figure 7: Average Monthly Premiums in 2017 for Ten Medicare Part D Stand-alone PDPs with Highest 2016 Enrollment
- Among the ten PDPs with the highest enrollment, average PDP premiums in 2017 will range from a low of $16.81 per month, or $202 annually, for the Humana Walmart Rx PDP to a high of $71.66 per month, or $860 annually, for the AARP MedicareRx Preferred PDP.
- Humana Walmart Rx has the lowest premium in every region in 2017. Nationally, the new PDP from UnitedHealth—AARP MedicareRx Walgreens—has the second lowest premium ($22.45). Several other national plan sponsors (Cigna, EnvisionRx, SilverScript, and UnitedHealth) offer PDPs with premiums under $20 in some regions.
- At the high end, 26 PDPs have premiums of at least $125 per month. The highest is $179 for Anthem Blue MedicareRx Premier PDP in Colorado. None of these PDPs, which are mostly offered by sponsors that serve only one region or a few regions, has more than 40,000 enrollees in 2016.
Changes to premiums from 2016 to 2017, averaged across regions and weighted by 2016 enrollment, also vary widely across some of the most popular PDPs (Table 1). These variations reflect factors such as higher premiums in older plans and substantial geographic variation.7 Although variation in benefits offered is also a factor, premium variation persists even among PDPs that offer benefits actuarially equivalent to the basic benefit defined in law.
| Table 1: Monthly Premiums for PDPs with Highest Enrollment | ||||||||||||||
| Name of PDP | Type of plan | First year offered | 2016 enrollment (# in millions) |
Weighted average monthly premium1 | Percent change | |||||||||
| # | % of total | First year | 2016 | 2017 | 2016-2017 | First year-2017 | ||||||||
| SilverScript Choice | Basic | 2006 | 4.16 | 20.6% | $28.32 | $22.78 | $29.12 | +28% | +3% | |||||
| AARP MedicareRx Preferred | Enhanced | 2006 | 3.14 | 15.6% | $26.31 | $60.79 | $71.66 | +18% | +172% | |||||
| Humana Walmart Rx | Enhanced | 2014 | 1.98 | 9.8% | $12.60 | $18.40 | $16.81 | -9% | +33% | |||||
| Humana Preferred Rx | Basic | 2011 | 1.81 | 9.0% | $14.80 | $28.36 | $27.32 | -4% | +85% | |||||
| AARP MedicareRx Saver Plus | Basic | 2013 | 1.23 | 6.1% | $15.00 | $33.93 | $37.34 | +10% | +149% | |||||
| Aetna Medicare Rx Saver | Basic | 2006 | 1.07 | 5.3% | $31.53 | $25.89 | $31.35 | +21% | -1% | |||||
| Humana Enhanced | Enhanced | 2006 | 0.98 | 4.9% | $14.73 | $66.28 | $64.23 | -3% | +336% | |||||
| WellCare Classic | Basic | 2007 | 0.94 | 4.6% | $15.80 | $31.71 | $28.96 | -9% | +83% | |||||
| First Health Part D Value Plus | Enhanced | 2012 | 0.75 | 3.7% | $25.44 | $33.85 | $39.27 | +16% | +54% | |||||
| Cigna-HealthSpring Rx Secure | Basic | 2006 | 0.67 | 3.3% | $35.05 | $35.95 | $27.86 | -22% | -21% | |||||
| TOTAL | 20.18 | 100% | $26.04 | $38.57 | $42.17 | +9% | +62% | |||||||
| NOTE: PDP is prescription drug plan. Plan names can change from year to year; plans are designated the same if they have the same contract/plan ID. 1Average premiums are weighted by enrollment in each region for each year. SOURCE: Georgetown/Kaiser Family Foundation analysis of Centers for Medicare & Medicaid Services 2006-2017 Part D plan files. |
||||||||||||||
- Average premiums for five of the ten largest PDPs will increase for 2017, by about $7 per month on average. In all five PDPs, the increase is at least 10 percent—higher than the increase in the national average premium. For two of these PDPs (SilverScript Choice and Aetna Medicare Rx Saver) the increase is at least 20 percent. Because both of these PDPs have below-average premiums, the dollar increase is smaller than some higher-premium PDPs.
- The highest increase, in percentage terms, is for SilverScript Choice, the plan with the most enrollees in 2016 (4.2 million). Premiums for this PDP have generally been flat over its history, and the premium remains well below the national average. But average monthly premiums for enrollees who want to stay in this plan in 2017 will rise 28 percent, from $22.78 to $29.12.
- Enrollees in the second largest PDP, UnitedHealth’s AARP MedicareRx Preferred (3.1 million enrollees), will face an 18 percent increase in the average monthly premium, from $60.79 to $71.66. Of the ten most popular PDPs, this plan is projected to have the highest monthly premium in 2017. In 2016, Humana Enhanced had the highest weighted average monthly premium among the top ten plans.
- The other five of the largest PDPs are lowering premiums modestly for 2017, by about $2 per month on average. Among these five PDPs are all three of Humana’s PDPs; for example, the average monthly premium for Humana Walmart Rx PDP will decrease by 9 percent for 2017, from $18.40 to $16.81.
Enrollees in some of the most popular PDPs could see larger or smaller premium increases than the national average, depending on the region where they live.
- The premium for UnitedHealth’s AARP MedicareRx Preferred PDP will be 6 percent higher in Oklahoma but 28 percent higher in Arizona (Figure 8). The range in how much premiums will change is even greater for CVS Health’s SilverScript Choice PDP, which will be 8 percent lower in Hawaii but 38 percent higher in New Mexico.
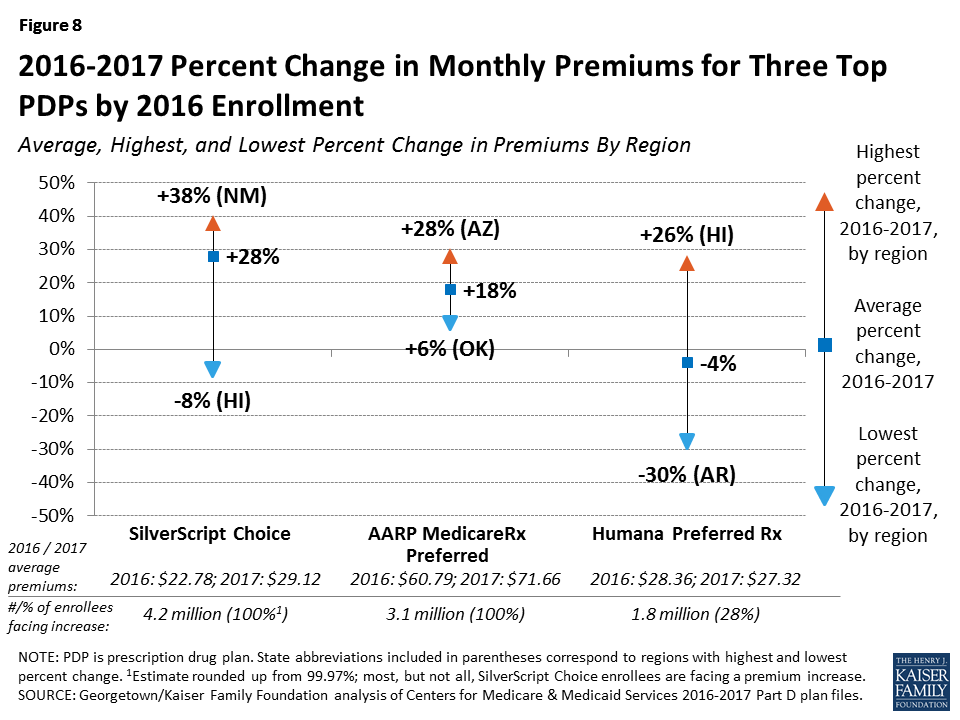
Figure 8: 2016-2017 Percent Change in Monthly Premiums for Three Top PDPs by 2016 Enrollment
Monthly premiums for the most popular PDPs available since the start of the Part D program in 2006 have changed in different ways (Table 1).
- The average premium for Humana Enhanced PDP, with 980,000 enrollees in 2016, is more than four times higher than it was in 2006 (despite a modest decrease in 2017), having increased from $14.73 to $64.23.
- The average premium for UnitedHealth’s AARP Preferred MedicareRx PDP, the PDP with the second most enrollees in 2016 (3.1 million), has nearly tripled since 2006, from $26.31 to $71.66 in 2017.
- By contrast, the monthly premium for Aetna MedicareRx Saver, with 1.1 million enrollees in 2016, is 1 percent lower in 2017 ($31.35) than it was in 2006 ($31.53).
The entry of a new PDP from UnitedHealth for 2017 (AARP MedicareRx Walgreens) is the latest example of plans sponsors offering new PDPs at low premiums, presumably to attract new Medicare beneficiaries.
- The average premium for AARP MedicareRx Walgreens will be $22.45, the second lowest among all PDPs.
- Premiums for plans with relatively low premiums when entering the market often rise substantially after a few years. For example, AARP MedicareRx SaverPlus (also sponsored by UnitedHealth) entered the market with a $15.00 premium in 2013, but the premium has more than doubled to $37.34, on average, for 2017.
- Older plans, such as AARP MedicareRx Preferred and Humana Enhanced, are priced well above the national average, most likely as a result of retaining older enrollees who opt not to switch plans.
Premium Variation and Changes by Region
Average PDP monthly premiums, weighted by 2016 enrollment, will vary widely in 2017 across regions, along with the change in premiums from 2016 to 2017.
- Average PDP premiums will range from $31.27 per month in the New Mexico region (one of only three regions with an average under $35) to $50.95 per month in New Jersey and $47.24 in California (Figure 9; Appendix 1, Table A2). Two other large states (Florida and New York) also have projected average premiums above $45, well above the national average.
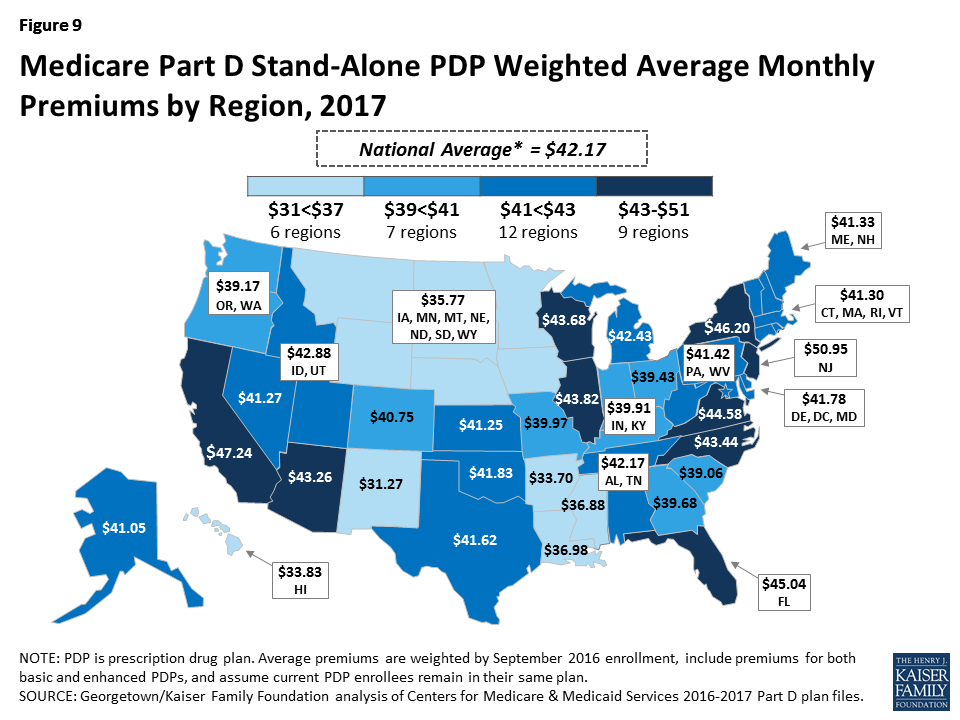
Figure 9: Medicare Part D Stand-Alone PDP Weighted Average Monthly Premiums by Region, 2017
- Projected average premiums are higher in 2017 than in 2016 in every region, but the level of increase varies by region (Figure 10). For example, average premiums in Alaska are projected to rise by just 2 percent and by no more than 6 percent in seven regions. By contrast, average premiums will be at least 20 percent higher in California and 18 percent higher in Arizona.
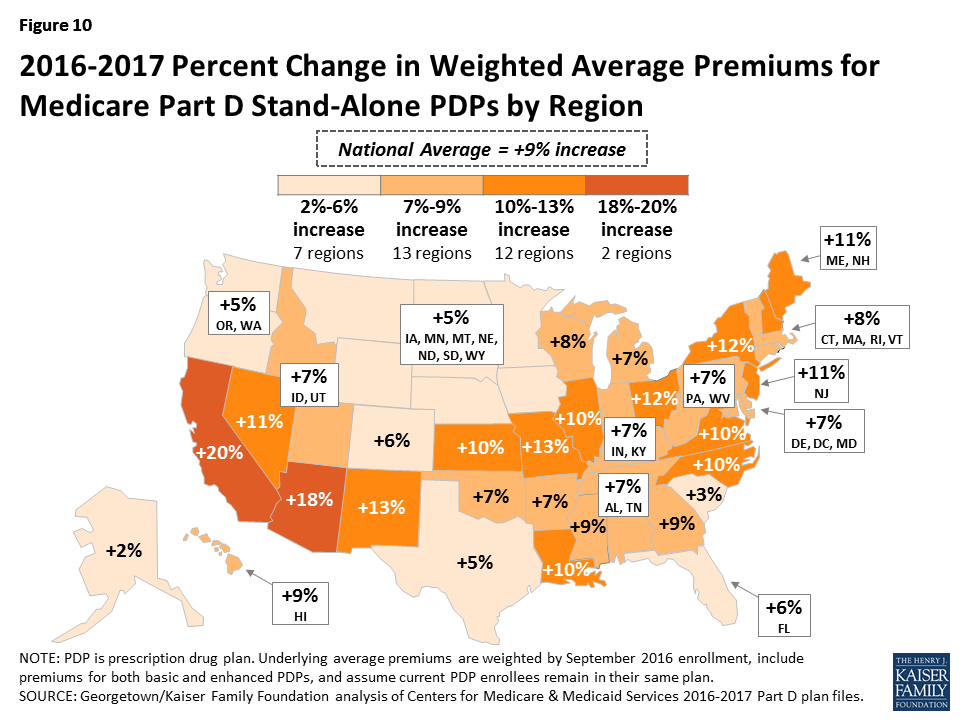
Figure 10: 2016-2017 Percent Change in Weighted Average Premiums for Medicare Part D Stand-Alone PDPs by Region
Premium Increases and Decreases for Current Enrollees
Overall, fewer Part D enrollees are projected to face higher premiums in 2017, compared to the share of enrollees who were facing projected increases for 2016. At the same time, a larger share of enrollees face higher premiums in 2017 than lower premiums, if they stay in their current plans. (Figure 11).
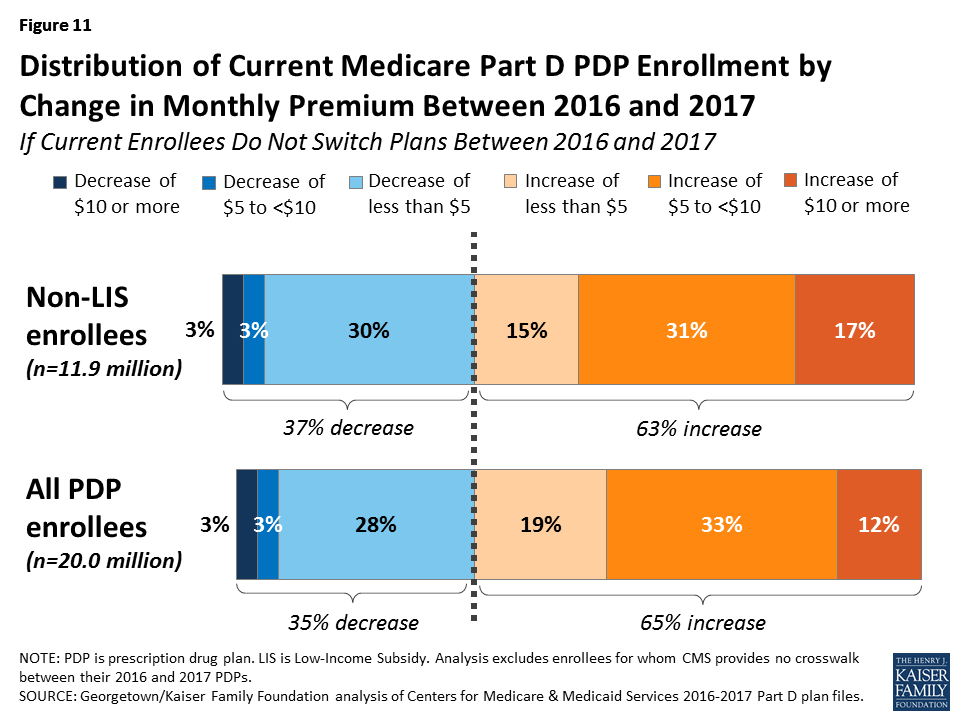
Figure 11: Distribution of Current Medicare Part D PDP Enrollment by Change in Monthly Premium Between 2016 and 2017
- Among the 11.9 millionPart D PDP enrollees who are responsible for paying the entire premium (which excludes LIS recipients), about two-thirds (63 percent) are projected to have a higher premium in 2017 if they stay in their current plans, including 2.1 million (17 percent) who are projected to have a premium increase of at least $10 per month. Conversely, about 311,000 enrollees (3 percent) are projected to see their premiums decrease by $10 or more.
- For non-LIS enrollees facing a projected premium increase, the average monthly increase will be $8.84. Those projected to see lower premiums will experience a smaller change, on average (a reduction of $3.34).
- Taking into account all PDP enrollees, including the LIS enrollees whose premiums are fully or partially paid by the government, 65 percent are in plans in which premiums are projected to rise in 2017; this includes 12 percent in plans that will have an increase of $10 or more in their monthly premium in 2017. By contrast, only 3 percent of all PDP enrollees are in plans projected to have a premium decrease of $10 or more.
Benefit Design
In 2017, for the third year in a row, all Part D PDPs will offer an alternative benefit design to the defined standard benefit, which has a $400 deductible in 2017 and 25 percent coinsurance for all covered drugs. Some plans modify or eliminate the deductible, and virtually all PDPs will have a benefit design with five tiers for covered generic and brand-name drugs.
Deductibles
The standard (maximum) Part D deductible is increasing by $40 in 2017 from $360 to $400, the same dollar increase as in 2016. The increase of $80 between 2015 and 2017 is greater than the net increase from 2006 to 2015. The large increase in the last two years results from a statutory formula that adjusts the amount each year based on the annual percentage increase in average per capita aggregate expenditures for covered Part D drugs. Other amounts for the standard benefit design parameters are increasing as well (Appendix 2).
- Nearly two-thirds of PDPs (62 percent) will charge a deductible in 2017, down from 67 percent in 2016 (Figure 12). But because beneficiaries are less likely to be enrolled in plans without deductibles, only 51 percent of Part D enrollees are in plans charging deductibles for 2017, if they do not change plans. Nearly half of all Part D enrollees are in plans that are increasing the deductible for 2017, mostly in accordance with the increase in the standard deductible.
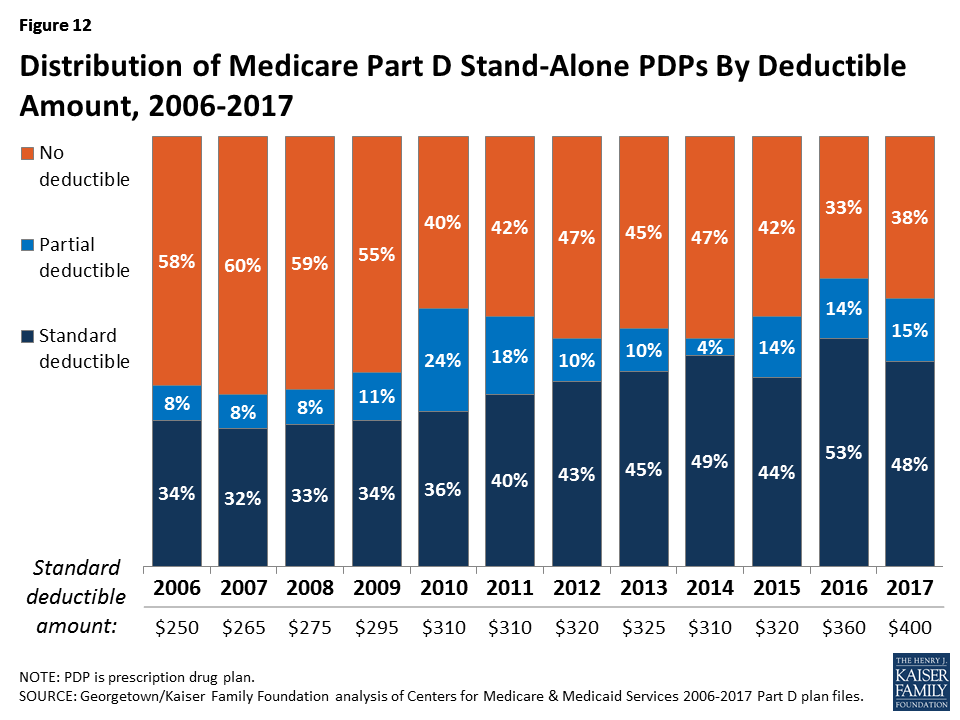
Figure 12: Distribution of Medicare Part D Stand-Alone PDPs By Deductible Amount, 2006-2017
- Most PDPs with a deductible will charge the standard $400 amount (48 percent), a somewhat lower share than in 2016. Another 15 percent of all PDPs have a deductible below the standard amount.
- Part D enrollees are projected to be in plans with a deductible of $195 in 2017, on average, up 7 percent from an average of $182 in 2016 (Figure 13). The weighted average deductible is up from $107 in 2006—an 82 percent increase, higher than the increase in the average premium.
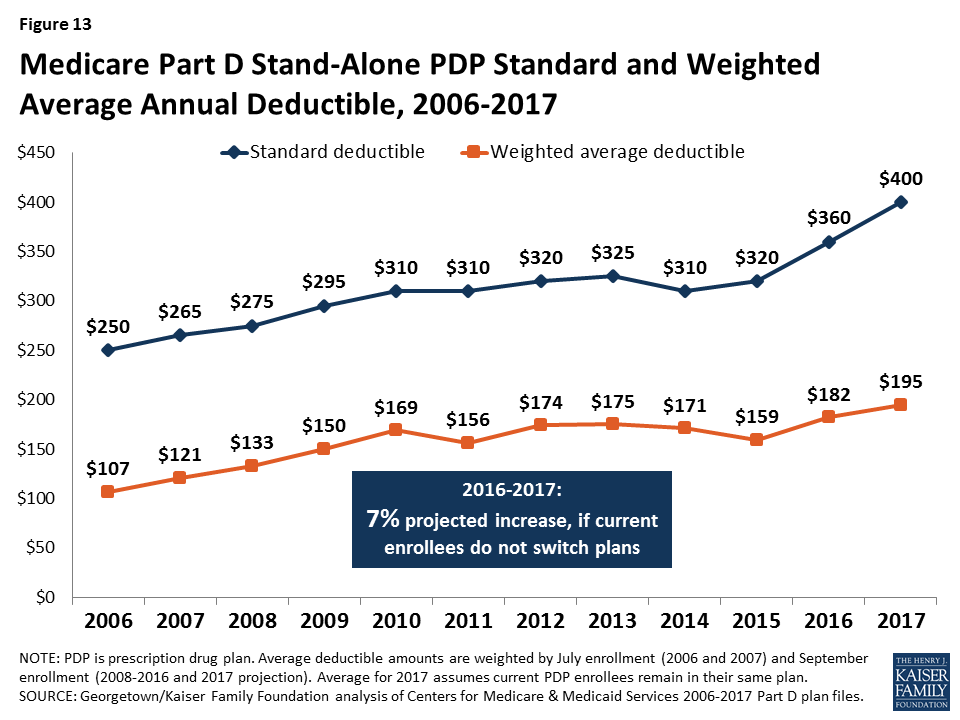
Figure 13: Medicare Part D Stand-Alone PDP Standard and Weighted Average Annual Deductible, 2006-2017
Tiered Cost-Sharing Trends and Amounts in 2017
- For the third year in a row, all PDPs will use tiered cost sharing. In 2017, all but two PDPs (both local plans with few enrollees) will have five tiers: two for generic drugs, two for brand-name drugs, and one for higher-cost specialty drugs.8 Five-tier formularies have been the most common type since 2013. Overall, PDP cost-sharing amounts in 2017 are relatively similar to 2016 levels.
- For generic tiers, the typical copayments are $2 for the preferred generic tier and $7 for the non-preferred generic tier.9 About one-third of PDPs charge $0 for preferred generics to encourage use of these drugs, whereas a few charge $5 or more. Copayments for non-preferred generics vary more widely—from $1 to $20.
- Use of coinsurance for preferred brand tiers has declined from 39 percent of PDPs in 2016 to 20 percent in 2017. For preferred brand tiers, the typical copayment in 2017 is $40 (20 percent coinsurance for those PDPs that use coinsurance), but copayments vary from $17 to $47.
- PDPs have increasingly charged coinsurance in place of flat copayments for non-preferred drugs (often more expensive drugs or those for which plans have not negotiated large rebates from manufacturers). In 2017, 98 percent of PDPs are using coinsurance for their non-preferred drug tiers (previously labeled non-preferred brands). The typical coinsurance PDPs charge for non-preferred drugs is 40 percent, but coinsurance rates range from 24 percent to 50 percent.
- Since 2006, nearly all PDPs have charged coinsurance for the specialty tier. In 2017, the threshold for drugs to qualify for placement on a specialty tier was increased to $670 for a one-month supply of the drug, the first such increase since 2008. For all PDPs, the specialty tier coinsurance ranges from 25 percent to 33 percent (the most allowed by CMS guidelines); most PDPs charge either 25 percent or 33 percent.
Tiered Cost Sharing in PDPs with the Most Enrollees
- Cost sharing for the ten largest PDPs varies across plans, and there are some notable changes between 2016 and 2017 (Table 2). Two of the largest PDPs (Humana Preferred and WellCare Classic) have a zero copayment for preferred generic drugs in 2017. Median copayments for non-preferred generics range from $2 to $14 among the ten largest PDPs.
- Eight of the ten largest PDPs charge copayments for preferred brands, varying from $21 (AARP MedicareRx Saver Plus) to $47 (First Value Part D Value Plus). One of the top PDPs (Cigna-HealthSpring Rx Secure) shifted in 2017 from 16 percent coinsurance to a $40 copayment for preferred brands.
- Coinsurance for non-preferred drugs varies in 2017 from 30 percent (AARP MedicareRx Saver Plus) to 50 percent, the maximum allowed by CMS guidance (SilverScript Choice and First Health Part D Value Plus).
| Table 2: Median Cost Sharing for PDPs with Highest Enrollment, 2016-2017 | ||||||||||||
| Name of PDP | Preferred generics | Non-preferred generics | Preferred brands | Non-preferred drugs | Specialty drugs | |||||||
| 2016 | 2017 | 2016 | 2017 | 2016 | 2017 | 2016 | 2017 | 2016 | 2017 | |||
| SilverScript Choice | $3 | $3 | $13 | $14 | $45 | $46 | 46% | 50% | 33% | 33% | ||
| AARP MedicareRx Preferred | $3 | $3 | $10 | $10 | $35 | $35 | 40% | 40% | 33% | 33% | ||
| Humana Walmart Rx | $1 | $1 | $4 | $4 | 20% | 20% | 35% | 35% | 25% | 25% | ||
| Humana Preferred Rx | $1 | $0 | $2 | $1 | 20% | 20% | 35% | 35% | 25% | 25% | ||
| AARP MedicareRx Saver Plus | $1 | $1 | $2 | $2 | $21 | $21 | 30% | 30% | 25% | 25% | ||
| Aetna Medicare Rx Saver | $1 | $1 | $2 | $2 | $35 | $30 | 39% | 35% | 25% | 25% | ||
| Humana Enhanced | $3 | $3 | $7 | $7 | $42 | $42 | 44% | 44% | 33% | 33% | ||
| WellCare Classic | $0 | $0 | $10 | $14 | $47 | $46 | 50% | 49% | 25% | 25% | ||
| First Health Part D Value Plus | $1 | $2 | $7 | $5 | $47 | $47 | 50% | 50% | 33% | 33% | ||
| Cigna-HealthSpring Rx Secure | $2 | $2 | $6 | $7 | 16% | $40 | 47% | 45% | 25% | 25% | ||
| NOTE: PDP is prescription drug plan. Estimates are weighted medians for those plans that vary cost sharing by region. SOURCE: Georgetown/Kaiser Family Foundation analysis of Centers for Medicare & Medicaid Services 2016-2017 Part D plan files. |
||||||||||||
- Six of the top PDPs use 25 percent coinsurance for their specialty tiers, the maximum allowed for plans with a standard deductible. The other four top PDPs change 33 percent coinsurance for specialty drugs.
The Coverage Gap
The coverage gap, or “doughnut hole,” has become a less salient feature of the Part D benefit design, as a result of changes made by the Affordable Care Act to eliminate the coverage gap by 2020. In 2017, manufacturer prices for brand-name drugs purchased in the gap phase of the benefit will be discounted by 50 percent, with plans paying an additional 10 percent of the cost and enrollees still responsible for 40 percent. Plans will pay 49 percent of the cost for generic drugs in the gap phase, with enrollees paying 51 percent. In 2017, most Part D plans will offer no gap coverage beyond what is required under the standard benefit.
- In 2017, about 72 percent of all PDPs will offer no additional gap coverage, a small decrease from 78 percent in 2016—meaning a slightly larger share of plans will offer some gap coverage in 2017 beyond what the basic benefit covers. The share of current enrollees who will have no additional gap coverage if they do not switch plans is 84 percent. One national PDP (Cigna-HealthSpring Rx Secure-Extra) added gap coverage, and UnitedHealth’s AARP MedicareRx Preferred added gap coverage for only the Florida and New York regions.
Tiered Pharmacy Networks
Most PDPs (85 percent) use tiered pharmacy networks. In these networks, enrollees pay preferred (lower) cost sharing for their prescriptions when they use selected network pharmacies and higher cost sharing in other network pharmacies.
- The share of PDPs with tiered preferred pharmacy networks in 2017 is essentially unchanged from 2016, but significantly higher than just a few years ago, when only a small share of PDPs used this type of preferred pricing (7 percent in 2011).
- The cost implications of tiered pharmacy networks for enrollees vary across PDPs in 2017.10 For example, the AARP MedicareRx Preferred PDP charges a $35 copayment for a preferred brand drug in a pharmacy that offers preferred cost sharing and $46 in another network pharmacy that does not offer preferred cost sharing. The Humana Walmart Rx PDP charges a $1 copayment for preferred generic drugs and $4 for non-preferred generics at a pharmacy with preferred cost sharing, compared to $10 and $20, respectively, at other network pharmacies where preferred cost sharing is not offered. These cost-sharing differentials are similar to 2016 levels.
Low-income Subsidy (Benchmark) Plans
In 2017, the total number of premium-free benchmark plans—that is, PDPs available for no monthly premium to Low-Income Subsidy (LIS) enrollees—will be slightly higher than in 2016, which was the lowest level in the program’s ten years (Figure 14; Appendix 1, Table A3).

Figure 14: Number of PDPs Available Without a Premium to Enrollees Receiving the Low-Income Subsidy (Benchmark Plans), 2006-2017
- In 2017, 231 plans will be premium-free benchmark plans available for enrollment of beneficiaries receiving the LIS. This represents a modest increase of 5 benchmark plans since 2016, but a sizeable reduction compared to 2014 (121 fewer plans) and 2015 (52 fewer plans). But 25 of the benchmark PDPs in 2017 are offered by Cigna, which cannot accept new enrollees during open enrollment because it is under sanction.
- On average (weighted by enrollment), LIS beneficiaries have 7 benchmark plans available to them for 2017, or about one-third the average number of PDP choices available overall. All LIS enrollees can select any plan offered in their area, but if they enroll in a non-benchmark plan, they must pay some portion of their chosen plan’s monthly premium.
- Of the 231 benchmark plans in 2017, 24 plans qualify through the “de minimis” policy—fewer than the 57 de minimis plans in 2016. The de minimis policy makes it easier for plans to qualify by allowing them to waive a premium amount of up to $2 in order to retain their LIS enrollees.11
- Among the 2016 benchmark plans, 21 PDPs have lost their benchmark status for 2017 due to either higher premiums in 2017 or a lower regional benchmark amount for 2017. About 381,000 LIS beneficiaries (5 percent of LIS enrollment in PDPs in 2016) are enrolled in these 21 plans, meaning these beneficiaries may experience some disruption in their coverage for 2017. For 2017, 31 PDPs will newly qualify as benchmark plans, only one of which is entirely new to the Part D program.
Benchmark Plans by Region
The number of benchmark plans available in 2017 will vary by region, from just 3 benchmark PDPs in Florida (out of 20 PDPs overall) to 10 benchmark PDPs in Arizona and the Delaware/Maryland/District of Columbia region (out of 22 and 20 PDPs in these regions, respectively) (Figure 15).
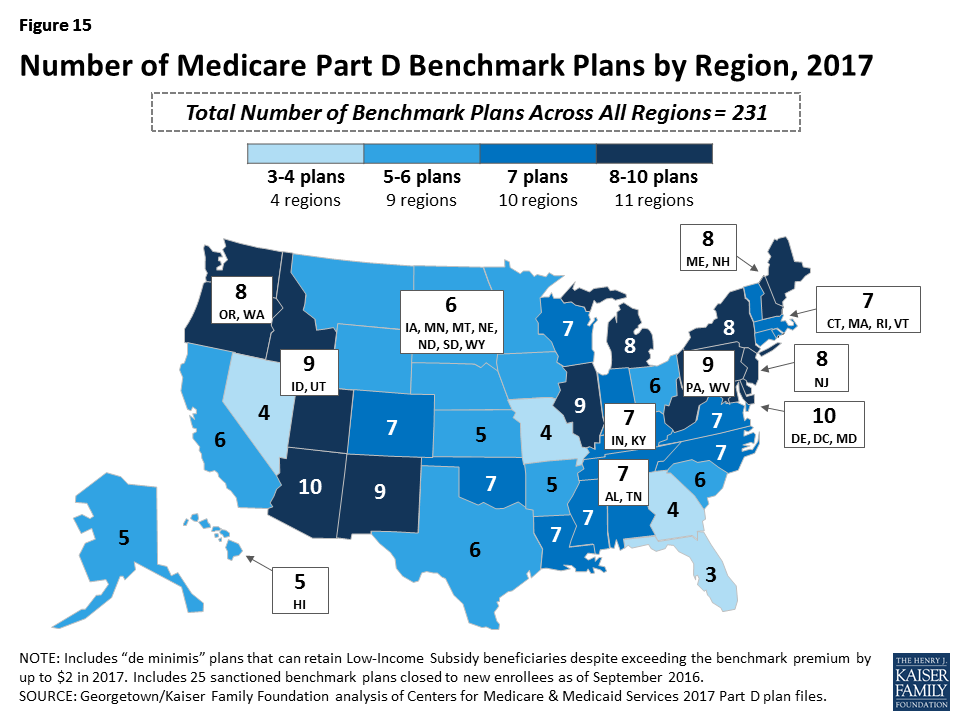
Figure 15: Number of Medicare Part D Benchmark Plans by Region, 2017
- Benchmark plan availability will be unchanged in 15 of 34 regions between 2016 and 2017. Only three regions will experience a gain or loss of more than one benchmark plan (a gain of three in Hawaii, a gain of two in South Carolina, and a loss of two in Texas).
Benchmark Plans by Sponsor
The number of premium-free plans for LIS enrollees offered by the major Part D organizations has fluctuated substantially over the years (Figure 16).
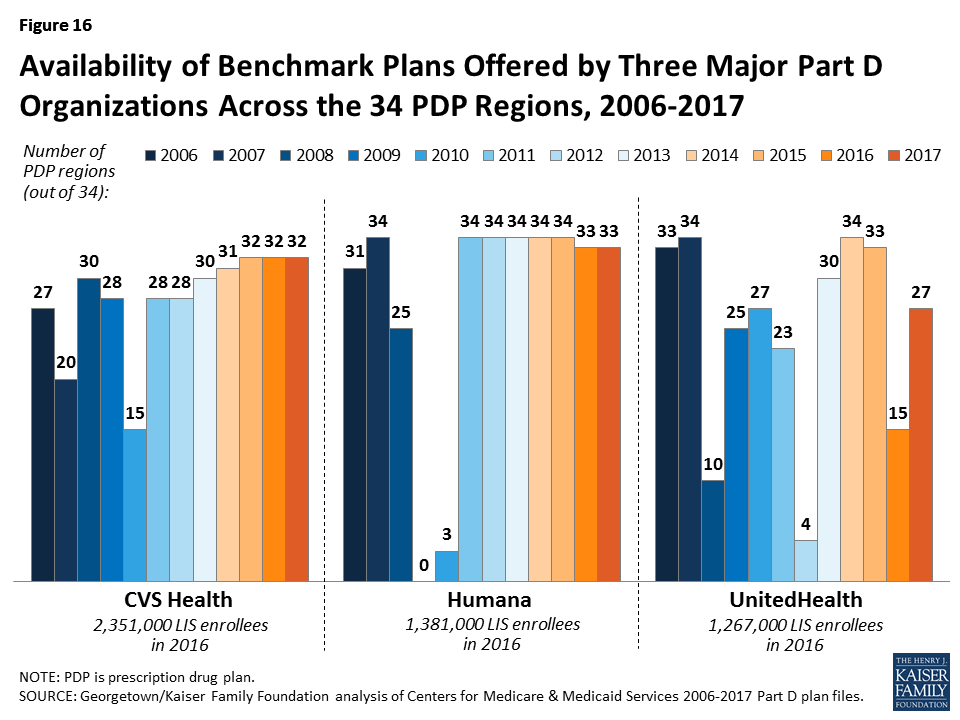
Figure 16: Availability of Benchmark Plans Offered by Three Major Part D Organizations Across the 34 PDP Regions, 2006-2017
- In 2017, about 60 percent of LIS PDP enrollees are in PDPs operated by just three plan sponsors (CVS Health, Humana, and UnitedHealth). All three sponsors offer PDPs that qualify as benchmark plans in at least 27 of the 34 PDP regions in 2017. UnitedHealth offers PDPs that qualify as premium-free in 27 regions in 2017, up from 15 in 2015. This increase is attributable, at least in part, to the acquisition by UnitedHealth of PDPs previously operated by Symphonix.
- For 2017, seven PDP sponsors will offer benchmark plans in at least half of the 34 regions.12 No sponsor will offer benchmark plans in all 34 regions in 2017; two sponsors (Humana and WellCare) offer benchmark plans in 33 regions, and two sponsors (CVS Health and Aetna) do so in 32 regions.
Impact of Benchmark Plan Changes for Low-Income Subsidy Enrollees
- About 1.4 million LIS beneficiaries—about one in six LIS enrollees in PDPs in 2016 (17 percent)—are enrolled in PDPs in 2016 that will not qualify as benchmark plans in 2017 (Figure 17). CMS will reassign those LIS enrollees who were randomly assigned by CMS to their current plan, and several states will help reassign those enrolled in their state pharmacy assistance programs (SPAPs).13 Effective for January 2016, CMS reassigned about one-fourth of those scheduled to pay a premium. Many other LIS beneficiaries who are currently not enrolled in plans that will be premium-free in 2017 must switch plans on their own or pay a premium if they remain in their 2016 plan. Those in the latter group will not be automatically reassigned by CMS because in the past they or someone assisting them made a choice to switch plans.
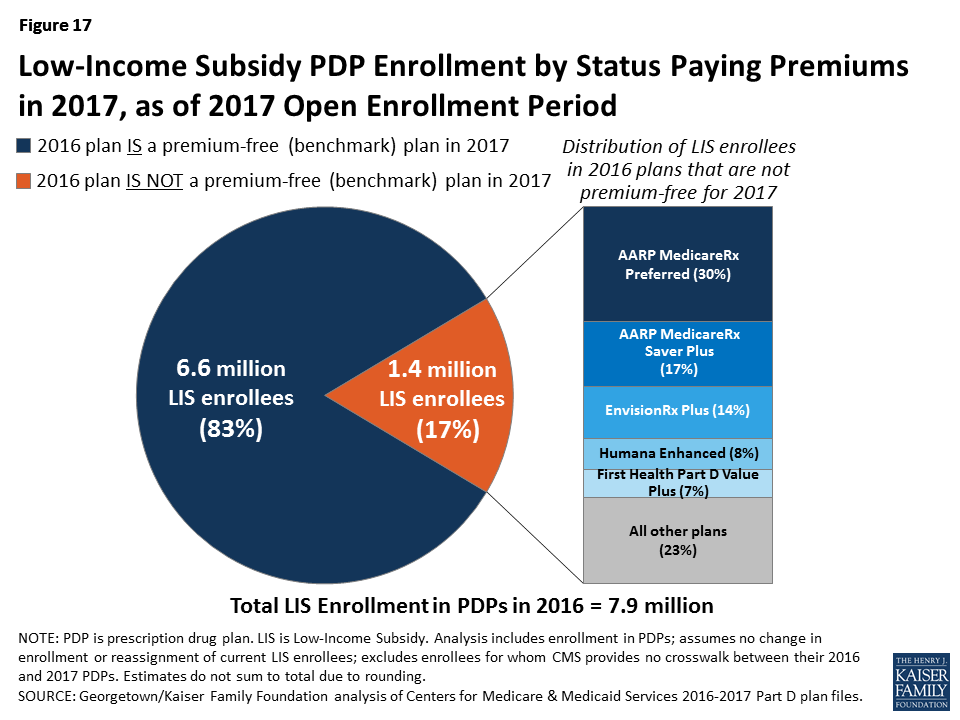
Figure 17: Low-Income Subsidy PDP Enrollment by Status Paying Premiums in 2017, as of 2017 Open Enrollment Period
- On average, these 1.4 million LIS beneficiaries face PDP premiums that average $23.85 per month in 2017 ($286 per year) if they do not change plans or are not reassigned by CMS to new plans. In 2016, LIS beneficiaries in this situation paid $20.51 on average. Nearly half (48 percent) are projected to pay premiums of at least $20 per month, and 2 percent will pay at least $60 per month.
- Among the LIS beneficiaries who may pay premiums in 2017, 28 percent (381,000) are in benchmark plans in 2016; the remaining 72 percent (974,000) are currently enrolled in non-benchmark plans and thus paid a premium in 2016. No one in the latter situation will be eligible for reassignment by CMS to a premium-free plan. Over half (57 percent) of those who may pay premiums are in enhanced PDPs.
- About three-fourths of the 1.4 million LIS beneficiaries projected to pay premiums are currently enrolled in just five PDPs: AARP MedicareRx Preferred (30 percent), AARP MedicareRx Saver Plus (17 percent), EnvisionRx Plus (14 percent), Humana Enhanced (8 percent), and First Health Part D Value Plus (7 percent) (Figure 17). For two of these five PDPs, the affected LIS beneficiaries are projected to pay substantial premiums in 2017: $37.41 per month for the AARP MedicareRx Preferred PDP, and $32.16 for Humana Enhanced. Because they are enhanced PDPs, LIS enrollees in these two plans will not be reassigned to a new plan by CMS, so they must select a different plan in order to avoid paying these premiums.
- The number of LIS enrollees who will potentially pay a premium in 2017 unless they enroll in, or are switched to, benchmark plans (1.4 million) is down from the 1.9 million LIS enrollees who were in a similar situation at the time of open enrollment for 2016 (Figure 18). The number of enrollees in this situation varies annually depending on changes in the number of PDPs qualifying as benchmark plans and exiting the program.
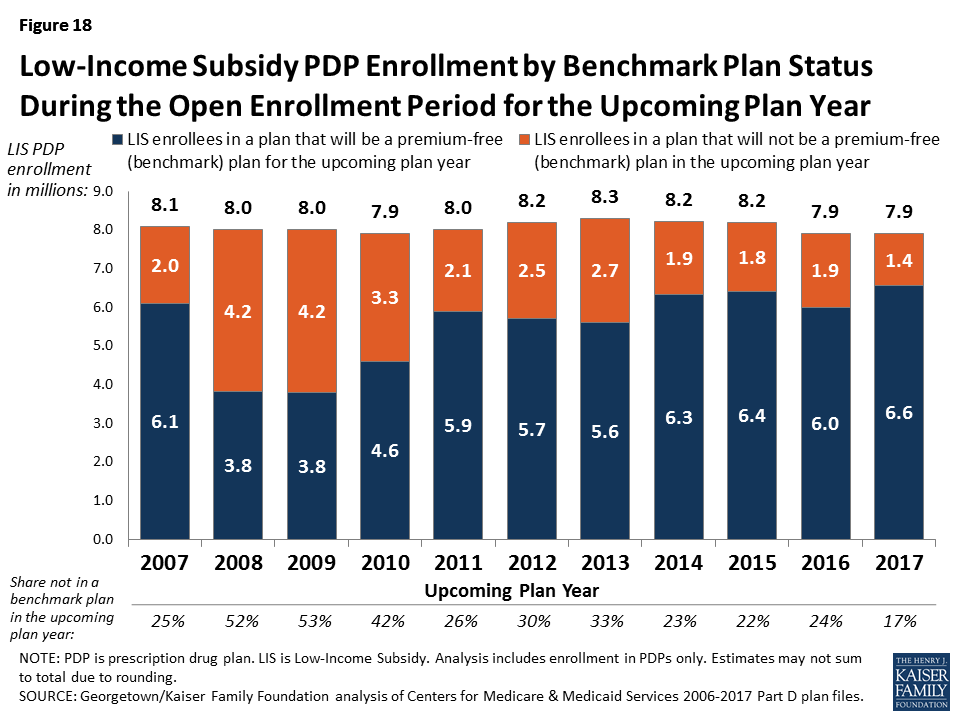
Figure 18: Low-Income Subsidy PDP Enrollment by Benchmark Plan Status During the Open Enrollment Period for the Upcoming Plan Year
- A larger share of LIS enrollees in Florida than in other regions will be required to pay premiums in 2017 unless they change plans (Figure 19). In part because one large plan lost benchmark status, 41 percent of Florida’s LIS beneficiaries are projected to pay a premium in 2017 unless they switch plans or are reassigned—much higher than the national average of 17 percent. In five other regions (Alaska, Georgia, Nevada, New Hampshire/Maine, and Virginia), a relatively larger share (at least 25 percent) of LIS beneficiaries are in this same situation. By contrast, a much lower share (less than 10 percent) of LIS beneficiaries will face premiums in 2017 in three regions (New Mexico, New York, and Pennsylvania/West Virginia).
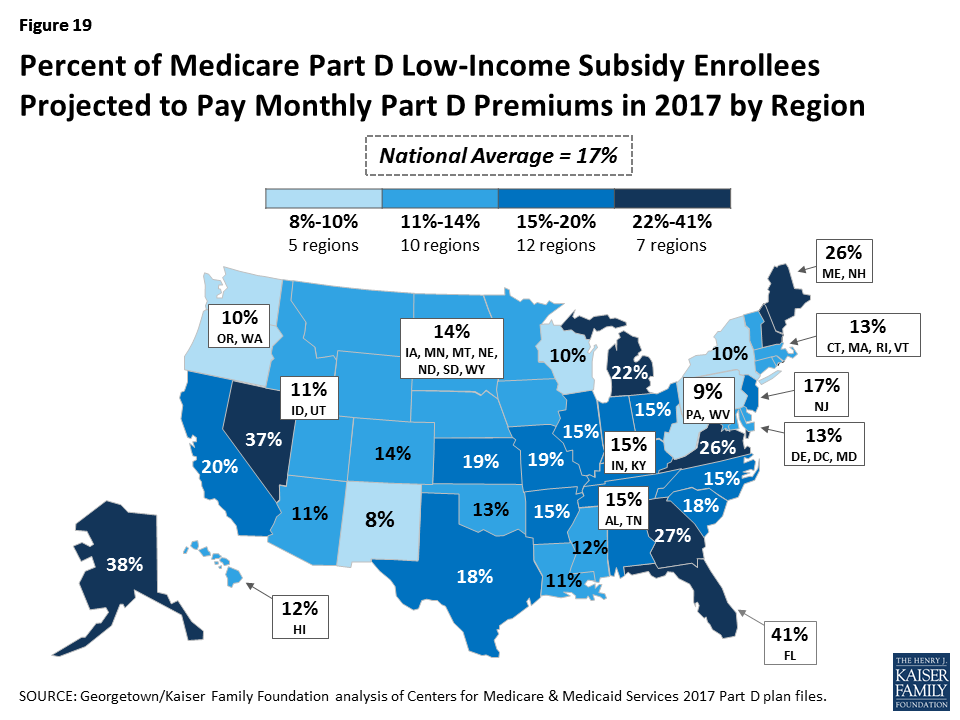
Figure 19: Percent of Medicare Part D Low-Income Subsidy Enrollees Projected to Pay Monthly Part D Premiums in 2017 by Region
Discussion
As Medicare Part D enters its twelfth year in 2017, a majority of Part D stand-alone drug plan enrollees face higher premiums if they stay in their current plans. Many also face higher drug deductibles and may pay higher cost sharing for their drugs, depending on the specific drugs they take and the formulary of the plan in which they are enrolled. In a program that offers drug benefits only through private plans, beneficiaries have a choice of 22 PDPs (on average) for which premiums differ by a large margin. Furthermore, the premiums they face vary based on the state where they live. Beneficiaries who receive the Low-Income Subsidy are guaranteed access to premium-free plans, but one in six will pay a premium unless they switch plans or are assigned to a different plan by CMS.
In 2017, two-thirds of PDP enrollees are facing premium increases, while the rest will see lower premiums if they stay in the same plan. In a year when higher drug costs are drawing much attention, it may seem noteworthy that some PDPs are lowering their premiums. For some plans, this may be a result of downward adjustments from previous premium increases that proved to be larger than necessary. The role of the federal reinsurance and risk corridors may also be a factor in how premiums are adjusted from year to year. Because the government reinsures 80 percent of drug costs in the catastrophic phase of the benefit for those enrollees who exceed the threshold, plans have a reduced incentive to manage spending on high-cost drugs. Risk corridors also mitigate the impact of increased costs. As a result, plan sponsors may be more strategic in setting PDP premiums at levels that can attract new enrollees.
In addition, some of the largest premium increases are for PDPs that have been in the program from its beginning; if they have a greater share of older enrollees, they may be experiencing a more rapid rise in drug costs relative to newer plans with a greater share of younger enrollees. Some of these same factors may help to explain the large variation across competing PDPs. Many of the highest-premium PDPs are those that have been in the program the longest.
Geographic variation in premiums is also a recurring pattern in Part D. Enrollees in some states will pay $10 to $20 more per month for the same plans offering the same benefits as those in other states. Although it is unclear exactly what accounts for such large premium differences for the same PDP across regions, possible factors include differences in enrollees’ health status that may not be fully captured in risk adjustment or different prescribing patterns in different regions. The level of market competition in a region is unlikely to be a major factor since mostly the same array of PDPs competes in each region.
Although premiums may be seen as the main measure of a plan’s cost, enrollees’ total out-of-pocket costs are driven as much or more by how much cost sharing they incur for the specific drugs they take, whether they face a deductible, whether their drugs are covered by their plan, and whether they are in a position to take advantage of lower cost sharing available at select pharmacies.14 These factors vary considerably across PDPs and not always in predictable ways. For example, among the PDP options offered by one plan sponsor, the higher-premium PDP has no deductible but charges higher cost sharing than the lower-premium PDP. Furthermore, if some drugs a beneficiary takes are not on the plan’s formulary, out-of-pocket costs are likely to be much higher than when their drugs are covered on formulary.
Beneficiaries have the opportunity to compare Part D plans each year during the open enrollment period. In doing so, they can take into account any recent changes in their own medications. Part D enrollees can compare the various plan features that will affect their costs, such as premiums, deductibles, cost-sharing requirements, tier placement, coverage requirements (such as prior authorization), and whether their usual pharmacy offers preferred cost sharing. The reduced number of PDPs for 2017 could make the process of comparing and reviewing plan options somewhat easier for beneficiaries to undertake, but the large number of PDP options in each region has historically discouraged some enrollees from reevaluating their choices.15
In 2017, despite the availability of premium-free (benchmark) plans, 14 percent of LIS beneficiaries will pay a premium, averaging $286 annually, if they do not switch to a different plan to avoid paying a premium. Some will be reassigned by CMS to new plans, but a large majority of this group is not eligible for reassignment in 2017. For some beneficiaries, it may be worth paying a premium to obtain better coverage for the drugs they take. But many others, especially those paying more than the average, would benefit from reviewing the premium-free PDPs available to them and switching plans.16
Finding ways to get more Part D enrollees engaged in comparing and reviewing plans and making changes that could save them money remains an ongoing challenge for CMS and policymakers. In 2017, some Part D enrollees who retain their current plans may benefit from lower premiums and lower overall costs. But more enrollees will face higher costs in their current plans and would benefit from the opportunity to shop during open enrollment.