Medicare Part D: A First Look at Plan Offerings in 2015
Appendix 1: Information about Medicare Stand-Alone Prescription Drug Plans by State
| Table A1: Number of Stand-Alone Prescription Drug Plans by State, 2006-2015 | ||||||||||||
| STATE/TERRITORY | 2006 | 2007 | 2008 | 2009 | 2010 | 2011 | 2012 | 2013 | 2014 | 2015 | 2014-2015 change | |
| U.S. Total | 1,429 | 1,875 | 1,824 | 1,689 | 1,576 | 1,109 | 1,041 | 1,031 | 1,169 | 1,001 | -168 | |
| Alabama | 41 | 56 | 53 | 49 | 46 | 34 | 32 | 33 | 35 | 30 | -5 | |
| Alaska | 27 | 45 | 47 | 45 | 41 | 29 | 25 | 23 | 28 | 24 | -4 | |
| Arizona | 43 | 53 | 51 | 49 | 46 | 30 | 30 | 29 | 34 | 30 | -4 | |
| Arkansas | 40 | 58 | 55 | 52 | 49 | 34 | 30 | 30 | 34 | 29 | -5 | |
| California | 47 | 55 | 56 | 51 | 47 | 33 | 33 | 32 | 36 | 32 | -4 | |
| Colorado | 43 | 55 | 55 | 53 | 48 | 31 | 28 | 29 | 34 | 30 | -4 | |
| Connecticut | 44 | 51 | 51 | 47 | 48 | 34 | 30 | 30 | 33 | 27 | -6 | |
| Delaware | 47 | 55 | 52 | 48 | 45 | 33 | 31 | 29 | 36 | 27 | -9 | |
| District of Columbia | 47 | 55 | 52 | 48 | 45 | 33 | 31 | 29 | 36 | 27 | -9 | |
| Florida | 43 | 57 | 58 | 54 | 49 | 32 | 33 | 34 | 35 | 27 | -8 | |
| Georgia | 42 | 55 | 54 | 50 | 45 | 32 | 30 | 30 | 34 | 30 | -4 | |
| Hawaii | 29 | 46 | 49 | 47 | 41 | 28 | 25 | 23 | 29 | 25 | -4 | |
| Idaho | 44 | 56 | 54 | 51 | 48 | 35 | 33 | 32 | 37 | 31 | -6 | |
| Illinois | 42 | 56 | 53 | 49 | 46 | 35 | 33 | 32 | 38 | 33 | -5 | |
| Indiana | 42 | 53 | 52 | 48 | 44 | 32 | 31 | 31 | 35 | 31 | -4 | |
| Iowa | 41 | 53 | 52 | 48 | 46 | 33 | 33 | 32 | 34 | 30 | -4 | |
| Kansas | 40 | 53 | 52 | 48 | 46 | 33 | 31 | 30 | 33 | 29 | -4 | |
| Kentucky | 42 | 53 | 52 | 48 | 44 | 32 | 31 | 31 | 35 | 31 | -4 | |
| Louisiana | 39 | 52 | 50 | 47 | 45 | 32 | 30 | 30 | 33 | 28 | -5 | |
| Maine | 41 | 53 | 53 | 46 | 43 | 30 | 28 | 28 | 32 | 28 | -4 | |
| Maryland | 47 | 55 | 52 | 48 | 45 | 33 | 31 | 29 | 36 | 27 | -9 | |
| Massachusetts | 44 | 51 | 51 | 47 | 48 | 34 | 30 | 30 | 33 | 27 | -6 | |
| Michigan | 40 | 54 | 55 | 51 | 46 | 35 | 34 | 33 | 36 | 31 | -5 | |
| Minnesota | 41 | 53 | 52 | 48 | 46 | 33 | 33 | 32 | 34 | 30 | -4 | |
| Mississippi | 38 | 52 | 49 | 47 | 45 | 32 | 30 | 29 | 33 | 28 | -5 | |
| Missouri | 41 | 53 | 52 | 48 | 45 | 32 | 30 | 31 | 35 | 31 | -4 | |
| Montana | 41 | 53 | 52 | 48 | 46 | 33 | 33 | 32 | 34 | 30 | -4 | |
| Nebraska | 41 | 53 | 52 | 48 | 46 | 33 | 33 | 32 | 34 | 30 | -4 | |
| Nevada | 44 | 54 | 53 | 49 | 46 | 31 | 29 | 29 | 34 | 32 | -2 | |
| New Hampshire | 41 | 53 | 53 | 46 | 43 | 30 | 28 | 28 | 32 | 28 | -4 | |
| New Jersey | 44 | 57 | 57 | 52 | 47 | 33 | 30 | 29 | 34 | 29 | -5 | |
| New Mexico | 43 | 57 | 55 | 50 | 47 | 32 | 30 | 30 | 36 | 31 | -5 | |
| New York | 46 | 61 | 55 | 51 | 50 | 33 | 29 | 28 | 31 | 25 | -6 | |
| North Carolina | 38 | 51 | 52 | 49 | 47 | 33 | 30 | 30 | 34 | 29 | -5 | |
| North Dakota | 41 | 53 | 52 | 48 | 46 | 33 | 33 | 32 | 34 | 30 | -4 | |
| Ohio | 43 | 60 | 58 | 49 | 46 | 34 | 33 | 33 | 37 | 31 | -6 | |
| Oklahoma | 42 | 56 | 52 | 49 | 46 | 33 | 30 | 30 | 36 | 31 | -5 | |
| Oregon | 45 | 57 | 55 | 48 | 44 | 32 | 30 | 30 | 35 | 30 | -5 | |
| Pennsylvania | 52 | 66 | 63 | 57 | 55 | 38 | 36 | 38 | 39 | 29 | -10 | |
| Rhode Island | 44 | 51 | 51 | 47 | 48 | 34 | 30 | 30 | 33 | 27 | -6 | |
| South Carolina | 45 | 59 | 56 | 53 | 47 | 34 | 32 | 31 | 35 | 31 | -4 | |
| South Dakota | 41 | 53 | 52 | 48 | 46 | 33 | 33 | 32 | 34 | 30 | -4 | |
| Tennessee | 41 | 56 | 53 | 49 | 46 | 34 | 32 | 33 | 35 | 30 | -5 | |
| Texas | 47 | 60 | 56 | 53 | 50 | 33 | 33 | 32 | 36 | 32 | -4 | |
| Utah | 44 | 56 | 54 | 51 | 48 | 35 | 33 | 32 | 37 | 31 | -6 | |
| Vermont | 44 | 51 | 51 | 47 | 48 | 34 | 30 | 30 | 33 | 27 | -6 | |
| Virginia | 41 | 53 | 52 | 48 | 44 | 32 | 30 | 31 | 35 | 31 | -4 | |
| Washington | 45 | 57 | 55 | 48 | 44 | 32 | 30 | 30 | 35 | 30 | -5 | |
| West Virginia | 52 | 66 | 63 | 57 | 55 | 38 | 36 | 38 | 39 | 29 | -10 | |
| Wisconsin | 45 | 54 | 57 | 53 | 48 | 32 | 29 | 30 | 33 | 29 | -4 | |
| Wyoming | 41 | 53 | 52 | 48 | 46 | 33 | 33 | 32 | 34 | 30 | -4 | |
| TERRITORY | ||||||||||||
| American Samoa | 1 | 3 | 4 | 4 | 3 | 2 | 1 | 1 | 1 | 1 | 0 | |
| Guam | 1 | 3 | 4 | 4 | 3 | 2 | 1 | 1 | 1 | 2 | 1 | |
| Northern Mariana Islands | 1 | 3 | 4 | 4 | 3 | 2 | 1 | 1 | 1 | 1 | 0 | |
| Puerto Rico | 10 | 28 | 34 | 33 | 29 | 17 | 16 | 16 | 13 | 7 | -6 | |
| Virgin Islands | 4 | 6 | 7 | 7 | 6 | 4 | 3 | 1 | 1 | 1 | 0 | |
|
NOTE: Analysis includes 37 plans under CMS sanction and closed to new enrollees as of September 2014.
SOURCE: Georgetown/NORC/Kaiser Family Foundation analysis of CMS 2014-2015 PDP crosswalk and landscape source files.
|
||||||||||||
| Table A2: Monthly Premiums for Stand-Alone Prescription Drug Plans by State, 2015 | ||||
|
STATE/TERRITORY |
Minimum Premium | Maximum Premium | Weighted Average Premium | % Change, 2014-2015 |
| U.S. Total | $12.60 | $171.90 | $37.20 | 4.4% |
| Alabama | $15.60 | $133.10 | $37.92 | 0.1% |
| Alaska | $15.60 | $135.20 | $34.91 | 7.3% |
| Arizona | $15.70 | $133.70 | $31.57 | 8.6% |
| Arkansas | $15.60 | $138.60 | $38.25 | -0.8% |
| California | $15.70 | $145.70 | $36.87 | 6.1% |
| Colorado | $15.60 | $131.40 | $37.71 | 5.0% |
| Connecticut | $15.60 | $128.80 | $34.34 | 7.4% |
| Delaware | $15.70 | $127.10 | $39.56 | -5.2% |
| District of Columbia | $15.70 | $127.10 | $39.56 | -5.2% |
| Florida | $15.70 | $171.90 | $37.21 | 6.8% |
| Georgia | $15.70 | $127.10 | $36.30 | 2.4% |
| Hawaii | $15.60 | $127.10 | $30.33 | 2.3% |
| Idaho | $15.70 | $144.70 | $42.23 | 3.8% |
| Illinois | $15.70 | $131.90 | $35.99 | 9.4% |
| Indiana | $15.70 | $131.30 | $38.37 | 1.6% |
| Iowa | $15.70 | $139.20 | $36.81 | 7.7% |
| Kansas | $15.60 | $139.40 | $37.19 | 5.9% |
| Kentucky | $15.70 | $131.30 | $38.37 | 1.6% |
| Louisiana | $15.70 | $129.80 | $35.59 | -2.6% |
| Maine | $15.60 | $127.10 | $32.59 | 5.1% |
| Maryland | $15.70 | $127.10 | $39.56 | -5.2% |
| Massachusetts | $15.60 | $128.80 | $34.34 | 7.4% |
| Michigan | $15.70 | $107.10 | $38.01 | 4.8% |
| Minnesota | $15.70 | $139.20 | $36.81 | 7.7% |
| Mississippi | $15.60 | $127.10 | $36.81 | -0.3% |
| Missouri | $15.70 | $136.50 | $37.09 | 2.4% |
| Montana | $15.70 | $139.20 | $36.81 | 7.7% |
| Nebraska | $15.70 | $139.20 | $36.81 | 7.7% |
| Nevada | $15.70 | $127.10 | $35.46 | 4.0% |
| New Hampshire | $15.60 | $127.10 | $32.59 | 5.1% |
| New Jersey | $15.70 | $137.10 | $42.37 | 5.2% |
| New Mexico | $12.60 | $127.10 | $26.66 | 4.7% |
| New York | $15.70 | $143.00 | $38.58 | 1.4% |
| North Carolina | $15.70 | $133.50 | $37.32 | 9.0% |
| North Dakota | $15.70 | $139.20 | $36.81 | 7.7% |
| Ohio | $15.60 | $114.00 | $34.94 | 5.0% |
| Oklahoma | $15.70 | $140.90 | $37.69 | 5.0% |
| Oregon | $15.70 | $155.50 | $38.18 | 3.1% |
| Pennsylvania | $15.70 | $151.80 | $38.04 | 3.4% |
| Rhode Island | $15.60 | $128.80 | $34.34 | 7.4% |
| South Carolina | $15.60 | $141.70 | $40.47 | 3.5% |
| South Dakota | $15.70 | $139.20 | $36.81 | 7.7% |
| Tennessee | $15.60 | $133.10 | $37.92 | 0.1% |
| Texas | $15.60 | $152.10 | $37.05 | 2.7% |
| Utah | $15.70 | $144.70 | $42.23 | 3.8% |
| Vermont | $15.60 | $128.80 | $34.34 | 7.4% |
| Virginia | $15.60 | $126.00 | $36.63 | 6.9% |
| Washington | $15.70 | $155.50 | $38.18 | 3.1% |
| West Virginia | $15.70 | $151.80 | $38.04 | 3.4% |
| Wisconsin | $15.70 | $130.00 | $38.53 | 5.3% |
| Wyoming | $15.70 | $139.20 | $36.81 | 7.7% |
|
TERRITORY |
||||
| American Samoa | $24.80 | $24.80 | $24.80 | 22.8% |
| Guam | $21.40 | $23.70 | $21.40 | 4.4% |
| Northern Mariana Islands | $11.70 | $11.70 | $11.70 | 8.3% |
| Puerto Rico | $0.10 | $63.50 | $38.94 | 8.5% |
| Virgin Islands | $43.60 | $43.60 | $43.60 | 33.7% |
|
NOTE: Analysis includes 37 plans under CMS sanction and closed to new enrollees as of September 2014. Average monthly premium is weighted by 2014 enrollments for the region in which the state is located. Terminated plans are excluded in calculation of premium change.
SOURCE: Georgetown/NORC/Kaiser Family Foundation analysis of CMS 2014-2015 PDP crosswalk and landscape source files.
|
||||
| Table A3: Number of Stand-Alone Prescription Drug Plans With No Coverage in the Gap by State, 2006-2015* | ||||||||||
| STATE/TERRITORY | 2006 | 2007 | 2008 | 2009 | 2010 | 2011 | 2012 | 2013 | 2014 | 2015 |
| U.S. Total | 1,208 | 1,328 | 1,295 | 1,273 | 1,268 | 744 | 771 | 684 | 891 | 740 |
| Alabama | 35 | 39 | 38 | 38 | 37 | 24 | 24 | 22 | 28 | 23 |
| Alaska | 22 | 33 | 33 | 34 | 34 | 20 | 19 | 16 | 22 | 19 |
| Arizona | 37 | 38 | 36 | 37 | 38 | 21 | 23 | 19 | 27 | 23 |
| Arkansas | 34 | 40 | 39 | 39 | 39 | 23 | 22 | 21 | 27 | 22 |
| California | 40 | 41 | 41 | 39 | 38 | 22 | 23 | 21 | 27 | 23 |
| Colorado | 36 | 40 | 39 | 40 | 39 | 21 | 21 | 19 | 25 | 22 |
| Connecticut | 37 | 36 | 36 | 35 | 38 | 23 | 23 | 20 | 25 | 20 |
| Delaware | 41 | 39 | 37 | 36 | 36 | 22 | 23 | 20 | 27 | 20 |
| District of Columbia | 41 | 39 | 37 | 36 | 36 | 22 | 23 | 20 | 27 | 20 |
| Florida | 35 | 41 | 40 | 39 | 39 | 21 | 23 | 21 | 26 | 20 |
| Georgia | 35 | 39 | 39 | 38 | 36 | 21 | 22 | 19 | 25 | 21 |
| Hawaii | 24 | 34 | 34 | 35 | 32 | 19 | 19 | 16 | 23 | 20 |
| Idaho | 38 | 40 | 39 | 39 | 39 | 24 | 26 | 23 | 29 | 24 |
| Illinois | 36 | 40 | 38 | 37 | 37 | 23 | 24 | 21 | 30 | 25 |
| Indiana | 35 | 37 | 37 | 36 | 35 | 21 | 22 | 19 | 26 | 22 |
| Iowa | 34 | 38 | 36 | 36 | 37 | 22 | 24 | 21 | 26 | 22 |
| Kansas | 33 | 37 | 37 | 36 | 37 | 22 | 23 | 20 | 25 | 21 |
| Kentucky | 35 | 37 | 37 | 36 | 35 | 21 | 22 | 19 | 26 | 22 |
| Louisiana | 33 | 37 | 36 | 36 | 37 | 22 | 23 | 21 | 26 | 21 |
| Maine | 35 | 37 | 37 | 34 | 35 | 20 | 21 | 18 | 24 | 21 |
| Maryland | 41 | 39 | 37 | 36 | 36 | 22 | 23 | 20 | 27 | 20 |
| Massachusetts | 37 | 36 | 36 | 35 | 38 | 23 | 23 | 20 | 25 | 20 |
| Michigan | 34 | 39 | 39 | 38 | 37 | 24 | 25 | 22 | 28 | 23 |
| Minnesota | 34 | 38 | 36 | 36 | 37 | 22 | 24 | 21 | 26 | 22 |
| Mississippi | 32 | 37 | 35 | 36 | 37 | 22 | 23 | 20 | 26 | 21 |
| Missouri | 34 | 37 | 37 | 36 | 36 | 21 | 22 | 20 | 26 | 22 |
| Montana | 34 | 38 | 36 | 36 | 37 | 22 | 24 | 21 | 26 | 22 |
| Nebraska | 34 | 38 | 36 | 36 | 37 | 22 | 24 | 21 | 26 | 22 |
| Nevada | 37 | 38 | 38 | 37 | 38 | 21 | 22 | 19 | 25 | 22 |
| New Hampshire | 35 | 37 | 37 | 34 | 35 | 20 | 21 | 18 | 24 | 21 |
| New Jersey | 38 | 40 | 39 | 39 | 37 | 22 | 23 | 20 | 26 | 21 |
| New Mexico | 37 | 40 | 39 | 38 | 39 | 22 | 23 | 20 | 27 | 23 |
| New York | 40 | 44 | 40 | 39 | 41 | 23 | 22 | 20 | 24 | 19 |
| North Carolina | 31 | 36 | 36 | 36 | 37 | 22 | 22 | 20 | 26 | 21 |
| North Dakota | 34 | 38 | 36 | 36 | 37 | 22 | 24 | 21 | 26 | 22 |
| Ohio | 36 | 43 | 41 | 37 | 37 | 22 | 23 | 20 | 27 | 22 |
| Oklahoma | 35 | 40 | 37 | 37 | 37 | 22 | 23 | 21 | 28 | 23 |
| Oregon | 39 | 40 | 38 | 36 | 35 | 21 | 23 | 21 | 27 | 23 |
| Pennsylvania | 44 | 47 | 46 | 44 | 44 | 25 | 25 | 23 | 29 | 22 |
| Rhode Island | 37 | 36 | 36 | 35 | 38 | 23 | 23 | 20 | 25 | 20 |
| South Carolina | 39 | 43 | 41 | 41 | 38 | 23 | 24 | 21 | 27 | 23 |
| South Dakota | 34 | 38 | 36 | 36 | 37 | 22 | 24 | 21 | 26 | 22 |
| Tennessee | 35 | 39 | 38 | 38 | 37 | 24 | 24 | 22 | 28 | 23 |
| Texas | 41 | 43 | 40 | 40 | 40 | 22 | 24 | 21 | 28 | 24 |
| Utah | 38 | 40 | 39 | 39 | 39 | 24 | 26 | 23 | 29 | 24 |
| Vermont | 37 | 36 | 36 | 35 | 38 | 23 | 23 | 20 | 25 | 20 |
| Virginia | 35 | 37 | 37 | 36 | 35 | 21 | 22 | 20 | 26 | 22 |
| Washington | 39 | 40 | 38 | 36 | 35 | 21 | 23 | 21 | 27 | 23 |
| West Virginia | 44 | 47 | 46 | 44 | 44 | 25 | 25 | 23 | 29 | 22 |
| Wisconsin | 36 | 38 | 40 | 39 | 37 | 20 | 20 | 19 | 23 | 20 |
| Wyoming | 34 | 38 | 36 | 36 | 37 | 22 | 24 | 21 | 26 | 22 |
| TERRITORY | ||||||||||
| American Samoa | 1 | 2 | 3 | 3 | 2 | 1 | 1 | 1 | 0 | 1 |
| Guam | 1 | 2 | 3 | 3 | 2 | 1 | 1 | 1 | 0 | 2 |
| Northern Mariana Islands | 1 | 2 | 3 | 3 | 2 | 1 | 1 | 1 | 0 | 1 |
| Puerto Rico | 9 | 21 | 22 | 22 | 21 | 11 | 13 | 11 | 9 | 6 |
| Virgin Islands | 4 | 4 | 5 | 5 | 4 | 3 | 3 | 1 | 0 | 1 |
|
NOTE: Total for 2015 includes 37 plans under CMS sanction and closed to new enrollees as of September 2014. Prior to 2015, plan counts reflect the number of plans offering no coverage in the gap, excluding plans that offer coverage of “few” brands or generics in the gap (where “few” is defined as more than zero percent to less than 10 percent of formulary drugs). *2011-2015 numbers reflect plans not offering additional coverage in the gap beyond what the law requires. Beginning in 2011, all Part D plans were required to offer additional coverage of drug costs in the coverage gap (a provision in the Affordable Care Act of 2010). In 2015, beneficiaries will receive a 50% price discount and a 5% payment by plans toward the cost of brand-name drugs and 35% plan payment toward the cost of generic drugs. By 2020, the coverage gap will be phased out and beneficiaries will be responsible for 25% of their total drug costs prior to qualifying for catastrophic coverage.
SOURCE: Georgetown/NORC/Kaiser Family Foundation analysis of CMS 2006-2015 PDP landscape source files.
|
||||||||||
| Table A4: Number of Stand-Alone Prescription Drug Plans Below Low-Income Subsidy Benchmark by State, 2006-2015 | ||||||||||
|
STATE/TERRITORY |
2006 | 2007 | 2008 | 2009 | 2010 | 2011 | 2012 | 2013 | 2014 | 2015 |
| U.S. Total | 409 | 640 | 495 | 308 | 307 | 332 | 327 | 331 | 352 | 283 |
| Alabama | 9 | 17 | 15 | 12 | 9 | 11 | 12 | 13 | 11 | 12 |
| Alaska | 8 | 17 | 15 | 7 | 6 | 5 | 4 | 7 | 11 | 7 |
| Arizona | 6 | 10 | 7 | 2 | 8 | 9 | 10 | 10 | 11 | 12 |
| Arkansas | 13 | 23 | 18 | 12 | 15 | 17 | 15 | 15 | 12 | 6 |
| California | 10 | 14 | 9 | 6 | 7 | 5 | 6 | 6 | 9 | 6 |
| Colorado | 10 | 19 | 12 | 8 | 6 | 7 | 5 | 4 | 5 | 7 |
| Connecticut | 11 | 20 | 14 | 12 | 13 | 12 | 10 | 6 | 8 | 5 |
| Delaware | 15 | 21 | 18 | 11 | 11 | 12 | 13 | 13 | 13 | 10 |
| District of Columbia | 15 | 21 | 18 | 11 | 11 | 12 | 13 | 13 | 13 | 10 |
| Florida | 6 | 10 | 8 | 5 | 5 | 4 | 3 | 2 | 5 | 4 |
| Georgia | 14 | 21 | 18 | 11 | 8 | 14 | 12 | 13 | 9 | 8 |
| Hawaii | 8 | 18 | 10 | 5 | 7 | 6 | 10 | 10 | 4 | 9 |
| Idaho | 14 | 20 | 14 | 9 | 9 | 11 | 12 | 10 | 13 | 12 |
| Illinois | 15 | 23 | 19 | 12 | 10 | 10 | 10 | 10 | 14 | 10 |
| Indiana | 13 | 19 | 17 | 12 | 9 | 14 | 13 | 11 | 15 | 10 |
| Iowa | 14 | 20 | 16 | 9 | 8 | 10 | 9 | 8 | 10 | 5 |
| Kansas | 11 | 20 | 17 | 10 | 9 | 12 | 10 | 10 | 13 | 7 |
| Kentucky | 13 | 19 | 17 | 12 | 9 | 14 | 13 | 11 | 15 | 10 |
| Louisiana | 11 | 12 | 10 | 7 | 13 | 10 | 12 | 14 | 14 | 11 |
| Maine | 14 | 21 | 18 | 5 | 4 | 7 | 8 | 10 | 7 | 9 |
| Maryland | 15 | 21 | 18 | 11 | 11 | 12 | 13 | 13 | 13 | 10 |
| Massachusetts | 11 | 20 | 14 | 12 | 13 | 12 | 10 | 6 | 8 | 5 |
| Michigan | 14 | 26 | 17 | 11 | 9 | 12 | 12 | 10 | 13 | 10 |
| Minnesota | 14 | 20 | 16 | 9 | 8 | 10 | 9 | 8 | 10 | 5 |
| Mississippi | 12 | 21 | 15 | 13 | 10 | 14 | 12 | 13 | 13 | 9 |
| Missouri | 10 | 15 | 13 | 6 | 13 | 5 | 8 | 8 | 8 | 6 |
| Montana | 14 | 20 | 16 | 9 | 8 | 10 | 9 | 8 | 10 | 5 |
| Nebraska | 14 | 20 | 16 | 9 | 8 | 10 | 9 | 8 | 10 | 5 |
| Nevada | 7 | 9 | 5 | 1 | 5 | 4 | 2 | 2 | 4 | 4 |
| New Hampshire | 14 | 21 | 18 | 5 | 4 | 7 | 8 | 10 | 7 | 9 |
| New Jersey | 14 | 20 | 18 | 7 | 6 | 6 | 9 | 10 | 12 | 10 |
| New Mexico | 8 | 14 | 11 | 7 | 8 | 8 | 6 | 7 | 7 | 7 |
| New York | 15 | 16 | 15 | 9 | 11 | 11 | 12 | 12 | 8 | 8 |
| North Carolina | 13 | 21 | 17 | 11 | 8 | 11 | 9 | 8 | 10 | 8 |
| North Dakota | 14 | 20 | 16 | 9 | 8 | 10 | 9 | 8 | 10 | 5 |
| Ohio | 10 | 22 | 15 | 6 | 5 | 8 | 8 | 8 | 12 | 8 |
| Oklahoma | 12 | 20 | 13 | 8 | 10 | 10 | 9 | 11 | 12 | 10 |
| Oregon | 15 | 20 | 15 | 7 | 9 | 8 | 9 | 10 | 12 | 10 |
| Pennsylvania | 15 | 26 | 18 | 9 | 11 | 12 | 12 | 14 | 13 | 9 |
| Rhode Island | 11 | 20 | 14 | 12 | 13 | 12 | 10 | 6 | 8 | 5 |
| South Carolina | 16 | 26 | 20 | 15 | 13 | 15 | 12 | 14 | 8 | 7 |
| South Dakota | 14 | 20 | 16 | 9 | 8 | 10 | 9 | 8 | 10 | 5 |
| Tennessee | 9 | 17 | 15 | 12 | 9 | 11 | 12 | 13 | 11 | 12 |
| Texas | 16 | 19 | 15 | 14 | 11 | 12 | 13 | 12 | 11 | 10 |
| Utah | 14 | 20 | 14 | 9 | 9 | 11 | 12 | 10 | 13 | 12 |
| Vermont | 11 | 20 | 14 | 12 | 13 | 12 | 10 | 6 | 8 | 5 |
| Virginia | 16 | 21 | 17 | 13 | 11 | 10 | 10 | 10 | 13 | 9 |
| Washington | 15 | 20 | 15 | 7 | 9 | 8 | 9 | 10 | 12 | 10 |
| West Virginia | 15 | 26 | 18 | 9 | 11 | 12 | 12 | 14 | 13 | 9 |
| Wisconsin | 14 | 21 | 16 | 16 | 10 | 10 | 10 | 10 | 12 | 8 |
| Wyoming | 14 | 20 | 16 | 9 | 8 | 10 | 9 | 8 | 10 | 5 |
|
TERRITORY |
||||||||||
| American Samoa | N/A | N/A | N/A | N/A | N/A | N/A | N/A | N/A | N/A | N/A |
| Guam | N/A | N/A | N/A | N/A | N/A | N/A | N/A | N/A | N/A | N/A |
| Northern Mariana Islands | N/A | N/A | N/A | N/A | N/A | N/A | N/A | N/A | N/A | N/A |
| Puerto Rico | N/A | N/A | N/A | N/A | N/A | N/A | N/A | N/A | N/A | N/A |
| Virgin Islands | N/A | N/A | N/A | N/A | N/A | N/A | N/A | N/A | N/A | N/A |
|
NOTE: Benchmark plans are not designated (N/A) in the territories because low-income beneficiaries residing in the territories are not eligible for the low-income subsidy. Analysis for 2015 includes 27 benchmark plans under CMS sanction and closed to new enrollees as of September 2014.
SOURCE: Georgetown/NORC/Kaiser Family Foundation analysis of CMS 2006-2015 PDP landscape source files.
|
||||||||||
Appendix 2: Medicare Part D Standard Benefit Parameters, 2006-2015
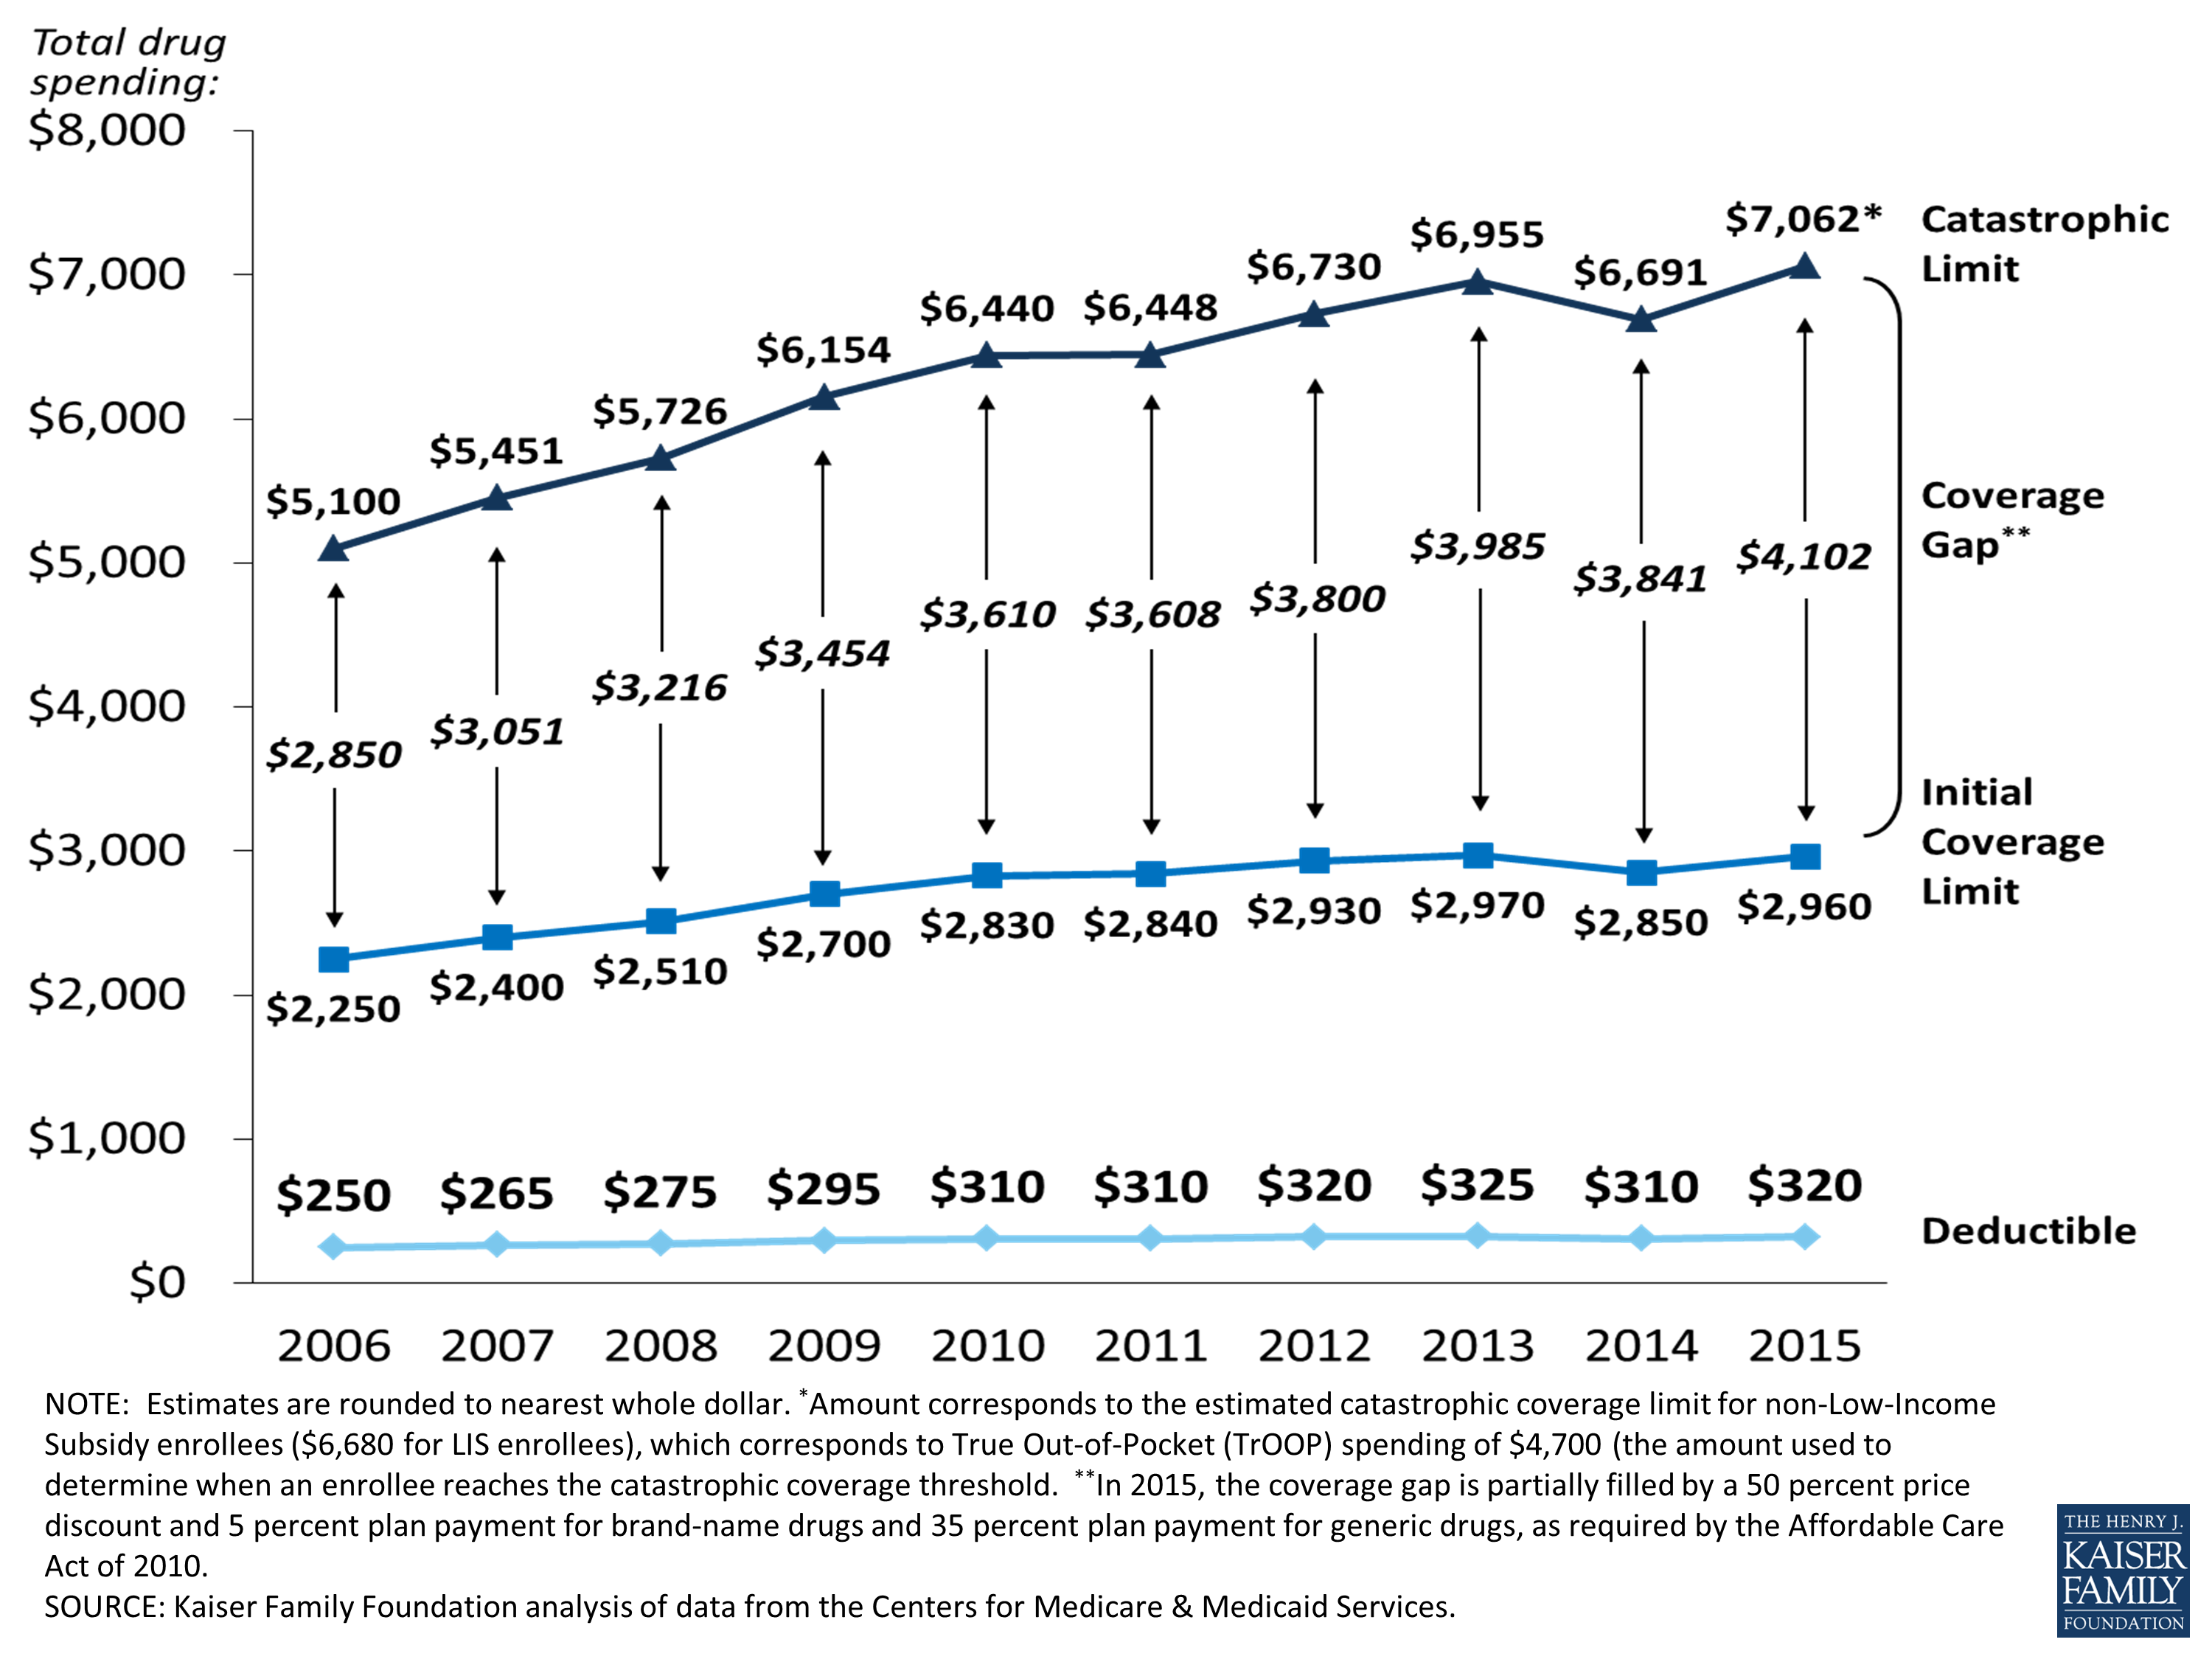
Appendix 2: Medicare Part D Standard Benefit Parameters, 2006-2015