Medicare Beneficiaries’ Out-of-Pocket Health Care Spending as a Share of Income Now and Projections for the Future
Introduction
Medicare helps pay for the health care needs of 59 million people ages 65 and over and younger people living with permanent disabilities. Yet, people with Medicare can face significant health-related out-of-pocket costs, including premiums, deductibles, cost sharing for Medicare-covered services, and costs for services Medicare does not cover, such as long-term services and supports and dental services. With half of all Medicare beneficiaries living on annual per capita income of less than $26,200, out-of-pocket health care costs can pose a challenge, particularly for beneficiaries with modest incomes and those with significant medical needs.
As one way of measuring health care affordability for people with Medicare, each year the Medicare Trustees estimate Medicare Part B and Part D premiums and cost sharing as a share of average Social Security benefits. This estimate, however, does not include other health-related costs, such as out-of-pocket spending on hospital and skilled nursing facility stays, supplemental insurance premiums, and costs for services not covered by Medicare. The estimate also does not include income from sources other than Social Security.
In this analysis, we assess the current and projected out-of-pocket health care spending burden among Medicare beneficiaries using a broad definition of health care expenses, and in relation to both per capita Social Security and total income. Our results suggest that rising health care costs pose significant affordability challenges for many people on Medicare today, particularly those with relatively low incomes who derive most of their income from Social Security, and that this burden can be expected to grow in the future. This analysis sets the context for understanding the implications of potential changes to Medicare, Medicaid, or Social Security that could shift more health care costs onto beneficiaries or reduce their future retirement income.
Overview of Methods
This analysis of Medicare beneficiaries’ out-of-pocket health care spending burden uses two different approaches. First, we calculate average total per capita out-of-pocket spending as a share of average per capita Social Security income for all Medicare beneficiaries and by subgroup, which enables us to compare our results to the Medicare Trustees’ estimates. Second, we calculate a ratio of out-of-pocket spending to total income at the individual level for beneficiaries in traditional Medicare, and then estimate the median—an approach that addresses the distortion of averages by outlier values for both spending and income.
Under both approaches, we use a broad measure of Medicare beneficiaries’ total out-of-pocket health care spending that includes health insurance premiums, cost sharing for Medicare-covered services, and costs for services not covered by Medicare, such as dental and long-term care. We use data on out-of-pocket spending from the Medicare Current Beneficiary Survey (MCBS), a nationally representative survey of Medicare beneficiaries, and income data from The Urban Institute’s Dynamic Simulation of Income Model (DYNASIM3), a predictive microsimulation model that takes into account income from all sources, including Social Security, wages, pensions, and asset income including withdrawals from IRAs.1 We calculate per capita Social Security and total income for married couples by dividing income for the couple in half, which recognizes that couples share resources and facilitates comparisons of the spending burden for married and unmarried individuals on a per capita basis. We present estimates of the out-of-pocket health care spending burden for beneficiaries overall, and by demographic, socioeconomic, and health status measures, for 2013 and projections for 2030, in constant 2016 dollars.
The out-of-pocket health care spending burden projections are based on current law; that is, we assume no changes in Medicare and Medicaid policies that would affect out-of-pocket costs and no changes to Social Security and tax policy that would affect retirement income between 2013 and 2030. For additional details on the data and methods and limitations of this analysis, see the Methodology appendix.
Findings
In Section 1, we present findings from our analysis of average per capita out-of-pocket spending as a share of average per capita Social Security income in 2013 for all Medicare beneficiaries (including beneficiaries in traditional Medicare and Medicare Advantage plan enrollees), followed by projections for 2030. In Section 2, we present the results of the analysis of median per capita out-of-pocket spending as a share of per capita total income for beneficiaries in traditional Medicare (excluding Medicare Advantage enrollees), and estimates of the share of beneficiaries who spent at least 10 percent and 20 percent of their per capita total income on out-of-pocket health care costs, in 2013 and projections for 2030. In both sections, we discuss variations in the financial burden by demographics, such as income and gender, and by health status.
Section 1: Medicare Beneficiaries’ Out-of-Pocket Health Care Spending as a Share of Per Capita Social Security Income
Out-of-Pocket Spending as a Share of Per Capita Social Security Income in 2013
Across all Medicare beneficiaries, average out-of-pocket spending on health-related expenses consumed 41 percent of average per capita Social Security income in 2013 (Figure 2). As expected, this is substantially higher than the share reported by the Medicare actuaries for the same year (23 percent) because it takes into account the full array of out-of-pocket health expenses that people on Medicare face (Figure 3).2 In contrast, the Medicare Trustees looked at the financial burden associated with Medicare Part B and Part D premiums and cost sharing, but not other health expenses.
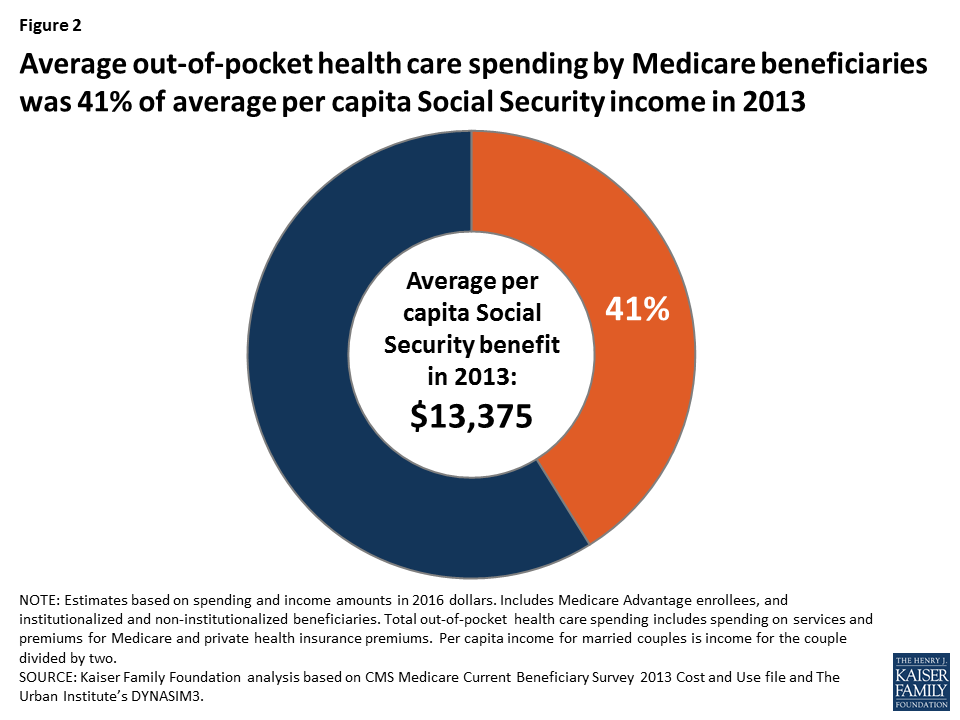
Figure 2: Average out-of-pocket health care spending by Medicare beneficiaries was 41% of average per capita Social Security income in 2013
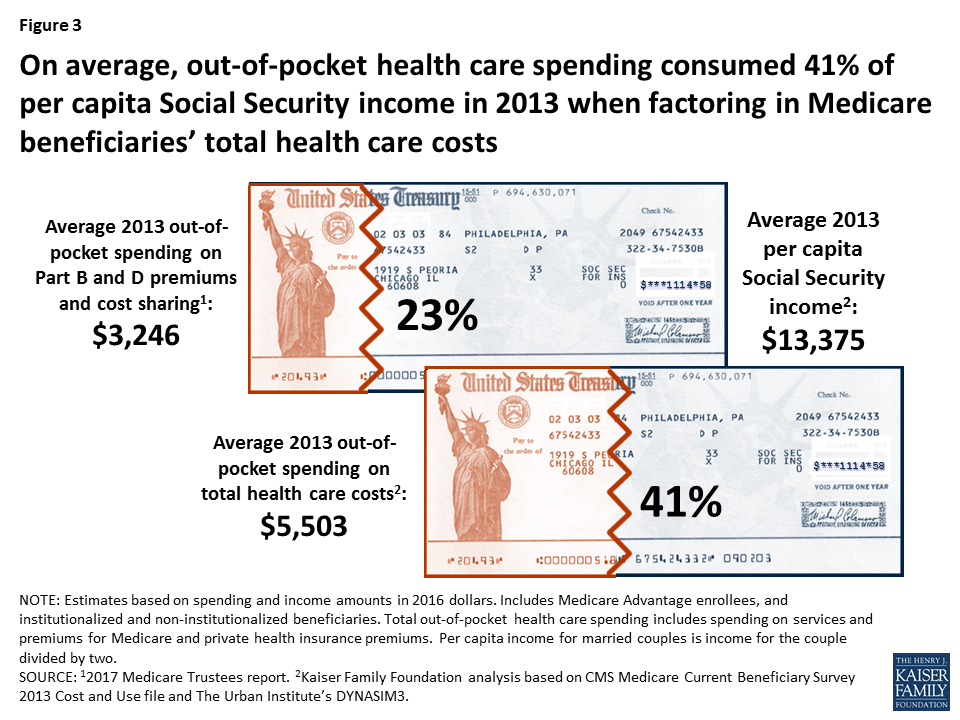
Figure 3: On average, out-of-pocket health care spending consumed 41% of per capita Social Security income in 2013 when factoring in Medicare beneficiaries’ total health care costs
Average out-of-pocket health care spending as a share of average per capita Social Security income in 2013 varied by demographic, socioeconomic, and health status indicators, reflecting differences in both average out-of-pocket spending and average Social Security income across different groups.
- Age: Out-of-pocket spending as a share of per capita Social Security income increased steeply with age, more than doubling from 34 percent for beneficiaries ages 65 to 74 to 74 percent among beneficiaries ages 85 and over, on average. This increase is likely related to much higher out-of-pocket spending on long-term care services and supports among the oldest beneficiaries,3 along with the fact that older Social Security beneficiaries also have lower per capita benefits than younger beneficiaries (Figure 4).4
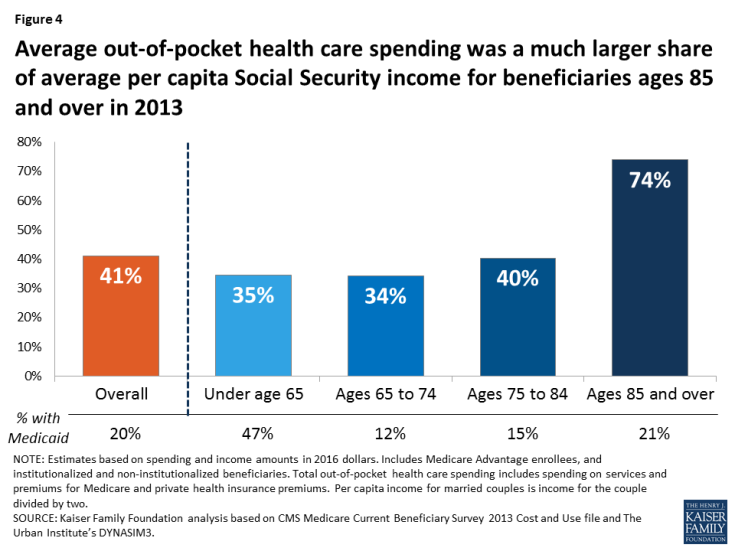
Figure 4: Average out-of-pocket health care spending was a much larger share of average per capita Social Security income for beneficiaries ages 85 and over in 2013
Beneficiaries under age 65 with disabilities faced average out-of-pocket health care costs that equaled 35 percent of their average per capita Social Security income in 2013, roughly the same share as for those ages 65 to 74. Although average per capita Social Security income was lower for beneficiaries under age 65, they also incurred lower out-of-pocket costs, on average, likely due to a higher rate of Medicaid coverage, which helps pay Medicare cost sharing and premiums and helps cover the cost of services not covered by Medicare, such as nursing home care and home and-community based services.
- Gender: Average out-of-pocket spending as a share of average per capita Social Security income was higher for women (44 percent) than men (38 percent), particularly among those ages 85 and over (83 percent and 58 percent, respectively) (Figure 5). After adjusting for marital status (dividing Social Security benefits in half for married couples), average per capita Social Security income was similar for women and men in 2013,5 but women on Medicare spent more out of pocket on health care costs than men, on average.

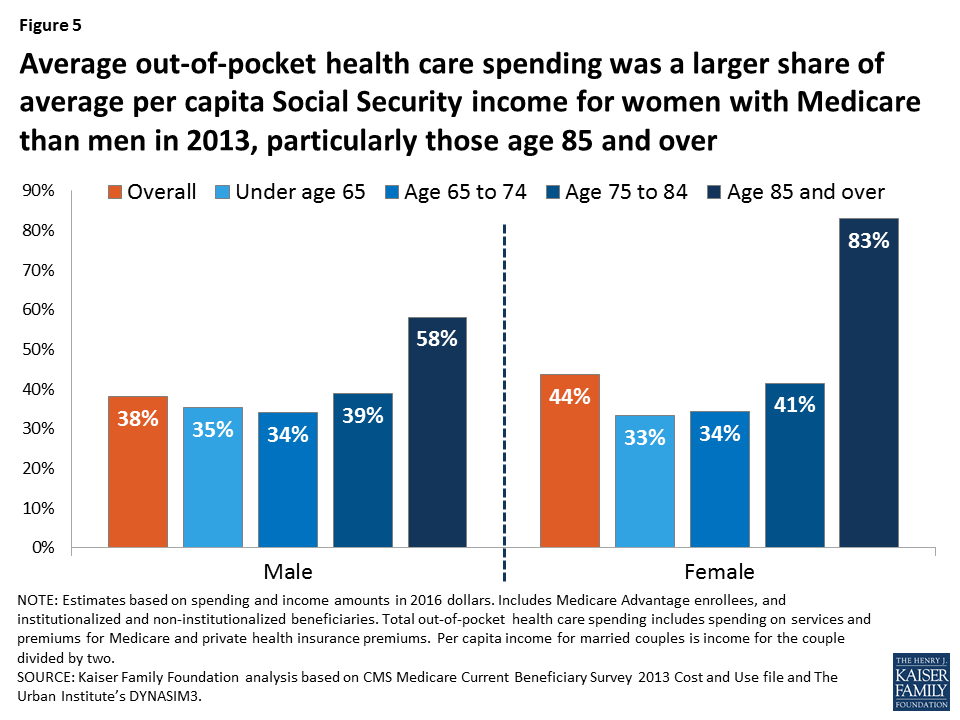
Figure 5: Average out-of-pocket health care spending was a larger share of average per capita Social Security income for women with Medicare than men in 2013, particularly those age 85 and over
- Race/ethnicity: Black beneficiaries faced lower average out-of-pocket health care costs as a share of average per capita Social Security income than whites or Hispanics in 2013 (31 percent, 43 percent, and 40 percent, respectively) (Table 1). The relatively low burden for black beneficiaries compared to white and Hispanic beneficiaries is a function of both lower average out-of-pocket spending by black beneficiaries than white beneficiaries and higher average per capita Social Security income for black beneficiaries than Hispanic beneficiaries. Lower average per capita Social Security income among Hispanic beneficiaries is related to immigration trends and fewer years of earnings that qualify them for Social Security.6
Lower out-of-pocket spending by black Medicare beneficiaries compared to white beneficiaries is related to the fact that a larger percentage of black beneficiaries have relatively low incomes, meaning that a larger share of them qualify for both Medicaid and the Part D Low-Income Subsidy (LIS), programs that help cover Medicare premiums and cost sharing, and in the case of Medicaid, other services not covered by Medicare.7 - Income: Average out-of-pocket spending rises with income as higher-income beneficiaries are more likely to purchase supplemental health insurance and are less likely to be covered by Medicaid than lower-income beneficiaries. Higher-income beneficiaries can also afford more expensive forms of health care. While out-of-pocket spending rises with income, spending as a share of per capita Social Security income is higher for lower-income beneficiaries. For example, average out-of-pocket spending by beneficiaries with per capita income below $10,000 ($3,563) equaled 78 percent of average per capita Social Security income in 2013, compared to 37 percent for those with income between $20,000 and $30,000 (who spent $5,836 on out-of-pocket health care costs in 2013, on average) and 42 percent for those with income above $50,000 ($6,993 out of pocket).
- Health status: Average out-of-pocket spending by beneficiaries in relatively fair or poor health equaled a larger share of their average per capita Social Security income in 2013, relative to those in better health (Figure 6). For example, average out-of-pocket spending by those in fair or poor self-reported health ($6,128) equaled 47 percent of their average per capita Social Security income in 2013, compared to 38 percent for those in good or better self-reported health. For beneficiaries with any functional impairments, with average out-of-pocket spending of $6,946 in 2013, their out-of-pocket health care costs equaled 54 percent of their average per capita Social Security income, compared to 34 percent for those with no functional impairments.
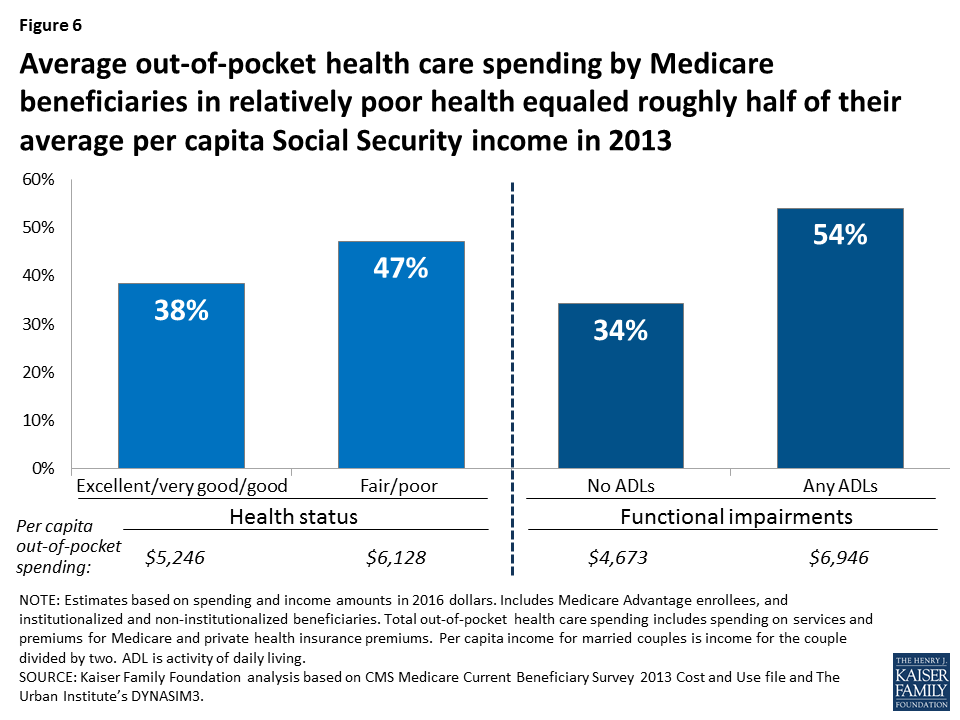
Figure 6: Average out-of-pocket health care spending by Medicare beneficiaries in relatively poor health equaled roughly half of their average per capita Social Security income in 2013
Projected out-of-Pocket Spending as a Share of Per Capita Social Security Income in 2030
Average out-of-pocket health care spending is projected to consume a larger share of per capita Social Security income over time, increasing from 41 percent in 2013 to 50 percent in 2030 (Figure 7). In other words, Medicare beneficiaries are projected to spend fully half of their per capita Social Security benefit on out-of-pocket health care costs in 2030, on average.
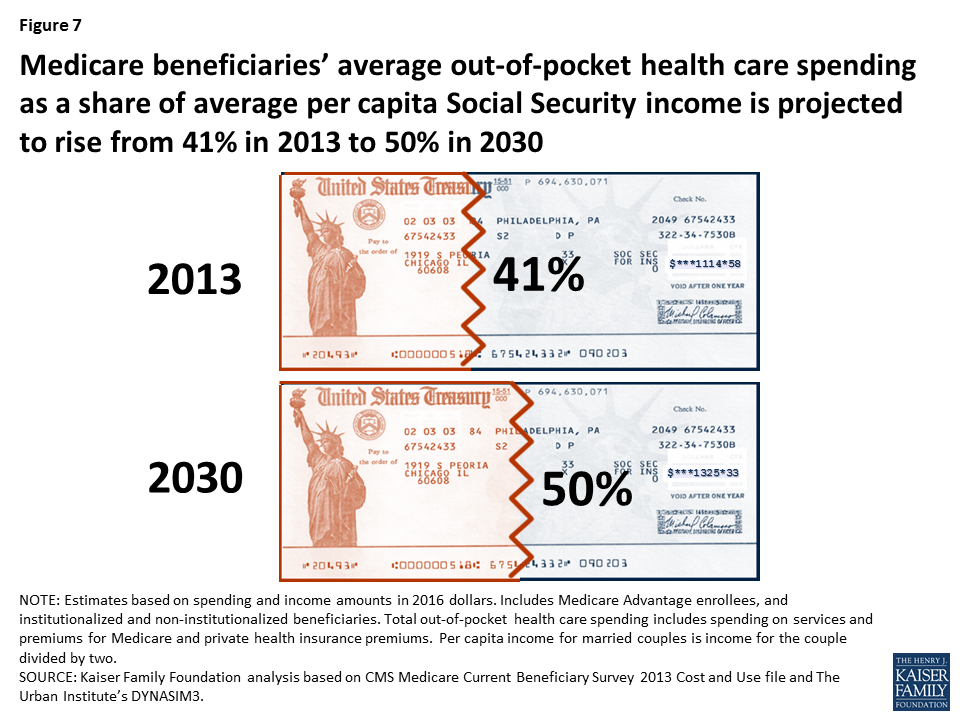
Figure 7: Medicare beneficiaries’ average out-of-pocket health care spending as a share of average per capita Social Security income is projected to rise from 41% in 2013 to 50% in 2030
While all demographic subgroups are projected to face an increase in their out-of-pocket health care spending as a share of per capita Social Security income between 2013 and 2030, some demographic groups are expected to see a larger increase than others.
- Age: Between 2013 and 2030, Medicare beneficiaries ages 85 and over are projected to experience a larger percentage point increase in their average out-of-pocket spending as a share of average per capita Social Security income (from 74 percent to 87 percent) than beneficiaries ages 65 to 74 (34 percent to 44 percent) (Figure 8). Older beneficiaries are projected to spend $4,400 more out of pocket for health care, on average, in 2030 than 2013, while those ages 65 to 74 are projected to spend $2,000 more, on average (Table 1).
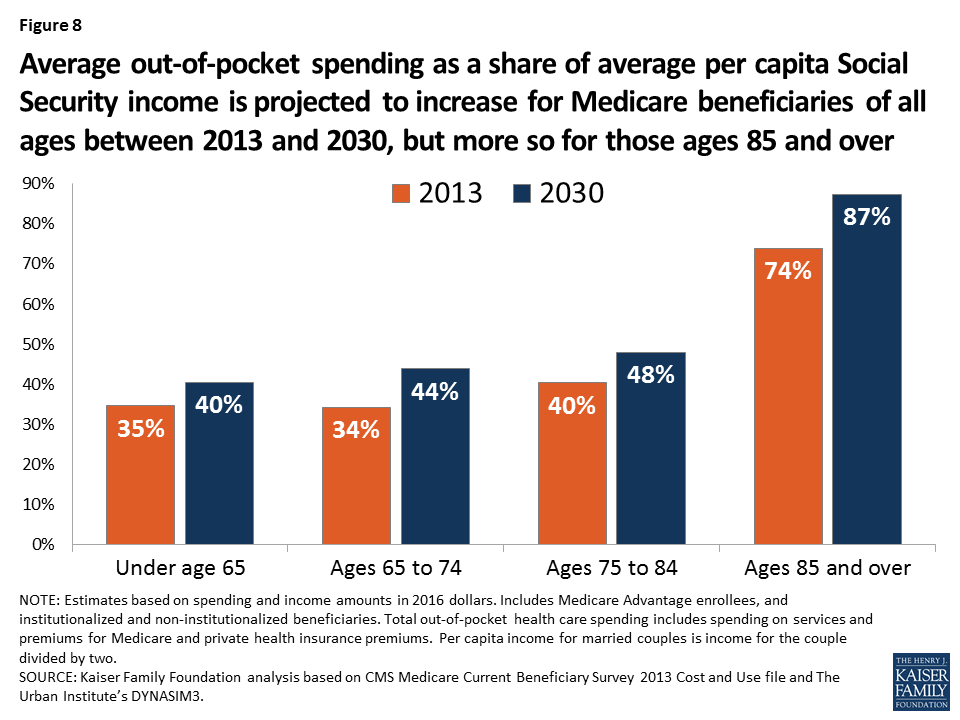
Figure 8: Average out-of-pocket spending as a share of average per capita Social Security income is projected to increase for Medicare beneficiaries of all ages between 2013 and 2030, but more so for those ages 85 and over
- Gender: In 2030, average out-of-pocket health care costs are projected to equal a larger share of per capita Social Security income for both women and men on Medicare than in 2013 (Figure 9). In 2030, average out-of-pocket costs are projected to consume more than half (52 percent) of average per capita Social Security income for women on Medicare and nearly half (47 percent) for men.
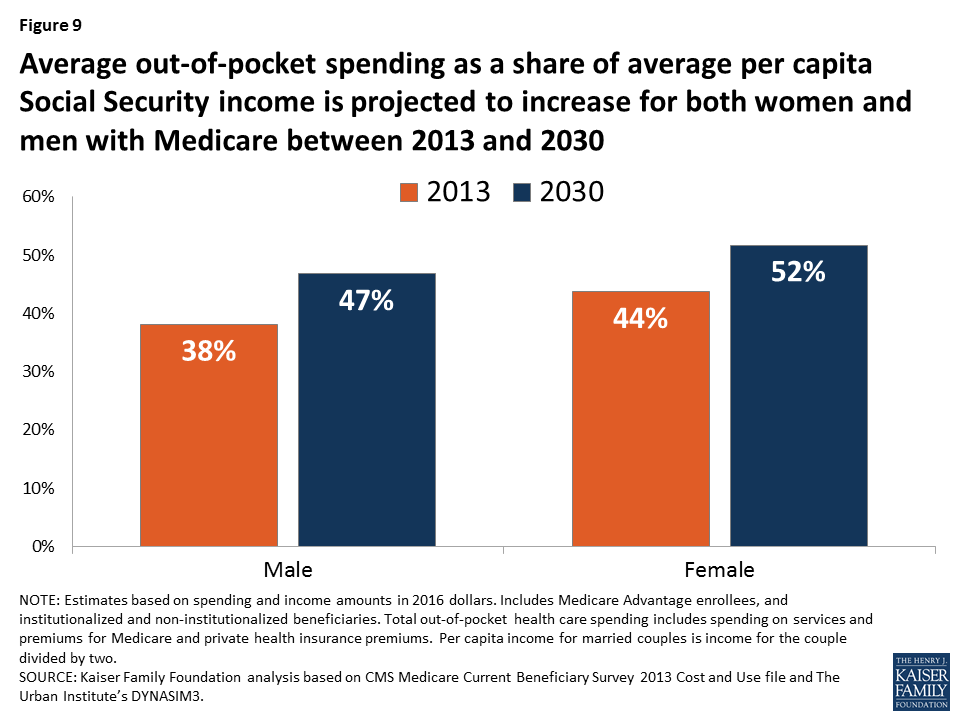
Figure 9: Average out-of-pocket spending as a share of average per capita Social Security income is projected to increase for both women and men with Medicare between 2013 and 2030
- Race/ethnicity: Average out-of-pocket health care spending as a share of average per capita Social Security income is projected to be higher for white and Hispanic beneficiaries in 2030 than black beneficiaries (Table 1). White beneficiaries’ average out-of-pocket health care costs are projected to equal half of their average Social Security income in 2030, compared to 47 percent for Hispanic beneficiaries and 37 percent for black beneficiaries.
- Income: Average out-of-pocket spending is projected to rise with income in 2030, but out-of-pocket health care spending as a share of per capita Social Security income is expected to be highest for those with the lowest incomes. Average out-of-pocket health care costs are projected to exceed (118 percent) average per capita Social Security income in 2030 for beneficiaries with real per capita income below $10,000, compared to 48 percent for beneficiaries with real income between $20,000 and $30,000 and 50 percent for beneficiaries with income over $50,000.
- Health status: Average out-of-pocket health costs for beneficiaries in relatively poor health are projected to equal more than half of their average per capita Social Security income in 2030: increasing from 47 percent in 2013 to 57 percent in 2030 for beneficiaries in fair or poor self-reported health, and from 54 percent in 2013 to 64 percent in 2030 for beneficiaries with any functional impairments (Figure 10).
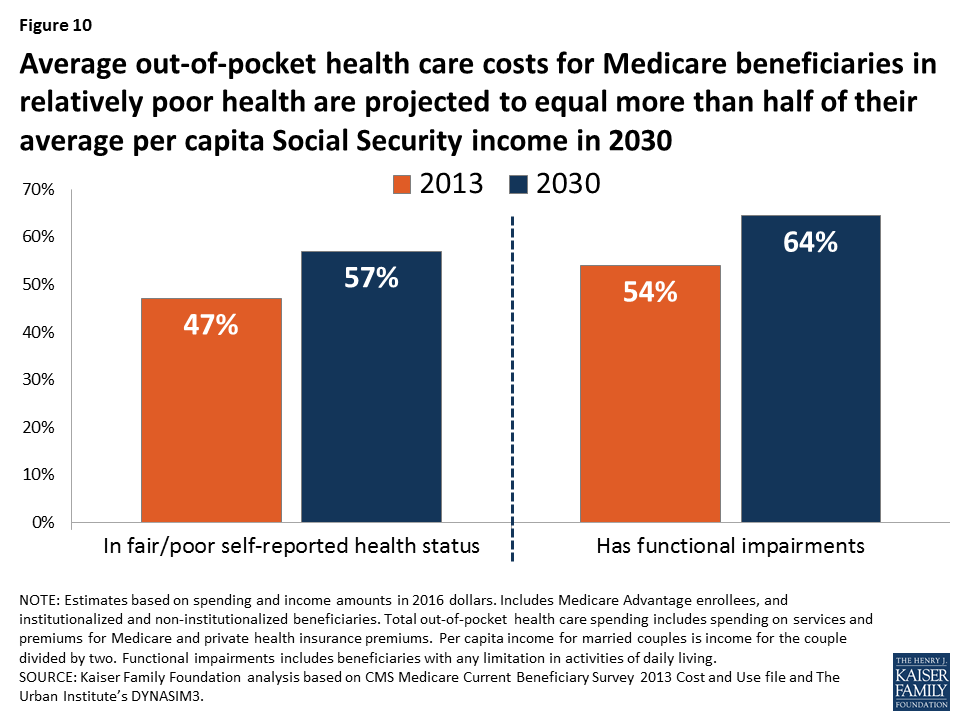
Figure 10: Average out-of-pocket health care costs for Medicare beneficiaries in relatively poor health are projected to equal more than half of their average per capita Social Security income in 2030
Section 2: Traditional Medicare Beneficiaries’ Out-of-Pocket Health Care Spending as a Share of Per Capita Total Income
Out-of-Pocket Spending as a Share of Per Capita Total Income in 2013
At the median, beneficiaries in traditional Medicare spent 14 percent of their total income (including income from Social Security and all other sources) on out-of-pocket health care costs in 2013 (Figure 11). In other words, half of traditional Medicare beneficiaries spent 14 percent (or more) of their total income on out-of-pocket costs in 2013. The spending burden was even larger for some beneficiaries: one-fourth of traditional Medicare beneficiaries spent nearly 30 percent or more of their total income on out-of-pocket costs in 2013, while 10 percent of beneficiaries in traditional Medicare spent nearly 60 percent or more.

Figure 11: Half of beneficiaries in traditional Medicare spent 14% of their per capita total income on out-of-pocket health care costs in 2013; 10% of beneficiaries spent at least 59%
Not surprisingly, the health care spending burden measured as a share of total income is lower than when measured as a share of Social Security income because most beneficiaries receive income from other sources in addition to Social Security. Based on income data from DYNASIM3, average per capita Social Security income for all Medicare beneficiaries in 2013 was $13,375 (in 2016 dollars), while total per capita income was 2.5 times more ($35,317). In other words, average per capita Social Security income accounted for 38 percent of average total per capita income. But for those with relatively low incomes, who are less likely to have defined benefit pensions and other investment income, Social Security represents a higher share of their total income, meaning that their out-of-pocket health care spending burden would be similar whether measured as a share of Social Security income or total income. For example, per capita Social Security income is 73 percent of total income of Medicare beneficiaries in 2013 with total income below $10,000, but only 19 percent of total income for beneficiaries with income above $50,000 (in 2016 dollars). Social Security is also a large share of total income for beneficiaries without a high school diploma (57 percent), beneficiaries ages 85 and over (56 percent), and beneficiaries of color (48 percent for blacks and 44 percent for Hispanics).
The median ratio of per capita out-of-pocket health care spending to per capita total income varied by demographic group in 2013, reflecting similar patterns in out-of-pocket spending as a share of Social Security income.
- Age: In 2013, half of traditional Medicare beneficiaries ages 85 and over spent at least 22 percent of their per capita total income on out-of-pocket health care costs, nearly twice the median share among beneficiaries ages 65 to 74 (12 percent) (Figure 12).
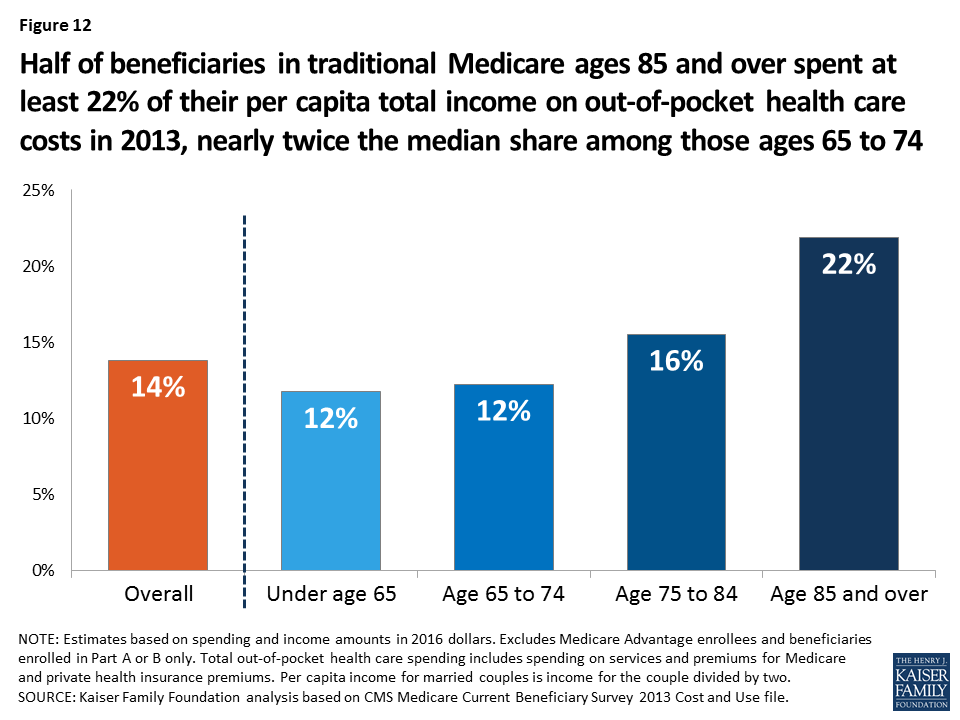
Figure 12: Half of beneficiaries in traditional Medicare ages 85 and over spent at least 22% of their per capita total income on out-of-pocket health care costs in 2013, nearly twice the median share among those ages 65 to 74
- Gender: While men and women in traditional Medicare spent about the same share of per capita total income on out-of-pocket health care costs at the median (13 percent and 14 percent, respectively), the spending burden was higher for women at older ages. Half of women in traditional Medicare ages 85 and over spent at least 26 percent of their per capita total income on out-of-pocket health care costs in 2013, higher than the median share among younger women and men at all ages (Figure 13).
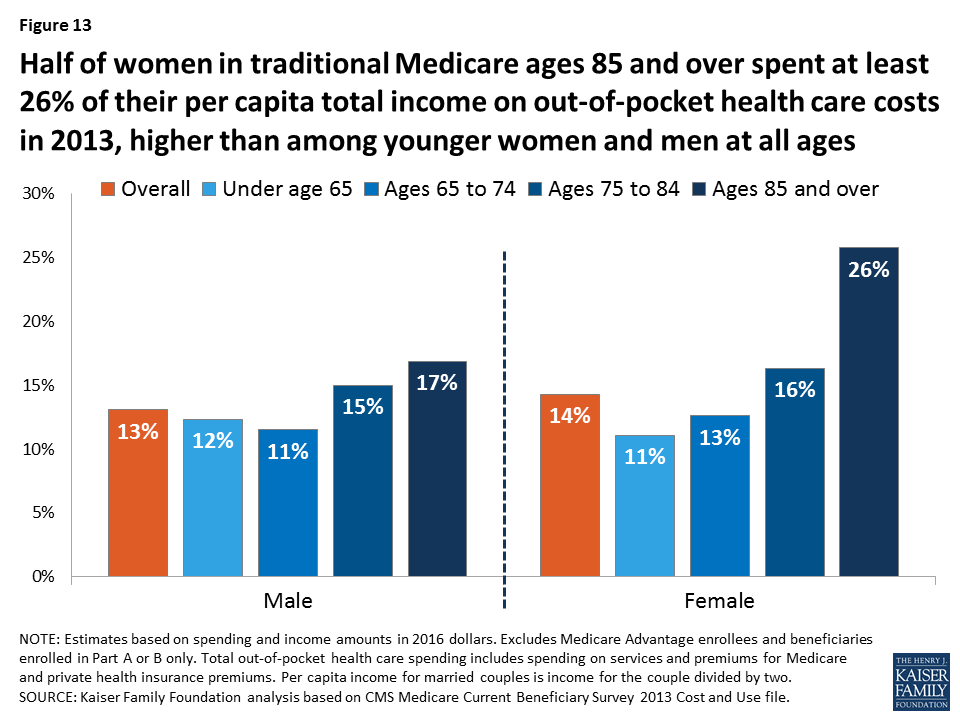
Figure 13: Half of women in traditional Medicare ages 85 and over spent at least 26% of their per capita total income on out-of-pocket health care costs in 2013, higher than among younger women and men at all ages
- Race/ethnicity: Median out-of-pocket spending as a share of per capita total income for beneficiaries in traditional Medicare did not vary substantially by race/ethnicity in 2013: 14 percent for white beneficiaries, 13 percent for Hispanic beneficiaries, and 12 percent for black beneficiaries (Table 2). Although white beneficiaries had substantially higher out-of-pocket costs than black or Hispanic beneficiaries in 2013, they also had substantially higher per capita total income, on average: $39,208, which was $15,000 more than black beneficiaries and nearly $20,000 more than Hispanic beneficiaries. These estimates support the idea that people with higher incomes may spend more on health care because affordability is less of a concern for them than for people with lower incomes.
- Health status: Median out-of-pocket health care spending as a share of total income was larger for traditional Medicare beneficiaries in relatively poor health than those in better health in 2013. For example, half of beneficiaries with five or more chronic conditions spent at least 17 percent of their per capita total income on out-of-pocket health care costs, compared to 9 percent for those with no chronic conditions. The median ratio of spending to income was 18 percent for those with any functional impairments, versus 12 percent for those with none (Figure 14).
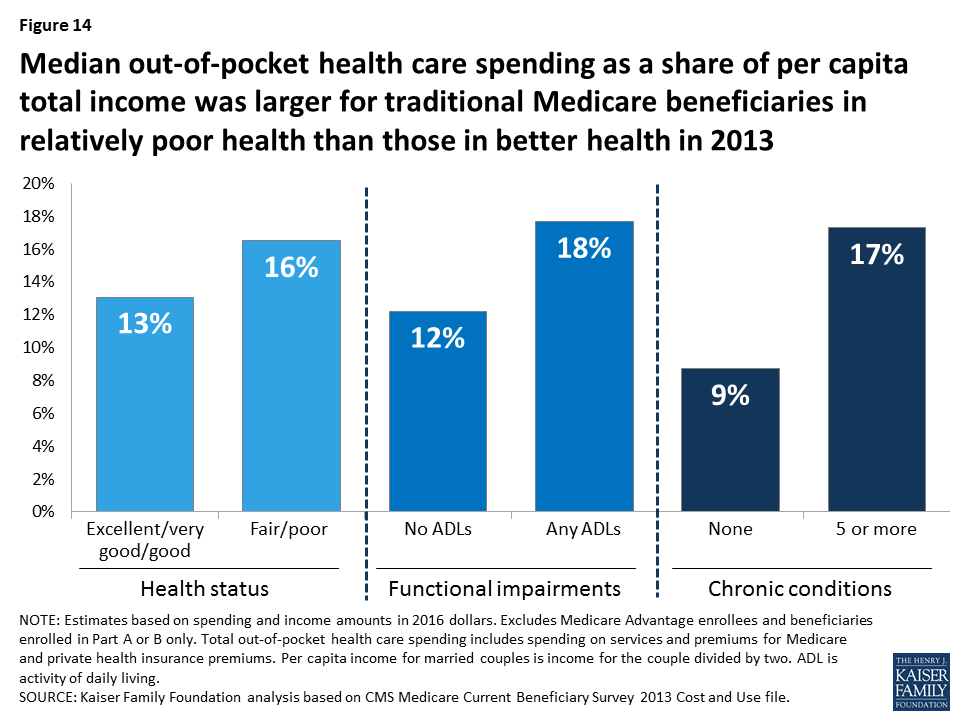
Figure 14: Median out-of-pocket health care spending as a share of per capita total income was larger for traditional Medicare beneficiaries in relatively poor health than those in better health in 2013
- Income: The median ratio of out-of-pocket spending to total income was significantly larger for beneficiaries in traditional Medicare with low incomes than for those with higher incomes in 2013, even though those with higher incomes spent more out of pocket on health care costs in absolute terms. Half of traditional Medicare beneficiaries with annual per capita total income of $10,000 or less spent at least 26 percent of their total income on out-of-pocket costs in 2013, nearly four times the share among those with income greater than $50,000 (7 percent) (Figure 15).
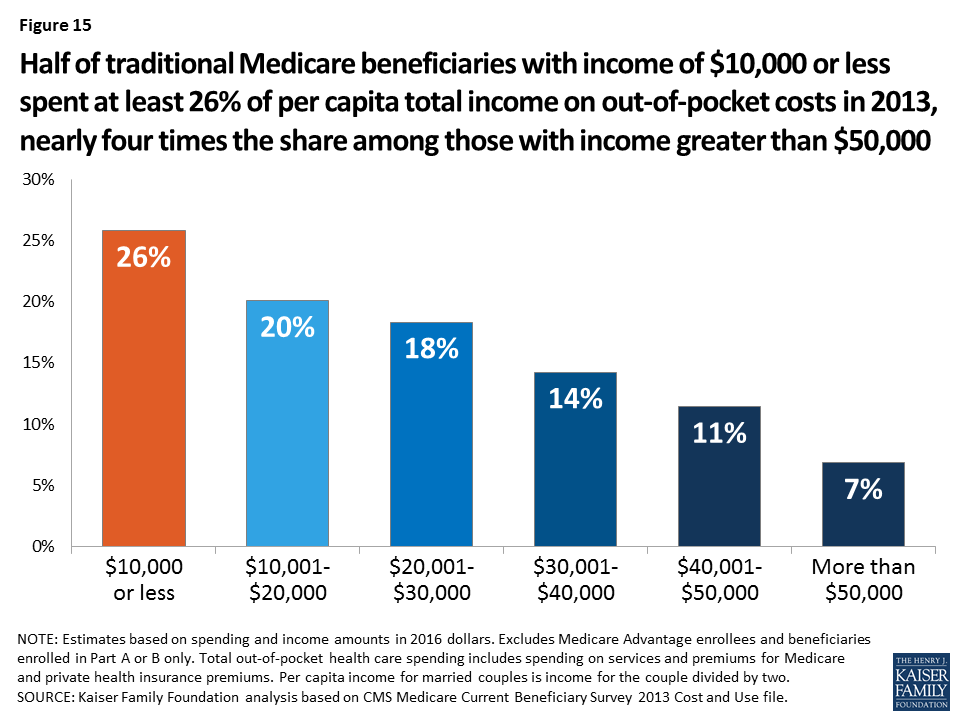
Figure 15: Half of traditional Medicare beneficiaries with income of $10,000 or less spent at least 26% of per capita total income on out-of-pocket costs in 2013, nearly four times the share among those with income greater than $50,000
What Share of Beneficiaries in Traditional Medicare Spent At Least 10 Percent/20 Percent of Per Capita Total Income on Health Care in 2013?
Our analysis of individual-level out-of-pocket spending as a share of per capita total income allows us to answer the question: what share of traditional Medicare beneficiaries spent at least 10 percent or 20 percent of their total income on out-of-pocket health care costs in 2013? We find that more than six in 10 people in traditional Medicare (62 percent) spent at least 10 percent of their total income on out-of-pocket costs in 2013 (Figure 16). This estimate is substantially higher than the percent of nonelderly adults with out-of-pocket health care spending at this level.8

Figure 16: More than one-third of beneficiaries in traditional Medicare spent at least 20% of their per capita total income on out-of-pocket costs in 2013, while more than 6 in 10 spent at least 10%
More than one-third (36 percent) of beneficiaries in traditional Medicare spent at least 20 percent of their per capita total income on out-of-pocket health care costs in 2013. But a disproportionate share of some groups of beneficiaries spent at least 20 percent of per capita total income on out-of-pocket costs in 2013, including 43 percent of beneficiaries in fair/poor health, 51 percent of beneficiaries with low incomes ($20,000 or less), and 53 percent of those ages 85 and over (Figure 17, Table 3).
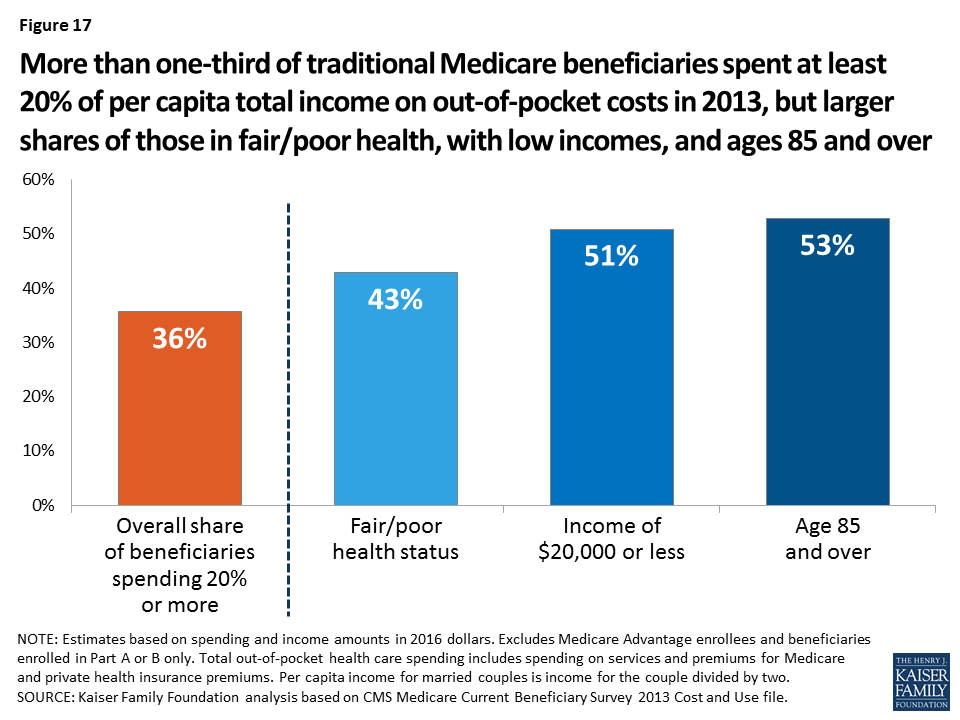
Figure 17: More than one-third of traditional Medicare beneficiaries spent at least 20% of per capita total income on out-of-pocket costs in 2013, but larger shares of those in fair/poor health, with low incomes, and ages 85 and over
Projected Out-of-Pocket Spending as a Share of Per Capita Total Income in 2030
Between 2013 and 2030, the median out-of-pocket health care spending burden for beneficiaries in traditional Medicare is projected to increase modestly from 14 percent to 17 percent (Figure 18, Table 2). But for some beneficiaries, the ratio of out-of-pocket spending to per capita total income is projected to increase more: for 10 percent of beneficiaries in traditional Medicare, their out-of-pocket health care spending is projected to grow from at least 59 percent of total income in 2013 to 74 percent in 2030.
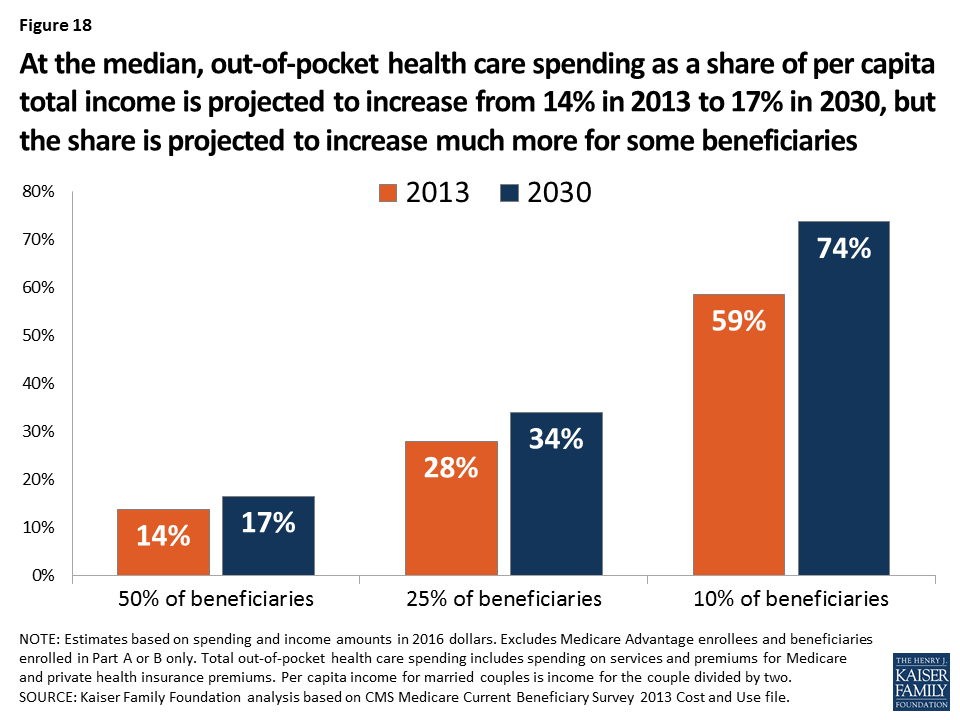
Figure 18: At the median, out-of-pocket health care spending as a share of per capita total income is projected to increase from 14% in 2013 to 17% in 2030, but the share is projected to increase much more for some beneficiaries
The 2030 projections of median out-of-pocket health care spending as a share of per capita total income for traditional Medicare beneficiaries by demographic group reflect a similar pattern as for Social Security income, although the projected increases generally are not as large.
- Age: For traditional Medicare beneficiaries in different age groups, the median spending burden is projected to increase somewhat for all age groups (Table 2). For example, for half of beneficiaries ages 65 to 74, out-of-pocket spending as a share of per capita total income is projected to increase from 12 percent in 2013 to 14 percent in 2030. For beneficiaries ages 85 and over, the median spending burden is projected increase from 22 percent to 26 percent, meaning that half of traditional Medicare beneficiaries ages 85 and over are projected to spend more than one-quarter of their income on health care costs in 2030.
- Gender: For women in traditional Medicare, median out-of-pocket spending is projected to increase as a share of per capita total income from 14 percent in 2013 to 17 percent in 2030; for men, the corresponding amounts are 13 percent and 16 percent (Table 2).
- Race/ethnicity: For traditional Medicare beneficiaries in different racial/ethnic groups, median out-of-pocket spending as a share of per capita total income in 2030 is projected to be 3 percentage points higher than their 2013 levels (Table 2).
- Health status: Half of traditional Medicare beneficiaries in relatively poor health are projected to spend at least 20 percent of their per capita total income on out-of-pocket health care costs in 2030 (Figure 19). The projected ratio of spending to total income in 2030 for those in relatively poor health is four percentage points higher than those in better health (Table 2).
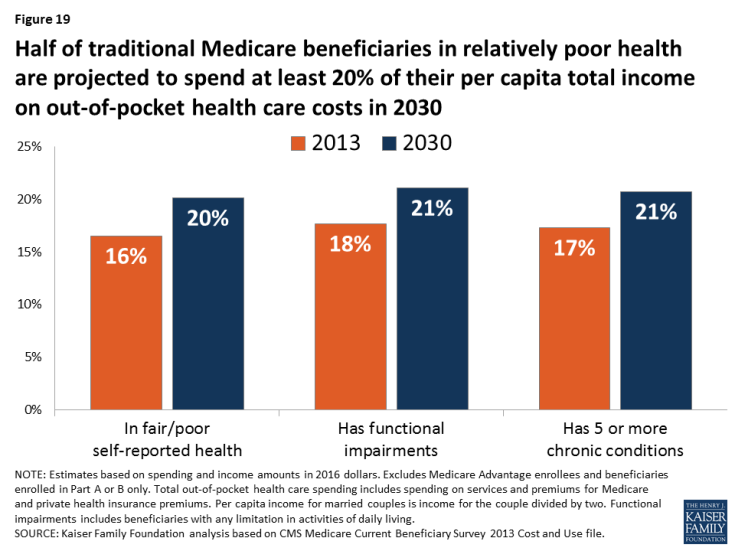
Figure 19: Half of traditional Medicare beneficiaries in relatively poor health are projected to spend at least 20% of their per capita total income on out-of-pocket health care costs in 2030
For example, half of beneficiaries with five or more chronic conditions are projected to spend 21 percent of per capita total income on out-of-pocket costs in 2030, while the median spending burden is projected to be 17 percent among those with 3 or 4 chronic conditions, 13 percent among those with 1 or 2 chronic conditions, and 10 percent among those with no chronic conditions.
- Income: In 2030, half of traditional Medicare beneficiaries with annual per capita total income of $10,000 or less are projected to spend at least one-third (34 percent) of their total income on out-of-pocket health care costs in 2030, up from one-fourth in 2013 (Figure 20). In contrast, the median spending burden for beneficiaries with incomes greater than $50,000 is projected to rise by just one percentage point between 2013 and 2030 (from 7 percent to 8 percent).

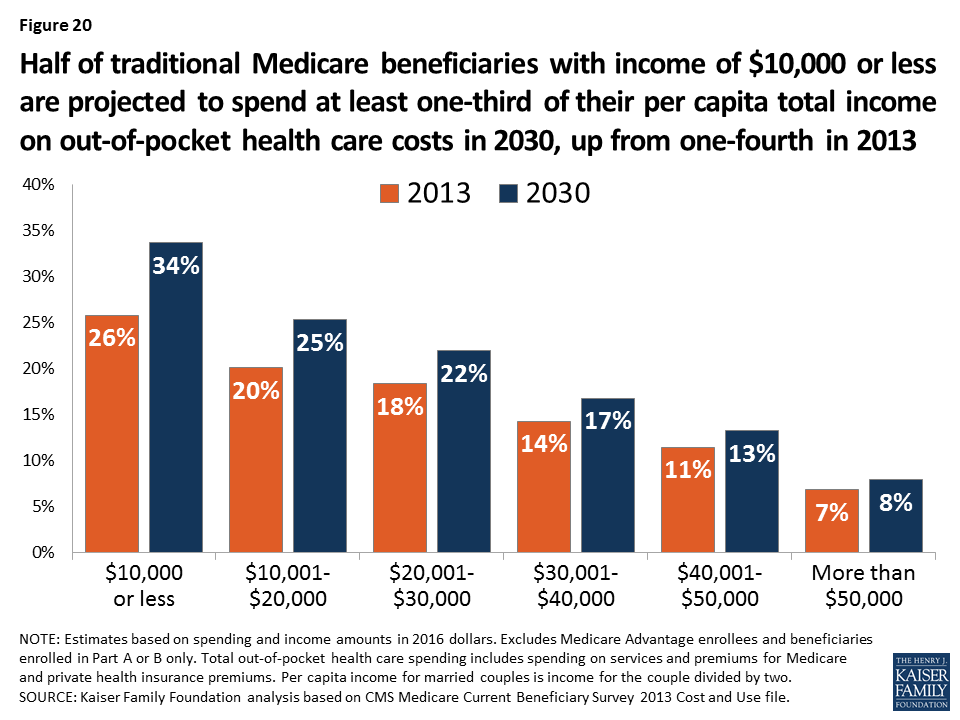
Figure 20: Half of traditional Medicare beneficiaries with income of $10,000 or less are projected to spend at least one-third of their per capita total income on out-of-pocket health care costs in 2030, up from one-fourth in 2013
What Share of Beneficiaries in Traditional Medicare Are Projected to Spend At Least 10 Percent/20 Percent of Per Capita Total Income on Health Care in 2030?
Our analysis shows that by 2030, 70 percent of beneficiaries in traditional Medicare are projected to spend at least 10 percent of their per capita total income on out-of-pocket health care spending (Figure 21). More than 4 in 10 (42 percent) beneficiaries in traditional Medicare are projected to spend at least 20 percent that year, but a disproportionate share of certain groups of beneficiaries, including those in fair/poor health (50 percent), ages 85 and over (59 percent), and those with low incomes (58 percent of those with per capita total incomes of $10,000 or less and 57 percent of those with total incomes of $10,001 to $20,000) (Table 3).
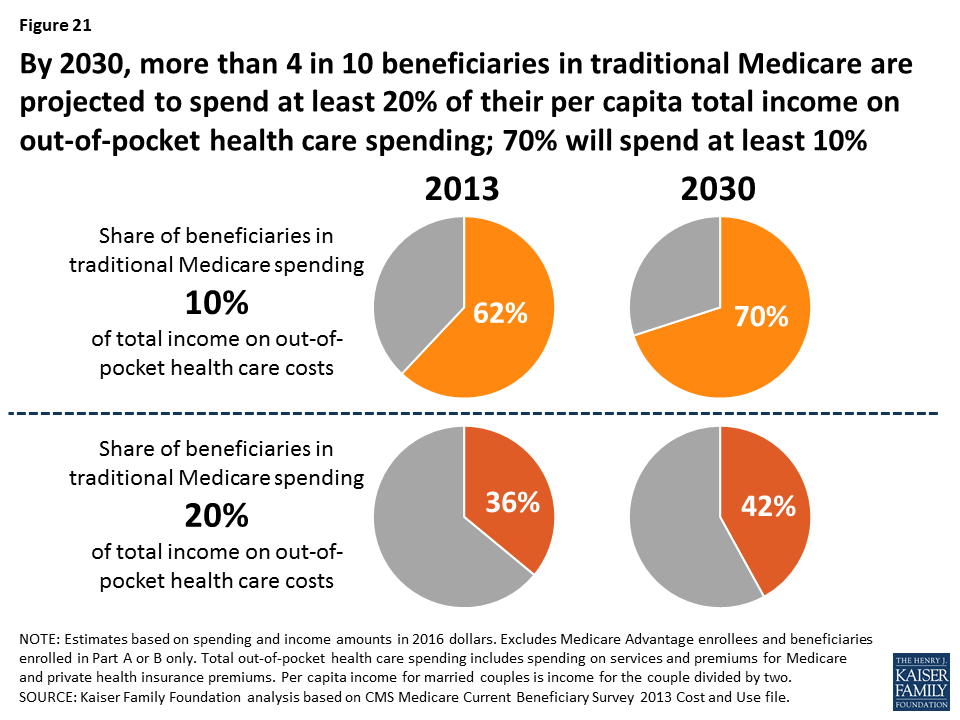
Figure 21: By 2030, more than 4 in 10 beneficiaries in traditional Medicare are projected to spend at least 20% of their per capita total income on out-of-pocket health care spending; 70% will spend at least 10%
Policy Implications
This analysis shows that out-of-pocket health care costs are a substantial and growing burden for many people with Medicare, consistent with other recent research.9 We found that out-of-pocket health care spending represented a sizable share (41 percent) of Medicare beneficiaries’ per capita Social Security income, on average, in 2013, and is expected to consume half of Social Security income in 2030. Some beneficiaries face greater average out-of-pocket spending as a share of average per capita Social Security income than others, including older women and beneficiaries ages 85 and over. For other beneficiaries, average out-of-pocket health care spending represents a relatively lower share of their average per capita Social Security income, likely due in part to coverage from Medicaid and the Part D Low-Income Subsidy program, which reduces the spending burden, including black beneficiaries and those under age 65. Using a different measure of the out-of-pocket spending burden based on per capita total income, we found that half of beneficiaries in traditional Medicare spent at least 14 percent of their total income on out-of-pocket health care costs in 2013, while more than one-third of beneficiaries spent at least 20 percent. By 2030, more than 4 in 10 traditional Medicare beneficiaries are projected to spend at least 20 percent of their total income on out-of-pocket health care costs.
Our results have implications for recurring budget and policy discussions that focus on reductions in Medicare and Medicaid spending and Social Security benefits that could adversely affect older adults living on tight budgets. The findings suggest that rising health care costs could pose affordability concerns for those beneficiaries who derive most of their income from Social Security, while proposals that would shift additional health care costs onto beneficiaries could increase the burden of out-of-pocket spending even more than it is already projected to rise. Such proposals would have a disproportionate impact on those groups with the lowest amount of disposable income, who can least afford to bear additional costs for health care. These changes could also reduce the value of Medicare coverage in terms of the financial protections it provides to older Americans and those with permanent disabilities. Furthermore, proposed changes to Medicaid eligibility and benefits that were included in Republican proposals to repeal and replace the Affordable Care Act could translate to higher out-of-pocket costs or skipping care altogether due to lack of affordability for certain groups of Medicare beneficiaries who rely on Medicaid for help paying their Medicare costs. Our results suggest that efforts to strengthen and improve the protections offered by Medicare, Medicaid, and Social Security may be needed to ensure greater retirement security for future generations of older Americans.
This report was funded in part by the AARP Public Policy Institute.