
Medicaid Enrollment & Spending Growth: FY 2016 & 2017
Introduction
Medicaid has become one of the nation’s largest health programs. According to the Centers for Medicare and Medicaid Services (CMS), a total of 72.8 million Americans had health coverage through state Medicaid programs or the related Children’s Health Insurance Programs (CHIP) in June 2016.1 Total Medicaid spending was $509 billion in FY 2015 with 62 percent paid by the federal government and 38 percent by states.2 Medicaid accounts for one in six dollars spent in the health care system, but 50 percent of long-term care spending and 9 percent of prescription drug spending.3 The key factors affecting total Medicaid spending and enrollment changes over the last decade have been The Great Recession followed by the implementation of the Affordable Care Act (ACA). As of September 2016, 32 states including DC have adopted the ACA Medicaid expansion, with two states newly implementing the expansion in FY 2016 (Alaska and Montana) and Louisiana implementing at the beginning of FY 2017. Under the law, the federal government provided 100 percent of the cost of expansion from calendar years 2014-2016 and this gradually phases down to 95 percent in CY 2017, 94 percent in CY 2018, 93 percent in CY 2019, and 90 percent in CY 2020 and beyond.
This report provides an overview of Medicaid enrollment and spending growth with a focus on the most recent state fiscal year, FY 2016, and current state fiscal year, FY 2017. Findings are based on interviews and data provided by state Medicaid directors as part of the 16th annual survey of Medicaid directors in all 50 states and the District of Columbia conducted by the Kaiser Commission on Medicaid and the Uninsured (KCMU) and Health Management Associates (HMA).
A more detailed description of the methodology used to calculate enrollment and spending growth is in the methodology at the end of this brief. Additional information about Medicaid financing, the role of Medicaid in state budgets, and Medicaid and the economy is in the Appendix.
Context: Recent Trends in the Economy
Since the end of the “Great Recession” in 2009, the economy has experienced slow growth and has stabilized in recent years. Unemployment rates peaked at 10 percent in October 2009, dropped to as low as 4.7 percent in May 2016, and have been steady at around 5 percent for the past year. In FY 2016, aggregate state general fund spending and revenues surpassed peak levels from 2008 in real terms (after adjusting for inflation)4 Across all states, general fund expenditures grew by 5.5 percent (higher than in previous years) and general fund revenues grew by 2.8 percent (less than stronger growth in 2015).5 Overall state revenue collections experienced steady growth since the Great Recession, but declined in the second quarter of 2016 (Figure 2). Early data suggest that state revenue collections may slow further in FY 2017 which could constrain overall state spending.6 A volatile stock market and declines in oil prices contribute to an uncertain outlook for state budgets.7
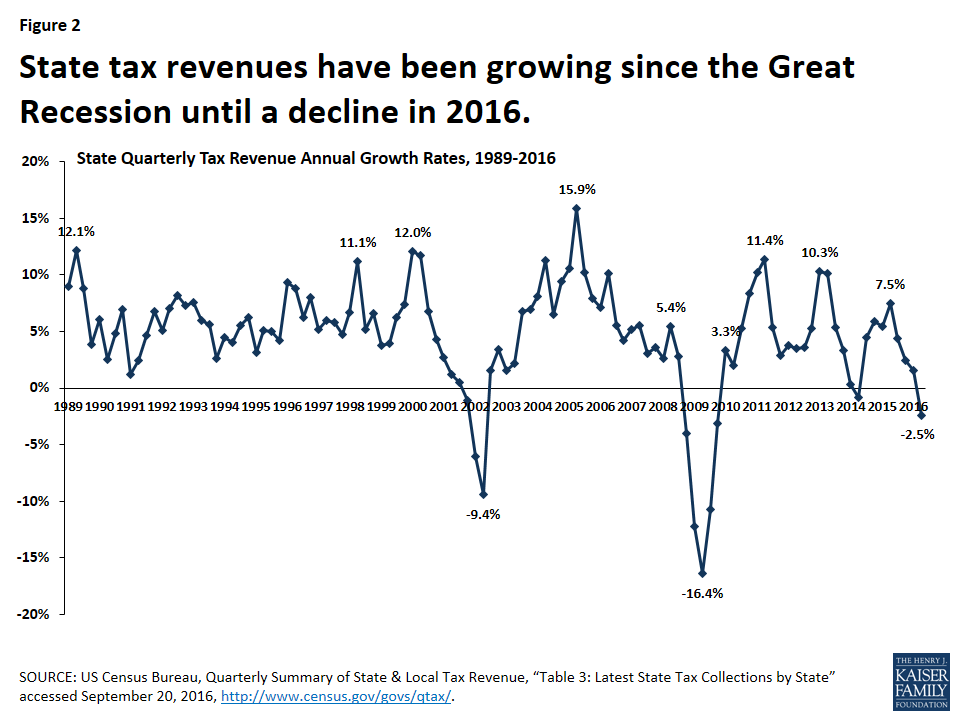
Figure 2: State tax revenues have been growing since the Great Recession until a decline in 2016.
Across the country, unemployment rates range from below three percent in South Dakota and New Hampshire to higher than six percent in Louisiana, New Mexico, Nevada, and Alaska. In addition, general fund spending and revenues are still below pre-recession levels in many states, and a 70 percent decline in oil prices since 2014 is causing significant revenue issues in oil dependent states (Alaska, Louisiana, New Mexico, North Dakota, Oklahoma, Texas, West Virginia, and Wyoming). Alaska and North Dakota were hardest hit with declines in total tax revenue of 41.4 and 34.7 percent, respectively,8 causing significant budget shortfalls. Proposals to address the shortfalls include tax increases and also stark budget cuts.9 Lower revenues and budget cuts have direct implications for Medicaid in these states.
Medicaid Enrollment and Spending: FY 2016 and FY 2017
Following significant increases in FY 2015, Medicaid enrollment and total spending growth slowed substantially in FY 2016 and FY 2017. High growth in FY 2015 was due to the implementation of the ACA and the recent trends reflect the tapering of ACA related enrollment and improvements in the economy (Figure 3). A number of states noted that the resolution of eligibility redetermination backlogs that developed in FY 2014 and FY 2015 when the MAGI eligibility and new enrollment systems were implemented contributed to slowing growth. Enrollment trends along with efforts to control costs due to budget pressures contributed to lower total spending growth. However, Medicaid officials identified the high costs for prescription drugs, especially for specialty drugs, as well as policy decisions to increase payment rates to specific provider groups as factors putting upward pressures on spending. For FY 2016, state projections reported in last year’s survey were on target for enrollment growth (4.0 percent projected and 3.9 percent experienced), while actual total spending growth was less than projected (6.9 percent projected and 5.9 percent experienced).

Figure 3: Recessions and the implementation of the ACA resulted in peaks in total Medicaid spending and enrollment.
Trends for slowing enrollment and total spending growth hold true across expansion and non-expansion states. Median growth rates were calculated to show the experience of the typical state in each of these groups. Medicaid enrollment and total spending in FY 2016 and FY 2017 slowed for both expansion and non-expansion states. The typical expansion state, compared to a non-expansion state, experienced higher Medicaid enrollment and total spending growth in FY 2016, and that differential is projected to continue in FY 2017, although the size of the differential is narrowing (Figure 4).
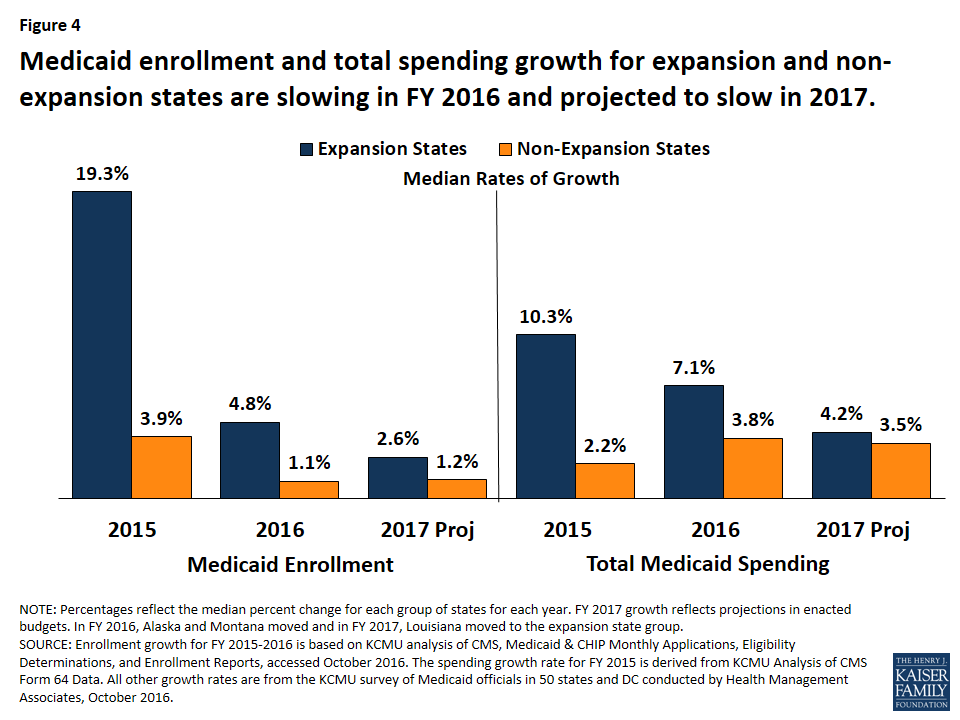
Figure 4: Medicaid enrollment and total spending growth for expansion and non-expansion states are slowing in FY 2016 and projected to slow in 2017.
Significant variation in enrollment and total spending growth occurs within each group of states, that may be due to timing of the Medicaid expansion decisions, Medicaid policy and state budget decisions. For example, states that implemented the Medicaid expansion in FY 2016 and FY 2017 (Alaska, Montanta, and Louisiana) experienced and project higher enrollment and spending growth relative to other expansion states.
State spending for Medicaid grew slower than total spending in FY 2016; but adopted budgets for FY 2017 project an uptick in state Medicaid spending.10 Historically, the state share of Medicaid spending and total Medicaid spending have increased at similar rates, except during temporary statutory changes in federal matching rates. Congress provided fiscal relief to states during each of the last two economic downturns by increasing the federal Medicaid matching rate, which lowered growth in state Medicaid spending. Beginning in 2014, the ACA Medicaid expansion resulted in a divergence in growth rates for total and state Medicaid spending. States that expand Medicaid qualify for 100 percent federal funding of Medicaid costs for newly eligible enrollees for calendar years 2014-2016. The federal share phases to 95 percent in 2017, 94 percent in 2018, 93 percent in 2019, and 90 percent in 2020 and thereafter, well above traditional FMAP rates in every state.
Largely due to the 100 percent FMAP for newly eligible enrollees in expansion states, state spending for Medicaid across all states increased slower than total spending in both FY 2015 and FY 2016. In FY 2015, the differential in these growth rates was large (3.8 percent state Medicaid spending growth compared to 10.5 percent total Medicaid spending growth). The differential narrowed in FY 2016 (Figure 5).

Figure 5: Growth in total and state share of Medicaid spending is generally parallel, except when statutory changes impact FMAP.
State Medicaid spending growth is often viewed in the context of overall state general fund spending for all programs in the state budget. For FY 2016, the National Association for State Budget Officers (NASBO) estimated overall general fund expenditure growth of 5.5 percent, the largest increase since the Great Recession.11
In FY 2017, state Medicaid spending and total Medicaid spending are projected to grow at a nearly identical pace across all states. State Medicaid spending growth is projected to be higher in FY 2017 compared to the previous year as expansion states begin paying the 5 percent share of the costs of the expansion in January of 2017.
Growth in state Medicaid spending in expansion states has been lower relative to non-expansion states, but an uptick is projected in FY 2017 as expansion states pay a small share of the costs of newly eligible enrollees. In FY 2015 and FY 2016 expansion states experienced slower growth in state Medicaid spending compared to total Medicaid spending largely due the 100 percent FMAP for the expansion population. This differential was very large in FY 2015 (10.3 percent total spending growth compared to 2.4 percent state spending growth) and was smaller in FY 2016. In addition, the growth in state Medicaid spending in expansion states was lower than growth in non-expansion states in FY 2015 and FY 2016.
In FY 2017, the median growth in state Medicaid spending for expansion states is projected to be 5.9 percent, up from 1.9 percent in FY 2016, as the five percent share of costs for the expansion population phases in on January 1, 2017, mid-way through the state fiscal year (Figure 6). Eight of the Medicaid expansion states (Arkansas, Arizona, Colorado, Illinois, Indiana, Louisiana, New Hampshire, and Ohio) will use provider taxes or fees to fund all or part of the state share of costs of the ACA Medicaid expansion while others will use general funds. Non-expansion states are not affected by the enhanced ACA match rates, and median state Medicaid spending growth for non-expansion states remained fairly stable and consistent with total Medicaid spending.
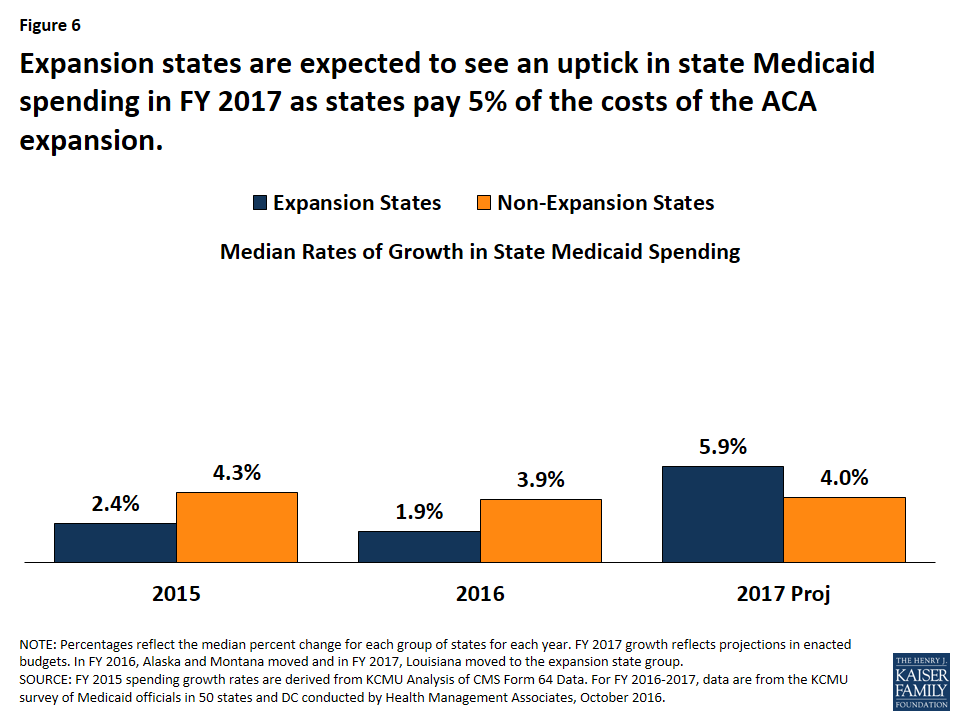
Figure 6: Expansion states are expected to see an uptick in state Medicaid spending in FY 2017 as states pay 5% of the costs of the ACA expansion.
As with total spending and enrollment, significant variation in state Medicaid spending occurs across expansion and non-expansion states. In some cases, this variation was not related to state implementation of the ACA expansion. For example, Alaska anticipates a decline in state Medicaid spending in FY 2017 due to budget issues. Florida experienced high growth in state Medicaid spending in FY 2016 when federal funding for the state’s Low-Income Pool (LIP) declined under the terms of a renewed waiver. In other states, formula driven changes in the traditional federal Medicaid match rate affect state spending growth. For example, the Texas FMAP declined significantly, from 58.1 in FFY 2015, to 57.1 percent in FFY 2016, and then 56.2 percent in FFY 2017, resulting in large growth in state funds. These annual FMAP changes reflect changes in state average personal income relative to the national average, but data is lagged by three years.
Conclusion and Looking Ahead
In recent years, the slow economic recovery and the 2014 implementation of the ACA have been the primary drivers of enrollment and total Medicaid spending growth. State implementation of the ACA Medicaid coverage expansions was the major driver of total Medicaid spending and enrollment growth in FY 2014 and FY 2105. As ACA related enrollment tapers, states experienced slower enrollment and total spending growth in FY 2016 and these trends are expected to continue in FY 2017. The primary upward pressures on total Medicaid spending identified by Medicaid directors are rising prescription drug costs and state policy actions such as reimbursement rate increases.
The requirement for states to start paying five percent of the costs of expansion resulted in an uptick in state Medicaid spending growth in FY 2017; however, looking ahead, the state share increasing from five percent to six percent in January 2018 should not affect growth rates as much as a change from zero to five percent. Changes in enrollment and spending should be considered in the broader context of findings about the impact of the ACA Medicaid expansion. Research on the effects of Medicaid expansions under the ACA shows that the expansion has resulted in significant coverage gains, increased access to care and utilization of health care services among the low-income population, and positive effects on multiple economic outcomes despite Medicaid enrollment growth initially exceeding projections in many states.
States continue to focus on improving their programs through value based purchasing and other delivery system strategies aimed at improving care and outcomes while controlling costs. Pressure to control Medicaid spending continues as growth in overall state revenues slows, or in some states, declines. Looking ahead, the trajectory of the economy nationally and in individual states as well as the outcome of federal and state elections will have implications for Medicaid enrollment and spending and influence the way in which the ACA and Medicaid expansion are addressed across the country.
The authors express their appreciation to the Medicaid directors and staff in all 50 states and the District of Columbia who completed the survey on which this brief is based. We also thank Dennis Roberts, who managed the database.
Topics

Also of Interest
- The 16th Annual Kaiser 50-State Medicaid Budget Survey: Slowing Growth and Evolving Policies at a Forum with the National Association of Medicaid Directors
- Implementing Coverage and Payment Initiatives: Results from a 50-State Medicaid Budget Survey for State Fiscal Years 2016 and 2017
- Putting Medicaid in the Larger Budget Context: An In-Depth Look at Four States in FY 2016 and FY 2017
- 50-State Medicaid Budget Survey Archives