
Medicaid Enrollment & Spending Growth: FY 2016 & 2017
Appendix: Background on Medicaid Financing
Medicaid Financing Structure. The Medicaid program is jointly funded by states and the federal government. The federal government guarantees match funds to states for qualifying Medicaid expenditures. The federal match rate (Federal Medical Assistance Percentage, or FMAP) is calculated annually for each state using a formula set in the Social Security Act which is based on a state’s average personal income relative to the national average; poorer states have higher FMAPs. According to the formula, the FMAP in FFY 2017 varies across states from a floor of 50 percent to a high of 74.6 percent.1 Personal income data are lagged, so data used for FFY 2017 FMAPs are from the three years of 2012 to 2014. Even small changes in a state’s FMAP can mean large changes in the amount of state general funds needed to maintain current programs, with decreases in FMAP increasing pressure on state budgets.
As a result of the federal matching structure, Medicaid has a unique role in state budgets as both an expenditure item and a source of federal revenue for states. In FY 2014, Medicaid accounted for 25.6 percent of total state spending for all items in the state budget, but 18.4 percent of all state general fund spending, a far second to spending on K-12 education (35.4 percent of state general fund spending.)2 Medicaid is the largest single source of federal funds for states, accounting for half (50.4 percent) of all federal funds for states in FY 2014 (Figure 7).
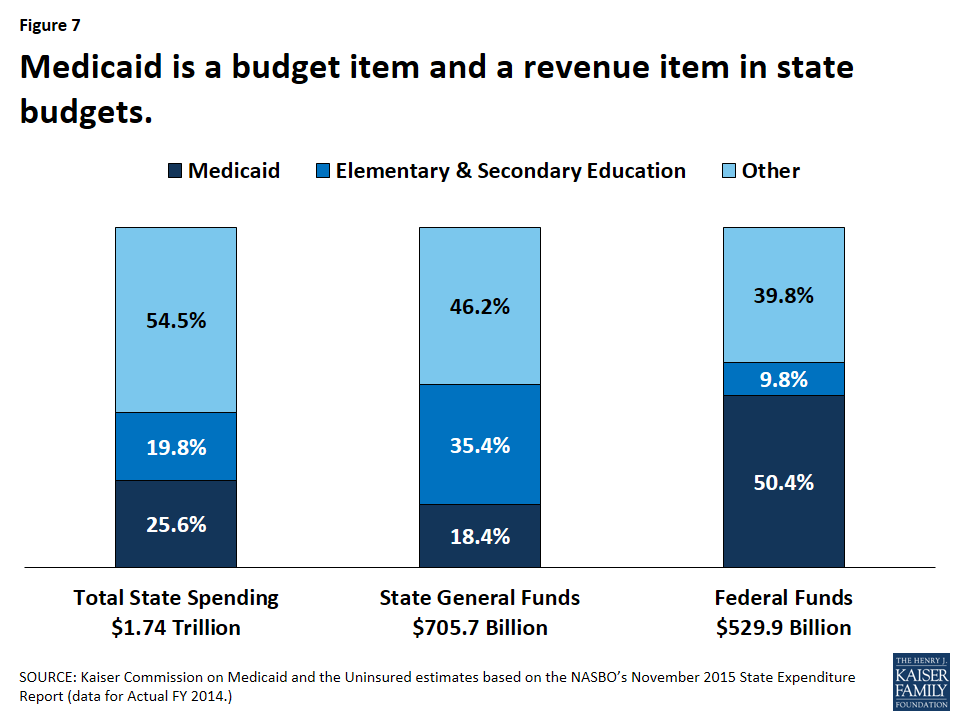
Figure 7: Medicaid is a budget item and a revenue item in state budgets.
Medicaid and the Economy. Medicaid is a countercyclical program. During economic downturns more people qualify and enroll in Medicaid, which increases program spending at the same time that state tax revenues level or fall. To help mitigate these budget pressures, Congress has twice passed temporary increases to the FMAP rates to help support states during economic downturns, most recently in 2009 as part of the American Recovery and Reinvestment Act (ARRA). The ARRA-enhanced match rates were the primary vehicle for federal fiscal relief to states during the “Great Recession,” providing states over $100 billion in additional federal funds over 11 quarters, ending in June 2011.3 During this recession, unemployment soared, state revenues plummeted, and Medicaid spending and enrollment peaked.
Medicaid and the ACA. Effective January 1, 2014, the ACA expanded Medicaid eligibility to millions of non-elderly adults with income at or below 138 percent of the federal poverty level (FPL) – about $16,394 for an individual in 2016. The law also provided for 100 percent federal funding of the expansion through 2016, declining gradually to 90 percent in 2020 and future years. The Supreme Court ruling on the ACA in June 2012 effectively made the Medicaid expansion optional for states. As of September 2016, 32 states (including the District of Columbia) have implemented the ACA Medicaid expansion. The ACA also required all states to implement new streamlined and coordinated application, enrollment, and renewal processes, including transitioning to a new income standard (Modified Adjusted Gross Income or MAGI) to determine Medicaid financial eligibility for non-elderly, non-disabled populations.
Topics

Also of Interest
- The 16th Annual Kaiser 50-State Medicaid Budget Survey: Slowing Growth and Evolving Policies at a Forum with the National Association of Medicaid Directors
- Implementing Coverage and Payment Initiatives: Results from a 50-State Medicaid Budget Survey for State Fiscal Years 2016 and 2017
- Putting Medicaid in the Larger Budget Context: An In-Depth Look at Four States in FY 2016 and FY 2017
- 50-State Medicaid Budget Survey Archives