2014 Employer Health Benefits Survey
The Kaiser Family Foundation and the Health Research & Educational Trust (Kaiser/HRET) conduct this annual survey of employer-sponsored health benefits. HRET, a nonprofit research organization, is an affiliate of the American Hospital Association. The Kaiser Family Foundation designs, analyzes, and conducts this survey in partnership with HRET, and also funds the study. KFF contracts with researchers at NORC at the University of Chicago (NORC) to work with Foundation and HRET researchers in conducting the study. Kaiser/HRET retained National Research, LLC (NR), a Washington, D.C.-based survey research firm, to conduct telephone interviews with human resource and benefits managers using the Kaiser/HRET survey instrument. From January to May 2014, NR completed full interviews with 2,052 firms.
Survey Topics
As in past years, Kaiser/HRET asked each participating firm as many as 400 questions about its largest health maintenance organization (HMO), preferred provider organization (PPO), point-of-service (POS) plan, and high-deductible health plan with a savings option (HDHP/SO).1 We treat EPOs and HMOs as one plan type and report the information under the banner of “HMO”; if an employer sponsors both an HMO and an EPO, they are asked about the attributes of the plan with the larger enrollment. Similarly, starting in 2013, plan information for conventional (or indemnity) plans was collected within the PPO battery. Less than one percent of firms which completed the PPO section had more enrollment in a conventional plan than a PPO plan.
As in past years, the survey includes questions on the cost of health insurance, health benefit offer rates, coverage, eligibility, enrollment patterns, premiums,2 employee cost sharing, prescription drug benefits, retiree health benefits, wellness benefits, and employer opinions.
Response Rate
After determining the required sample from U.S. Census Bureau data, Kaiser/HRET drew its sample from a Survey Sampling Incorporated list (based on an original Dun and Bradstreet list) of the nation’s private employers and from the Census Bureau’s Census of Governments list of public employers with three or more workers. To increase precision, Kaiser/HRET stratified the sample by ten industry categories and six size categories. Kaiser/HRET attempted to repeat interviews with prior years’ survey respondents (with at least ten employees) who participated in either the 2012 or the 2013 survey, or both. Firms with 3-9 employees are not include in the panel to minimize the impact of panel effects on the offer rate statistic. As a result, 1,587 of the 2,052 firms that completed the full survey also participated in either the 2012 or 2013 surveys, or both.3 The overall response rate is 46%.4
The vast majority of questions are asked only of firms that offer health benefits. A total of 1,827 of the 2,052 responding firms indicated that they offered health benefits. The response rate for firms that offer health benefits is also 46%.
We asked one question of all firms in the study with which we made phone contact , but where the firm declined to participate. The question was, “Does your company offer a health insurance program as a benefit to any of your employees?” A total of 3,139 firms responded to this question (including 2,052 who responded to the full survey and 1,087 who responded to this one question). These responses are included in our estimates of the percentage of firms offering health benefits.5 The response rate for this question is 70%. In 2012 the calculation of the response rates was adjusted to be slightly more conservative than previous years.
Firm Size Categories and Key Definitions
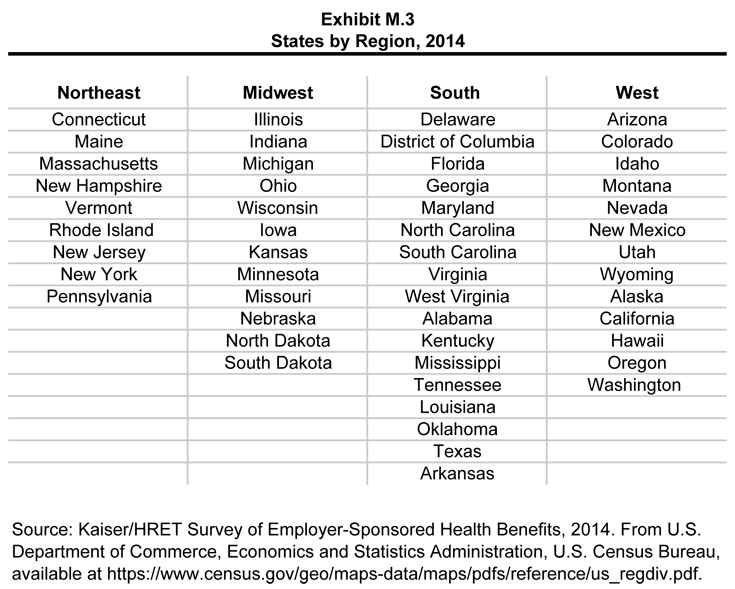
Throughout the report, exhibits categorize data by size of firm, region, and industry. Firm size definitions are as follows: small firms: 3 to 199 workers; and large firms: 200 or more workers. Exhibit M.1 shows selected characteristics of the survey sample. A firm’s primary industry classification is determined from SSI’s designation on the sampling frame. A firm’s ownership category and other firm characteristics used in exhibits such as 3.2 and 6.19 are based on respondents’ answers. While there is considerable overlap in firms in the “State/Local Government” industry category and those in the “public” ownership category they are not identical. For example, public school districts are included in the service industry even though they are publically owned
Exhibit M.2 displays the distribution of the nation’s firms, workers, and covered workers (employees receiving coverage from their employer). Among the over three million firms nationally, approximately 61.2% are firms employing 3 to 9 workers; such firms employ 8.2% of workers, and 3.4% of workers covered by health insurance. In contrast, less than one percent of firms employ 1,000 or more workers; these firms employ 48.2% of workers and 54.6% of covered workers. Therefore, the smallest firms dominate any statistics weighted by the number of employers. For this reason, most statistics about firms are broken out by size categories. In contrast, firms with 1,000 or more workers are the most important employer group in calculating statistics regarding covered workers, since they employ the largest percentage of the nation’s workforce.
Throughout this report, we use the term “in-network” to refer to services received from a preferred provider. Family coverage is defined as health coverage for a family of four.
Each year, the survey asks firms for the percentage of their employees who earn less than a specified amount in order to identify the portion of a firm’s workforce that has relatively low wages. This year, the income threshold is $23,000 per year for low-wage workers and $57,000 for high-wage workers. These thresholds are based on the 25th and 75th percentile of workers’ earnings as reported by the Bureau of Labor Statistics using data from the Occupational Employment Statistics (OES) (2011).6 The cutoffs were inflation adjusted and rounded to the nearest thousand. Prior to 2013 wage cutoffs were calculated using the now eliminated National Compensation Survey.
Rounding and Imputation
Some exhibits in the report do not sum to totals due to rounding effects. In a few cases, numbers from distribution exhibits may not add to the numbers referenced in the text due to rounding. Although overall totals and totals for size and industry are statistically valid, some breakdowns may not be available due to limited sample sizes or a high relative standard error. Where the unweighted sample size is fewer than 30 observations, exhibits include the notation “NSD” (Not Sufficient Data).
To control for item nonresponse bias, Kaiser/HRET imputes values that are missing for most variables in the survey. On average, 3% of observations are imputed. All variables are imputed following a hotdeck approach. In 2014, there were 15 variables where the imputation rate exceeded 20%. For these cases, the unimputed variable is compared with the imputed variable. Also, most of these cases were for individual plan level statistics – when aggregate variables were constructed for all of the plans the imputation rate is much lower. There are a few variables that Kaiser/HRET has decided not to impute; these are typically variables where “don’t know” is considered a valid response option (for example, firms’ opinions about effectiveness of various strategies to control health insurance costs or whether the firm is considering private exchanges.). In addition, there are several variables in which missing data is calculated based on respondents’ answers to other questions (for example, when missing employer contributions to premiums are calculated from the respondent’s premium and the ratio of contributions to premiums).
In 2012 the method to calculate missing premiums and contributions was revised; if a firm provides a premium for single coverage or family coverage, or a worker contribution for single coverage or family coverage, that information was used in the imputation. For example, if a firm provided a worker contribution for family coverage but no premium information, a ratio between the family premium and family contribution was imputed and then the family premium was calculated. In addition, in cases where premiums or contributions for both family and single coverage were missing, the hotdeck procedure was revised to draw all four responses from a single firm. The change in the imputation method did not make a significant impact on the premium or contribution estimates.
Starting in 2014, we elected to estimate separate single and family coverage premiums for firms that provided premium amounts as the average cost for all covered workers, instead of differentiating between single and family coverage. This method will more accurately account for the portion that each type of coverage contributes to the total cost for the 1 percent of covered workers who are enrolled at firms affected by this adjustment.
Sample Design
We determined the sample requirements based on the universe of firms obtained from the U.S. Census. Prior to the 2010 survey, the sample requirements were based on the total counts provided by Survey Sampling Incorporated (SSI) (which obtains data from Dun and Bradstreet). Over the years, we found the Dun and Bradstreet frequency counts to be volatile due to duplicate listings of firms, or firms that are no longer in business. These inaccuracies vary by firm size and industry. In 2003, we began using the more consistent and accurate counts provided by the Census Bureau’s Statistics of U.S. Businesses and the Census of Governments as the basis for post-stratification, although the sample was still drawn from a Dun and Bradstreet list. In order to further address this concern at the time of sampling, starting in 2009 we use Census data as the basis for the sample.
Starting in 2010, we also defined Education as a separate sampling category, rather than as a subgroup of the Service category. In the past, Education firms were a disproportionately large share of Service firms. Education is controlled for during post-stratification, and adjusting the sampling frame to also control for Education allows for a more accurate representation of both the Education and Service industries.
In past years, both private and government firms were sampled from the Dun and Bradstreet database. Beginning in 2009, Government firms were sampled from the 2007 Census of Governments. This change was made to eliminate the overlap of state agencies that were frequently sampled from the Dun and Bradstreet database. The sample of private firms is screened for firms that are related to state/local governments, and if these firms are identified in the Census of Governments, they are reclassified as government firms and a private firm is randomly drawn to replace the reclassified firm. The federal government is not included in the sample frame.
Finally, the data used to determine the 2014 Employer Health Benefits sample frame include the U.S. Census’ 2010 Statistics of U.S. Businesses and the 2007 Census of Governments. At the time of the sample design (December 2013), these data represented the most current information on the number of public and private firms nationwide with three or more workers. As in the past, the post-stratification is based on the most up-to-date Census data available (the 2011 update to the Census of U.S. Businesses was purchased during the survey field period). This year we used the 2012 Census of Governments to post-stratify.
In 2012, the method for calculating the size of the sample was adjusted. Rather than using a combined response rate for panel and non-panel firms, separate response rates were used to calculate the number of firms to be selected in each strata. In addition, the Mining stratum was collapsed into the Agriculture and Construction industry grouping. In sum, changes to the sampling method required more firms to be included and may have reduced the response rate in order to provide more balanced power within each strata.
Weighting and Statistical Significance
Because Kaiser/HRET selects firms randomly, it is possible through the use of statistical weights to extrapolate the results to national (as well as firm size, regional, and industry) averages. These weights allow Kaiser/HRET to present findings based on the number of workers covered by health plans, the number of total workers, and the number of firms. In general, findings in dollar amounts (such as premiums, worker contributions, and cost sharing) are weighted by covered workers. Other estimates, such as the offer rate, are weighted by firms. Specific weights were created to analyze the HDHP/SO plans that are offered with an HRA or that are HSA-qualified. These weights represent the proportion of employees enrolled in each of these arrangements.
Calculation of the weights follows a common approach. First, the basic weight is determined, followed by a nonresponse adjustment. As part of this nonresponse adjustment, Kaiser/HRET conducted a small follow-up survey of those firms with 3 to 49 workers that refused to participate in the full survey. Just as in years passed, Kaiser/HRET conducted a McNemar test to verify that the results of the follow-up survey are comparable to the results from the original survey. Next, we trimmed the weights in order to reduce the influence of weight outliers. First, we identified common groups of observations. Within each group, we identified the median and the interquartile range of the weights and calculated the trimming cut point as the median plus six times the interquartile range (M + [6 * IQR]). Weight values larger than this cut point are trimmed to the cut point. In all instances, very few weight values were trimmed. Finally, we calibrated the weights to U.S. Census Bureau’s 2011 Statistics of U.S. Businesses for firms in the private sector, and the 2012 Census of Governments as the basis for calibration / post-stratification for public sector firms. Historic employer weighted statistics were updated in 2011.
Between 2006 and 2012 only limited information was collected on conventional plans. Starting in 2013, information on conventional plans was collected under the PPO section and therefore the covered worker weight was representative of all plan types.
The survey contains a few questions on employee cost sharing that are asked only of firms that indicate in a previous question that they have a certain cost-sharing provision. For example, the copayment amount for prescription drugs is asked only of those that report they have copayments for prescription drugs. Because the composite variables (using data from across all plan types) are reflective of only those plans with the provision, separate weights for the relevant variables were created in order to account for the fact that not all covered workers have such provisions.
To account for design effects, the statistical computing package R and the library package “survey” were used to calculate standard errors.7,8 All statistical tests are performed at the .05 confidence level, unless otherwise noted. For figures with multiple years, statistical tests are conducted for each year against the previous year shown, unless otherwise noted. No statistical tests are conducted for years prior to 1999. In 2012 the method to test the difference between distributions across years was changed to use a Wald test which accounts for the complex survey design. In general this method was more conservative than the approach used in prior years. Exhibits such as 7.9, 7.10, 7.16 etc. are affected by the change.
Statistical tests for a given subgroup (firms with 25-49 workers, for instance) are tested against all other firm sizes not included in that subgroup (all firm sizes NOT including firms with 25-49 workers, in this example). Tests are done similarly for region and industry; for example, Northeast is compared to all firms NOT in the Northeast (an aggregate of firms in the Midwest, South, and West). However, statistical tests for estimates compared across plan types (for example, average premiums in PPOs) are tested against the “All Plans” estimate. In some cases, we also test plan-specific estimates against similar estimates for other plan types (for example, single and family premiums for HDHP/SOs against single and family premiums for HMO, PPO, and POS plans); these are noted specifically in the text. The two types of statistical tests performed are the t-test and the Wald test.
The small number of observations for some variables resulted in large variability around the point estimates. These observations sometimes carry large weights, primarily for small firms. The reader should be cautioned that these influential weights may result in large movements in point estimates from year to year; however, often these movements are not statistically significant.
Additional Notes on the 2014 Survey
Several provisions of the ACA took effect on January 1, 2014 which impacted non-grandfathered plans as well as plans renewing in calendar year 2014, such as the requirement to have an out of pocket limit and a waiting period of not more than three months. As a result, firms with non-grandfathered plans that reported that they did not have out-of-pocket limits, or waiting periods exceeding three months, were contacted during our data-confirmation calls. We did not have information on the month in which a firm’s plan or plans was renewed. Many of these firms indicated that they had a plan year starting prior to January 2014, so these ACA provision were not yet in effect for these plans.
Firms with 200 or more workers were asked: “Does your firm offer health benefits for current employees through a private or corporate exchange? A private exchange is one created by a consulting firm or an insurance company, not by either a federal or state government. Private exchanges allow employees to choose from several health benefit options offered on the exchange.” Employers were still asked for plan information about their HMO, PPO, POS and HDHP/SO plan regardless of whether they purchased health benefits through a private exchange or not.
Historical Data
Data in this report focus primarily on findings from surveys jointly authored by the Kaiser Family Foundation and the Health Research & Educational Trust, which have been conducted since 1999. Prior to 1999, the survey was conducted by the Health Insurance Association of America (HIAA) and KPMG using a similar survey instrument, but data are not available for all the intervening years. Following the survey’s introduction in 1987, the HIAA conducted the survey through 1990, but some data are not available for analysis. KPMG conducted the survey from 1991-1998. However, in 1991, 1992, 1994, and 1997, only larger firms were sampled. In 1993, 1995, 1996, and 1998, KPMG interviewed both large and small firms. In 1998, KPMG divested itself of its Compensation and Benefits Practice, and part of that divestiture included donating the annual survey of health benefits to HRET.
This report uses historical data from the 1993, 1996, and 1998 KPMG Surveys of Employer-Sponsored Health Benefits and the 1999-2013 Kaiser/HRET Survey of Employer-Sponsored Health Benefits. For a longer-term perspective, we also use the 1988 survey of the nation’s employers conducted by the HIAA, on which the KPMG and Kaiser/HRET surveys are based. The survey designs for the three surveys are similar.
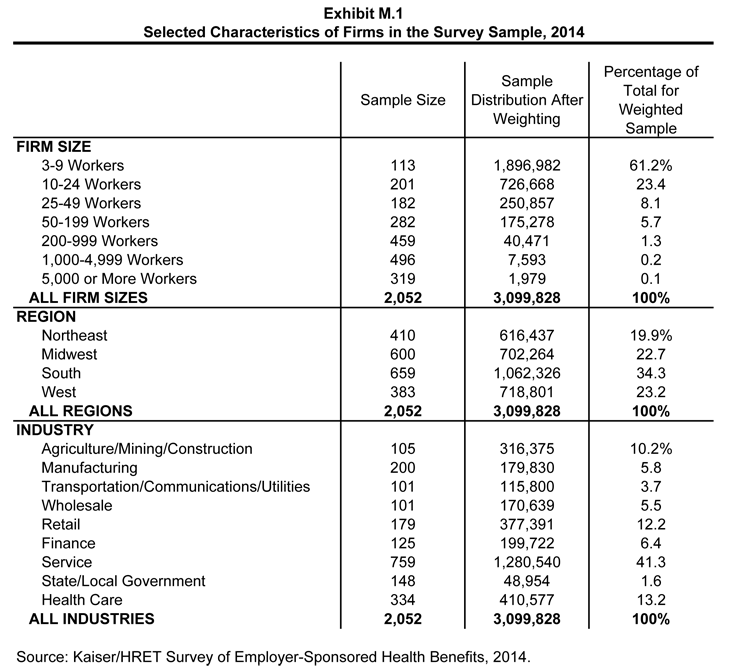
Selected Characteristics of Firms in the Survey Sample, 2014
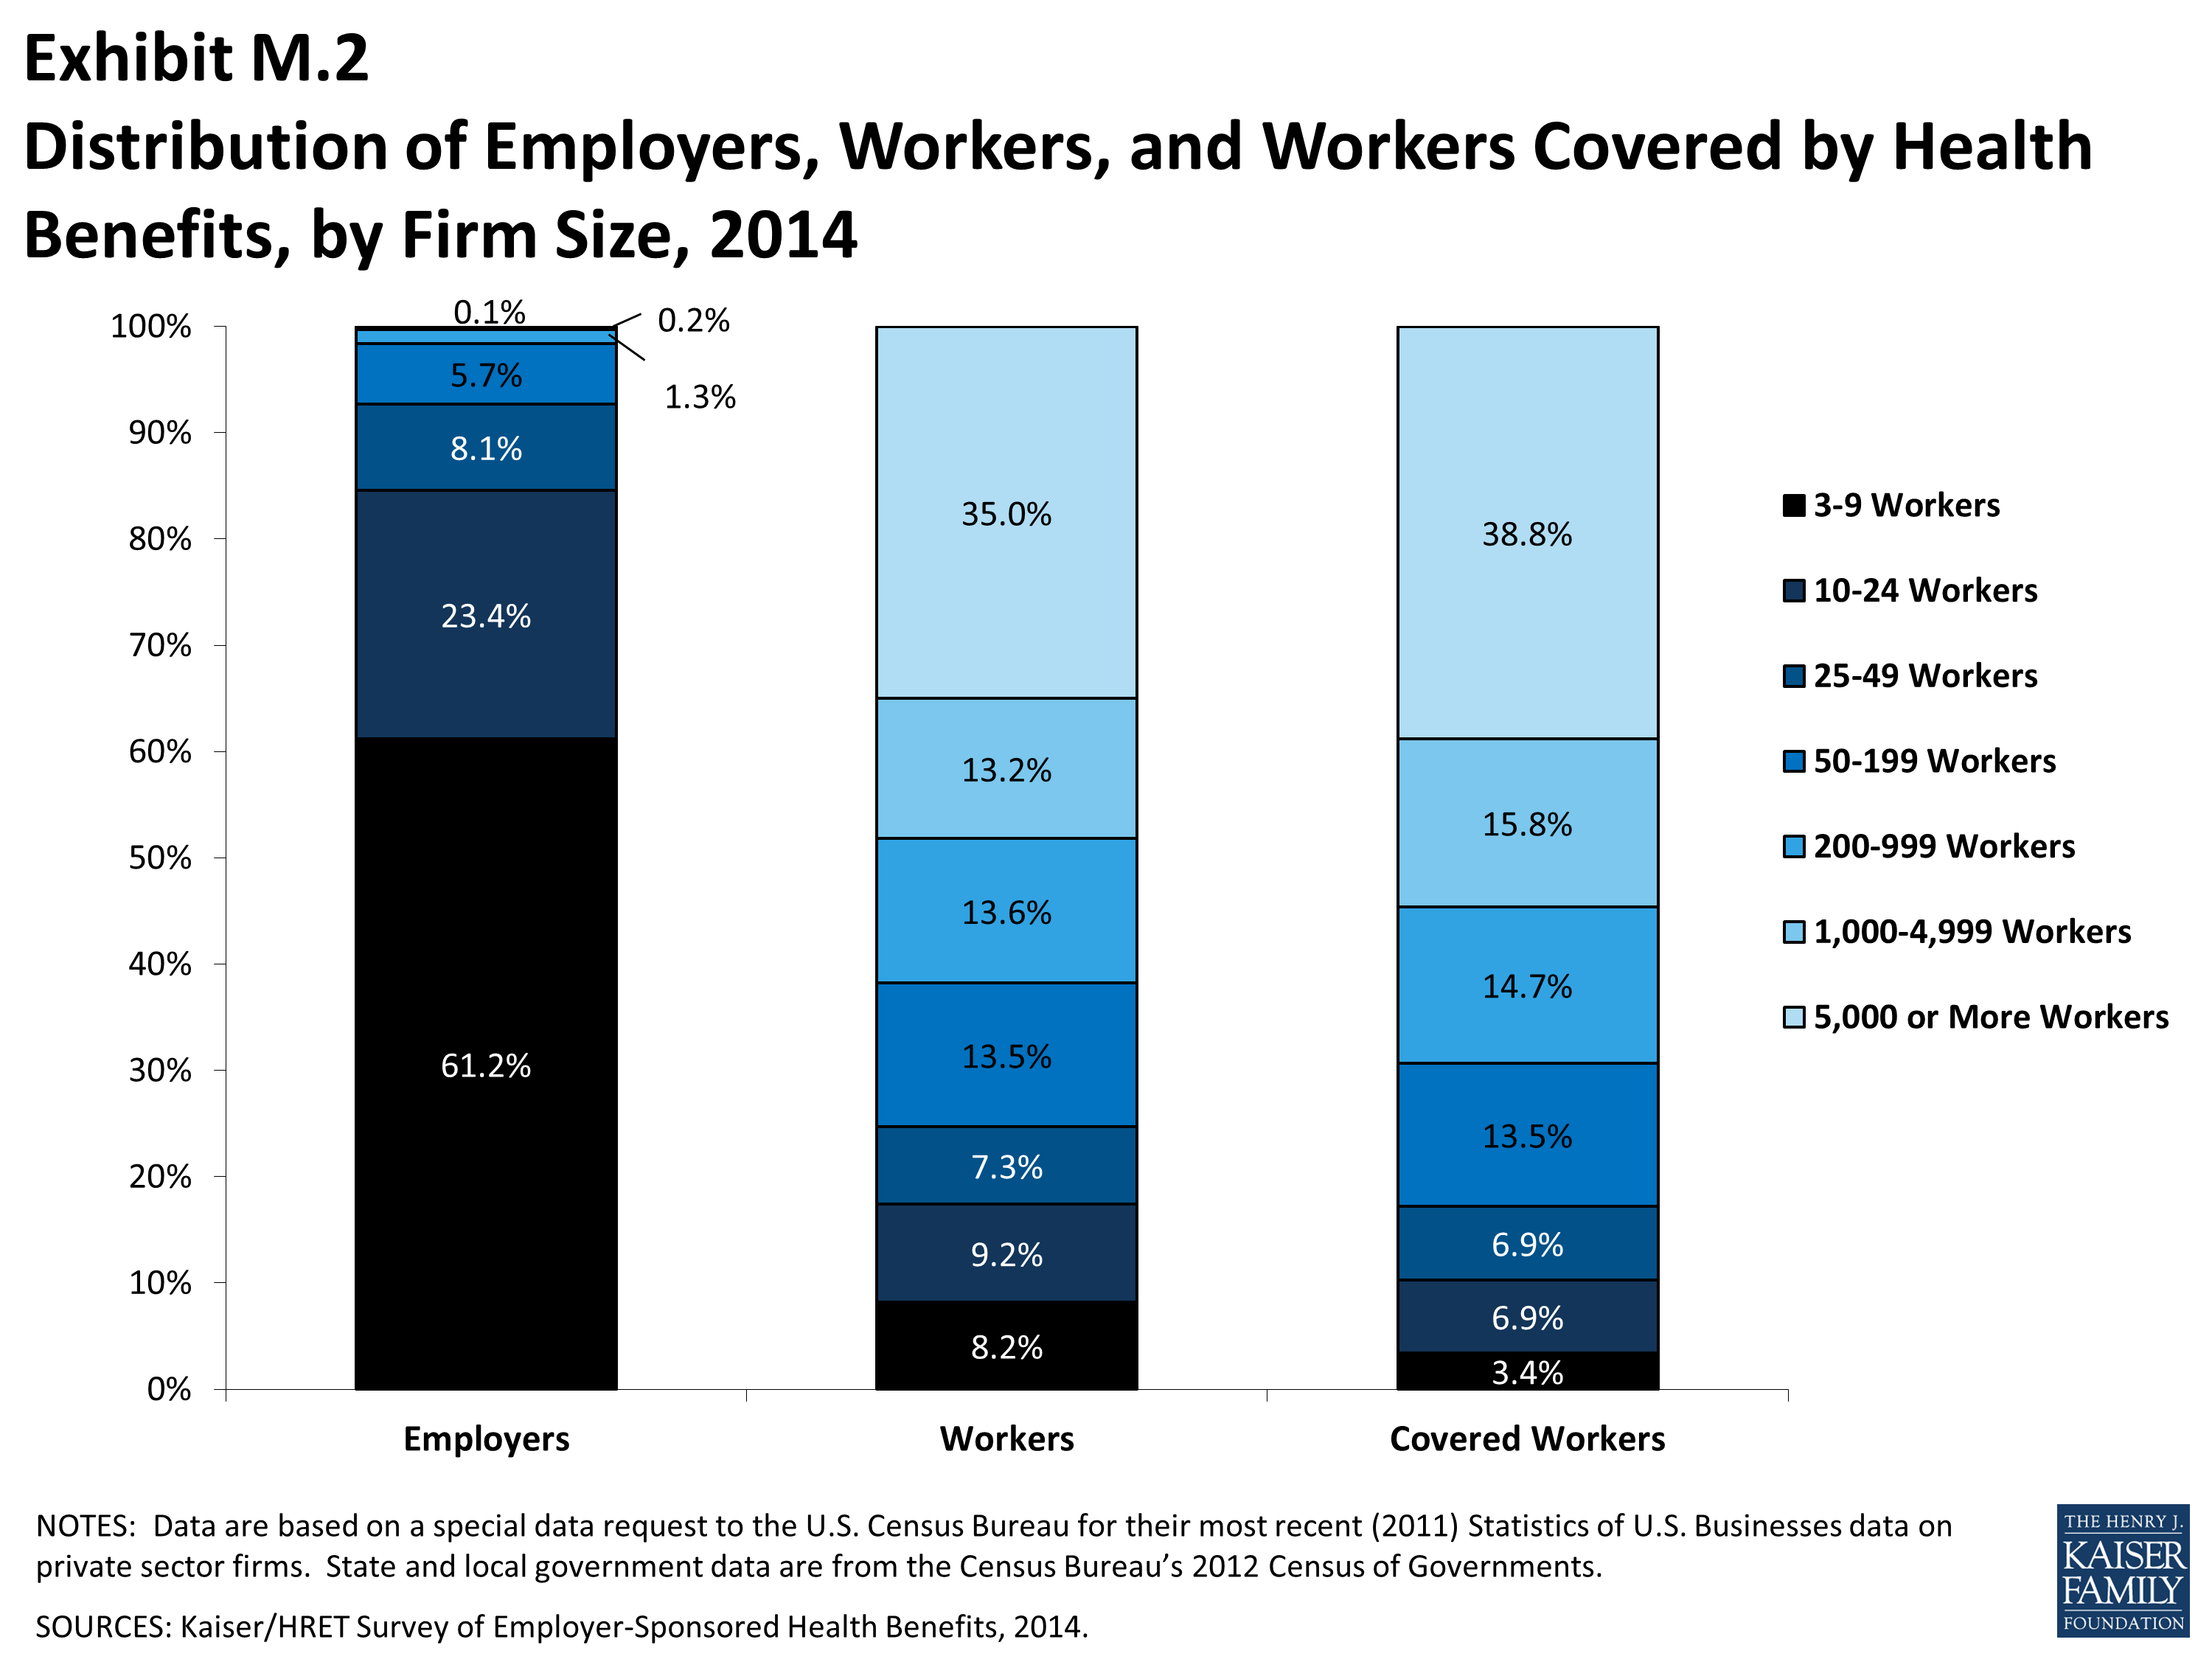
Distribution of Employers, Workers, and Workers Covered by Health Benefits, by Firm Size, 2014