2013 Employer Health Benefits Survey
Abstract
The 2014 Employer Health Benefits Survey was released September 10, 2014.
This annual survey of employers provides a detailed look at trends in employer-sponsored health coverage, including premiums, employee contributions, cost-sharing provisions, and other relevant information. The 2013 survey included almost three thousand interviews with non-federal public and private firms.
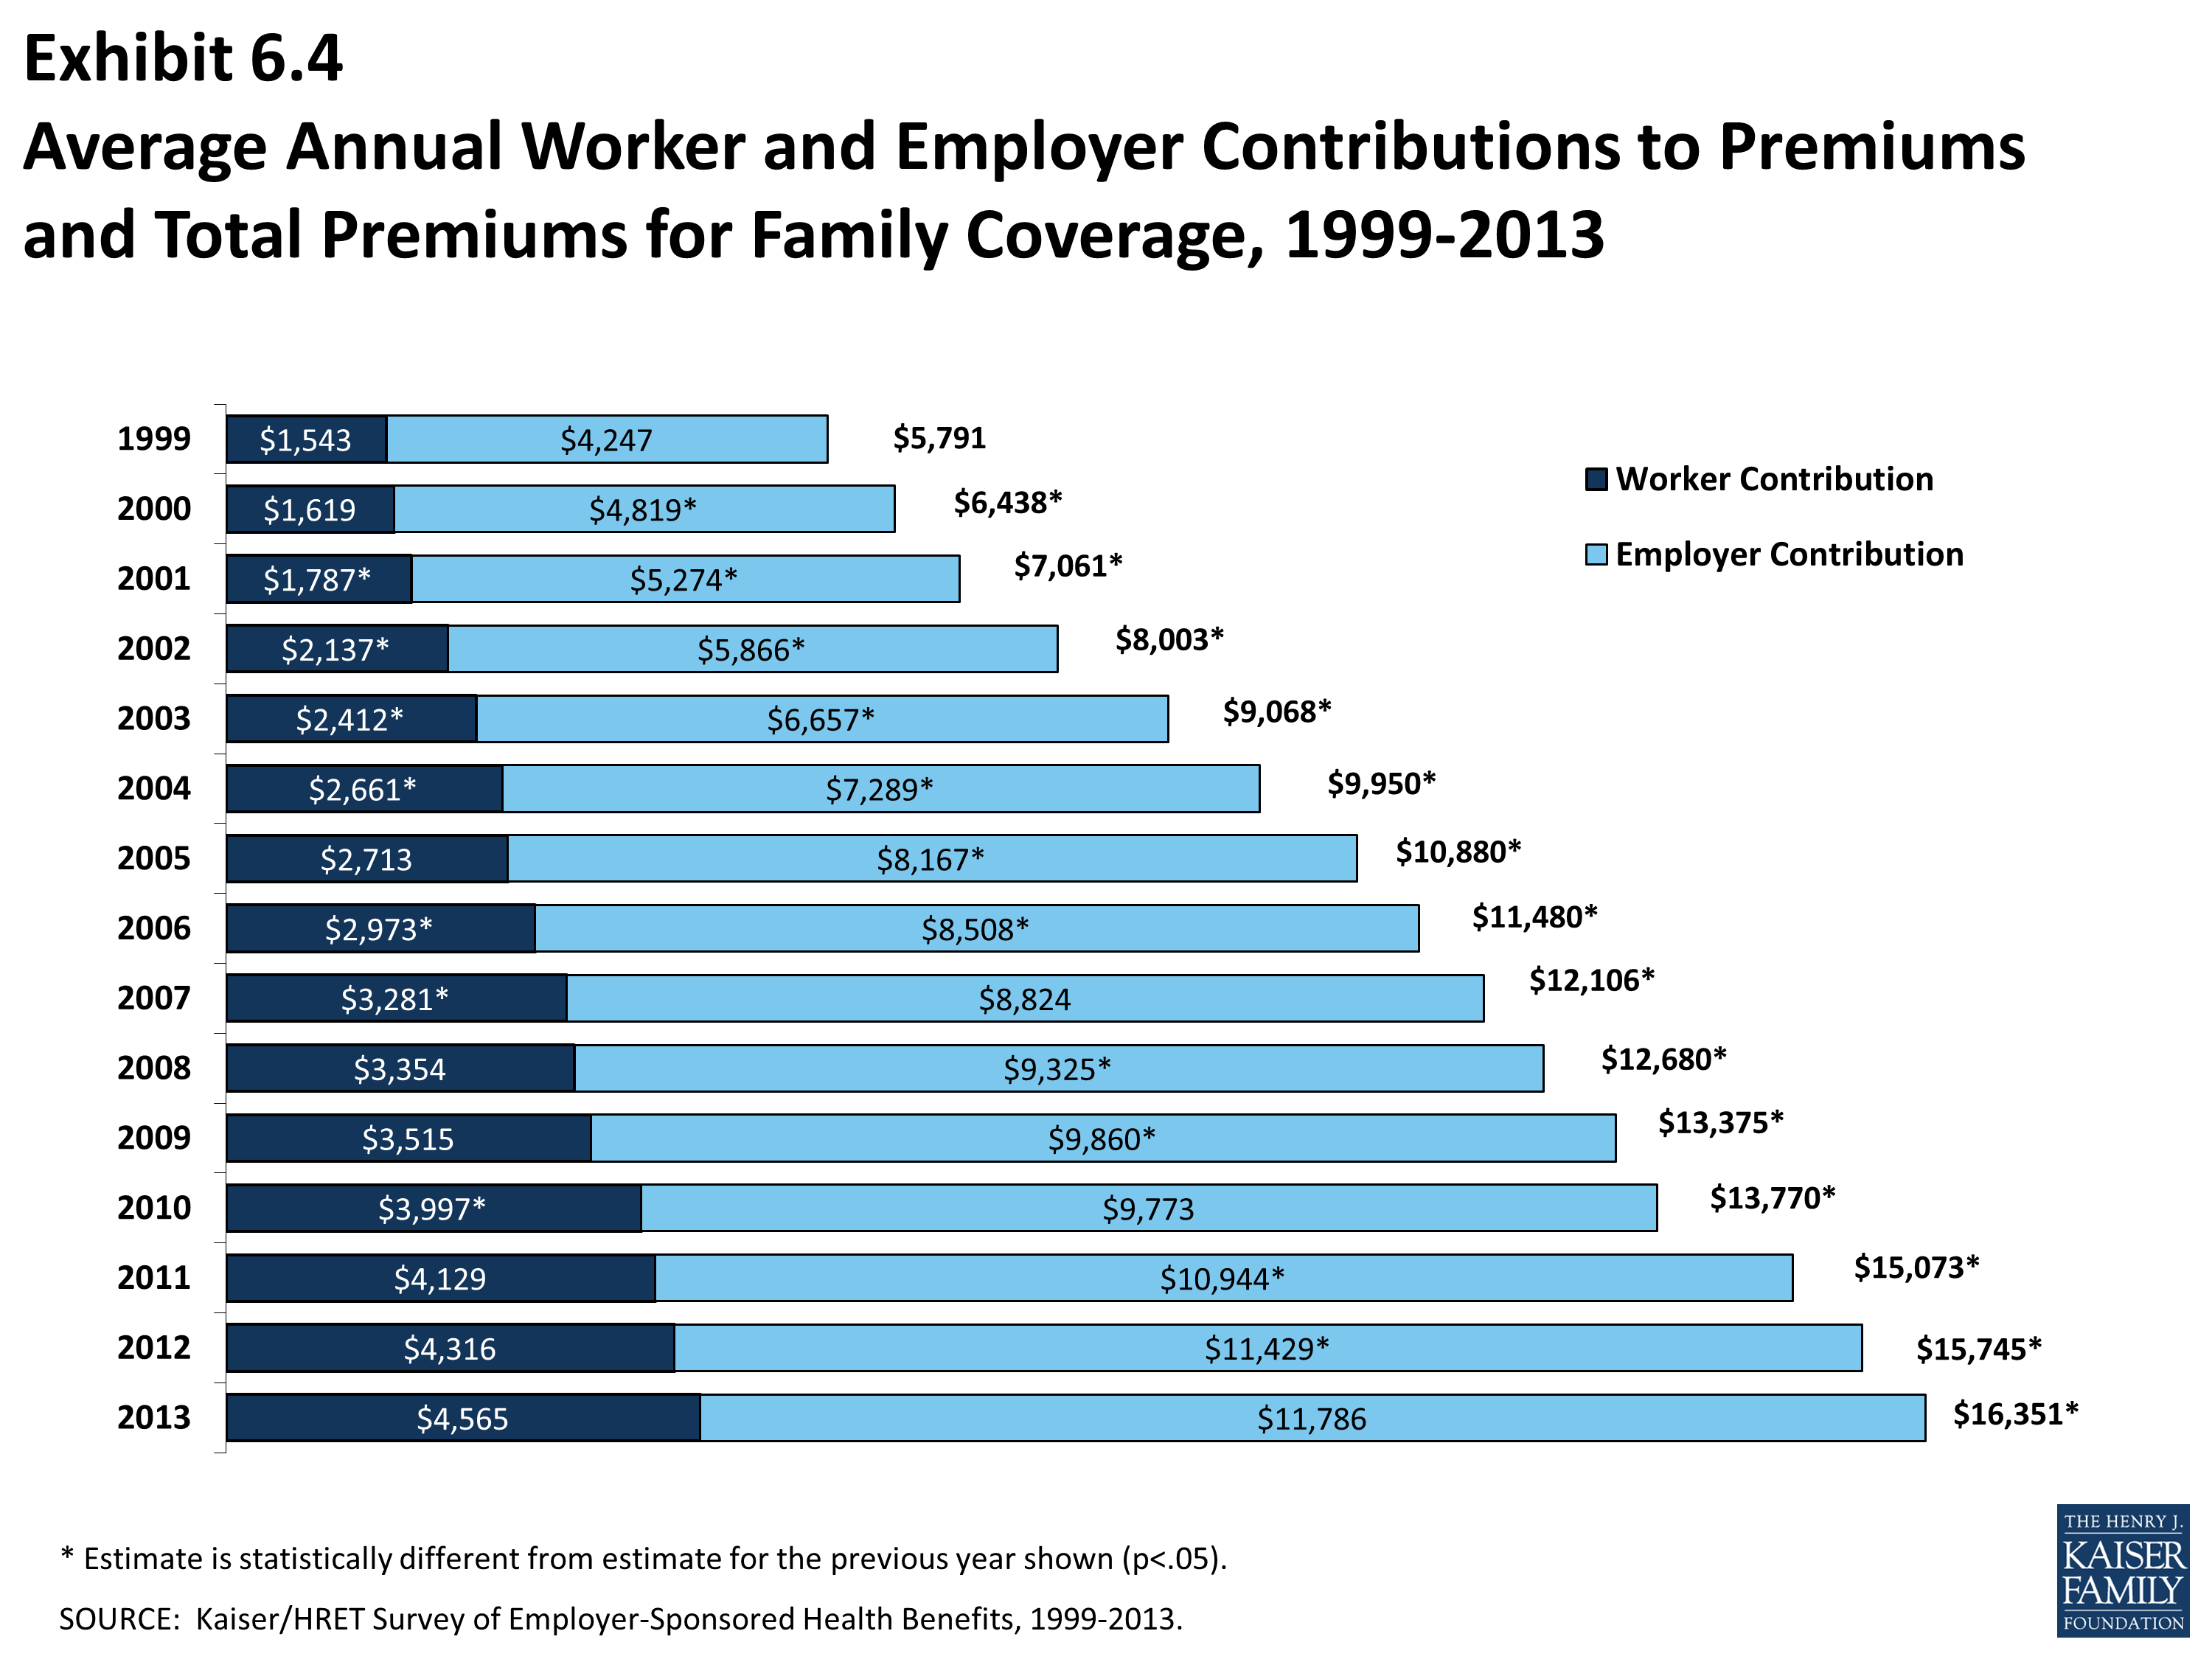
Annual premiums for employer-sponsored family health coverage reached $16,351 this year, up 4 percent from last year, with workers on average paying $4,565 towards the cost of their coverage, according to the Kaiser Family Foundation/Health Research & Educational Trust (HRET) 2013 Employer Health Benefits Survey.
News Release
- A news release announcing the publication of the 2013 Employer Health Benefits Survey is available here.
Summary of Findings
- The Summary of Findings provides an overview of the 2013 survey results and is available under the “Summary of Findings” tab or as a pdf file in the “Download” box to the right.
Full Report
- The complete Employer Health Benefits Survey Report includes over 200 exhibits and is available under the “Report” tab or as a pdf file in the “Download” box to the right. The “Report” tab contains 14 separate sections. Users can also download each section separately from the “Download” box or download the complete set of section exhibits from the bottom of the respective section page.
Health Affairs
- The peer-reviewed journal Health Affairs has published an article with key findings from the 2013 survey: Health Benefits in 2013: Moderate Premium Increases in Employer-Sponsored Plans.
Interactive Graphic
- This graphing tool allows users to look at changes in premiums and worker contributions for covered workers at different types of firms, over time.: Premiums and Worker Contributions Among Workers Covered by Employer-Sponsored Coverage, 1999-2013.
Key Exhibits – Chartpack
- Twenty overview slides from the 2013 Employer Health Benefits Survey are available as a slideshow or as pdf.
Additional Resources
- Standard errors for selected estimates are available in the Technical Supplement here.
- Employer Health Benefits Surveys from 1998-2012 are available here. Please note that historic survey reports have not been revised with methodological changes.
- Researchers may request a public use dataset here.
Researchers at the Kaiser Family Foundation, NORC at the University of Chicago, and Health Research & Educational Trust designed and analyzed the survey.
Summary of Findings
2013 Summary of Findings
Employer-sponsored insurance covers about 149 million nonelderly people.1 To provide current information about employer-sponsored health benefits, the Kaiser Family Foundation (Kaiser) and the Health Research & Educational Trust (HRET) conduct an annual survey of nonfederal private and public employers with three or more workers. This is the fifteenth Kaiser/HRET survey and reflects employer sponsored health benefits in 2013.
The key findings from the survey, conducted from January through May 2013, include modest increases in premiums for both single coverage (5%) and family coverage (4%). Covered workers generally face similar premium contributions and cost-sharing requirements in 2013 compared to 2012. However, the percentage of covered workers enrolled in plan with a general annual deductible increased in 2013, to over three quarters of covered workers (78%). Additionally, over half (58%) of covered workers at small firms (3-199 workers) now have a deductible of a $1,000 dollars or more. The percentage of firms (57%) which offer health benefits to at least some of their employees and the percentage of workers covered at those firms (62%) are statistically unchanged from 2012. The percentage of covered workers enrolled in grandfathered health plans – those plans exempt from many provisions of the Affordable Care Act (ACA) – declined to 36% of covered workers from 48% in 2012 and 56% in 2011. Firms offering health benefits continue to offer wellness and health promotion programs: 77% of firms offer at least one wellness program, 24% offer employees health risk assessments, and 57% offer at least one disease management program. Small percentages of these firms use financial incentives in order to encourage workers to participate or complete these activities.
HEALTH INSURANCE PREMIUMS AND WORKER CONTRIBUTIONS
In 2013, the average annual premiums for employer-sponsored health insurance are $5,884 for single coverage and $16,351 for family coverage. The single premium is 5% higher and the family premium is 4% higher than the 2012 average premiums. During the same period workers’ wages increased 1.8% and inflation increased 1.1%.2 Over the last 10 years, the average premium for family coverage has increased 80% (Exhibit A).
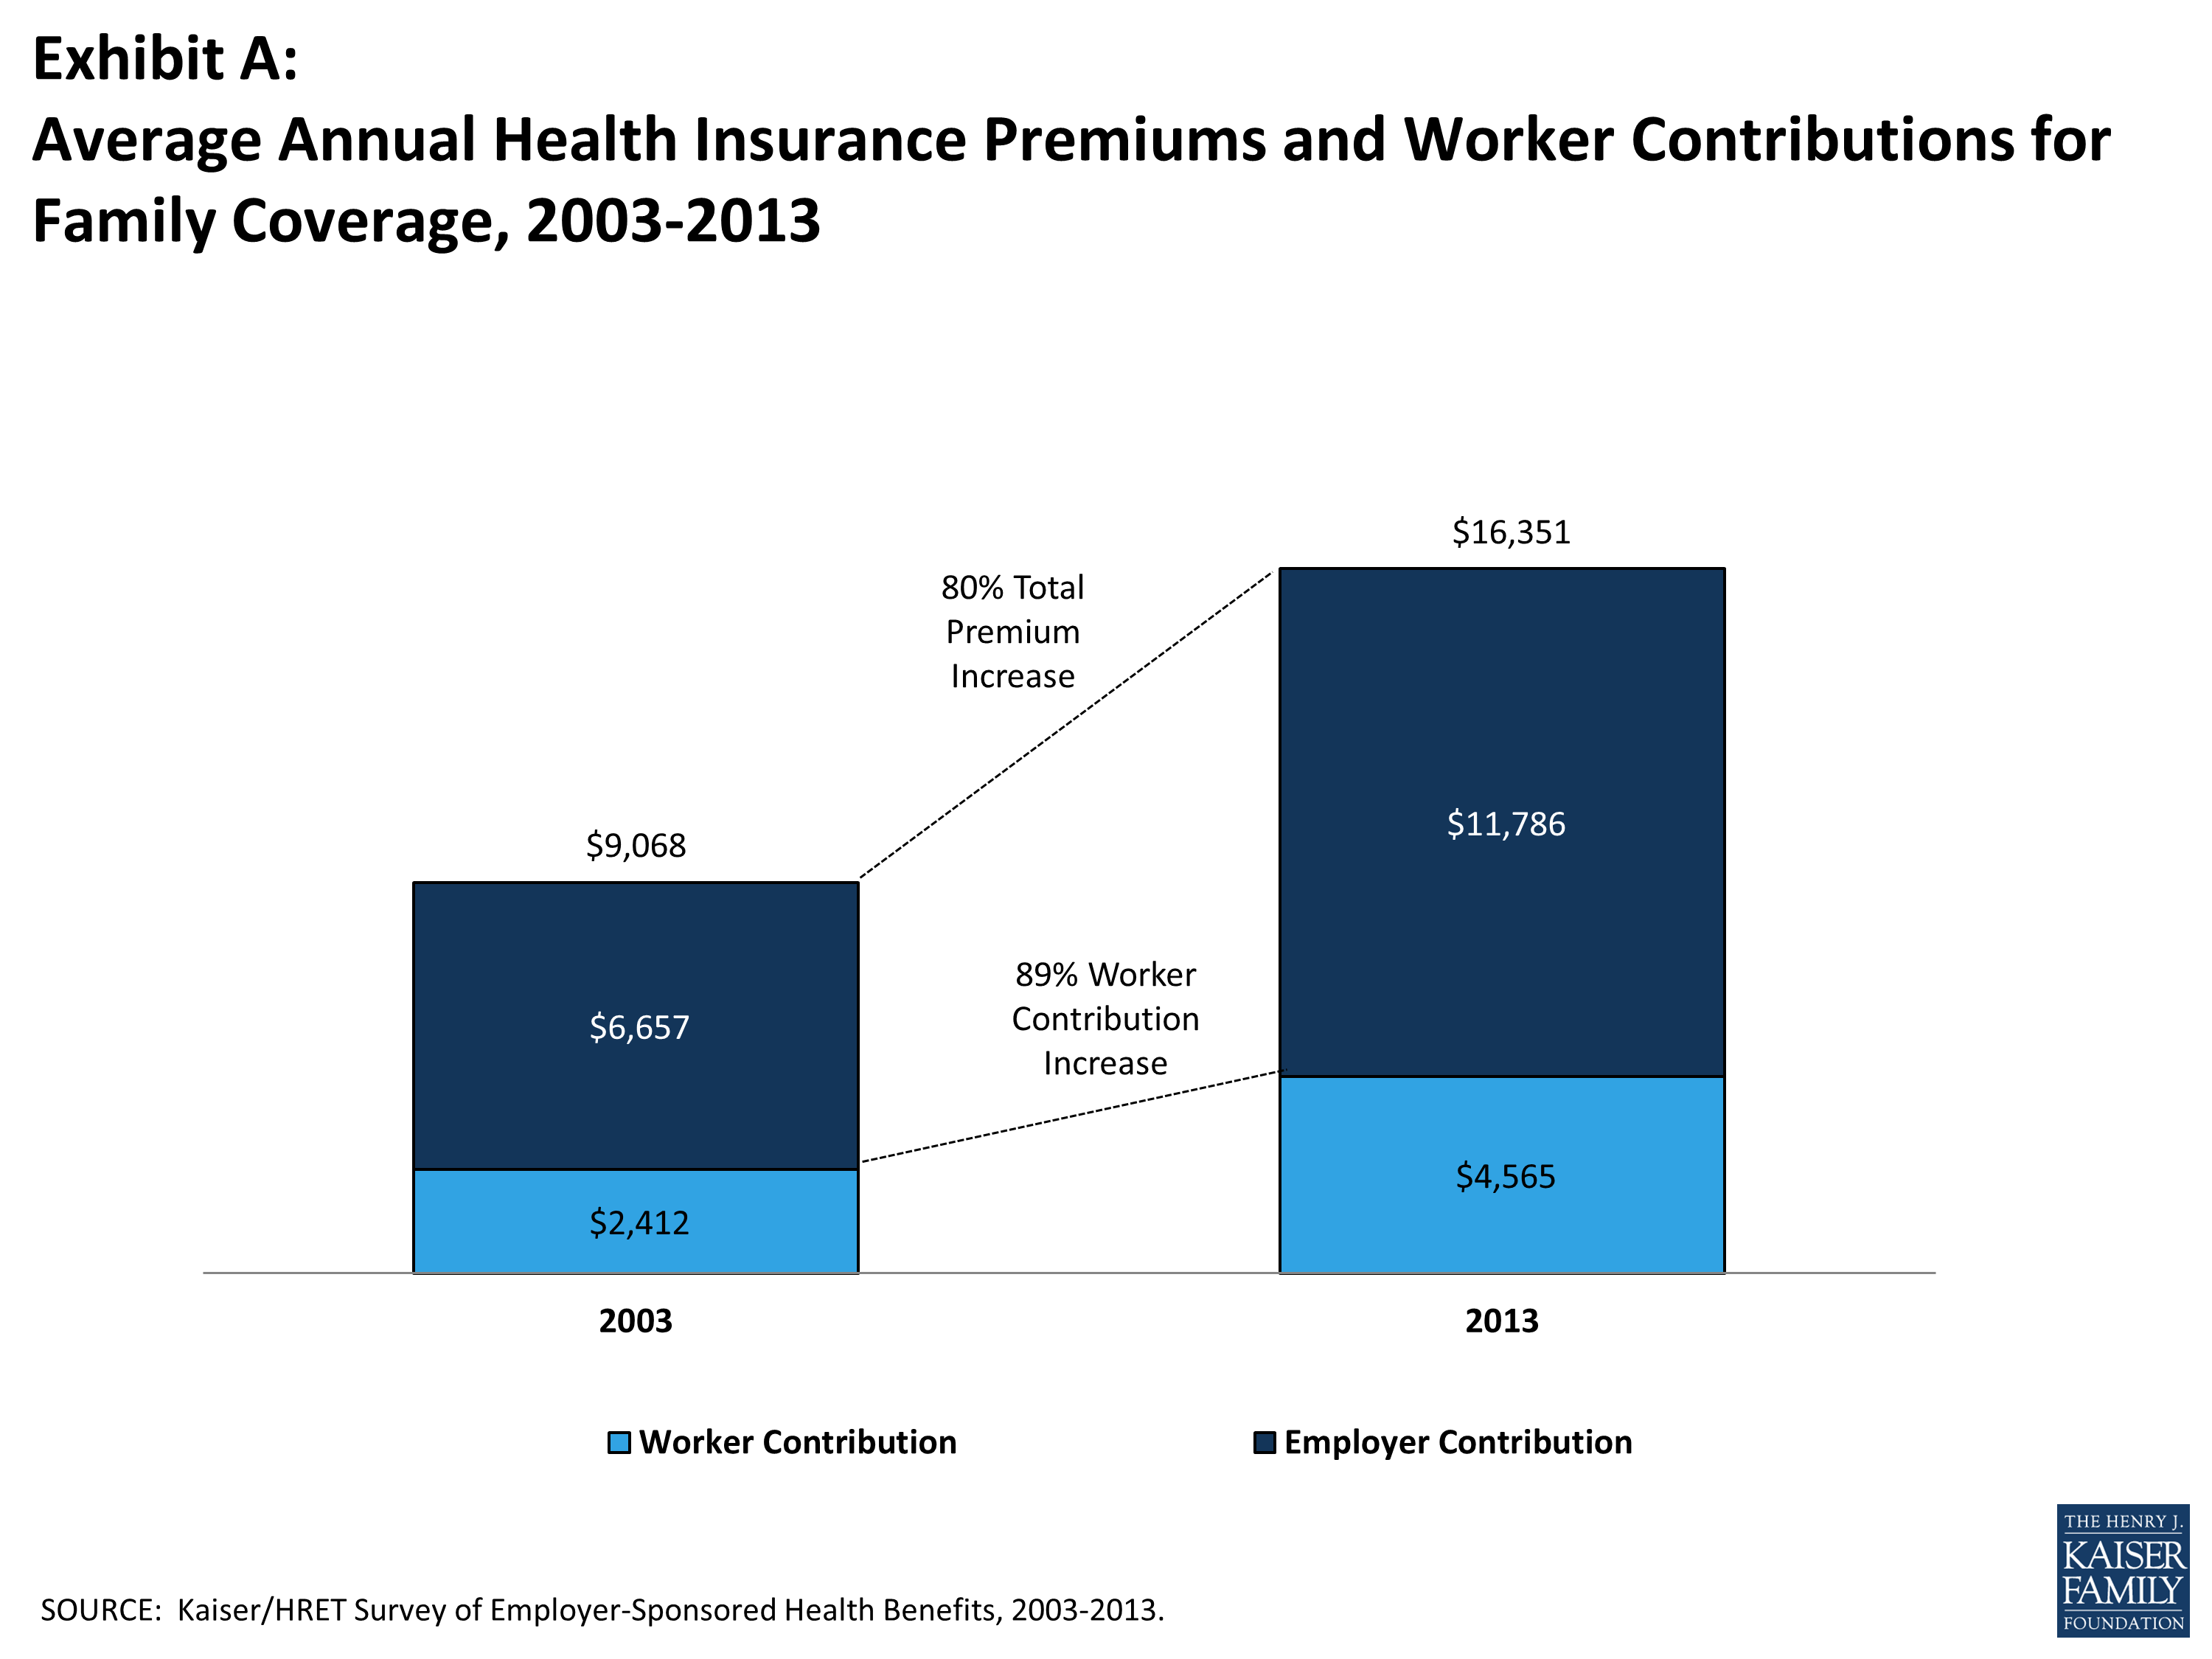
Exhibit A
Average premiums for high-deductible health plans with a savings option (HDHP/SOs) are lower than the overall average for all plan types for both single and family coverage (Exhibit B), at $5,306 and $15,227, respectively. Looking at firm size, the average premium for family coverage is lower for covered workers in small firms (3-199 workers) than for workers in larger firms ($15,581 vs. $16,715).
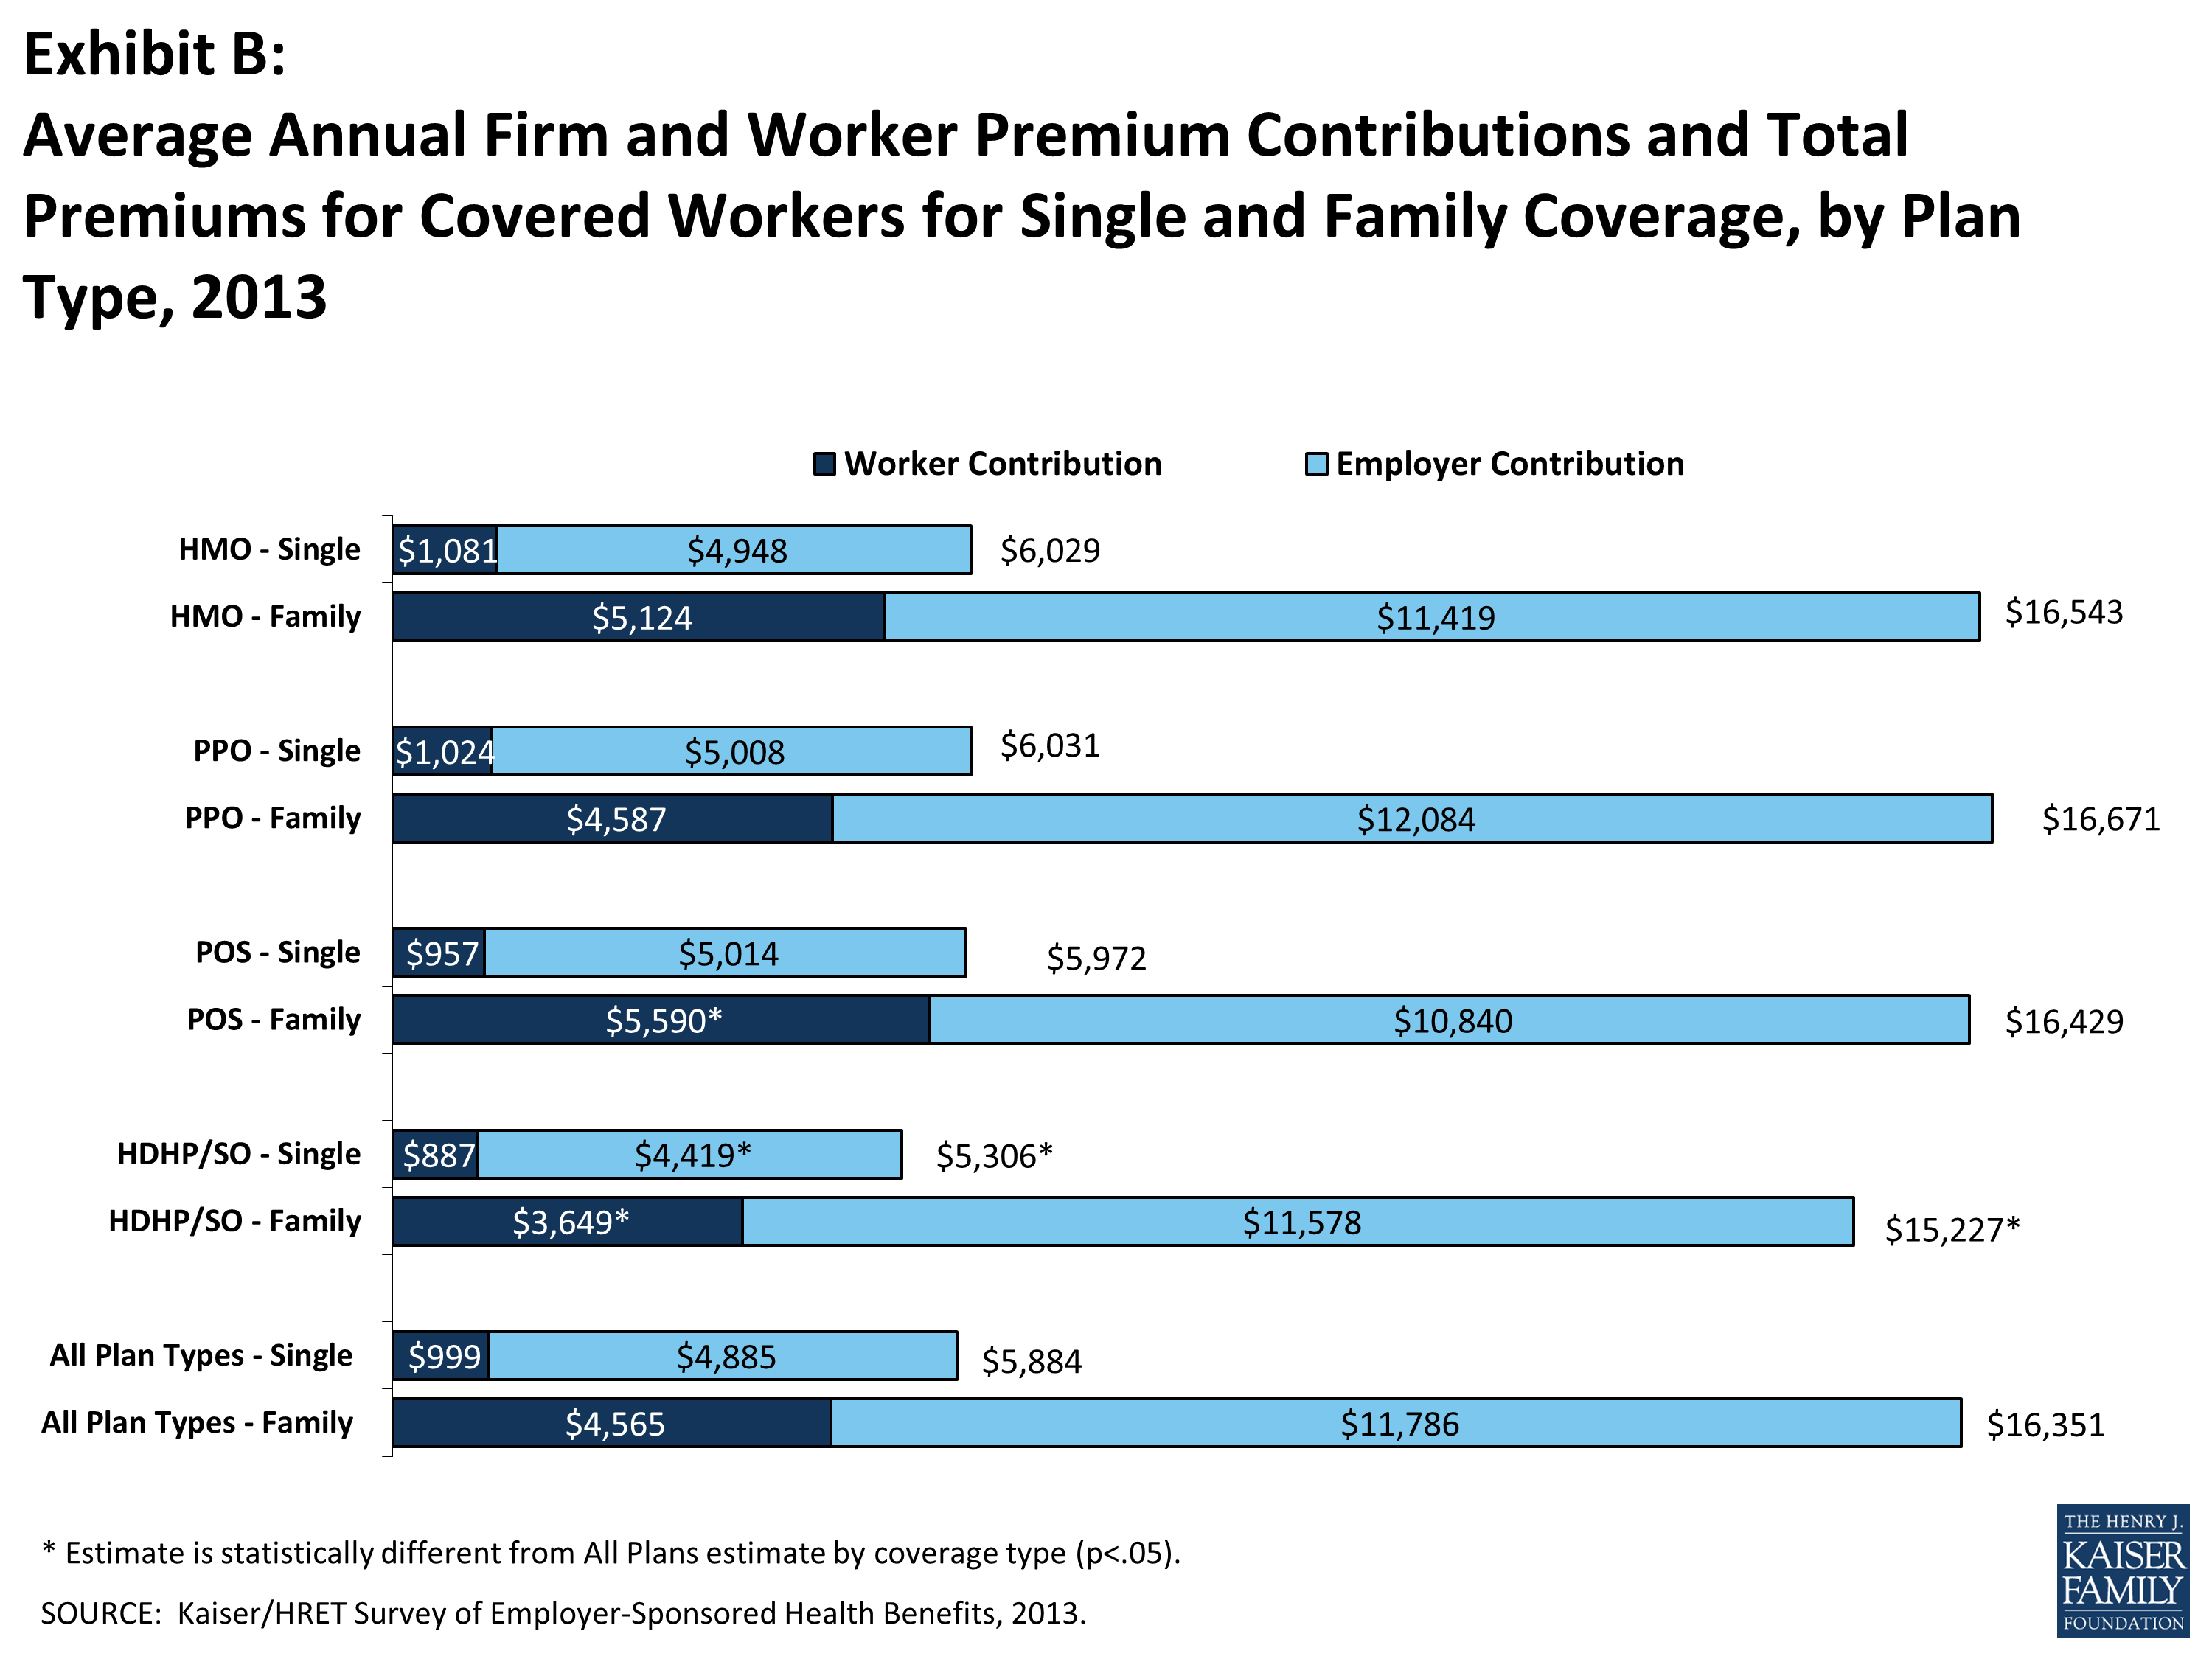
Exhibit B
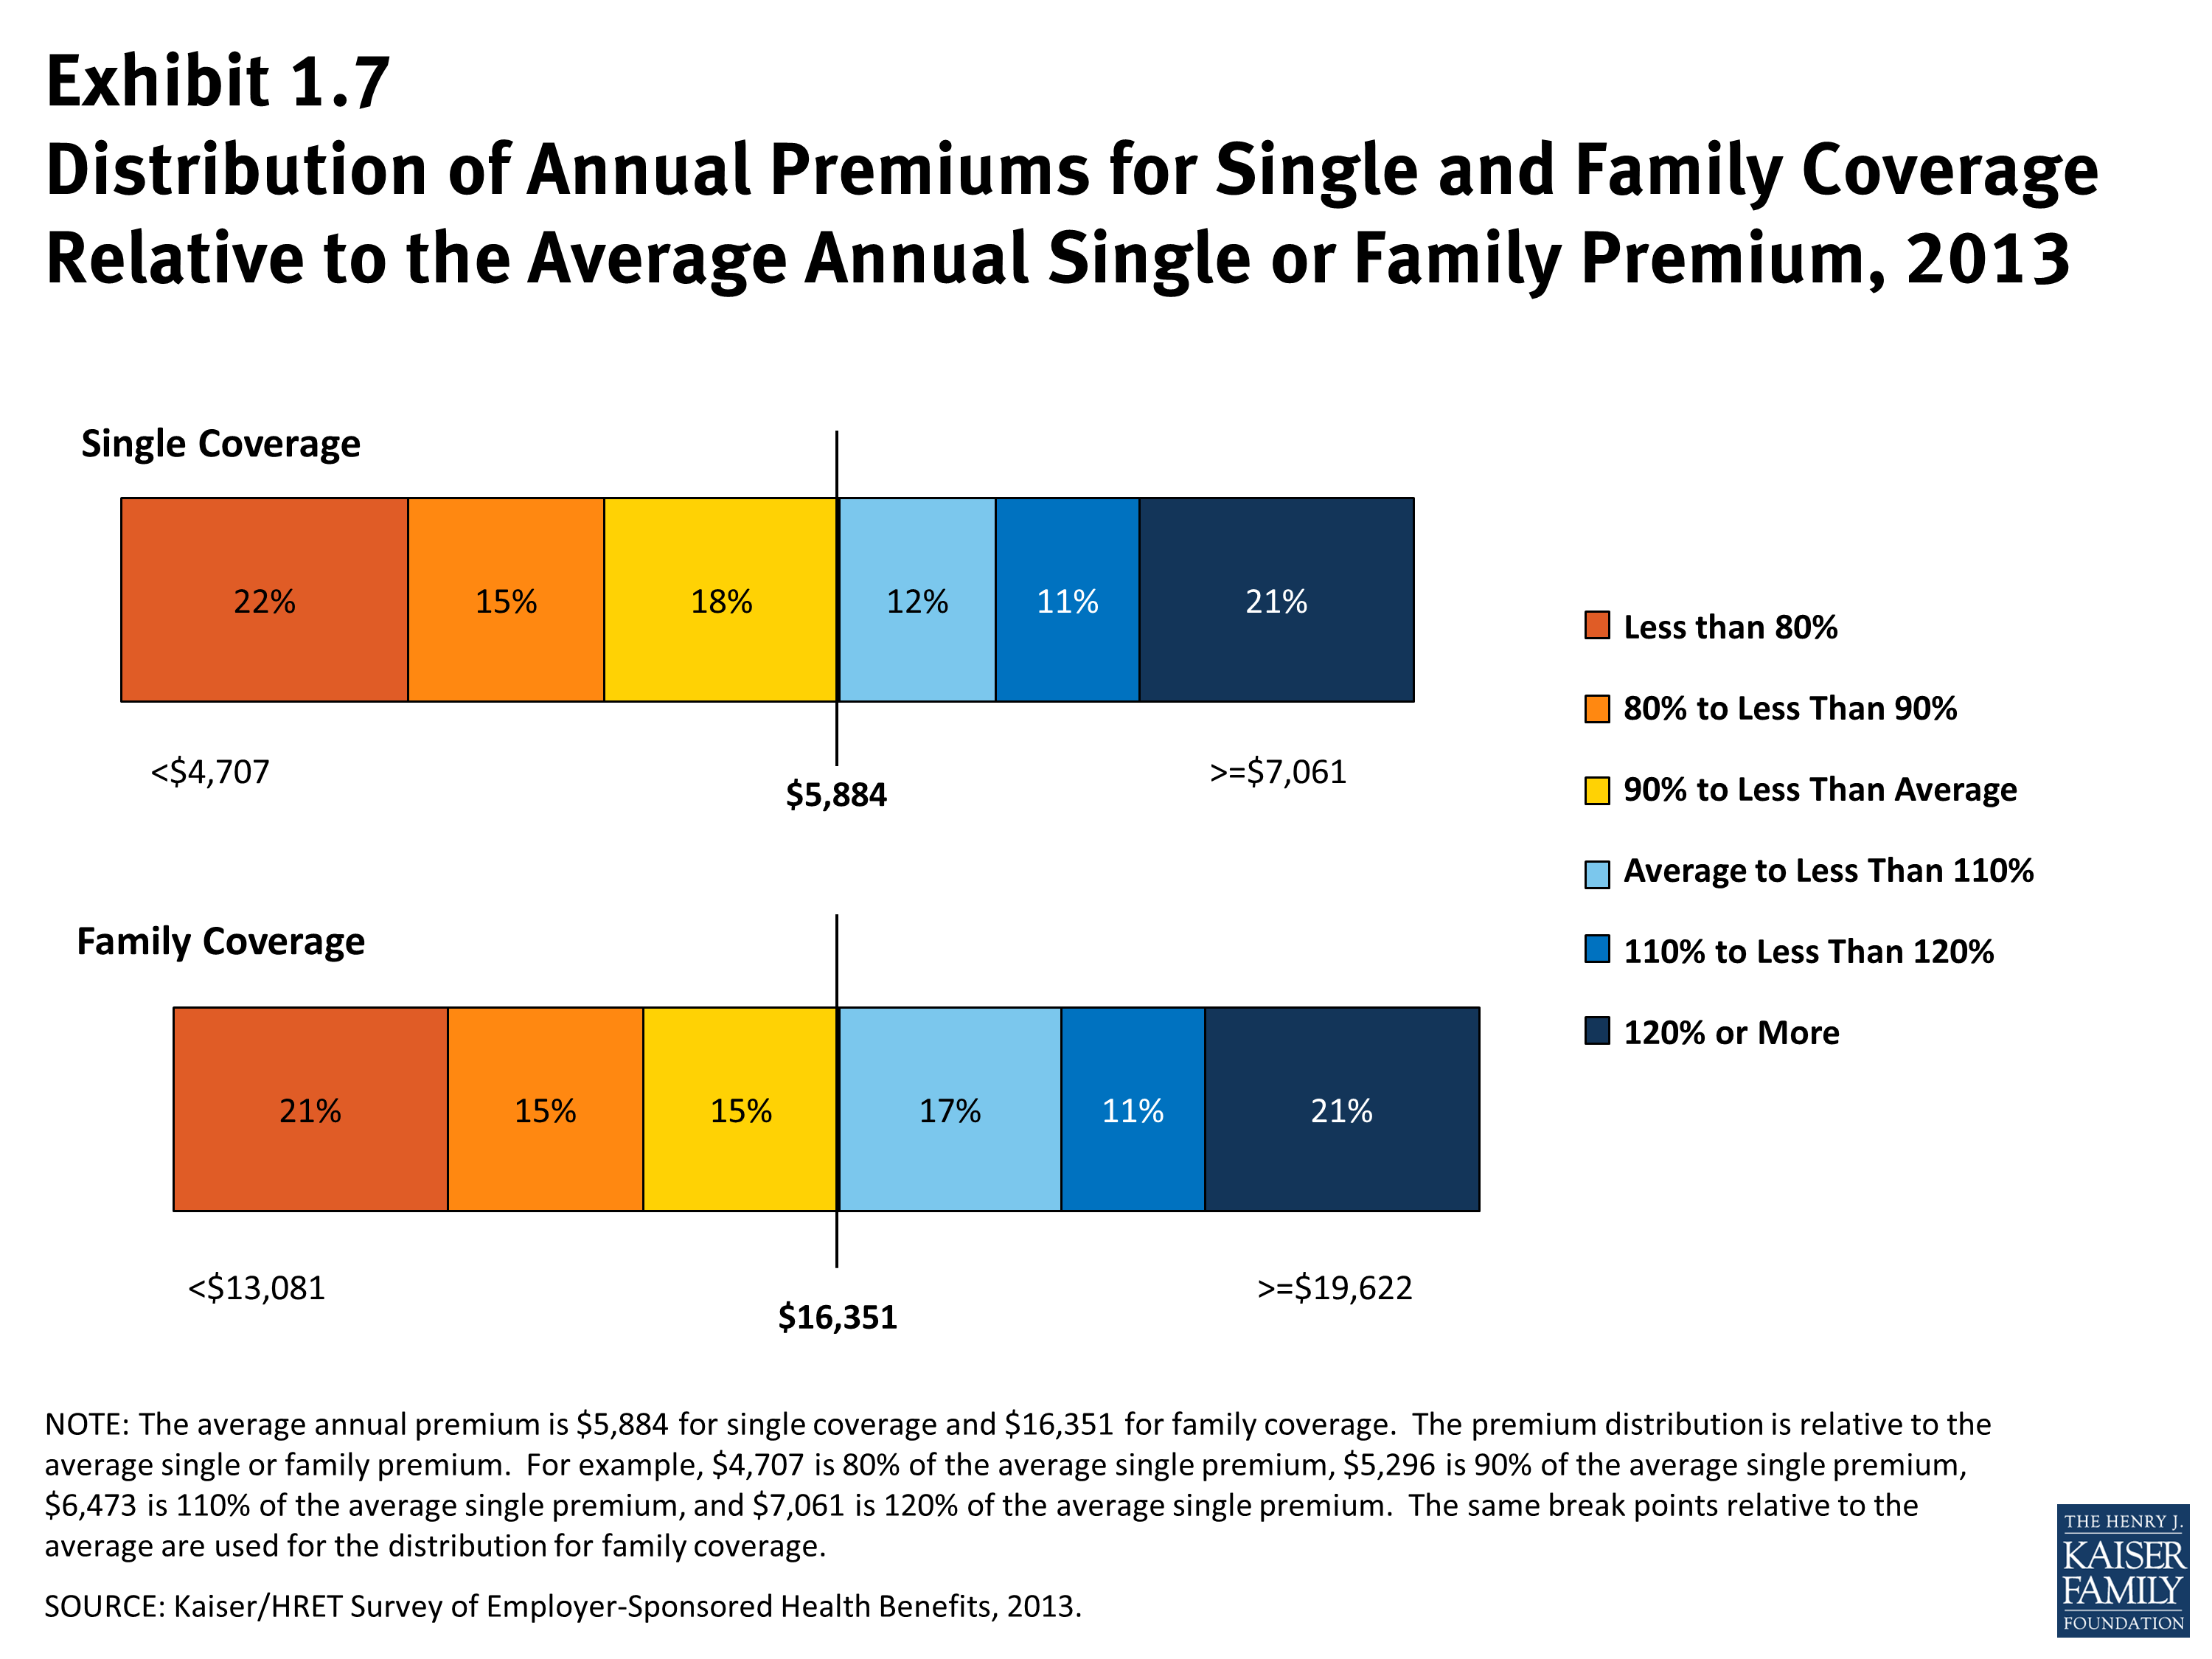
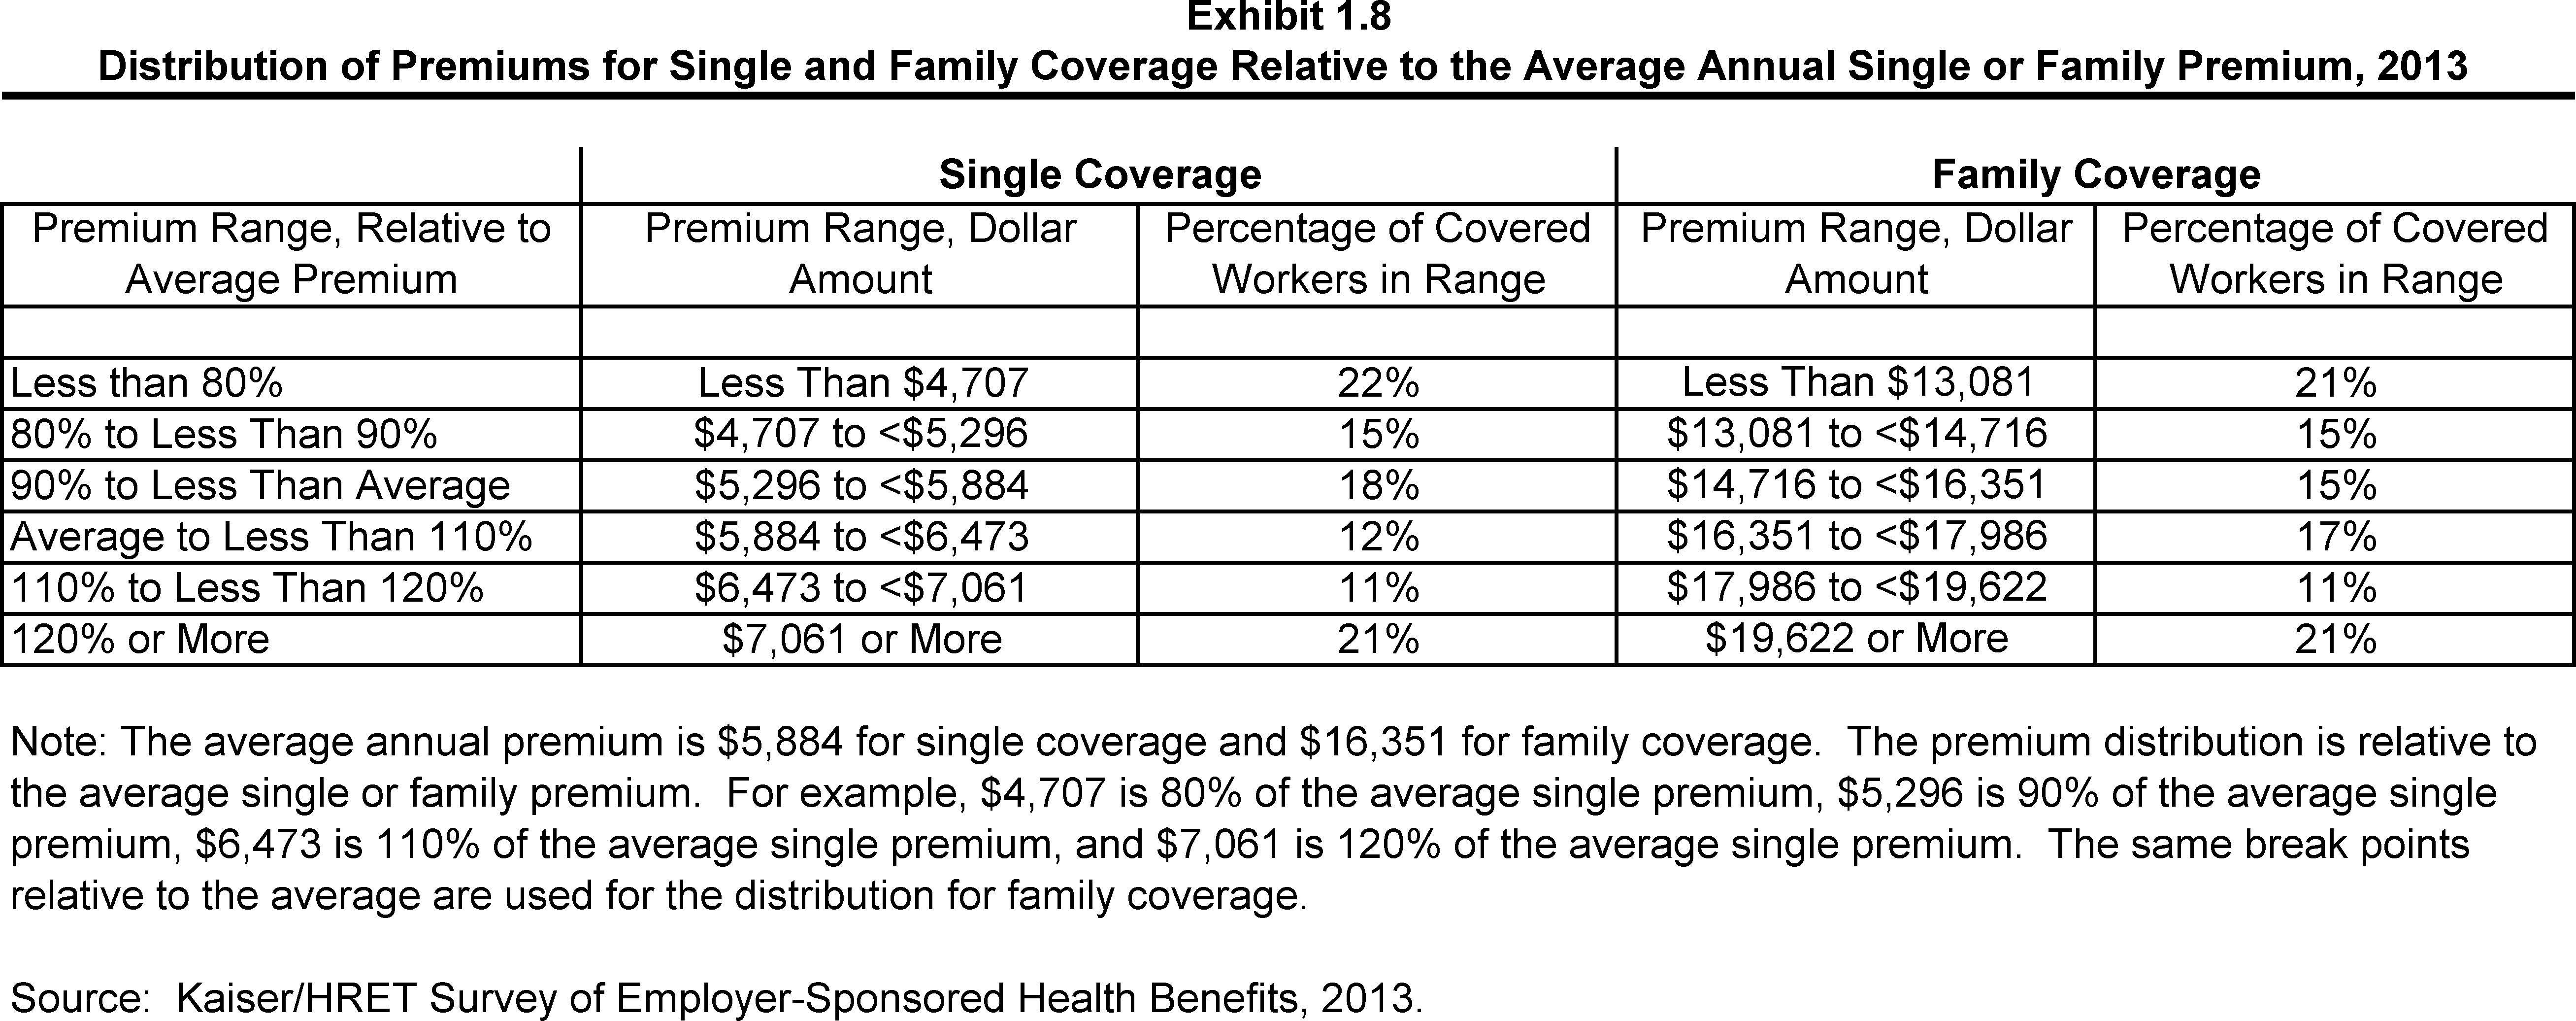
There is significant variation around the average single and family premiums, resulting from differences in benefits, cost sharing, covered populations, and geographical location. Twenty-one percent of covered workers are in plans with an annual total premium for family coverage of at least $19,622 (120% of the average family premium), while 21% of covered workers are in plans where the family premium is less than $13,081 (80% of the average family premium). The distribution is similar around the average single premium (Exhibit C).
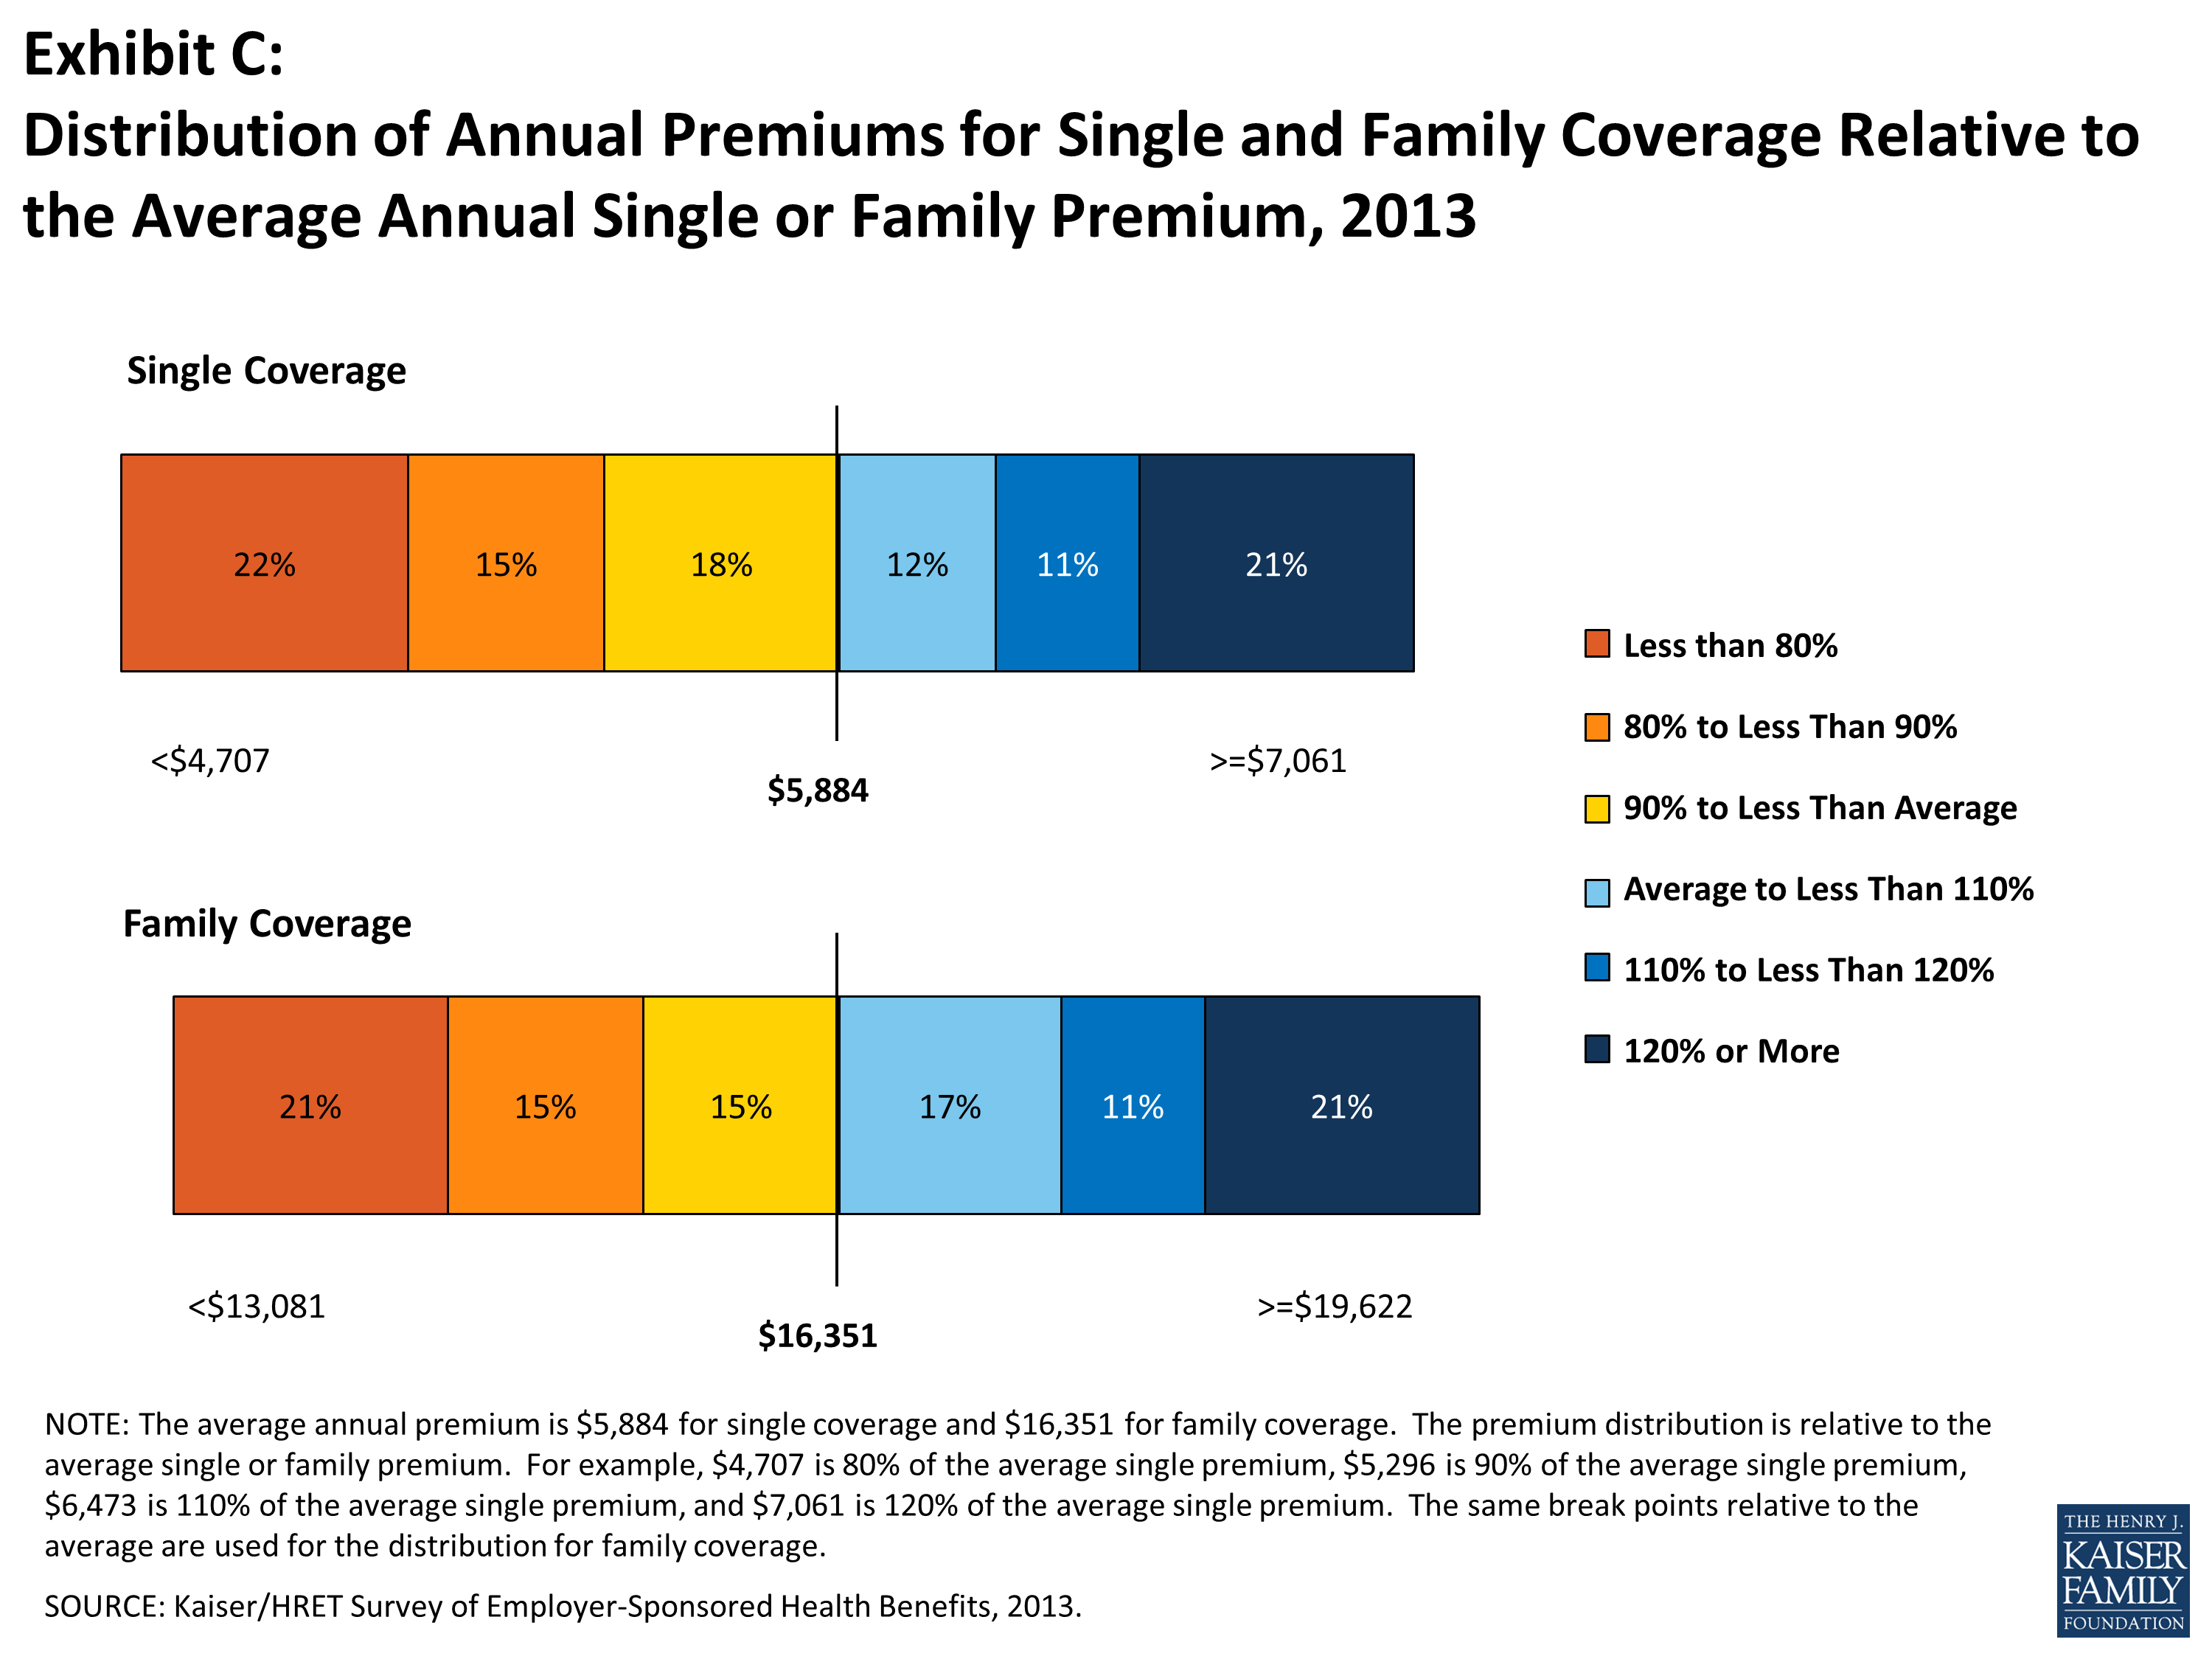
Exhibit C
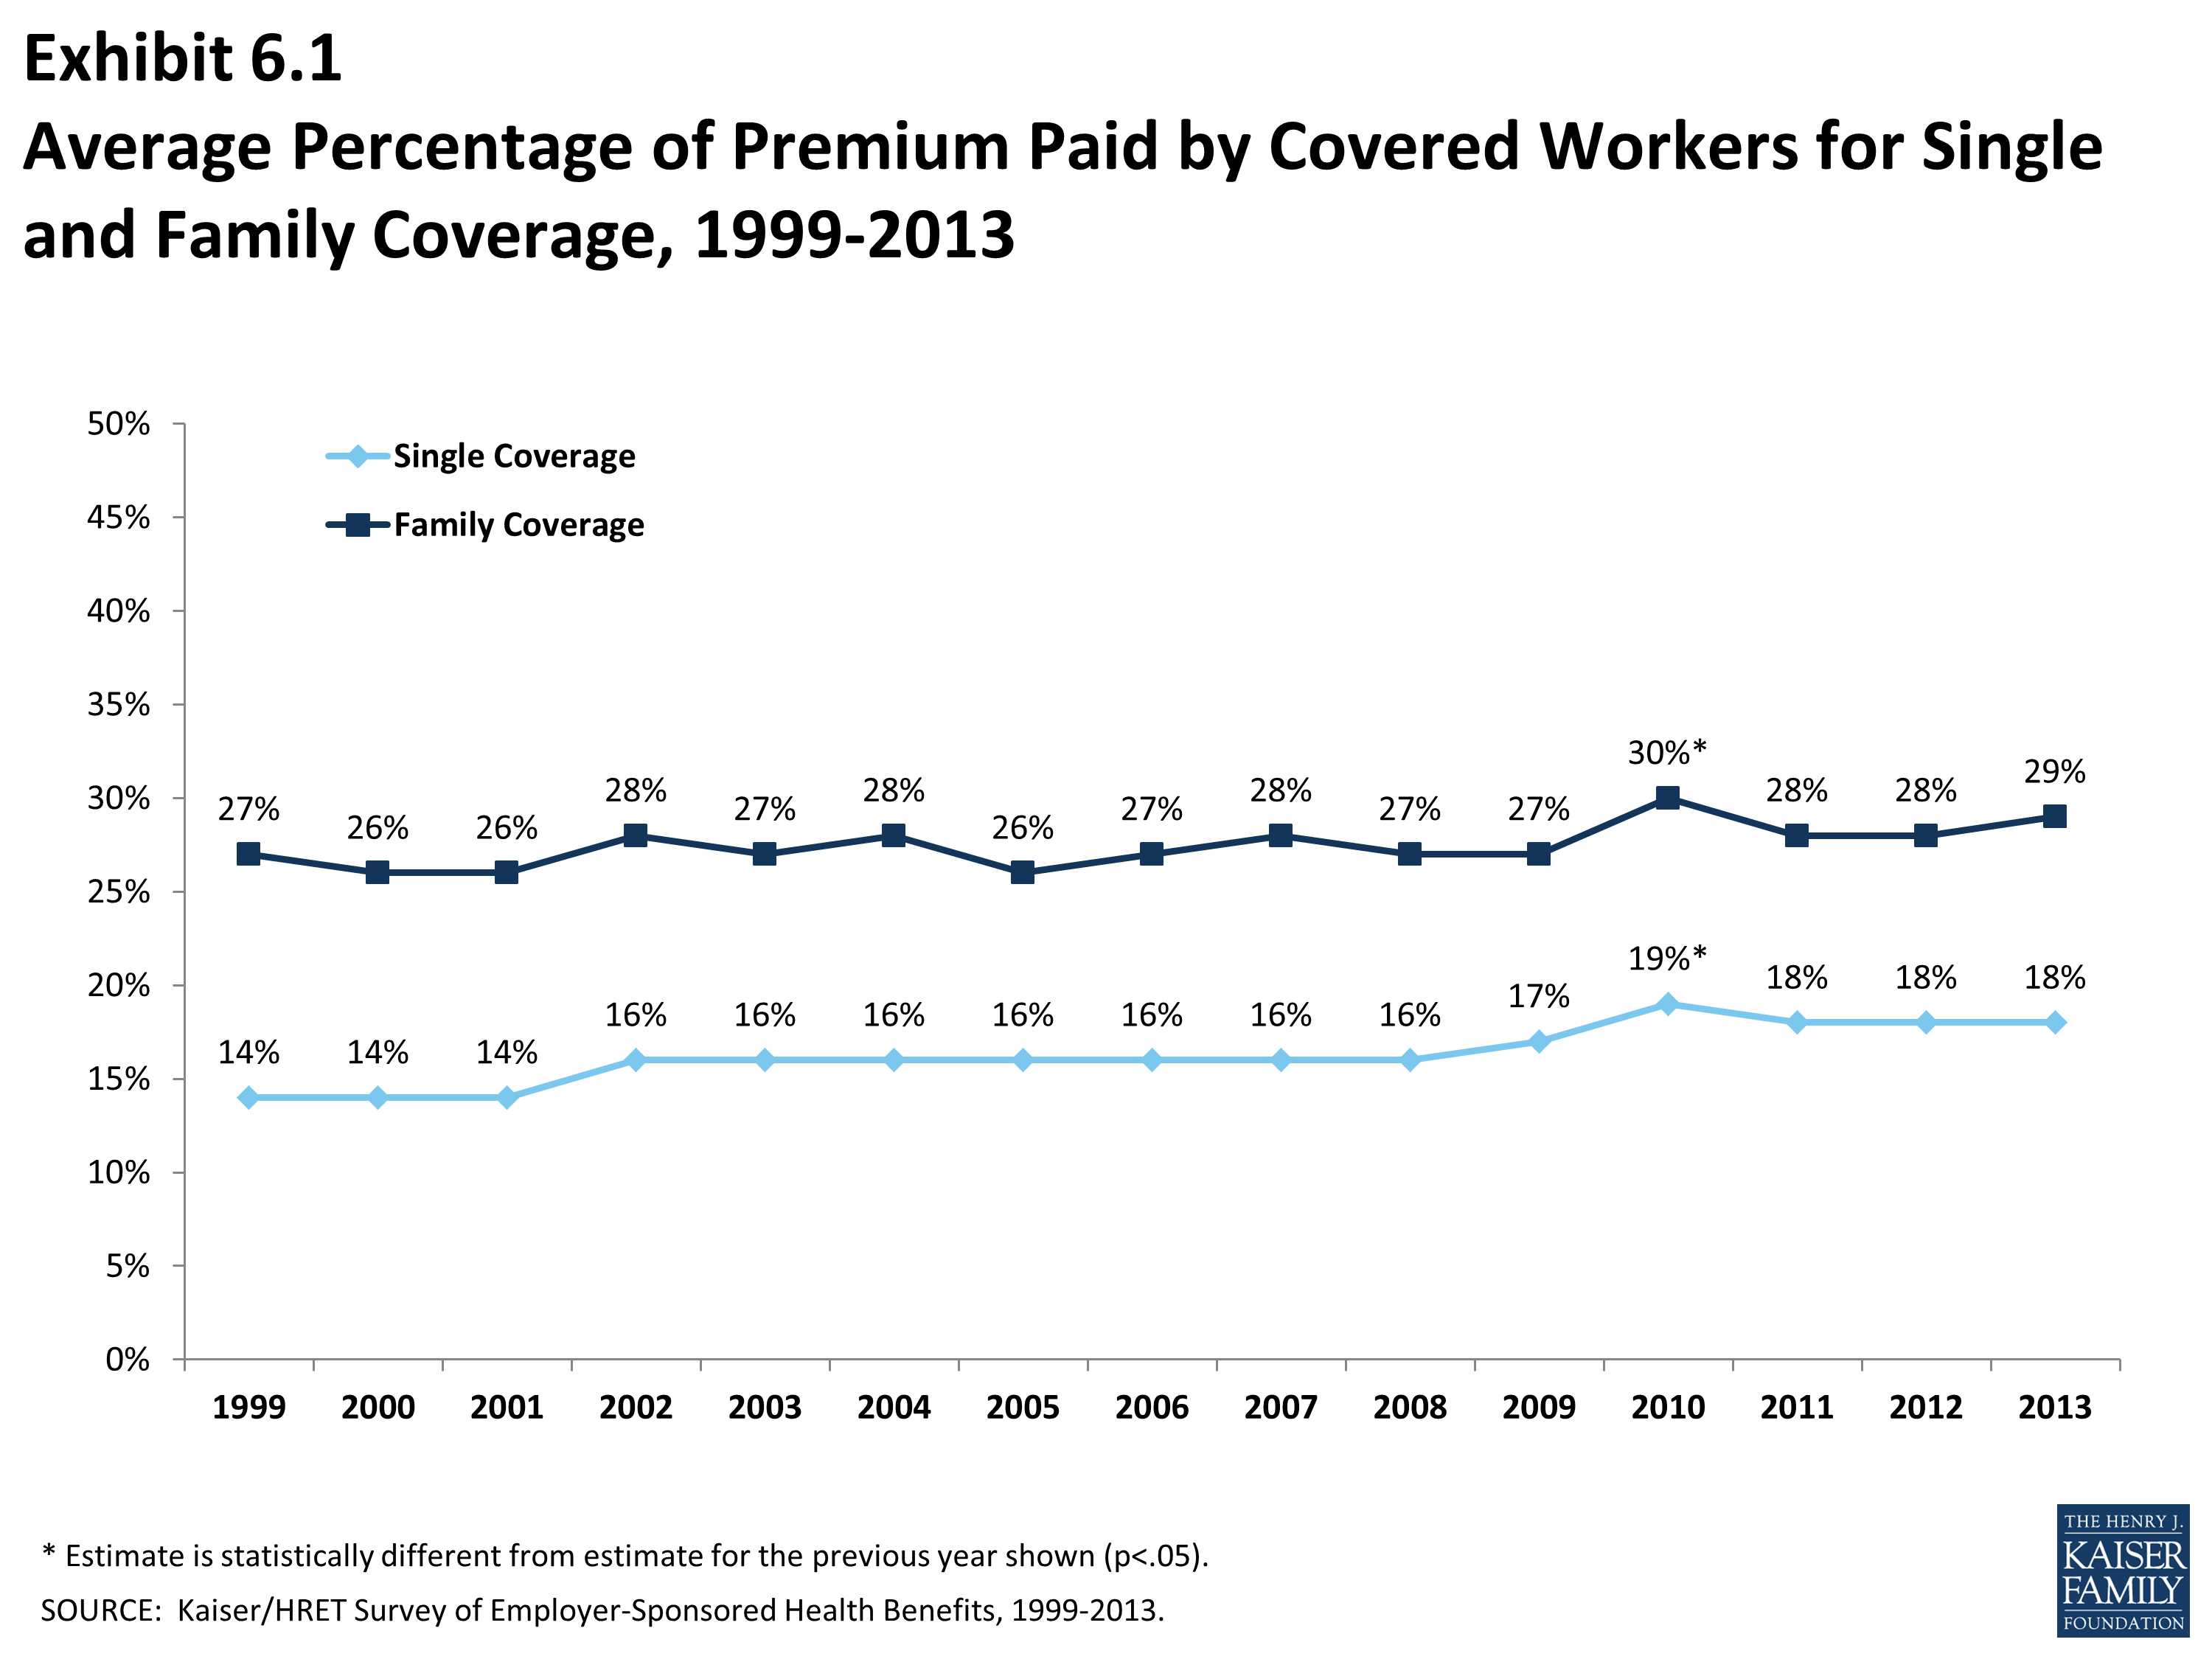
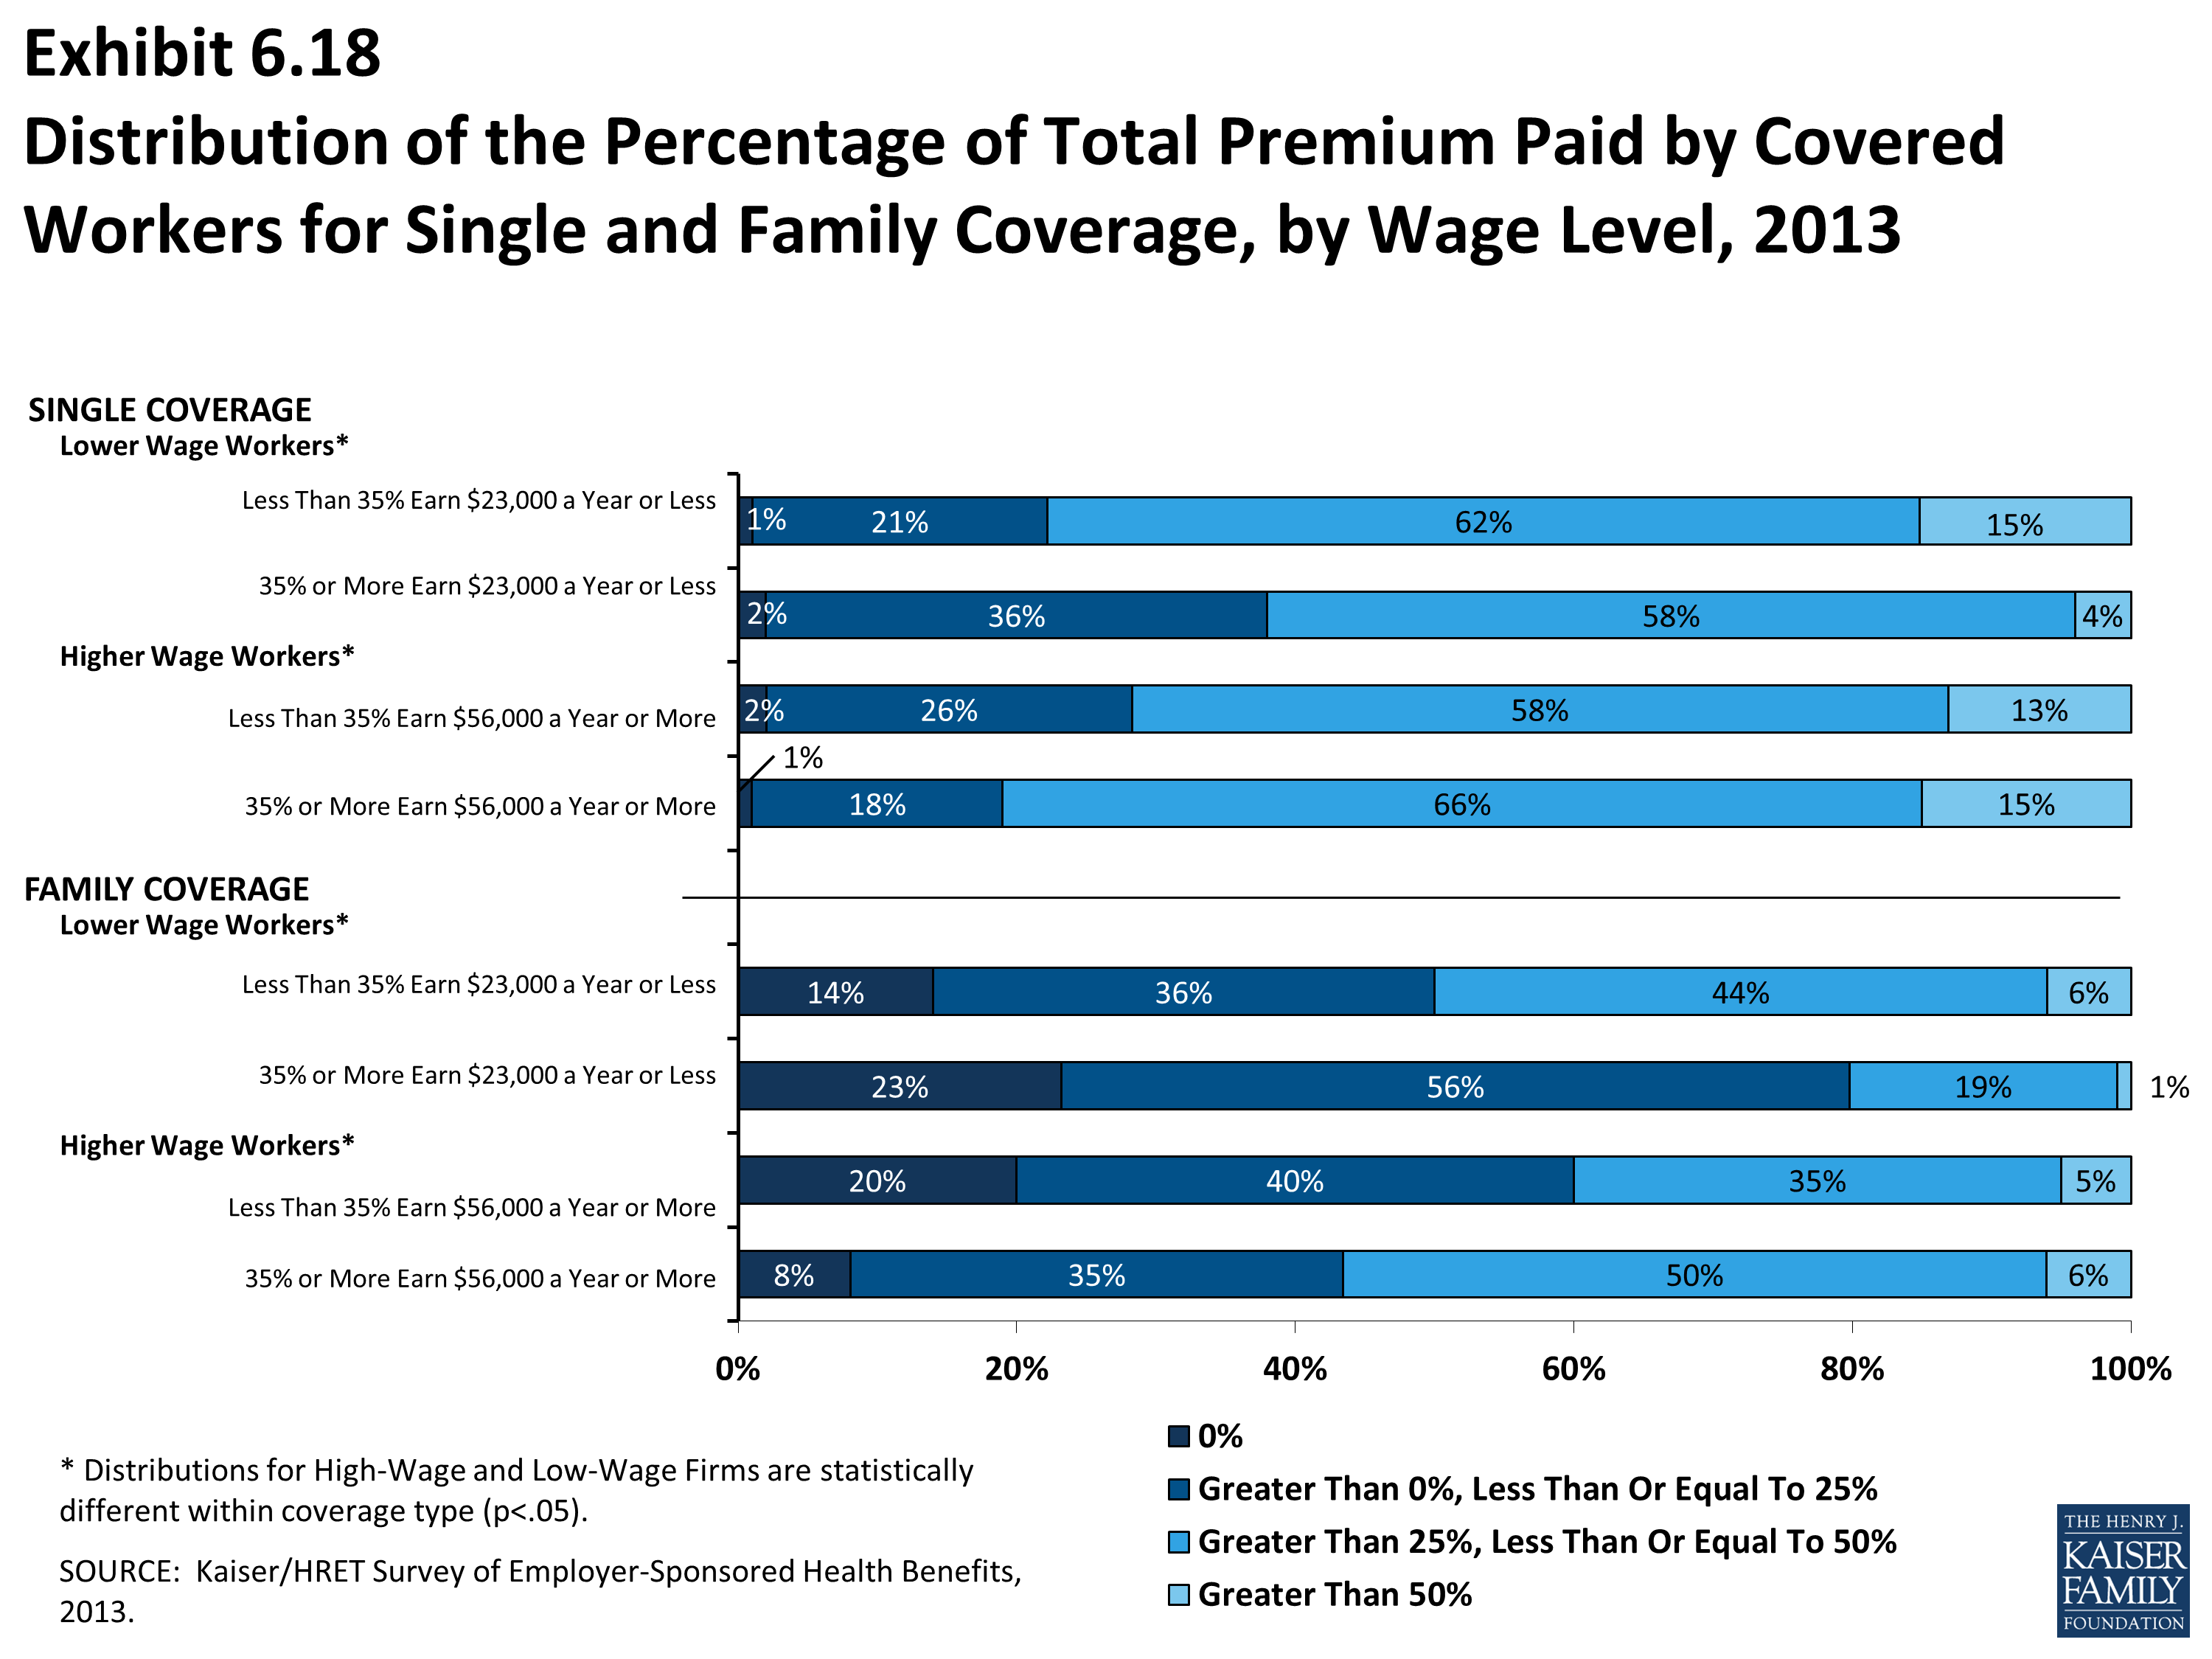
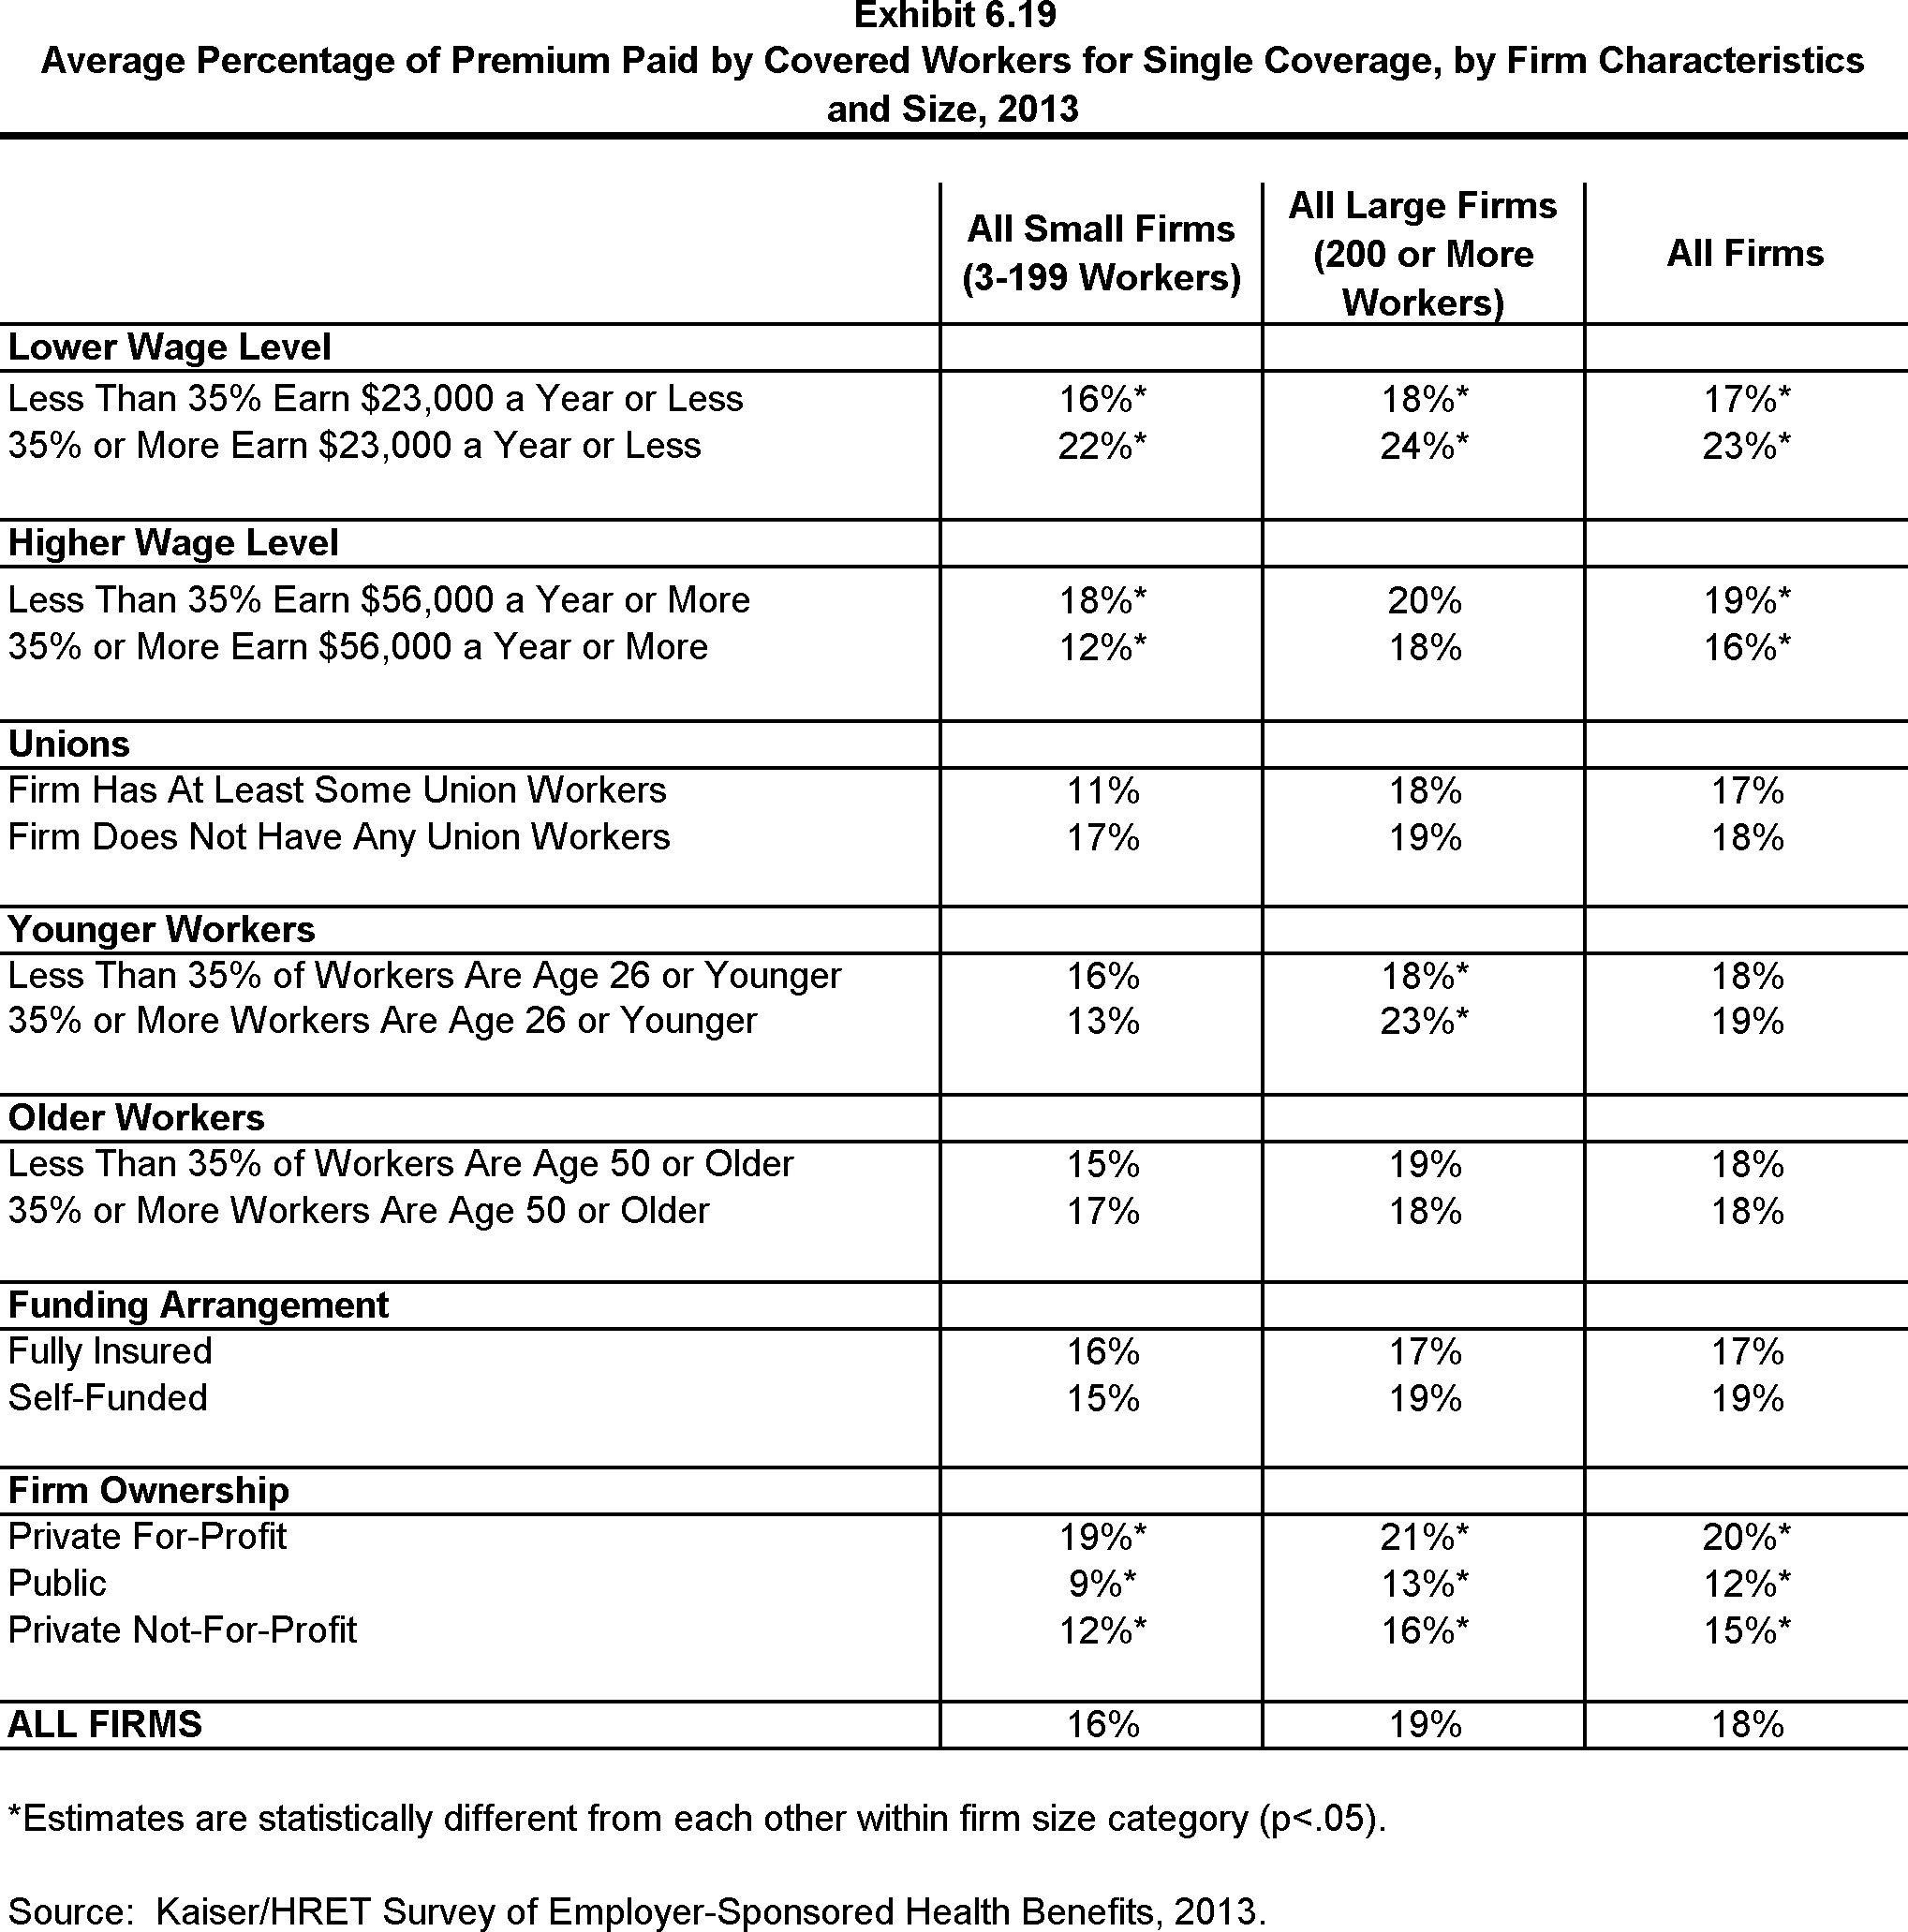
Most often, employers require that workers make a contribution towards the cost of the premium. Covered workers contribute on average 18% of the premium for single coverage and 29% of the premium for family coverage, similar to the percentages contributed in 2012 and relatively unchanged over the past decade. Workers in small firms (3 – 199 workers) contribute a lower average percentage for single coverage compared to workers in larger firms (16% vs. 19%), but they contribute a higher average percentage for family coverage (36% vs. 26%). Workers in firms with a higher percentage of lower-wage workers (at least 35% of workers earn $23,000 or less) contribute higher percentages of the premium for single coverage (23% vs. 17%) and for family coverage (39% vs. 29%) than workers in firms with a smaller share lower-wage workers.
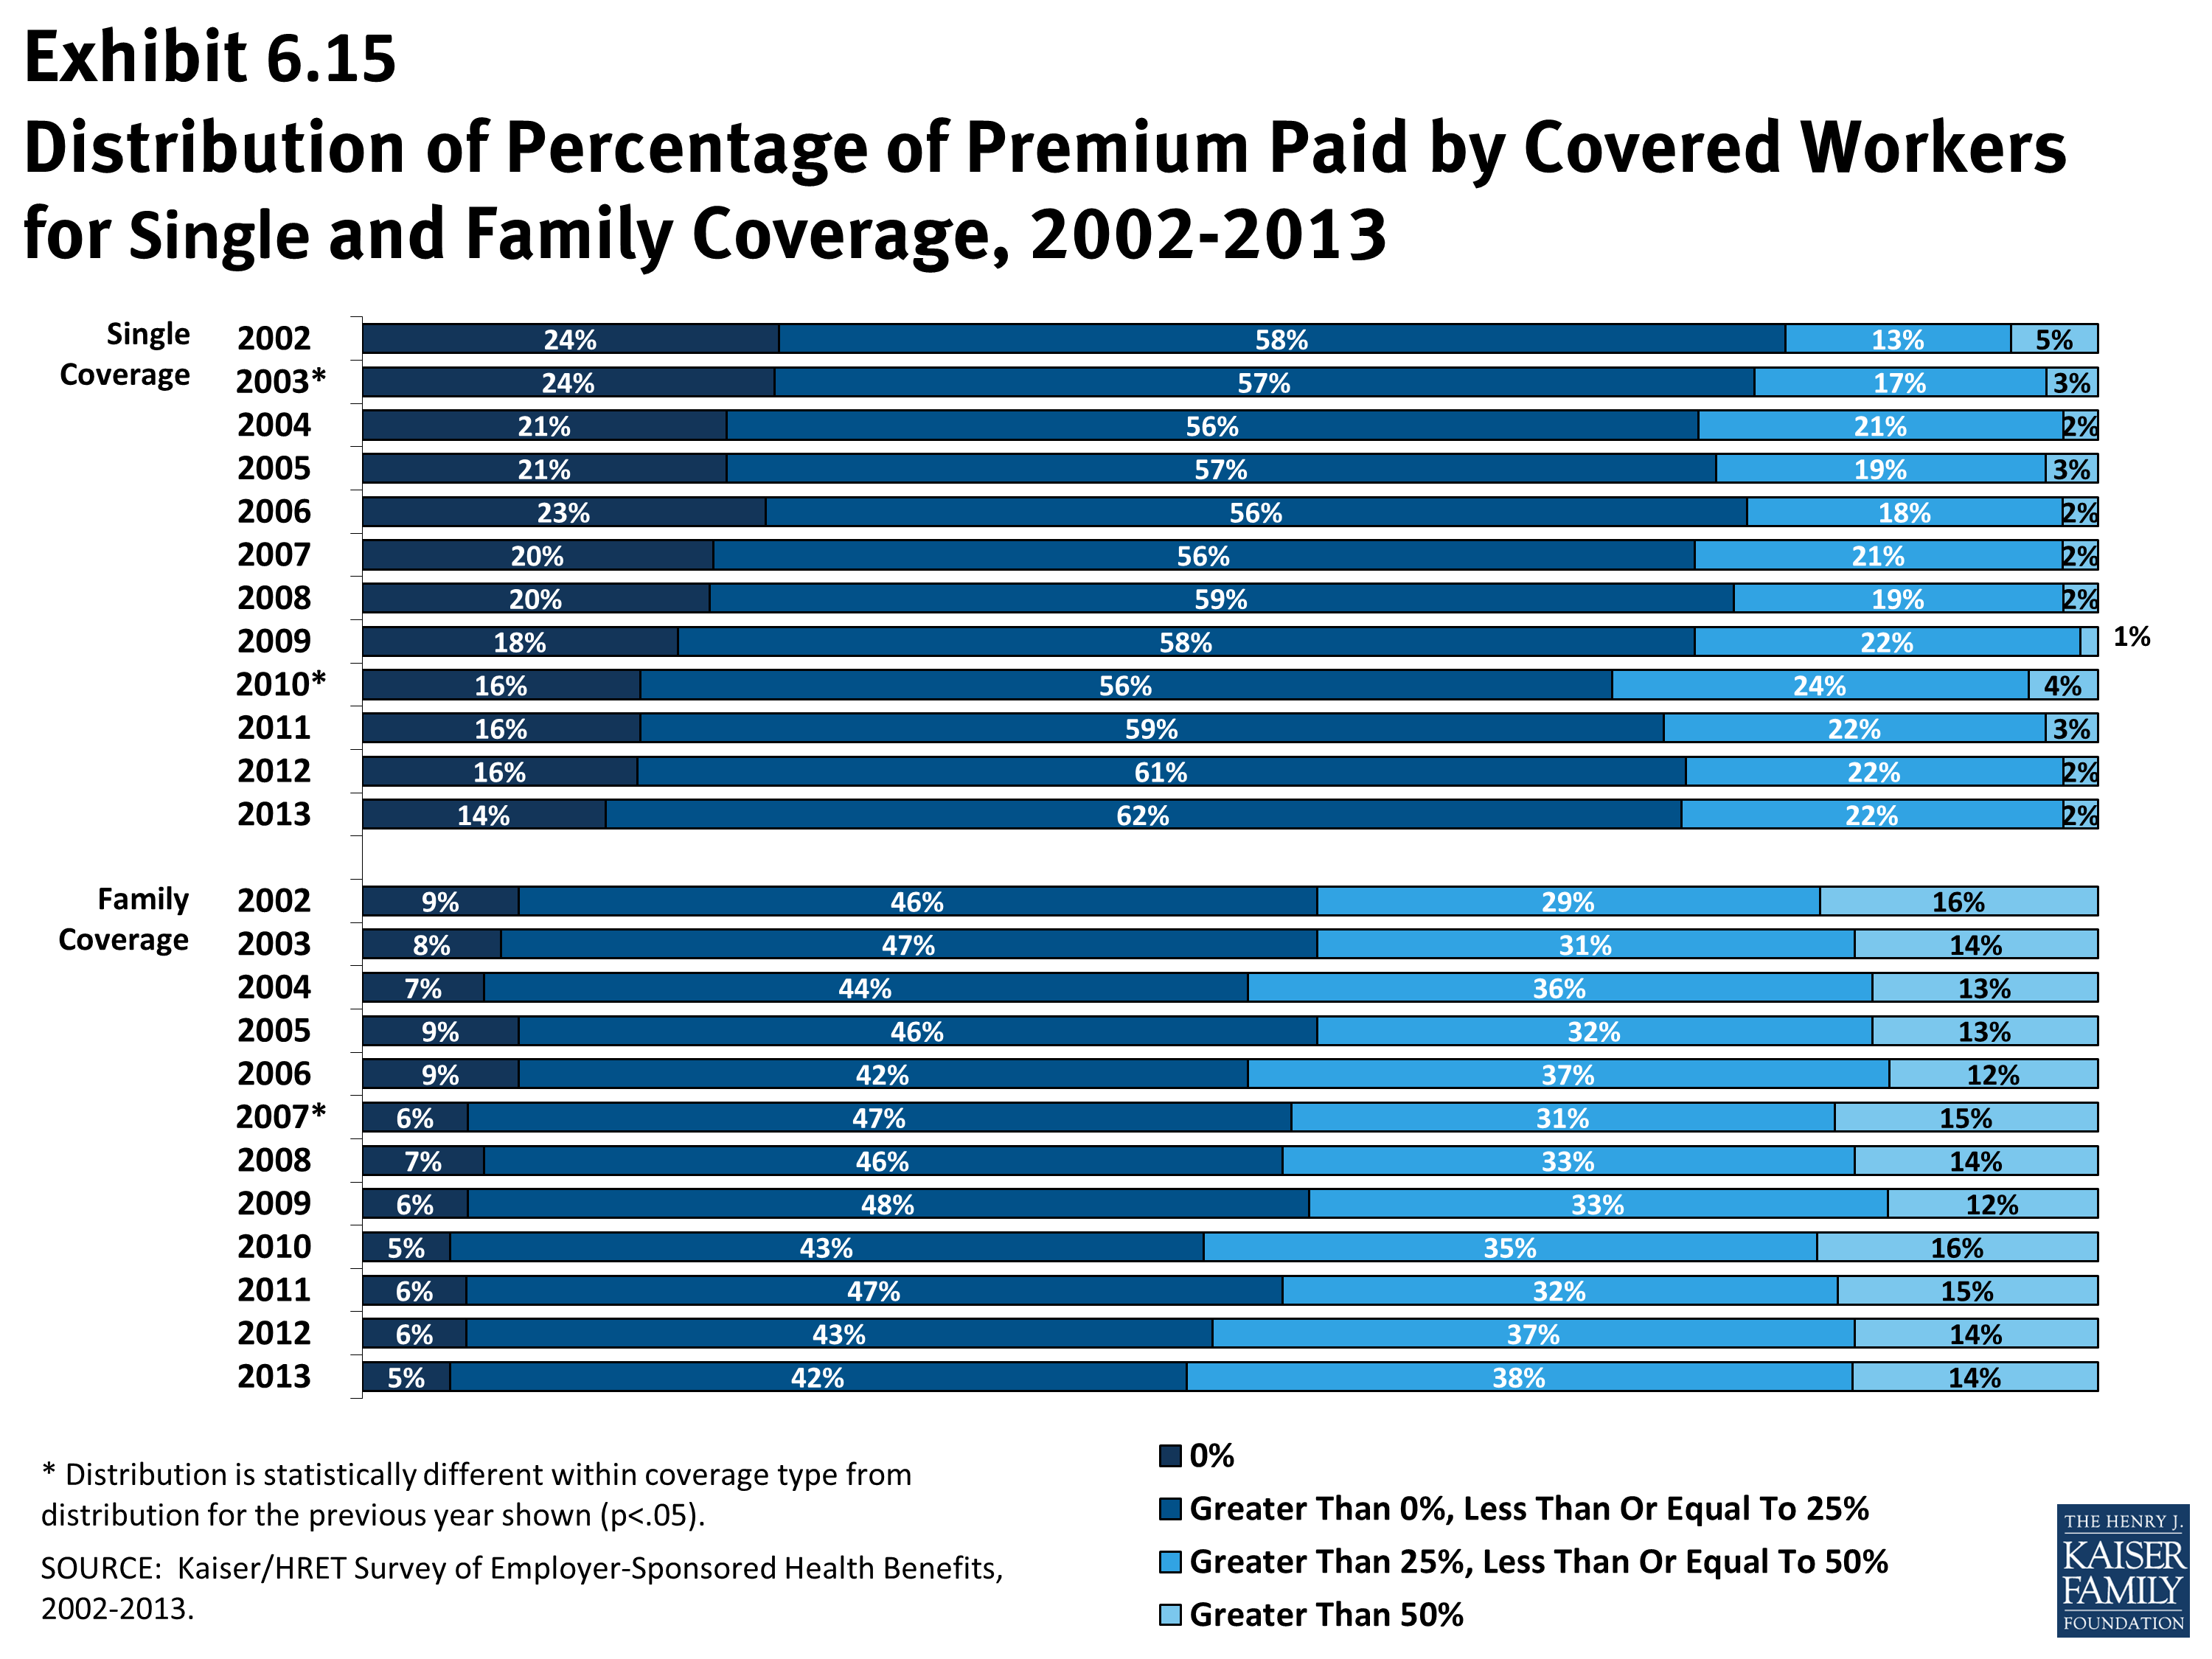
As with total premiums, the share of the premium contributed by workers varies considerably among firms. For single coverage, 62% of covered workers are in plans that require them to make a contribution of less than or equal to a quarter of the total premium, 2% are in plans that require a contribution of more than half of the premium, and 14% are in plans that require no contribution at all. For family coverage, 42% of covered workers are in plans that require them to make a contribution of less than or equal to a quarter of the total premium and 14% are in plans that require more than half of the premium, while only 5% are in plans that require no contribution at all for family coverage (Exhibit D).
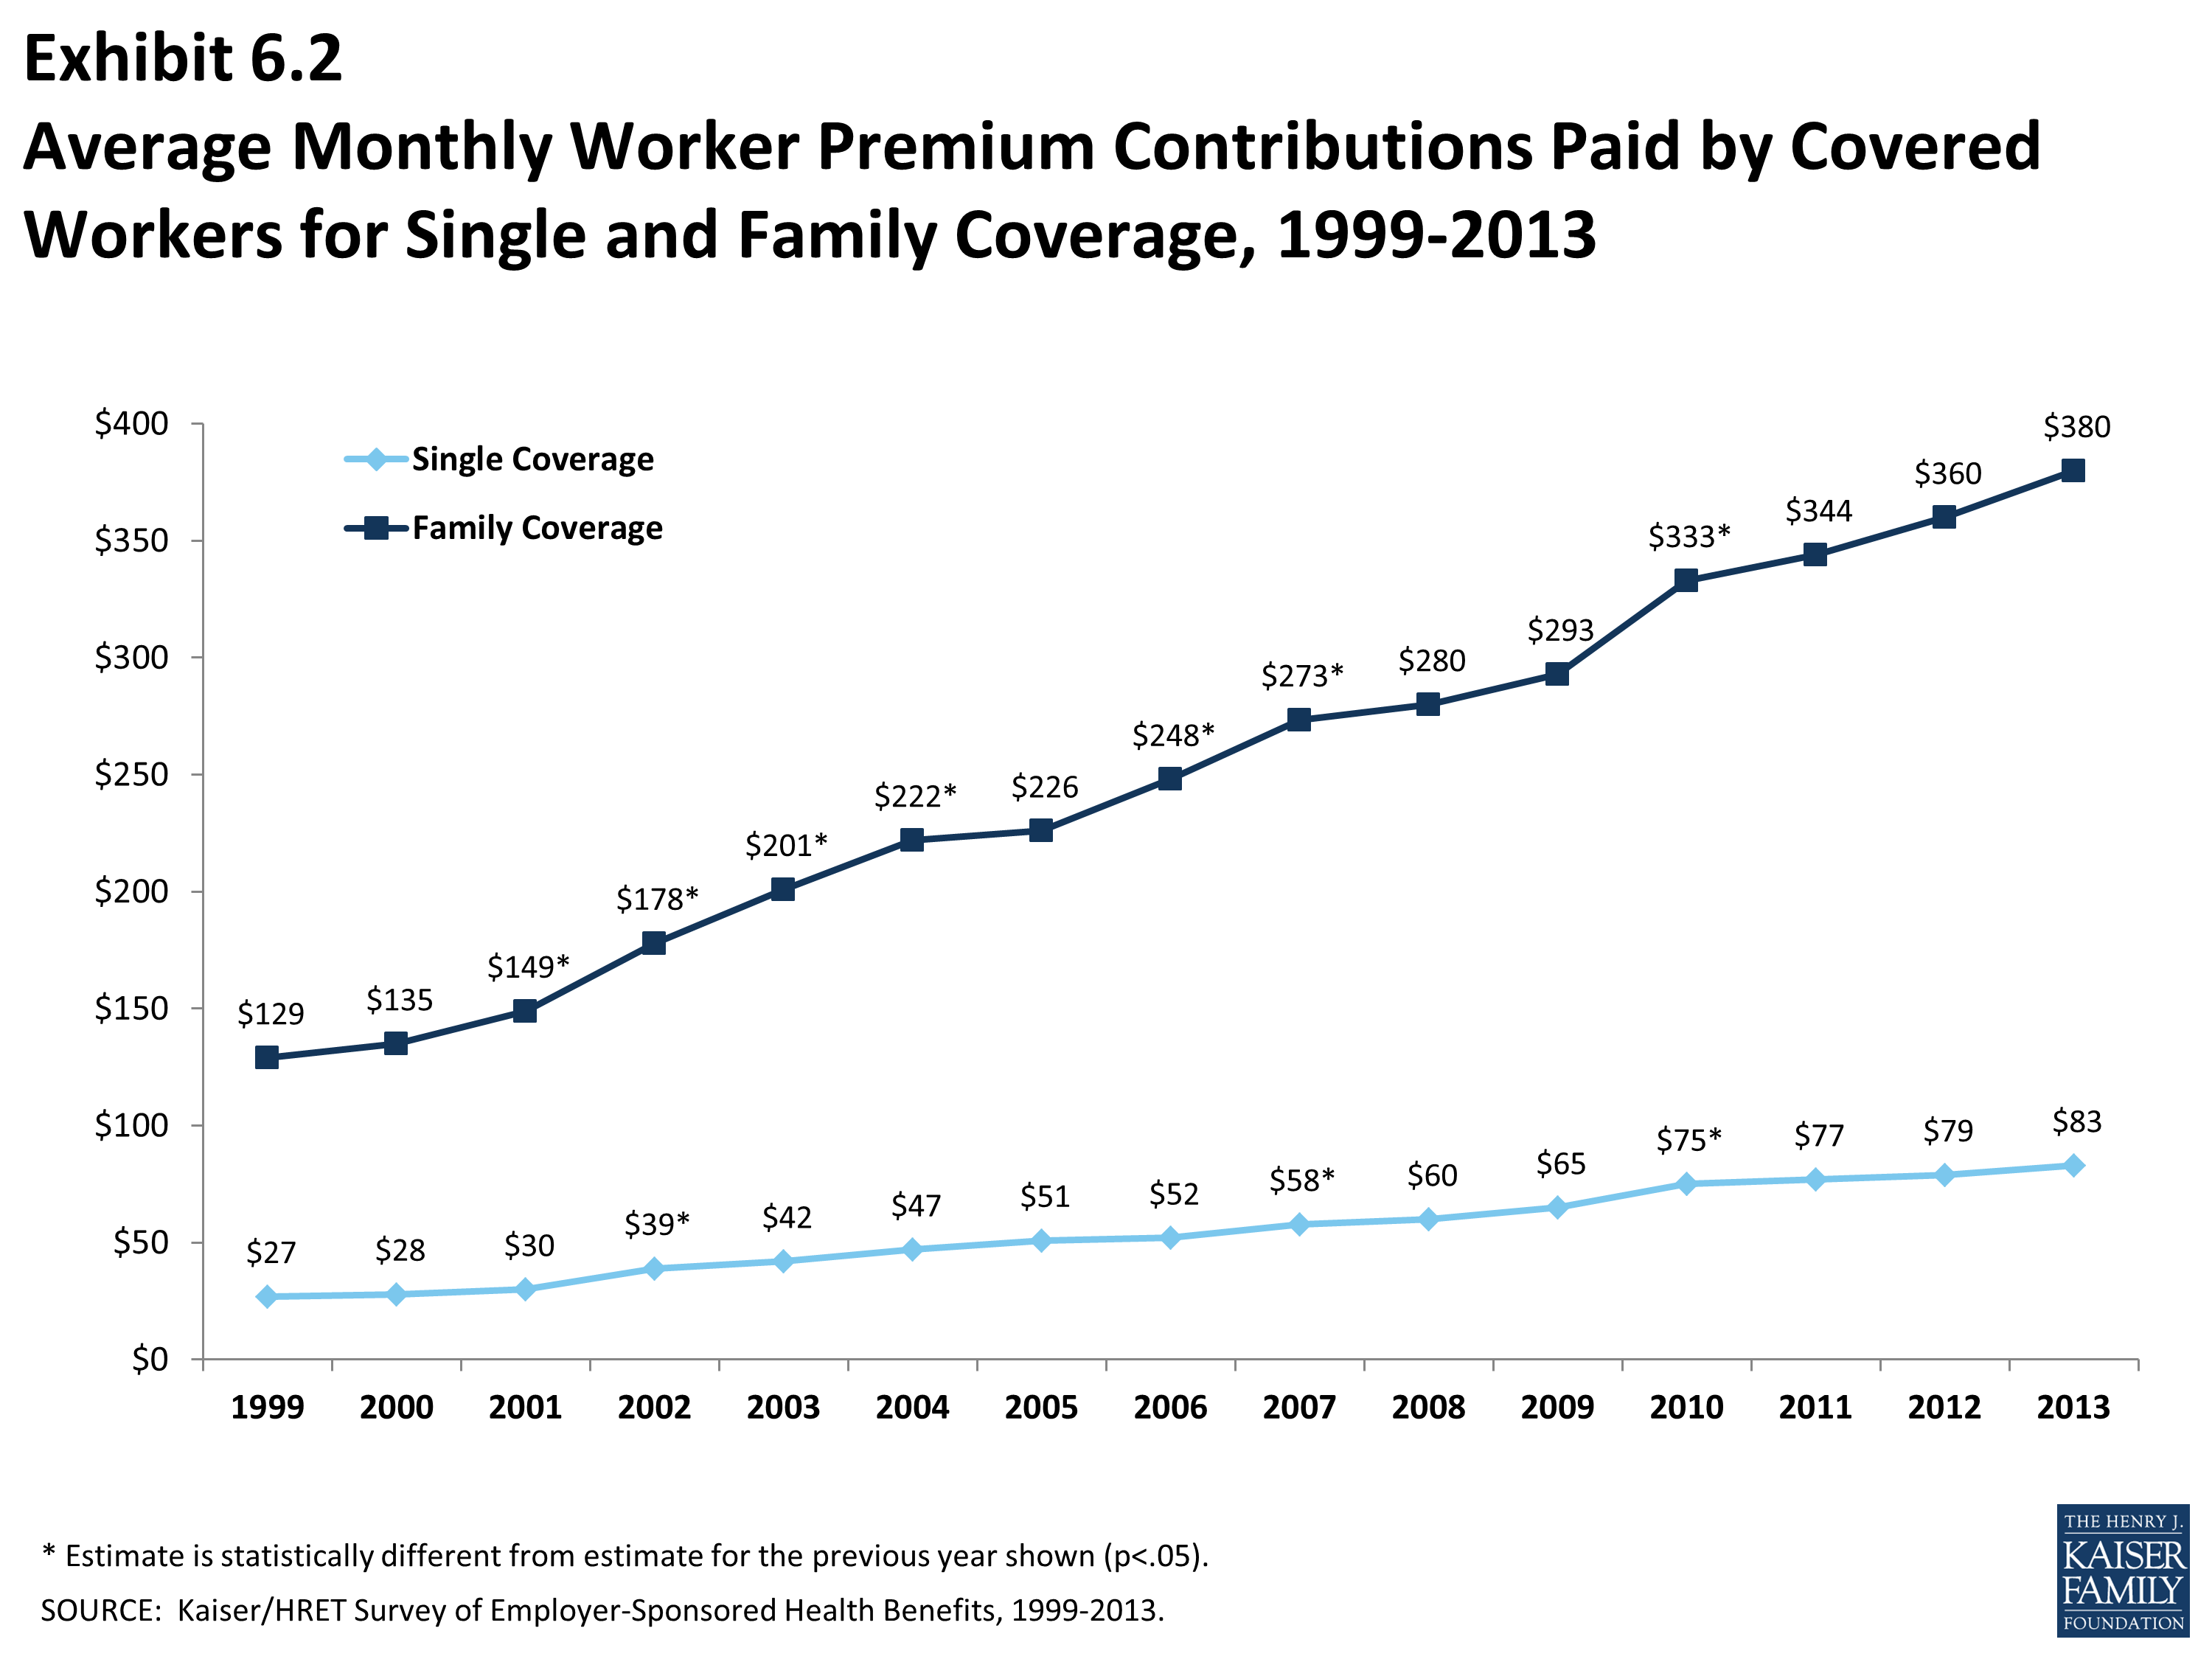
Looking at the dollar amounts that workers contribute, the average annual premium contributions in 2013 are $999 for single coverage and $4,565 for family coverage. Neither amount is a statistically significant increase over the 2012 values ($951 and $4,316, respectively). Covered workers’ average dollar contribution to family coverage has increased 89% since 2003 and 36% since 2008 (Exhibit A). Workers in small firms (3 – 199 workers) have lower average contributions for single coverage than workers in larger firms ($862 vs. $1,065), but higher average contributions for family coverage ($5,284 vs. $4,226). Workers in firms with a higher percentage of lower-wage workers (at least 35% of workers earn $23,000 or less) have higher average contributions for single coverage ($1,234 vs. $979) and for family coverage ($5,818 vs. $4,455) than workers in firms with lower percentages of lower-wage workers.
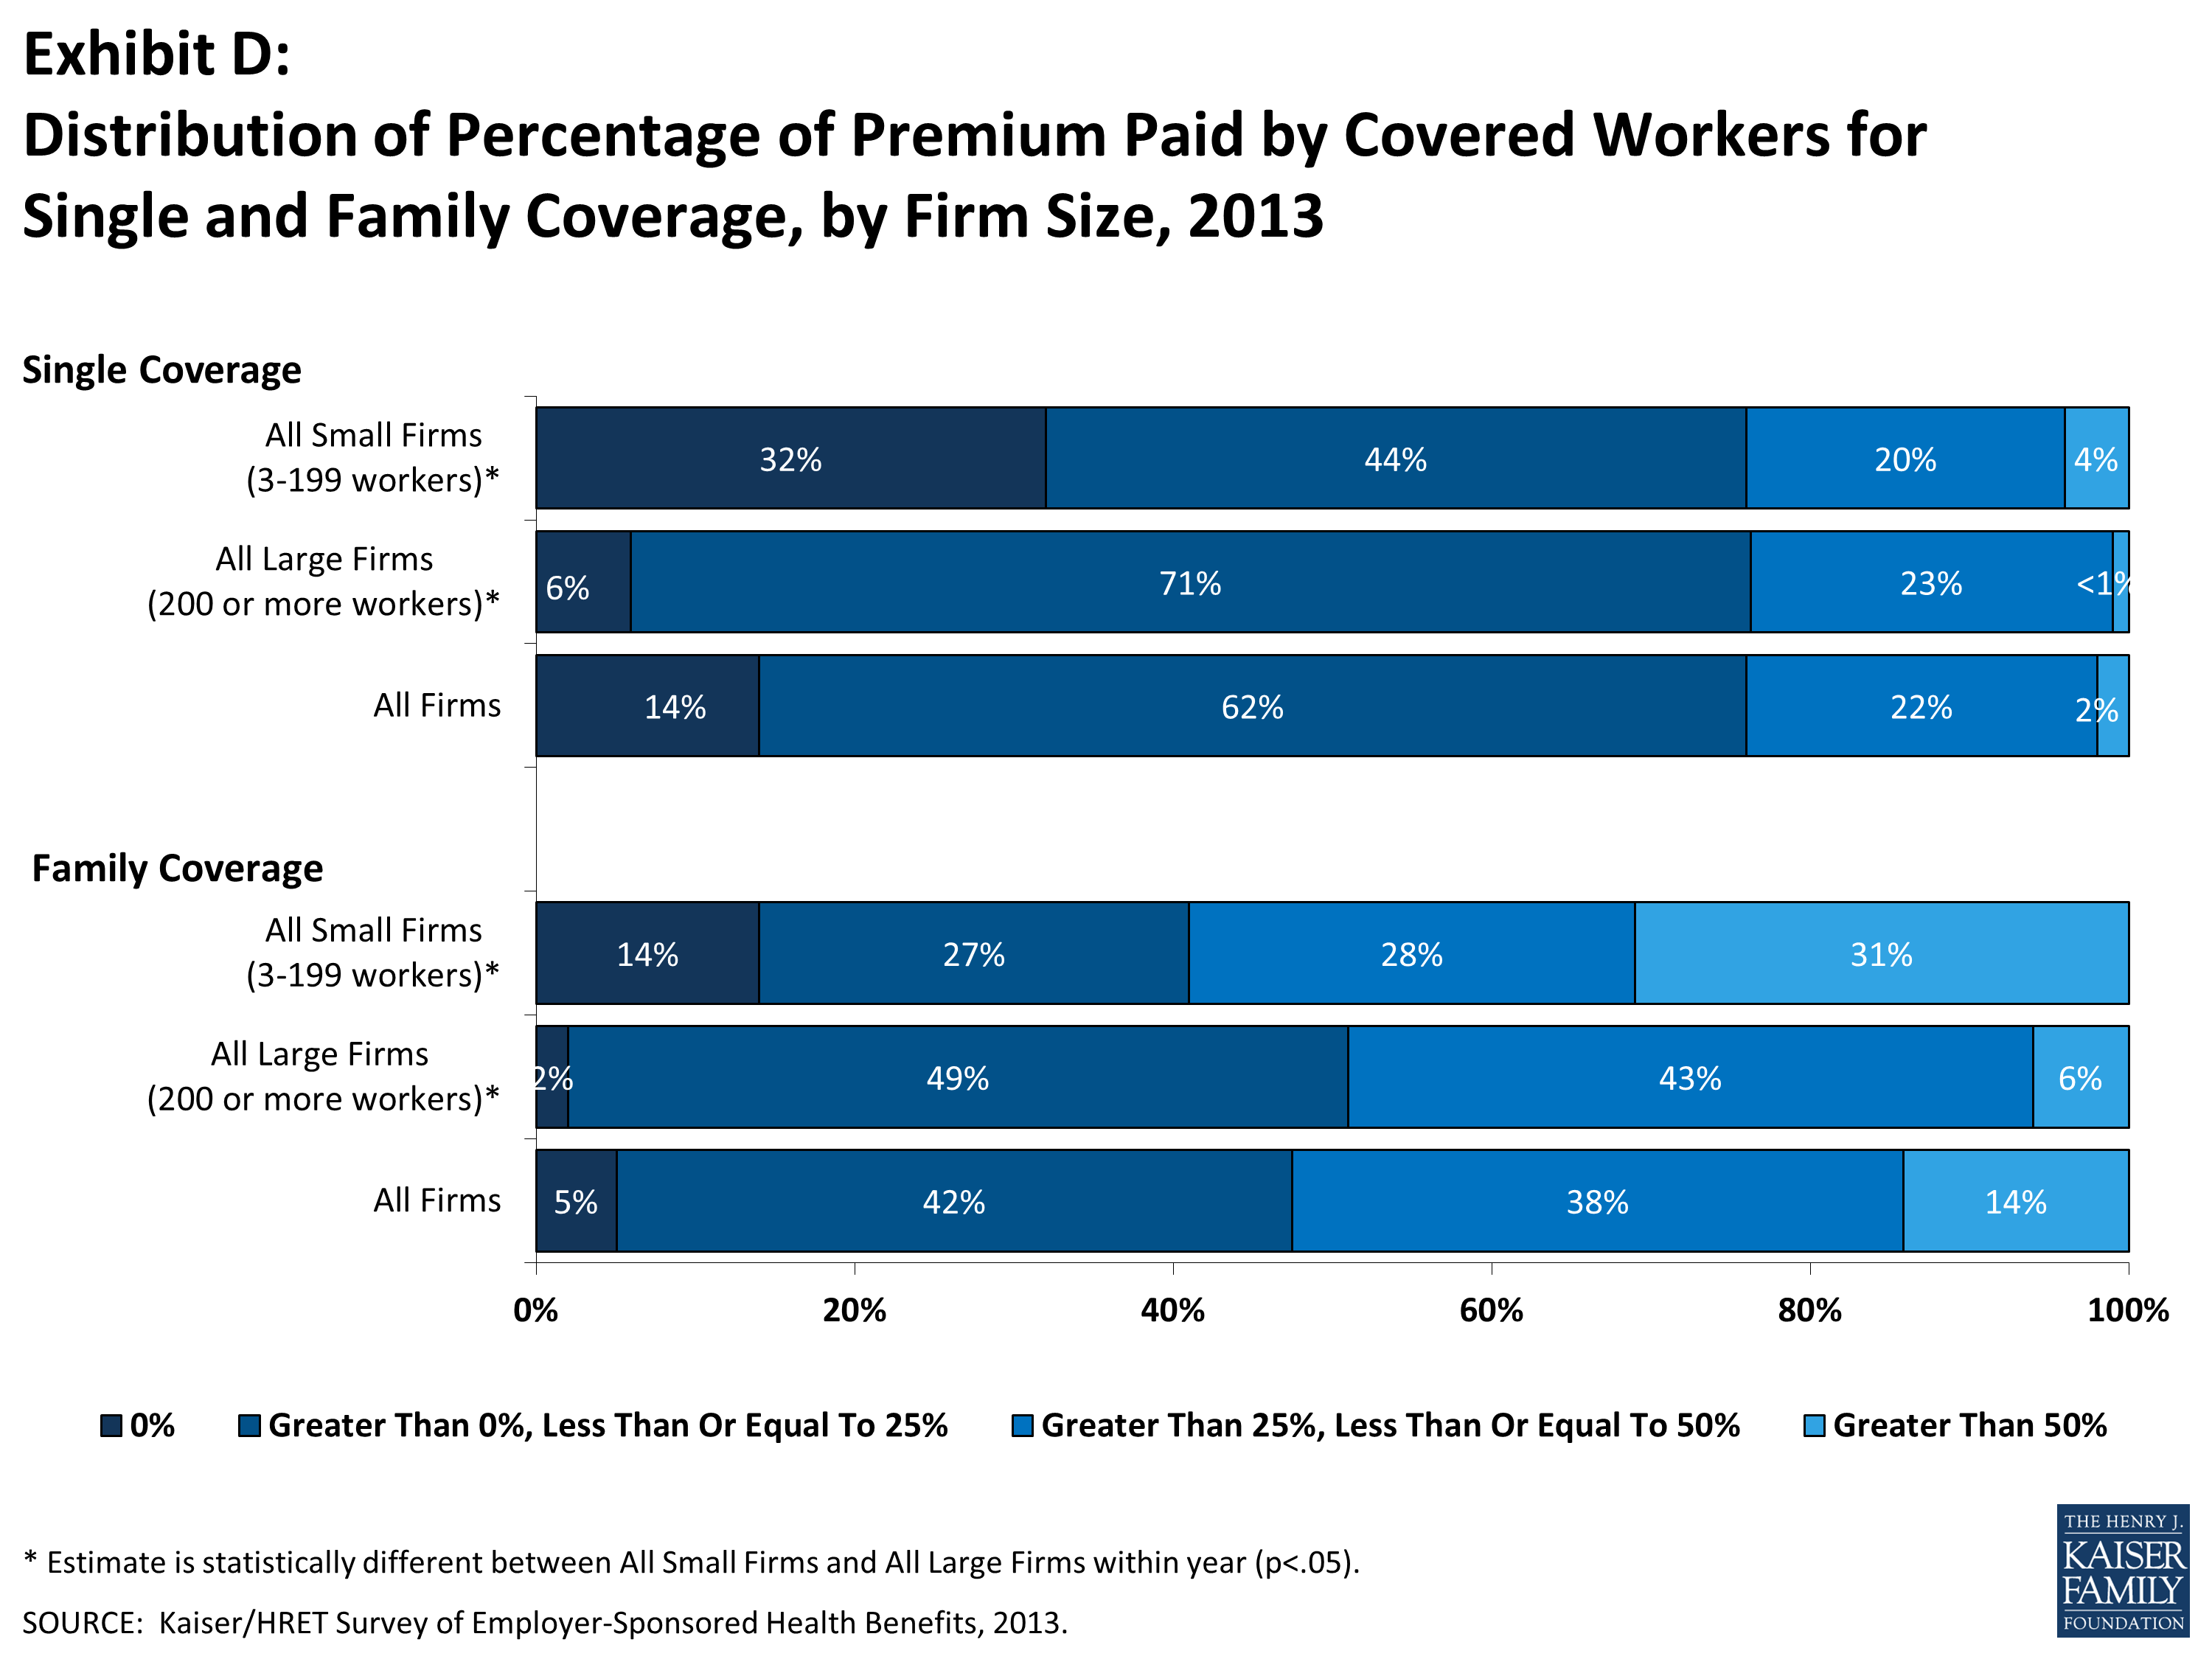
Exhibit D
PLAN ENROLLMENT
PPO plans remain the most common plan type, enrolling 57% of covered workers in 2013. Twenty percent of covered workers are enrolled in an HDHP/SO, 14% in an HMO, 9% in a POS plan, and less than 1% in a conventional plan (Exhibit E). Enrollment in HDHP/SOs increased significantly between 2009 and 2011, from 8% to 17% of covered workers, but has plateaued since then (Exhibit E). Enrollment distribution varies by firm size, for example, PPOs are relatively more popular for covered workers at large firms (200 or more workers) than smaller firms (62% vs. 47%) and POS plans are relatively more popular among smaller firms than large firms (16% vs. 5%).
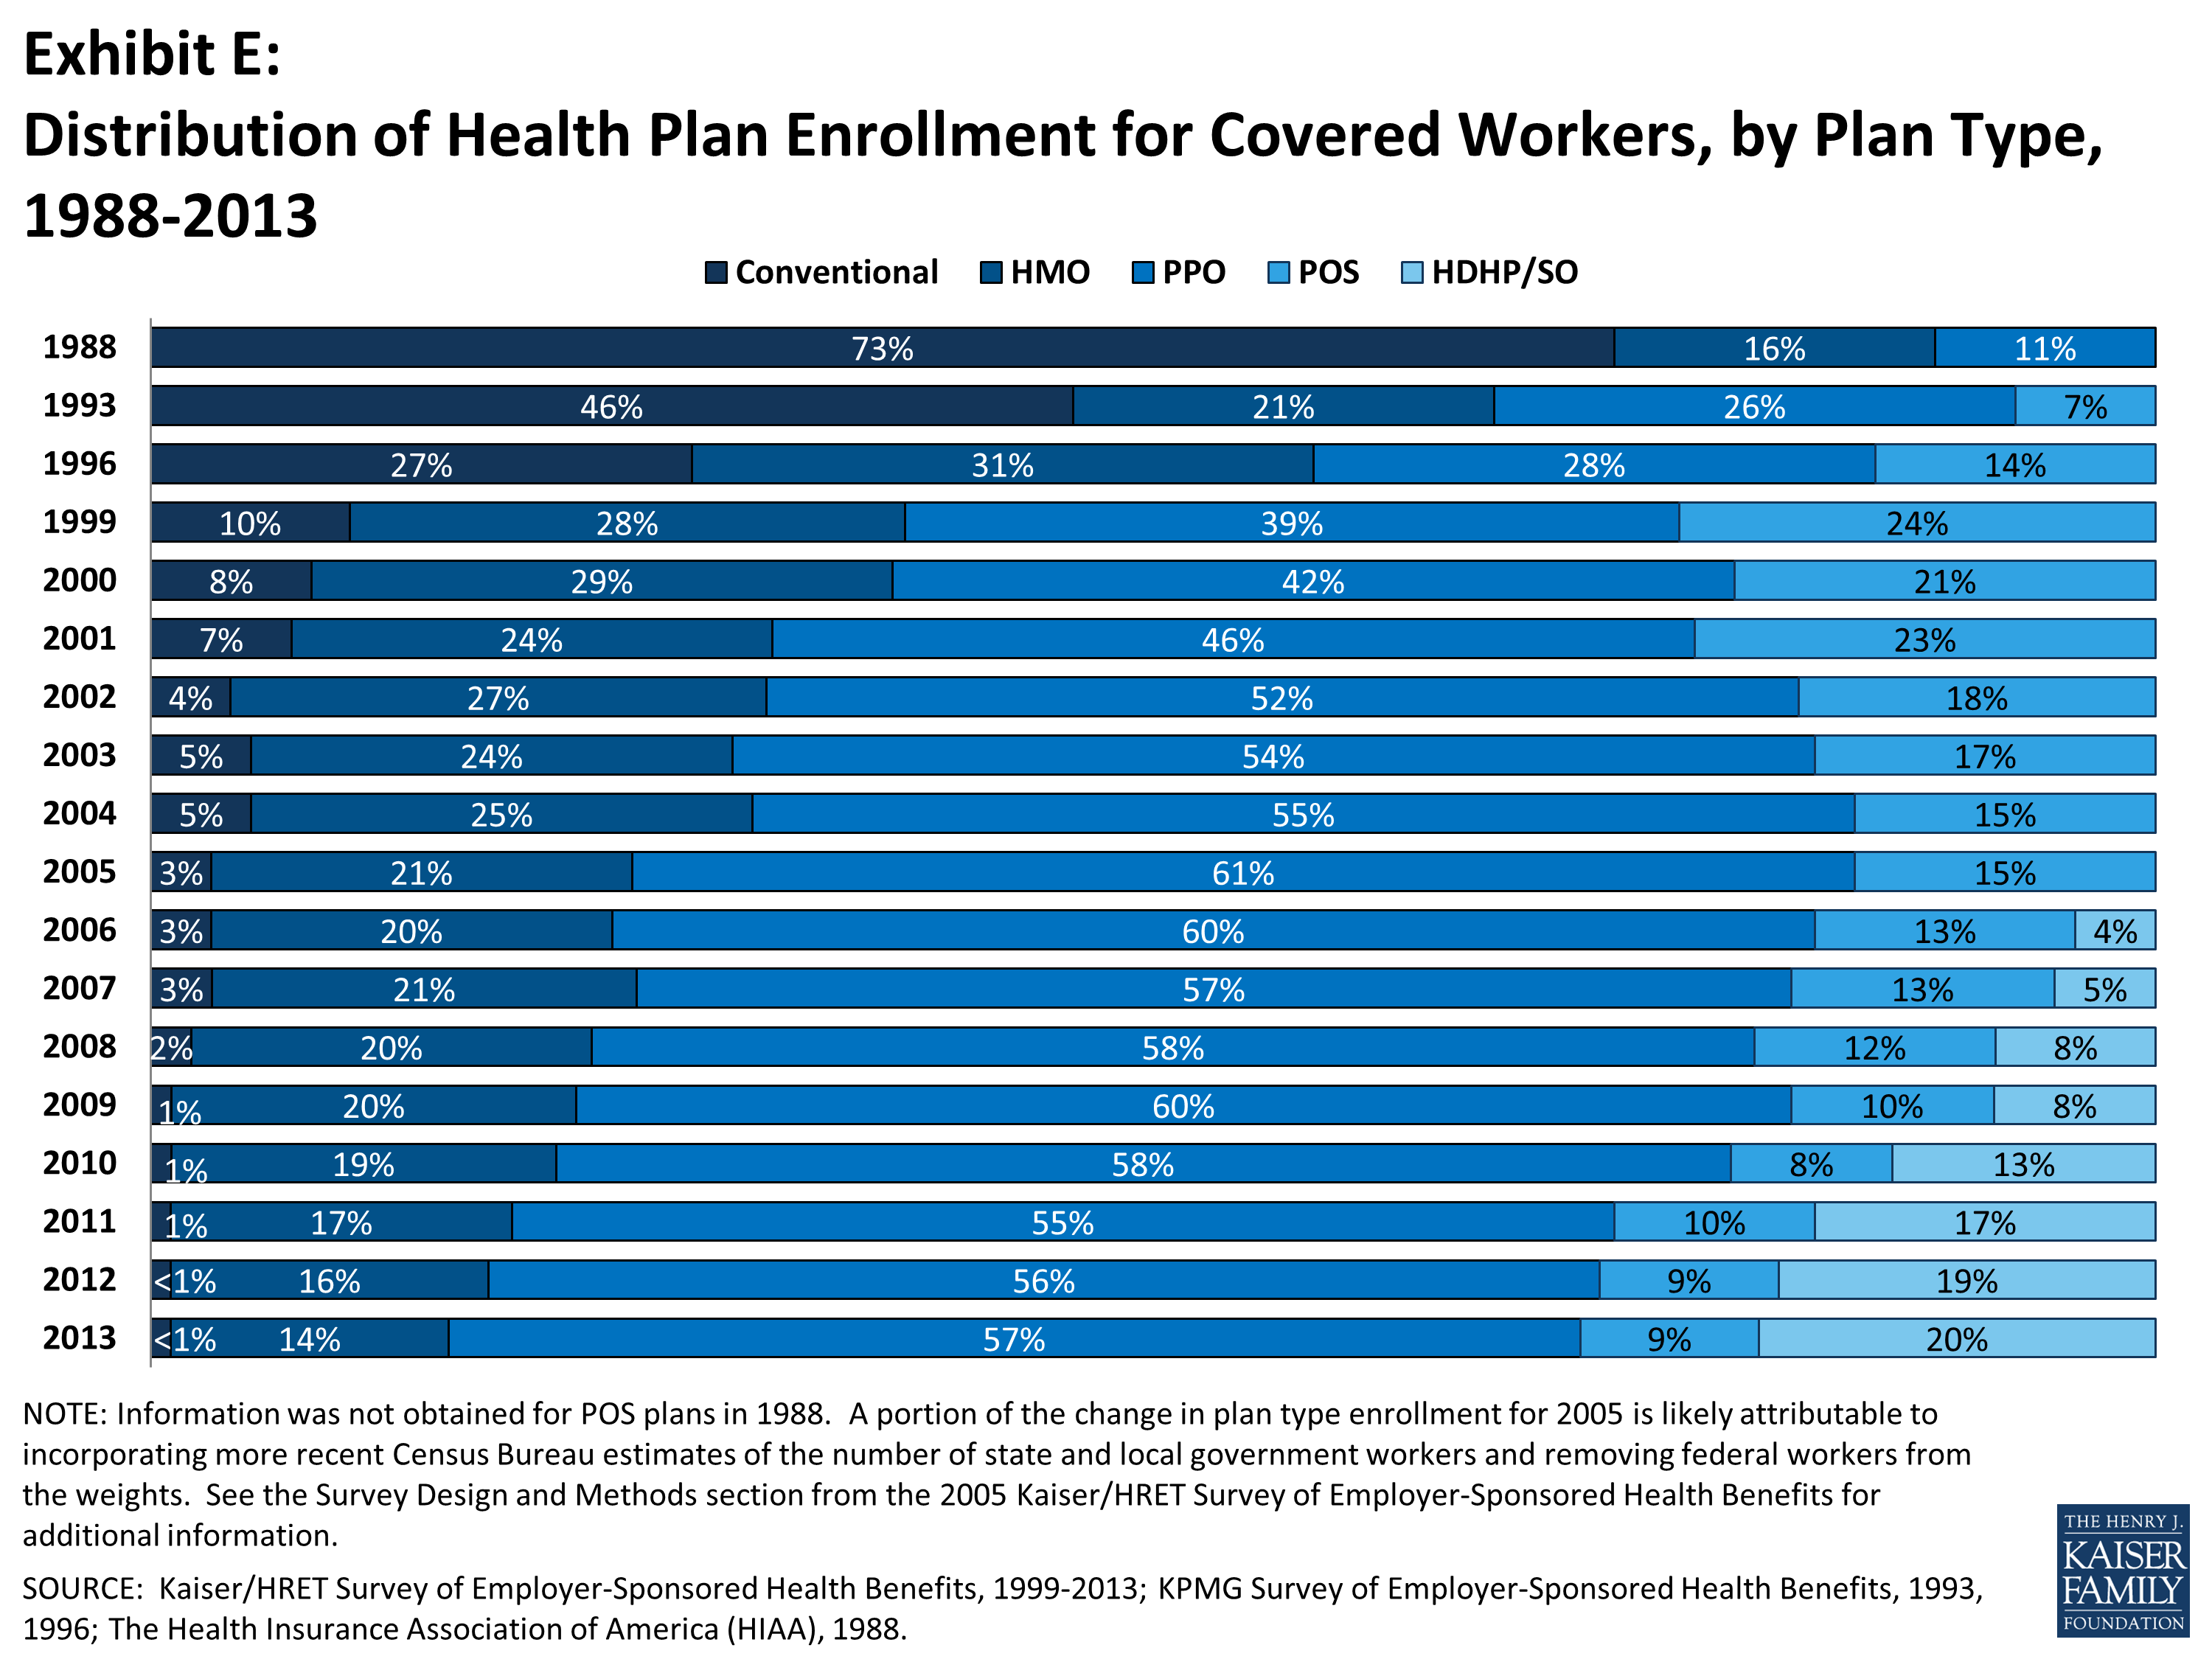
Exhibit E
EMPLOYEE COST SHARING
Most covered workers face additional plan costs when they use health care services. Seventy-eight percent of covered workers have a general annual deductible for single coverage that must be met before most services are reimbursed by the plan. Even workers without a general annual deductible often face other types of cost sharing when they use services, such as copayments or coinsurance for office visits and hospitalizations.
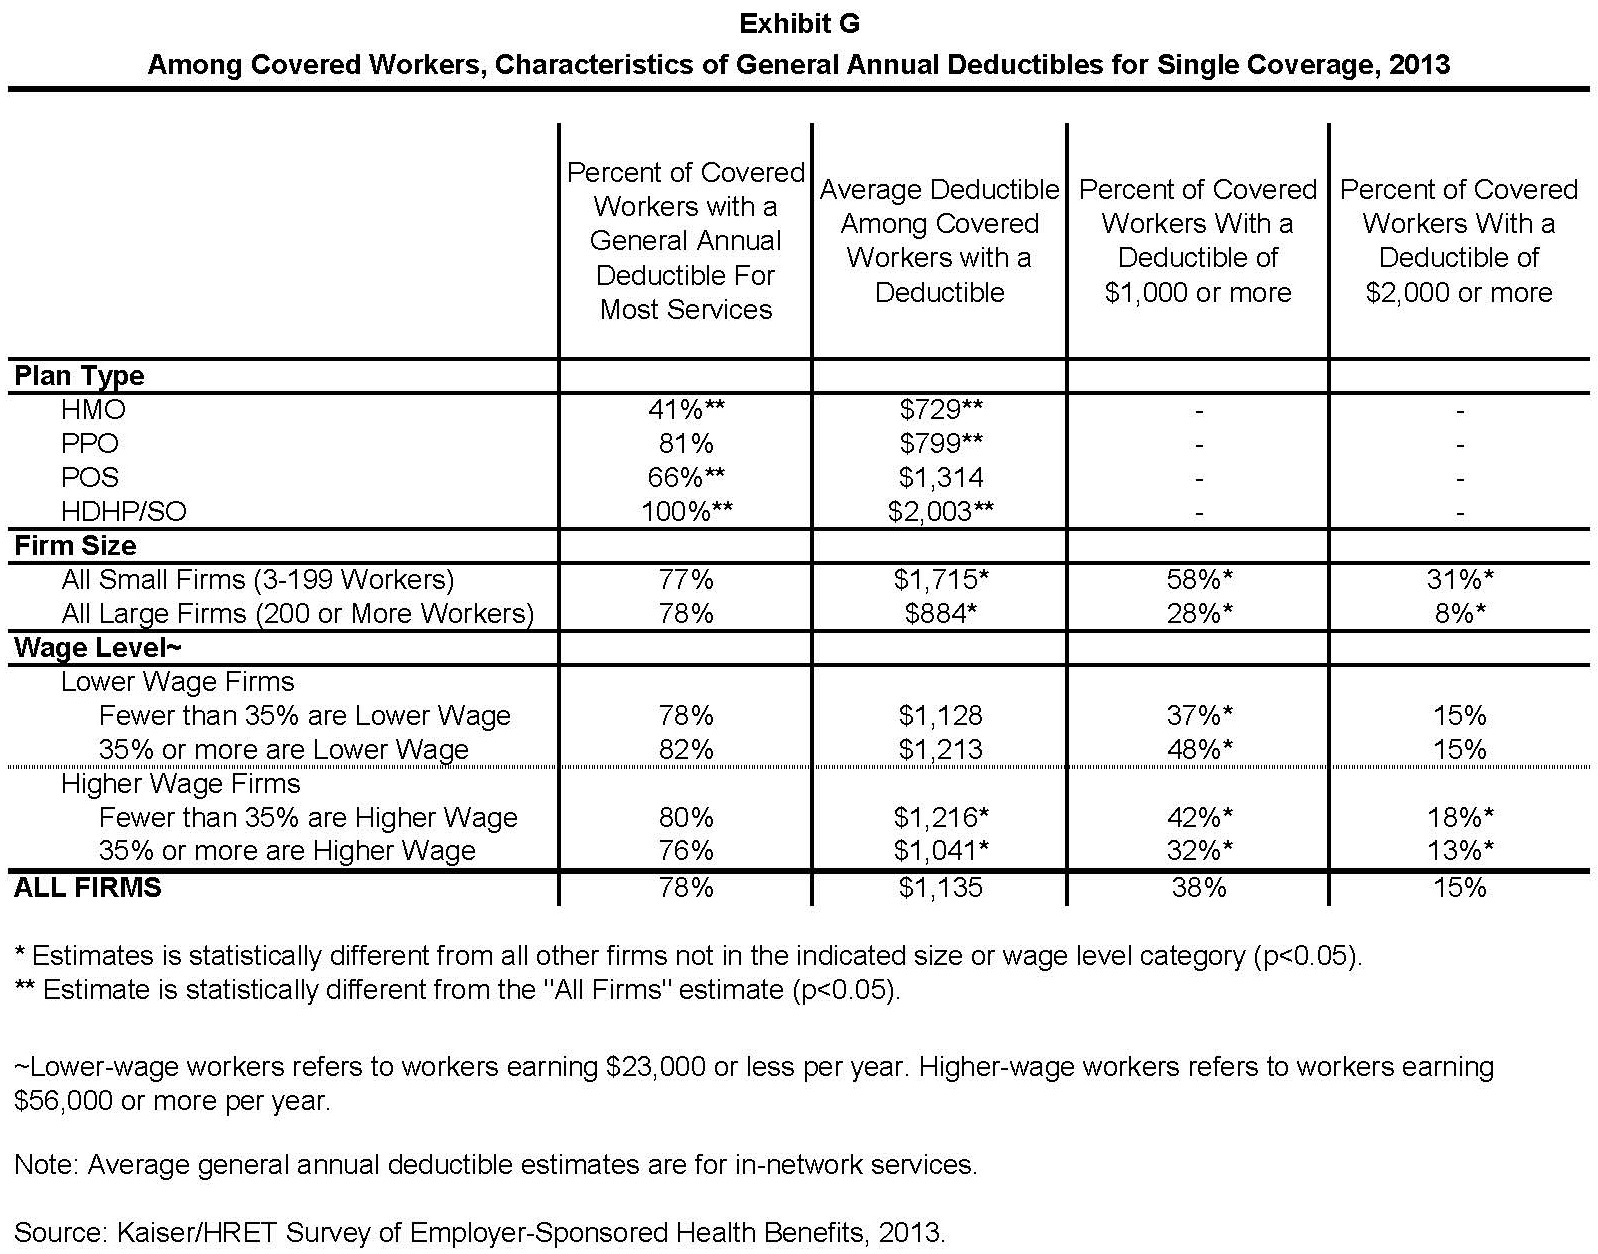
Among covered workers with a general annual deductible, the average deductible amount for single coverage is $1,135. The average annual deductible is unchanged from 2012 ($1,097), but has increased from $735 dollars in 2008. Deductibles differ by firm size: for workers in plans with a deductible, the average deductible for single coverage is $1,715 in small firms (3-199 workers), compared to $884 for workers in larger firms (Exhibit G). Among all covered workers, 58% in small firms (3-199 workers) and 28% in larger firms are in a plan with a deductible of at least $1,000 for single coverage (Exhibit F). The percentage of covered workers at small firms (3-199 workers) with a deductible of a $1,000 or more increased significantly in 2013 from 49% in 2012.
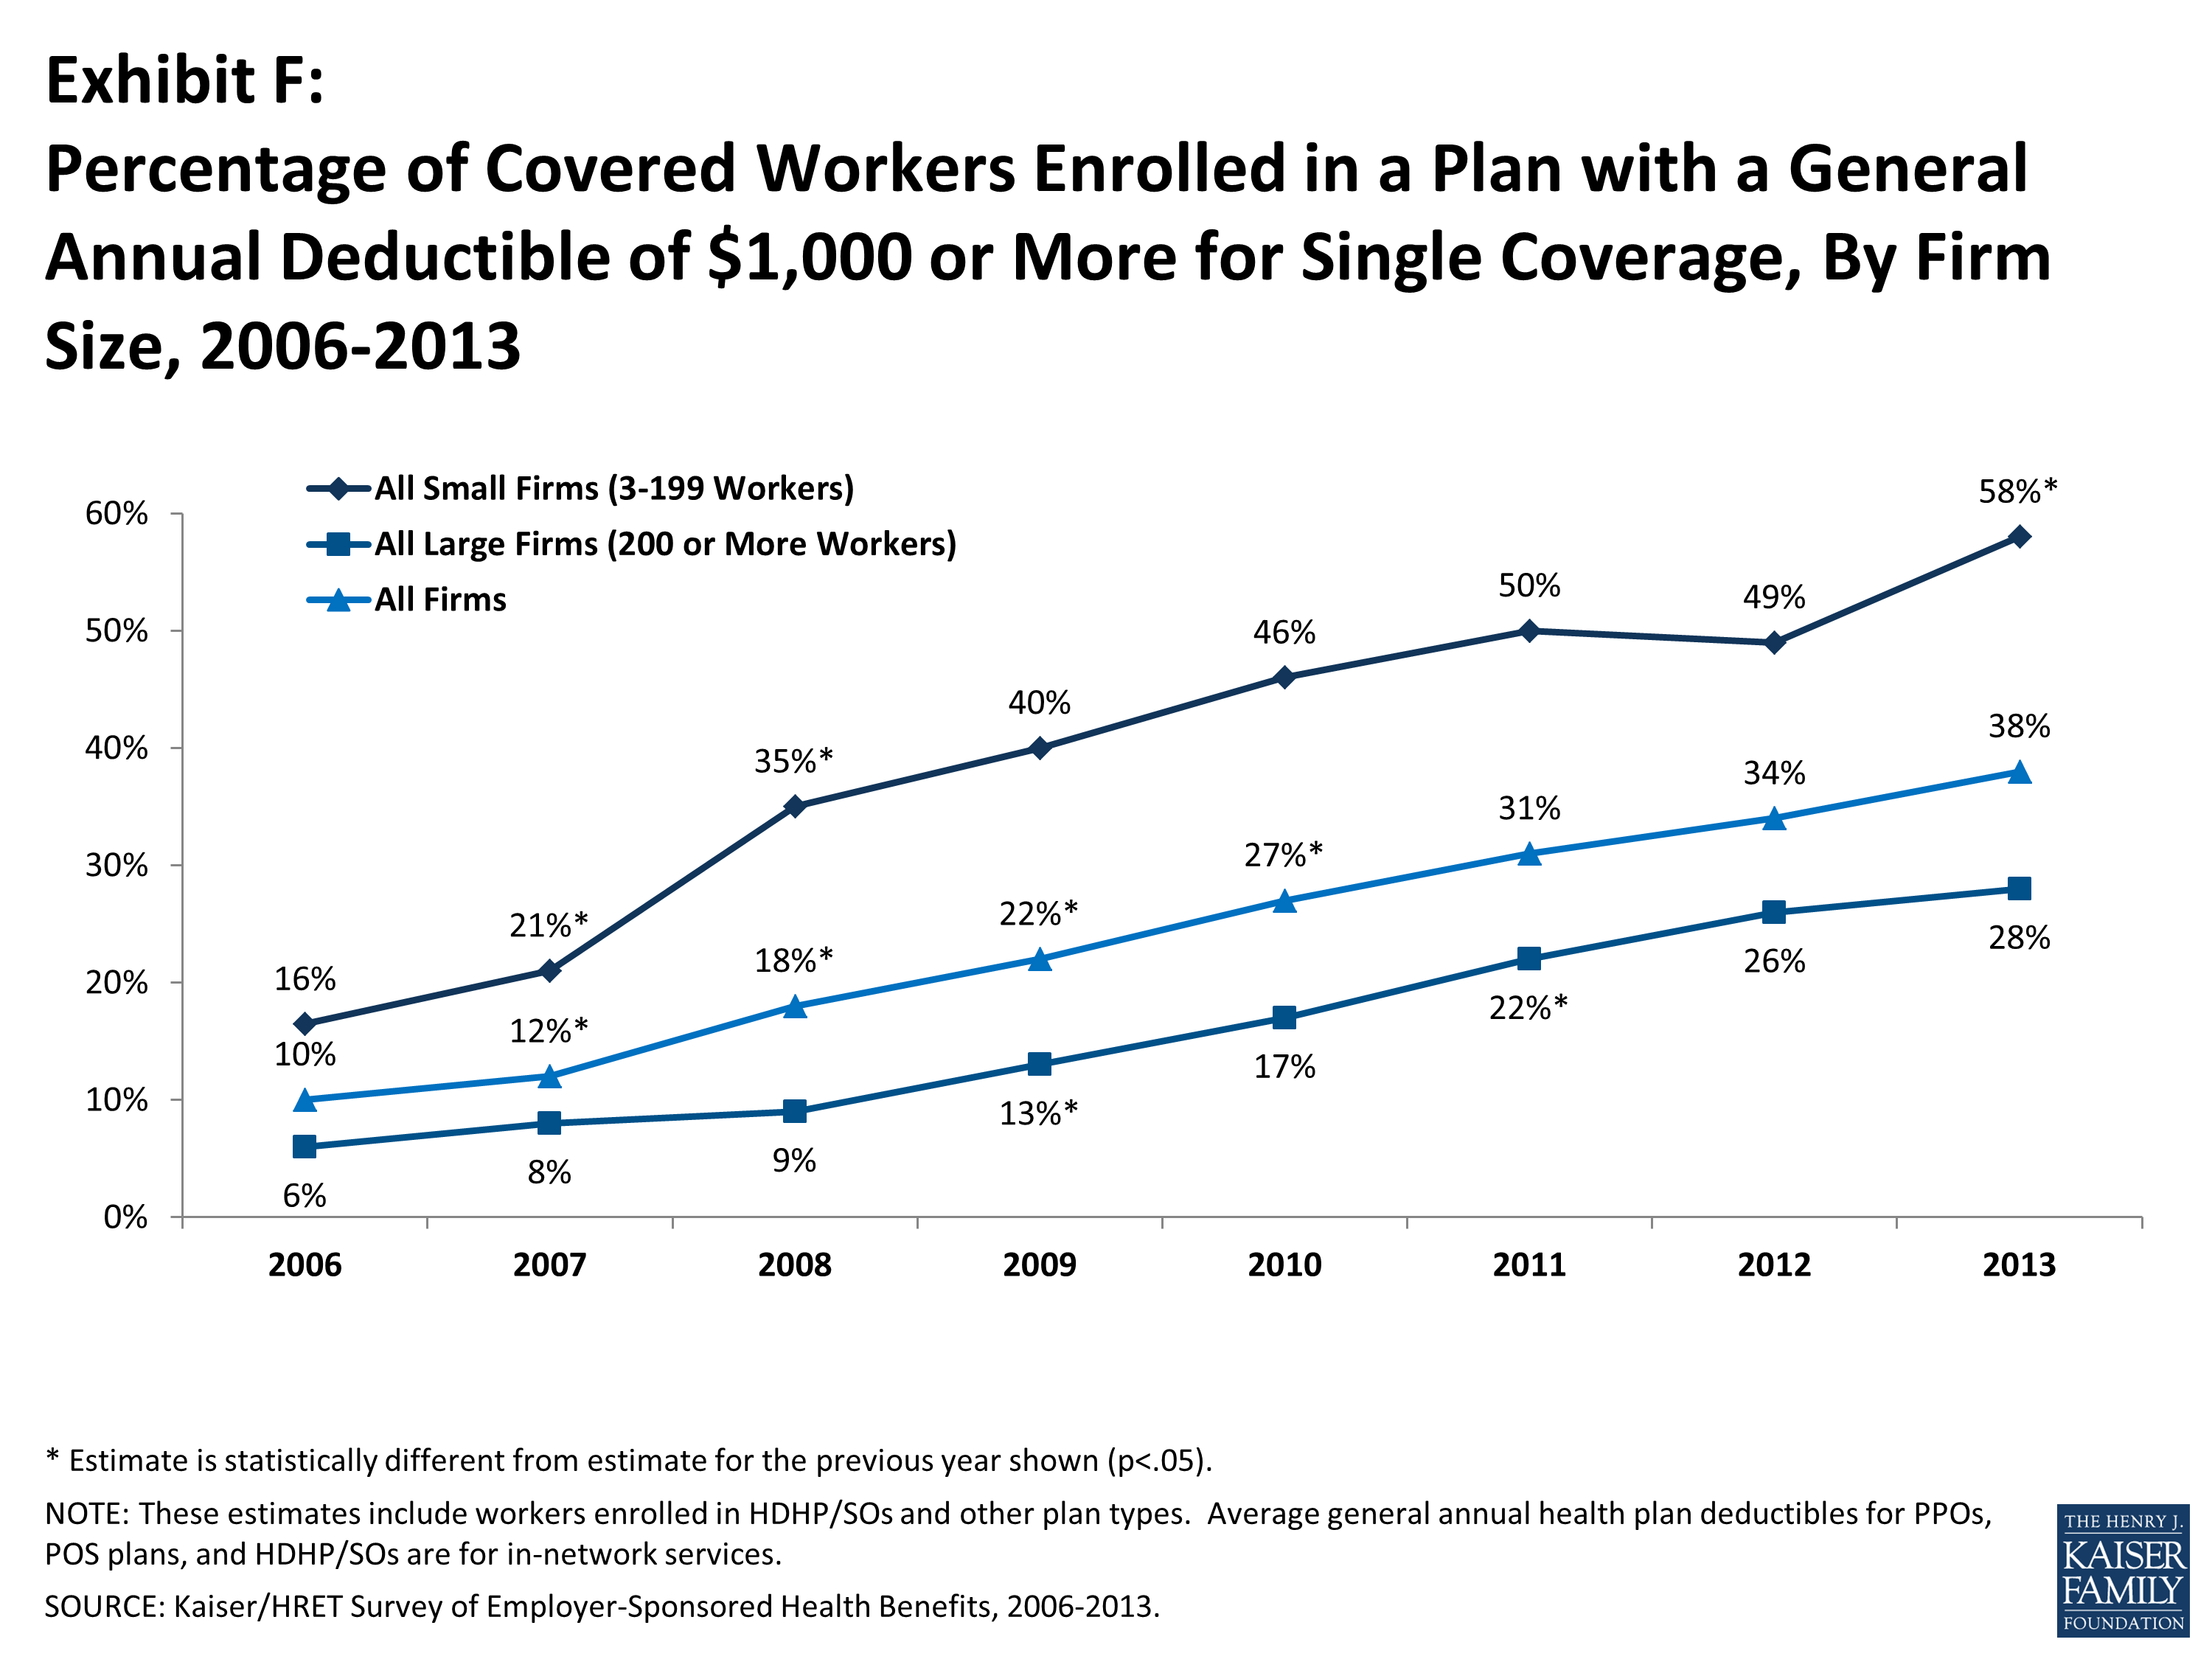
Exhibit F
The large majority of workers also have to pay a portion of the cost of physician office visits. Almost three-in-four covered workers pay a copayment (a fixed dollar amount) for office visits with a primary care physician (74%) or a specialist physician (72%), in addition to any general annual deductible their plan may have. Smaller shares of workers pay coinsurance (a percentage of the covered amount) for primary care office visits (20%) or specialty care visits (20%). For in-network office visits, covered workers with a copayment pay an average of $23 for primary care and $35 for specialty care. For covered workers with coinsurance, the average coinsurance for office visits is 18% for primary and for specialty care. While the survey collects information only on in-network cost sharing, it is generally understood that out-of-network cost sharing is higher.
The cost sharing that a person pays when they fill a prescription usually varies with the type of drug – for example whether it is a generic, brand-name or specialty drug – and whether the drug is considered preferred or not on the plan’s formulary. These factors result in each drug being assigned to a tier that represents a different level, or type, of cost sharing. Eighty-one percent of covered workers are in plans with three-or-more tiers of cost sharing. Copayments are the most common form of cost sharing for tiers one through three and coinsurance is the most common form of cost sharing for drugs on the fourth or higher tier of formularies. Among workers with three-or-more tier plans, the average copayments in these plans are $10 for first-tier drugs, $29 for second-tier drugs, $52 for third-tier drugs, and $80 for fourth-tier drugs – similar to the amounts reported last year. HDHP/SOs have a somewhat different cost-sharing pattern for prescription drugs than other plan types: just 61% of covered workers are enrolled in a plan with three-or-more tiers of cost sharing, while 12% are in plans that pay the full cost of prescriptions once the plan deductible is met, and 18% are in a plan with the same cost sharing for all prescription drugs.
Most workers also face additional cost sharing for a hospital admission or an outpatient surgery episode. After any general annual deductible is met, 61% of covered workers have a coinsurance and 16% have a copayment for hospital admissions. Lower percentages have per day (per diem) payments (7%), a separate hospital deductible (3%), or both copayments and coinsurance (8%). The average coinsurance rate for hospital admissions is 18%, the average copayment is $278 per hospital admission, the average per diem charge is $264, and the average separate annual hospital deductible is $436. The cost-sharing provisions for outpatient surgery are similar to those for hospital admissions, as most covered workers have either coinsurance (62%) or copayments (18%). For covered workers with cost sharing for each outpatient surgery episode, the average coinsurance is 18% and the average copayment is $140.
Most plans limit the amount of cost sharing workers must pay each year, generally referred to as an out-of-pocket maximum. Eighty-eight percent of covered workers have an out-of-pocket maximum for single coverage, but the actual dollar limits differ considerably. For example, among covered workers in plans that have an out-of-pocket maximum for single coverage, 43% are in plans with an annual out-of-pocket maximum of $3,000 or more, and 15% are in plans with an out-of-pocket maximum of less than $1,500. Even in plans with a specified out-of-pocket limit, not all spending is counted towards meeting the limit. For example, among workers in PPOs with an out-of-pocket maximum, 76% are in plans that do not count towards physician office visit copayments, 34% are in plans that do not count towards spending on the general annual deductible, and 84% are in plans that do not count towards prescription drug spending when determining if an enrollee has reached the out-of-pocket limit. The ACA will require that all non-grandfathered plans have an out-of-pocket maximum that counts all cost sharing towards the limit.
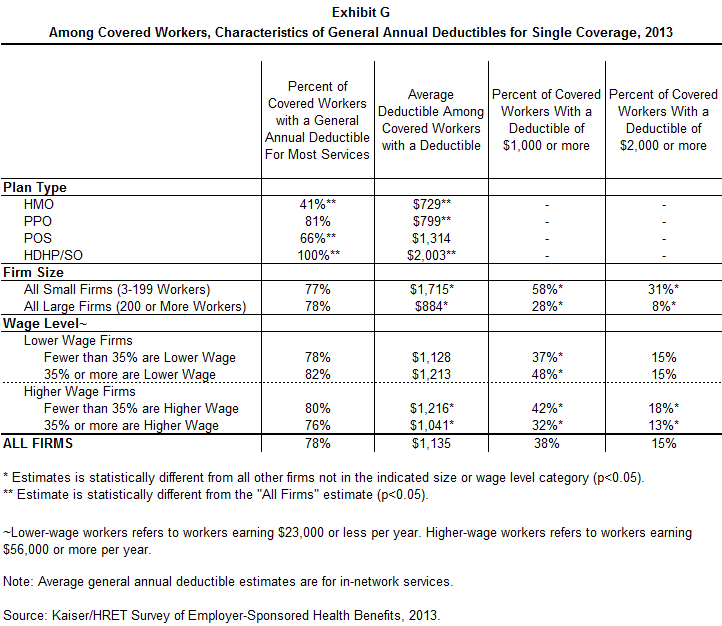
Exhibit G
AVAILABILITY OF EMPLOYER-SPONSORED COVERAGE
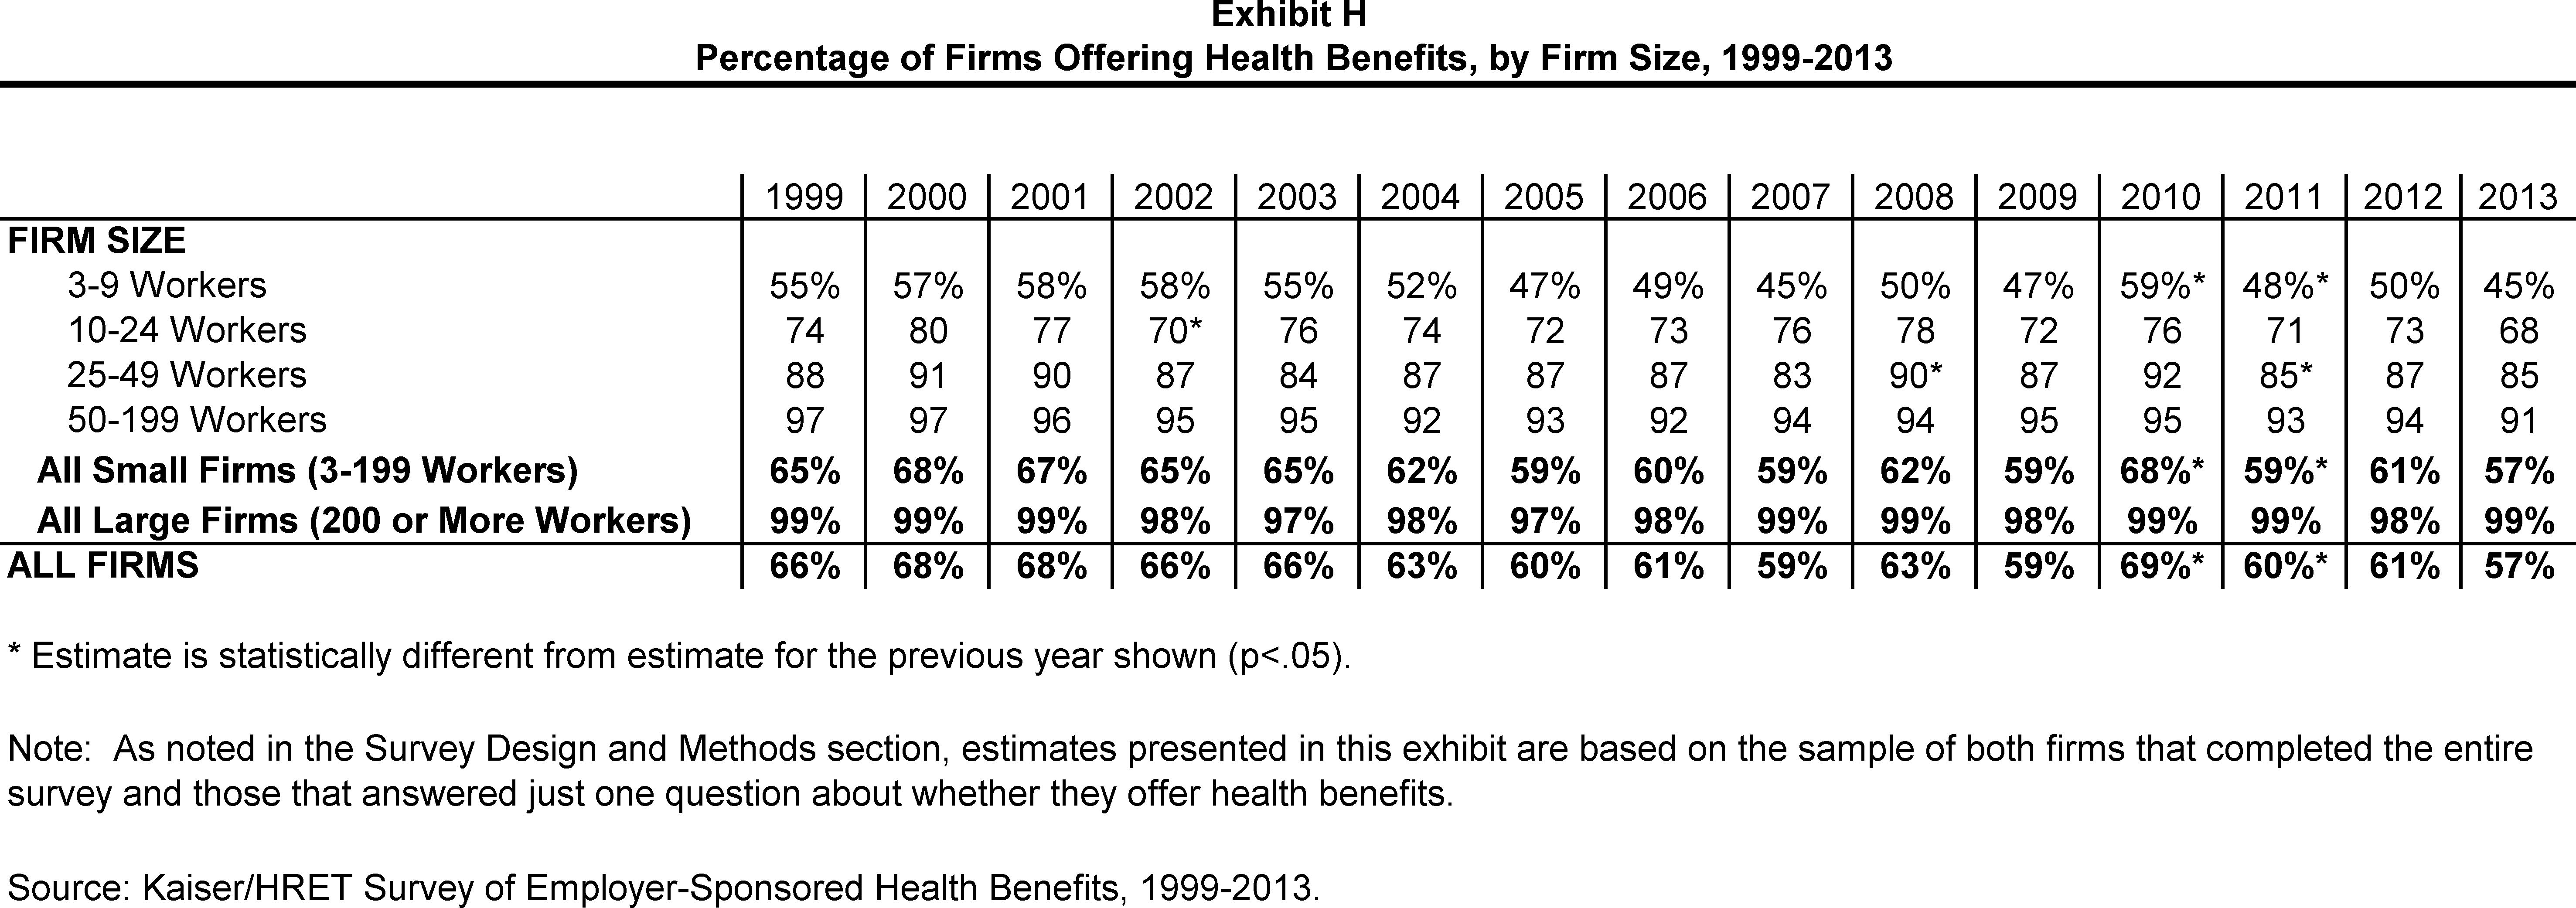
Fifty-seven percent of firms offer health benefits to their workers, statistically unchanged from the percentage that offered last year (61%) (Exhibit H). The offer rate is similar between 2012 and 2013 for both small firms (3 – 199 workers) and larger firms. The likelihood of offering health benefits differs significantly by size of firm, with only 45% of employers with 3 to 9 workers offering coverage, but virtually all employers with 1,000 or more workers offering coverage to at least some of their employees. Ninety percent of workers are in a firm that offers health benefits to at least some of its employees, similar to 2012 (92%). Offer rates also differ by other firm characteristics; 59% of firms with fewer younger workers (less than 35% of the workers are age 26 or younger) offer health benefits compared to 23% of firms with more younger workers.
Even in firms that offer health benefits, not all workers are covered. Some workers are not eligible to enroll as a result of waiting periods or minimum work-hour rules. Other workers do not enroll in coverage offered to them because of the cost of coverage or because they are covered through a spouse. Among firms that offer coverage, an average of 77% of workers are eligible for the health benefits offered by their employer. Of those eligible, 80% take up their employer’s coverage, resulting in 62% of workers in offering firms having coverage through their employer. Among both firms that offer and do not offer health benefits, 56% of workers are covered by health plans offered by their employer, the same percentage as 2012.
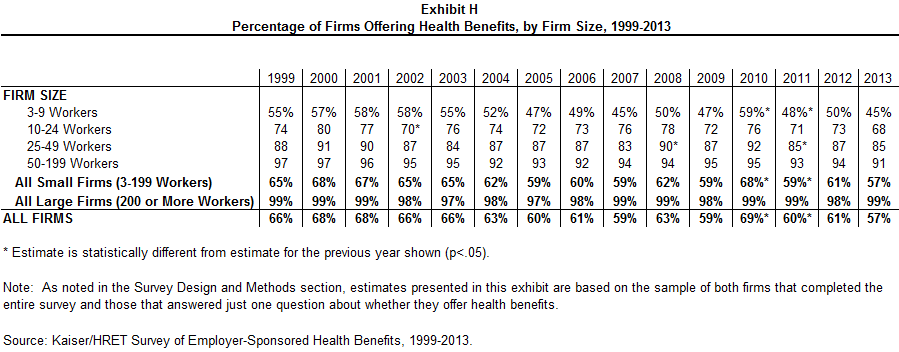
Exhibit H
RETIREE COVERAGE
Twenty-eight percent of large firms (200 or more workers) that offer health benefits in 2013 also offer retiree health benefits, similar to the percentage (25%) in 2012. Among large firms (200 or more workers) that offer retiree health benefits, 90% offer health benefits to early retirees (workers retiring before age 65), 67% offer health benefits to Medicare-age retirees, and 4% offer a plan that covers exclusively prescription drugs.
WELLNESS
Employers continue to offer programs in large numbers that help employees identify issues with their health and engage in healthier behavior. These include offering their employees the opportunity to complete a health risk assessment, and offering a variety of wellness programs that promote healthier lifestyles, including better diet and more exercise. Some employers have begun to collect biometric information from employees (e.g., cholesterol levels and body mass index) and are using it as part of their wellness and health promotion programs.
Almost one-in-four employers (24%) offering health benefits provide employees with an opportunity to complete a health risk assessment. A health risk assessment includes questions about medical history, health status, and lifestyle, and is designed to identify the health risks of the person being assessed. Large firms (200 or more workers) are more likely than smaller firms to ask employees to complete a health risk assessment (55% vs. 23%). Among these firms, 54% of large firms (200 or more workers) report that they provide a financial incentive to employees that complete the assessment.
Fifty-five percent of large firms (200 or more workers) and 26% of smaller firms offering health benefits report offering biometric screening to employees. A biometric screening is a health examination that measures an employee’s risk factors, such as body weight, cholesterol, blood pressure, stress, and nutrition. Of these firms, 11% percent of large firms require employees to complete a biometric screening to enroll in the health plan; and 11% of large firms report that employees may be financially rewarded or penalized based in meeting biometric outcomes.
Virtually all large employers (200 or more workers) and most smaller employers offer at least one wellness program. Seventy-seven percent of employers offering health benefits offer at least one of the following wellness programs in 2013: weight loss programs, gym membership discounts or on-site exercise facilities, biometric screening, smoking cessation programs, personal health coaching, classes in nutrition or healthy living, web-based resources for healthy living, flu shots or vaccinations, Employee Assistance Programs (EAP), or a wellness newsletter. Large firms (200 or more workers) are more likely to offer one of these programs than smaller firms (99% vs. 76%). Of firms offering health benefits and a wellness program, 36% of large firms (200 or more workers) and 8% of smaller firms offer employees a financial incentive to participate in a wellness program, such as smaller premium contributions, smaller deductibles, higher HSA/HRA contributions or gift cards, travel, merchandise or cash.
OTHER EMPLOYER PROGRAMS
Disease Management Programs. Most employers offer at least one disease management program as part of their largest health plan. Disease management programs identify people with chronic illnesses, such as diabetes, depression and hypertension, and offer treatment options to manage or improve the identified condition. Large firms (200 or more workers) are more likely to have a disease management program as part of their largest health plan than small firms (77% vs. 57%). Only 8% of large firms (200 or more workers) whose largest plan includes a disease management program, have a financial incentive to encourage employees to participate.
High Performance or Tiered Networks. Almost a quarter (23%) of employers offering health benefits have high performance or tiered networks in their largest health plan. These programs identify providers that are more efficient or have higher quality care, and may provide financial or other incentives for enrollees to use the selected providers.
Retail Health Clinics. Fifty-six percent of employers offering health benefits cover services provided by retail health clinics. These may be health clinics located in grocery stores or pharmacies to treat minor illnesses or provide preventive services, such as vaccines or flu shots. Among firms covering services in these settings, 17% provide a financial incentive to receive services in a retail clinic instead of a physician’s office.
OTHER TOPICS
Grandfathered Health Plans. The ACA exempts “grandfathered” health plans from a number of its provisions, such as the requirements to cover preventive benefits without cost sharing or the new rules for small employers’ premiums ratings and benefits. An employer-sponsored health plan can be grandfathered if it covered a worker when the ACA became law (March 23, 2010) and if the plan has not made significant changes that reduce benefits or increase employee costs.3 Fifty-four percent of firms offering health benefits offer at least one grandfathered health plan in 2013, similar to the percentage reported in 2012. Small firms (3-199 workers) are more likely than larger firms to offer a grandfathered health plan (54% vs. 43%). Looking at enrollment, 36% of covered workers are enrolled in a grandfathered health plan in 2013, down from 48% in 2012 (Exhibit I). Covered workers in small firms (3-199 workers) are more likely than covered workers in larger firms to be enrolled in a grandfathered health plan (49% vs. 30%).
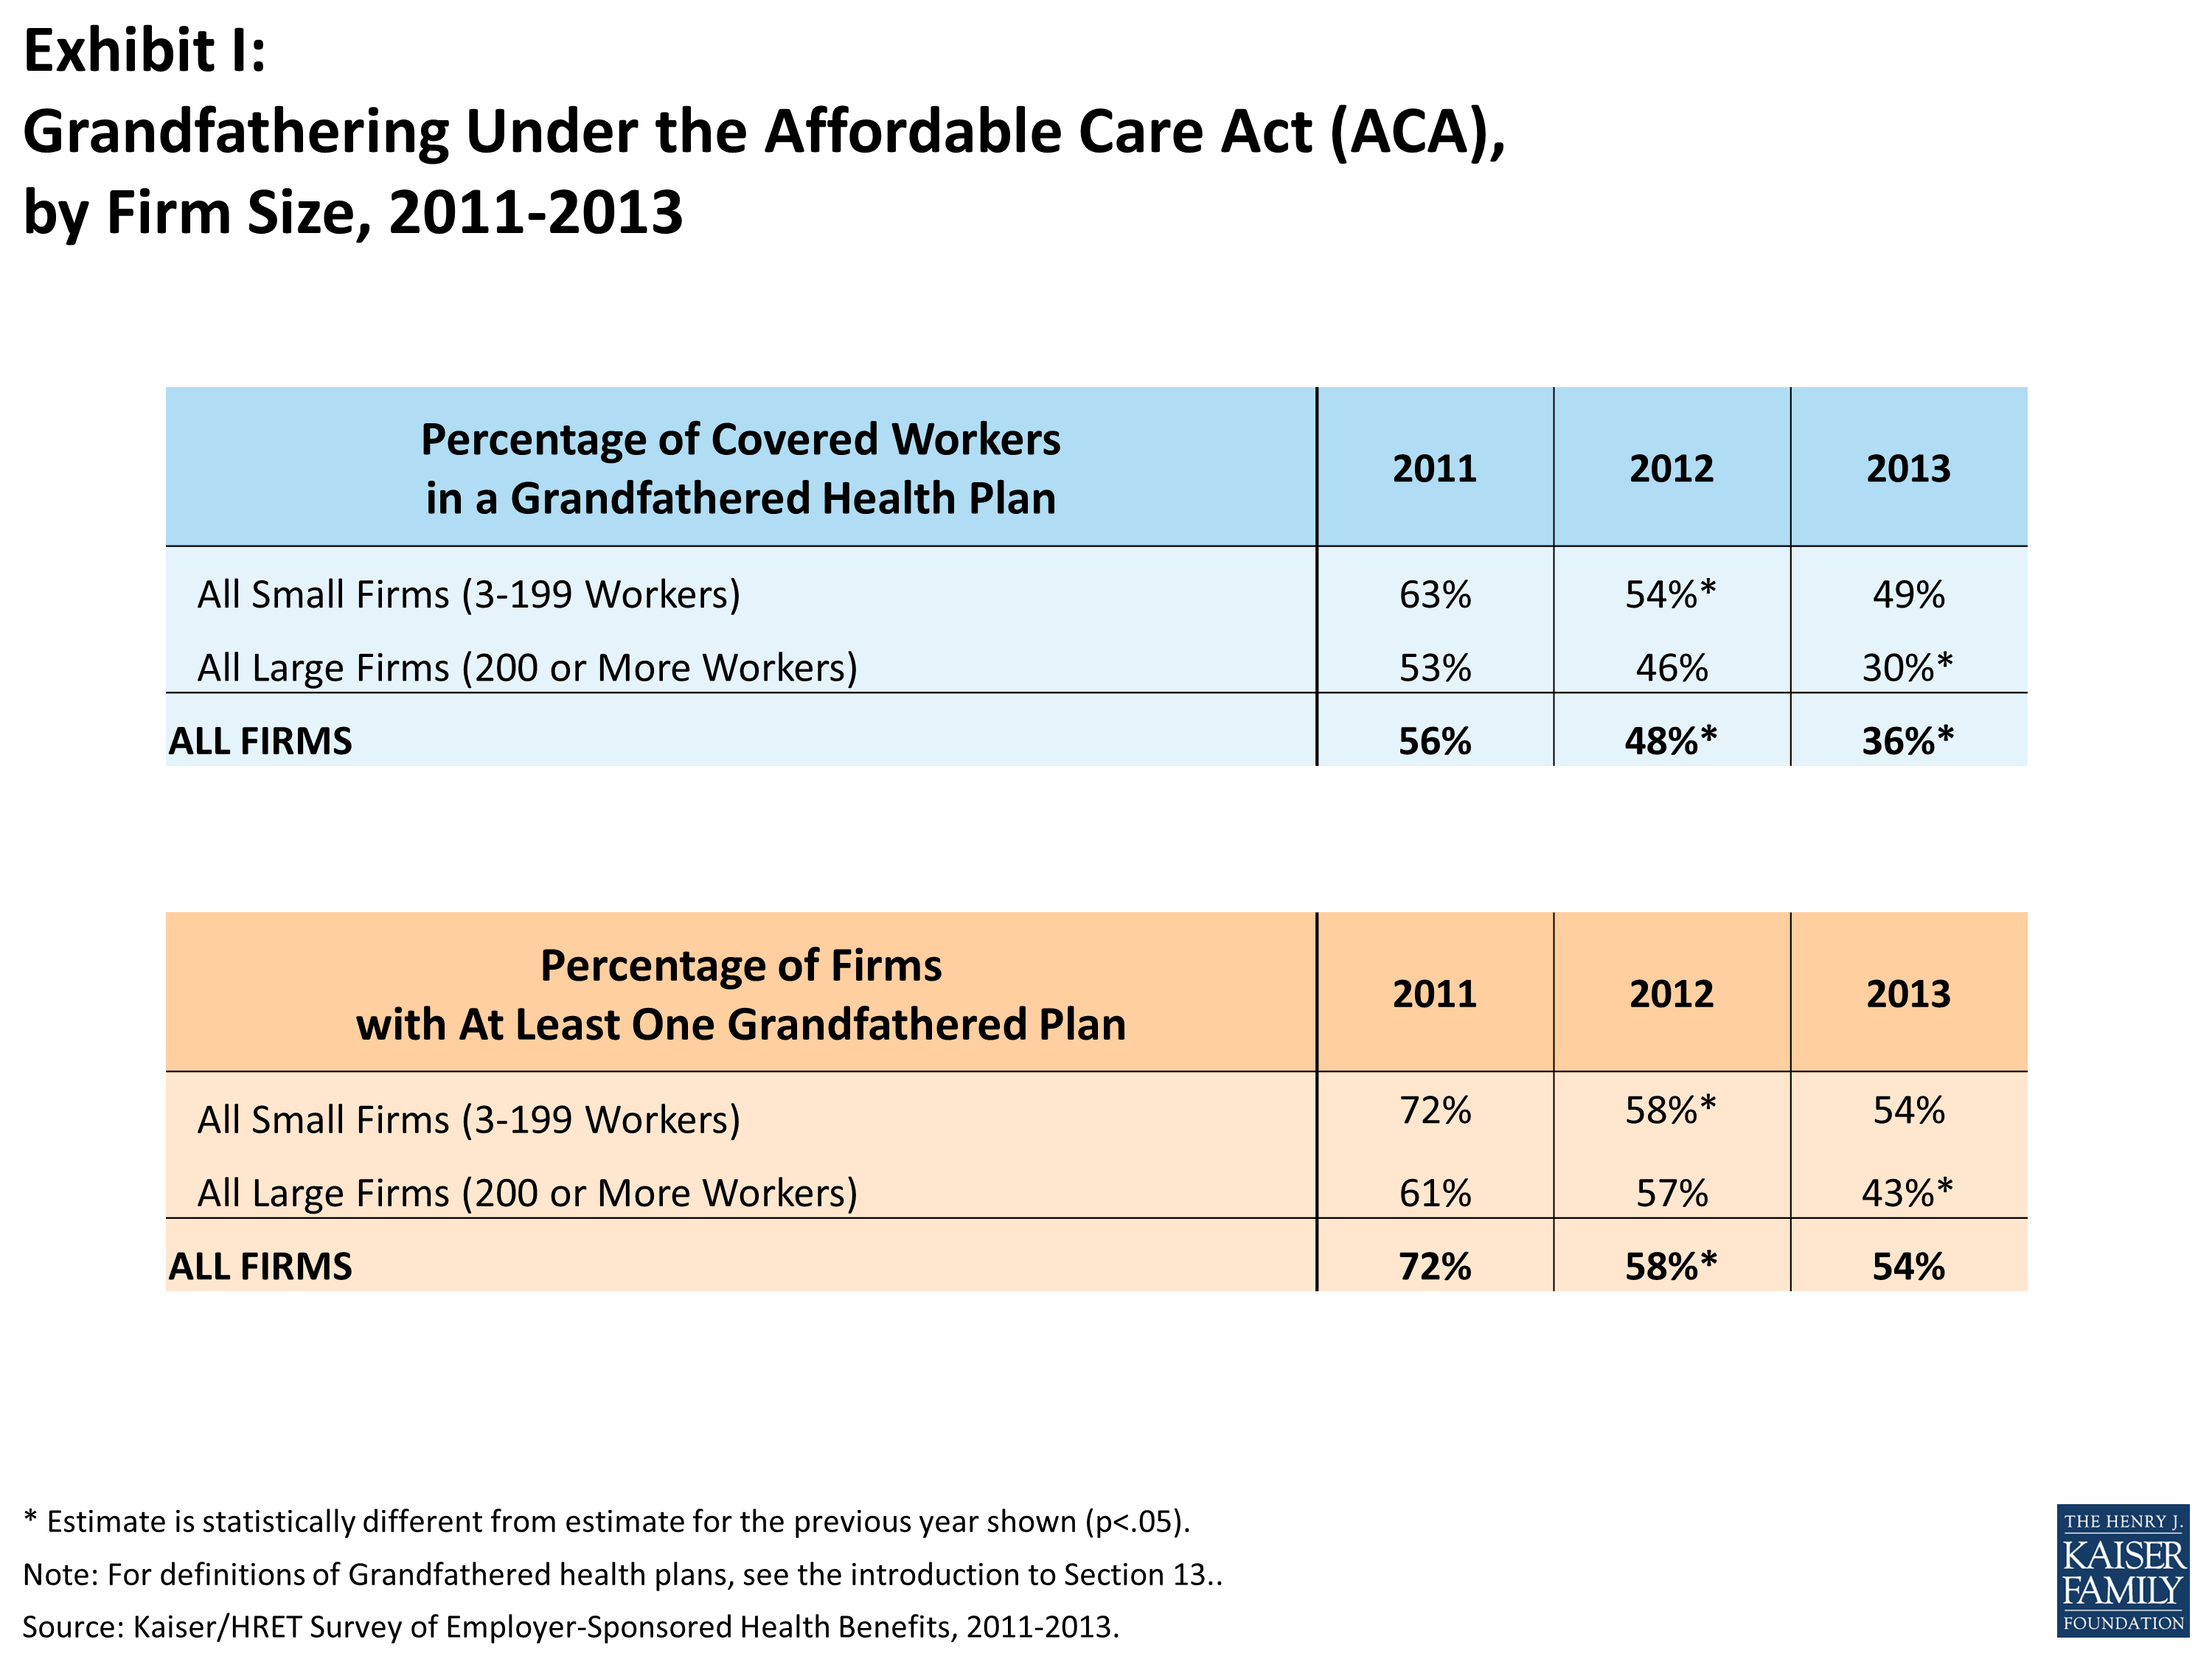
Exhibit I
Self-Funding. Sixteen percent of covered workers at small firms (3-199 workers) and 83% of covered workers at larger firms are enrolled in plans which are either partially or completely self-funded, similar to 2012 (15% and 81%). Six percent of firms offering fully-insured plans report that they intend to self-insure because of the ACA.
Shopping for Coverage. Fifty-four percent of firms shopped for a new health plan or insurance carrier in the previous year. There was not a significant difference between small (3 – 199 workers) and larger firms in the likelihood of shopping for new coverage. Among firms that shopped, 18% changed carriers in the past year and 15% changed the type of health plan (e.g., HMO, PPO, POS or HDHP/SO) that they offer.
Exchanges for Large Employers. In the last two years, several consulting firms have announced that they were creating private exchanges for employers.4,5 These exchanges would provide employers an opportunity to give their employees a contribution that may be used to choose from a potentially broad choice of health plans that would be managed by the exchange. While few employers have adopted this approach to date, 9% of large firms (200 or more employees), including 29% of firms with 5,000 or more employees, reported that they are considering offering health benefits through a private exchange in the future. This interest may signal a significant change in the way that employers approach health benefits and the way employees get coverage, with employers playing a less active role in plan design and management.
CONCLUSION
The 2013 annual survey did not find major changes in employer-based health benefits. Premiums increased at modest levels, consistent with the last several years, and coverage and offer rates did not change significantly. Employers remain committed to wellness programs: most covered workers are in plans with some type of wellness program and a majority (67%) of employers believes that wellness programs are very or somewhat effective in controlling health care costs.
More changes are expected over the next several years as many of more far-reaching provisions of the health reform law will take effect in 2014, including new benefits, cost-sharing tiers and premium rating rules that will apply to plans for employers with 50 or fewer workers. While several provisions affecting some larger employers have been delayed, most notably the requirement to offer coverage to all full-time employees by 2014, employers may begin adapting benefits and contributions to prepare to meet this requirement for 2015. The adoption of new federal rules for employee wellness programs, which permit employers to have larger financial rewards for employees who participate in wellness programs or who meet defined health outcomes, may encourage employers to modify or extend their wellness approaches.
The emergence of new exchanges, or marketplaces, also may portend important changes for employer-sponsored health insurance. Through an exchange, an employer can provide employees with a larger number and type of health plan options. Exchanges also facilitate the use of defined contributions or other strategies that encourage employees to choose lower cost plans or pay the difference in costs themselves. New SHOP exchanges will offer coverage options to small employers beginning in 2014, although employee choice will be limited in the federal SHOP exchanges until 2015. Large employers have the option of offering coverage through one of several exchanges being sponsored by benefit consulting organizations. While these approaches are new and differ across different exchanges, the common theme is to devolve some benefit choices, and some of the financial responsibility for those choices, to employees. Whether this new way of purchasing coverage works for employers and their employees, and how it affects benefits and plan costs, will be among the more important stories for the employer health insurance market over the next few years.
METHODOLOGY
The Kaiser Family Foundation/Health Research & Educational Trust 2013 Annual Employer Health Benefits Survey (Kaiser/HRET) reports findings from a telephone survey of 2,067 randomly selected public and private employers with three or more workers. Researchers at the Health Research & Educational Trust, NORC at the University of Chicago, and the Kaiser Family Foundation designed and analyzed the survey. National Research, LLC conducted the fieldwork between January and May 2013. In 2013 the overall response rate is 49%, which includes firms that offer and do not offer health benefits. Among firms that offer health benefits, the survey’s response rate is 50%.
We ask all firms with which we made phone contact, even if the firm declined to participate in the survey: “Does your company offer a health insurance program as a benefit to any of your employees?” A total of 2,948 firms responded to this question (including the 2,067 who responded to the full survey and 881 who responded to this one question). Their responses are included in our estimates of the percentage of firms offering health coverage. The response rate for this question is 70%.
Since firms are selected randomly, it is possible to extrapolate from the sample to national, regional, industry, and firm size estimates using statistical weights. In calculating weights, we first determine the basic weight, then apply a nonresponse adjustment, and finally apply a post-stratification adjustment. We use the U.S. Census Bureau’s Statistics of U.S. Businesses as the basis for the stratification and the post-stratification adjustment for firms in the private sector, and we use the Census of Governments as the basis for post-stratification for firms in the public sector. Some numbers in the exhibits in the report do not sum up to totals due to rounding effects, and, in a few cases, numbers from distribution exhibits referenced in the text may not add due to rounding effects. Unless otherwise noted, differences referred to in the text and exhibits use the 0.05 confidence level as the threshold for significance.
For more information on the survey methodology, please visit the Survey Design and Methods Section at http://ehbs.kff.org/.
The Kaiser Family Foundation, a leader in health policy analysis, health journalism and communication, is dedicated to filling the need for trusted, independent information on the major health issues facing our nation and its people. The Foundation is a non-profit private operating foundation, based in Menlo Park, California.
The Health Research & Educational Trust is a private, not-for-profit organization involved in research, education, and demonstration programs addressing health management and policy issues. Founded in 1944, HRET, an affiliate of the American Hospital Association, collaborates with health care, government, academic, business, and community organizations across the United States to conduct research and disseminate findings that help shape the future of health care.
Average Annual Health Insurance Premiums and Worker Contributions for Family Coverage, 2003-2013
Average Annual Firm and Worker Premium Contributions and Total Premiums for Covered Workers for Single and Family Coverage, by Plan Type, 2013
Distribution of Annual Premiums for Single and Family Coverage Relative to the Average Annual Single or Family Premium, 2013
Distribution of Percentage of Premium Paid by Covered Workers for Single and Family Coverage, by Firm Size, 2013
Distribution of Health Plan Enrollment for Covered Workers, by Plan Type, 1988-2013
Percentage of Covered Workers Enrolled in a Plan with a General Annual Deductible of $1,000 or More for Single Coverage, By Firm Size, 2006-2013
Among Covered Workers, Characteristics of General Annual Deductibles for Single Coverage, 2013
Percentage of Firms Offering Health Benefits, by Firm Size, 1999-2013
Grandfathering Under the Affordable Care Act (ACA), by Firm Size, 2011-2013
Report
Section One: Cost of Health Insurance
The average annual premiums in 2013 are $5,884 for single coverage and $16,351 for family coverage. Average premiums increased 5% for single coverage and 4% for family coverage in the last year. Family premiums have increased 80% since 2003 and have more than doubled since 2002. Average family premiums for workers in small firms (3-199 workers) ($15,581) are significantly lower than average family premiums for workers in larger firms (200 or more workers) ($16,715).
Premium Costs for Single and Family Coverage
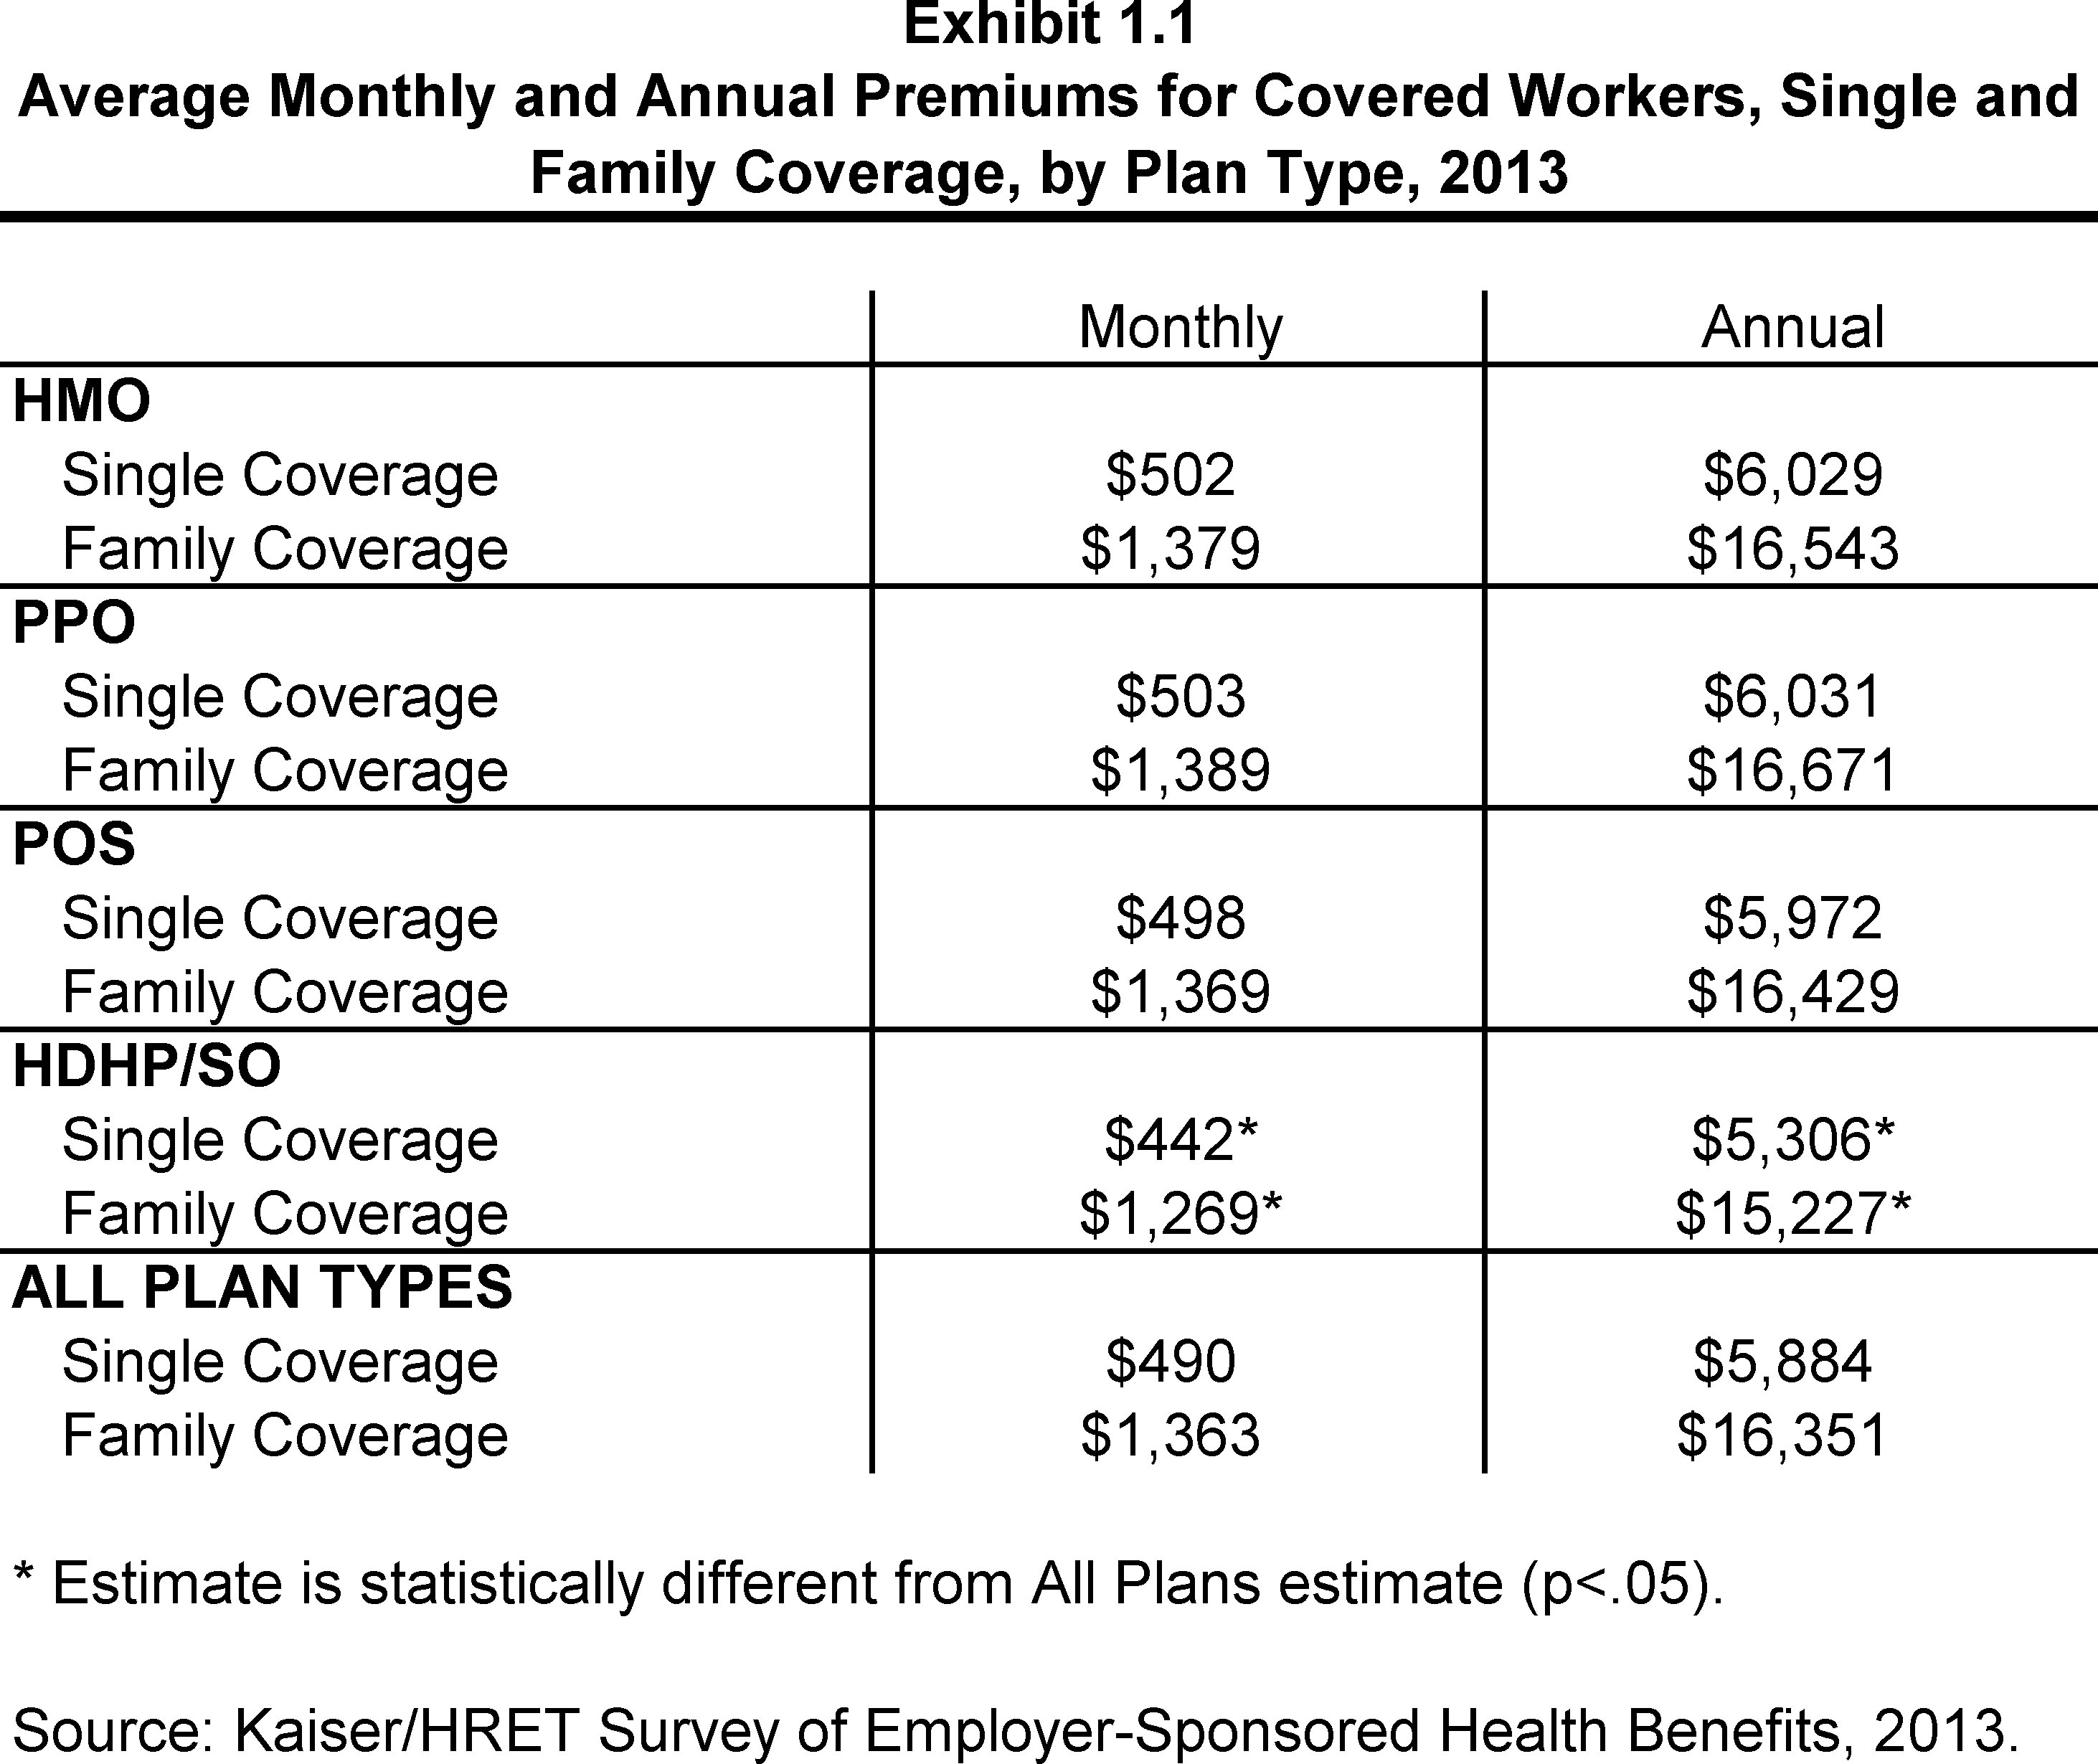
- The average premium for single coverage in 2013 is $490 per month or $5,884 per year (Exhibit 1.1). The average premium for family coverage is $1,363 per month or $16,351 per year (Exhibit 1.1).
- The average annual premiums for covered workers in HDHP/SOs are lower for single ($5,306) and family coverage ($15,227) than the overall average premiums for covered workers. Average annual premiums for all other plan types, including PPO plans, HMOs, and POS plans, are similar to the overall average premiums for covered workers (Exhibit 1.1).
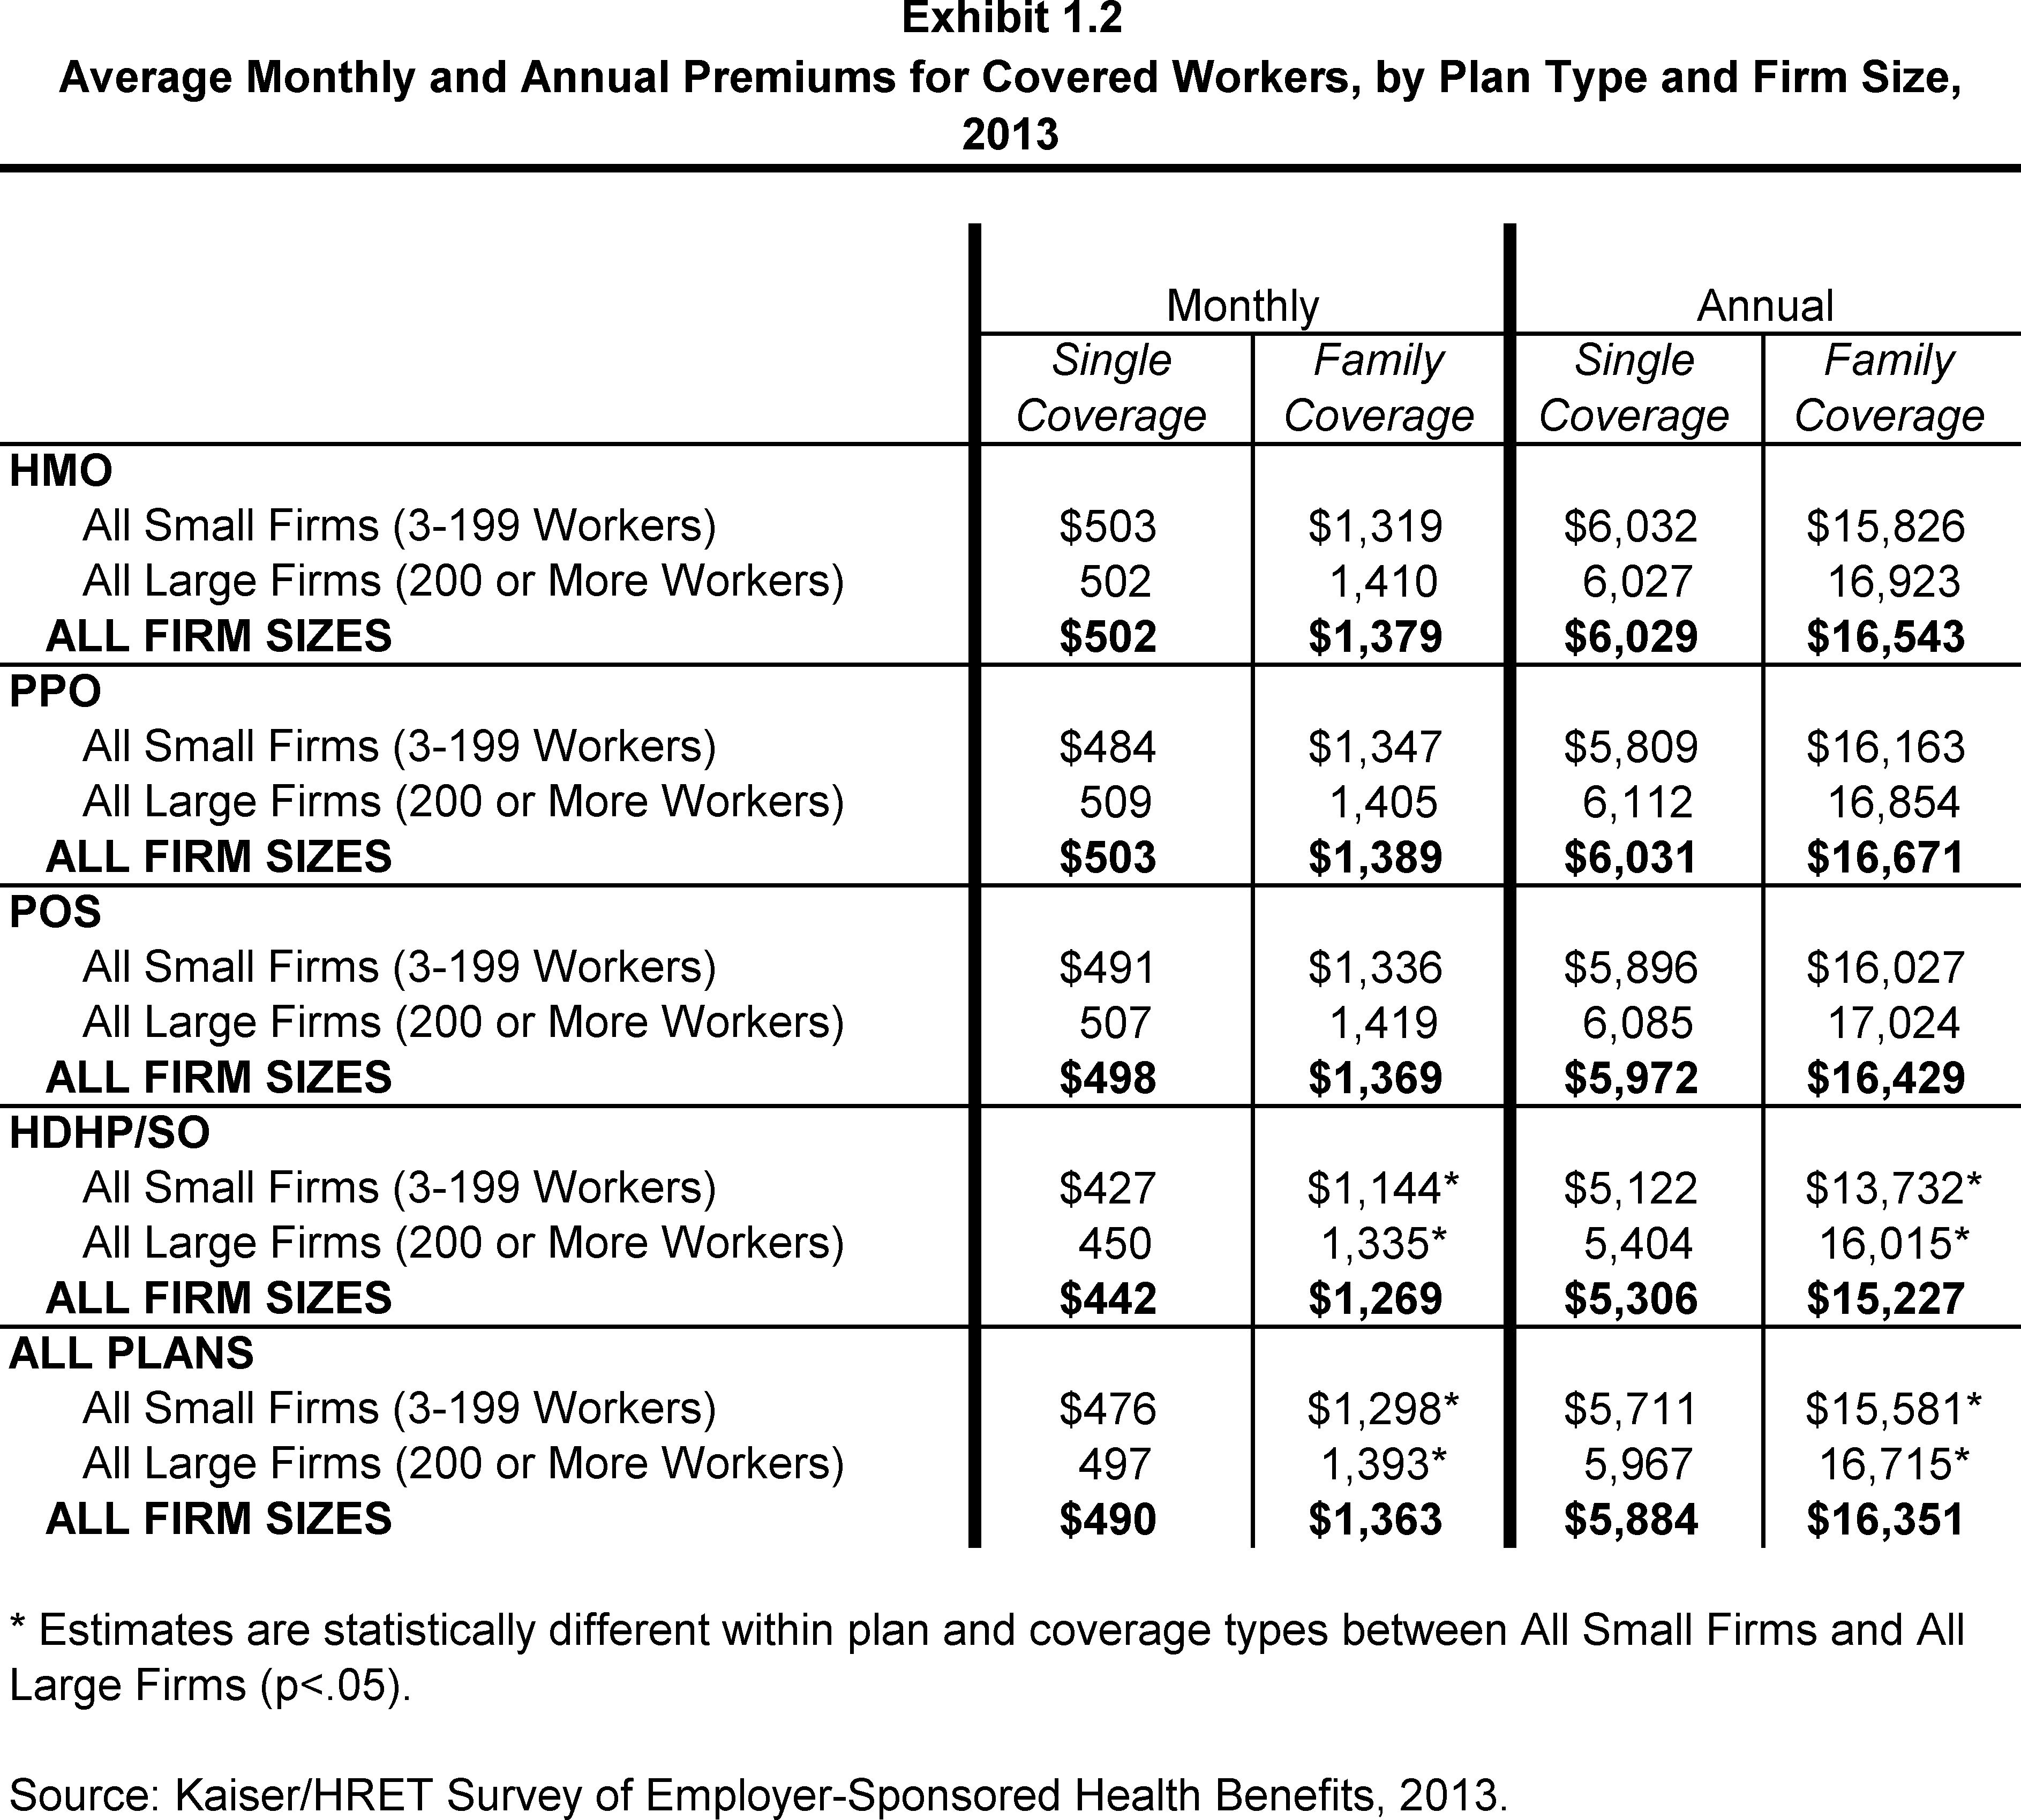
- The average premium for family coverage for covered workers in small firms (3-199 workers) ($15,581) is lower than the average premium for covered workers in large firms (200 or more workers) ($16,715) (Exhibit 1.2). The average single premium for covered workers in small firms (3-199 workers) and larger firms do not differ significantly.
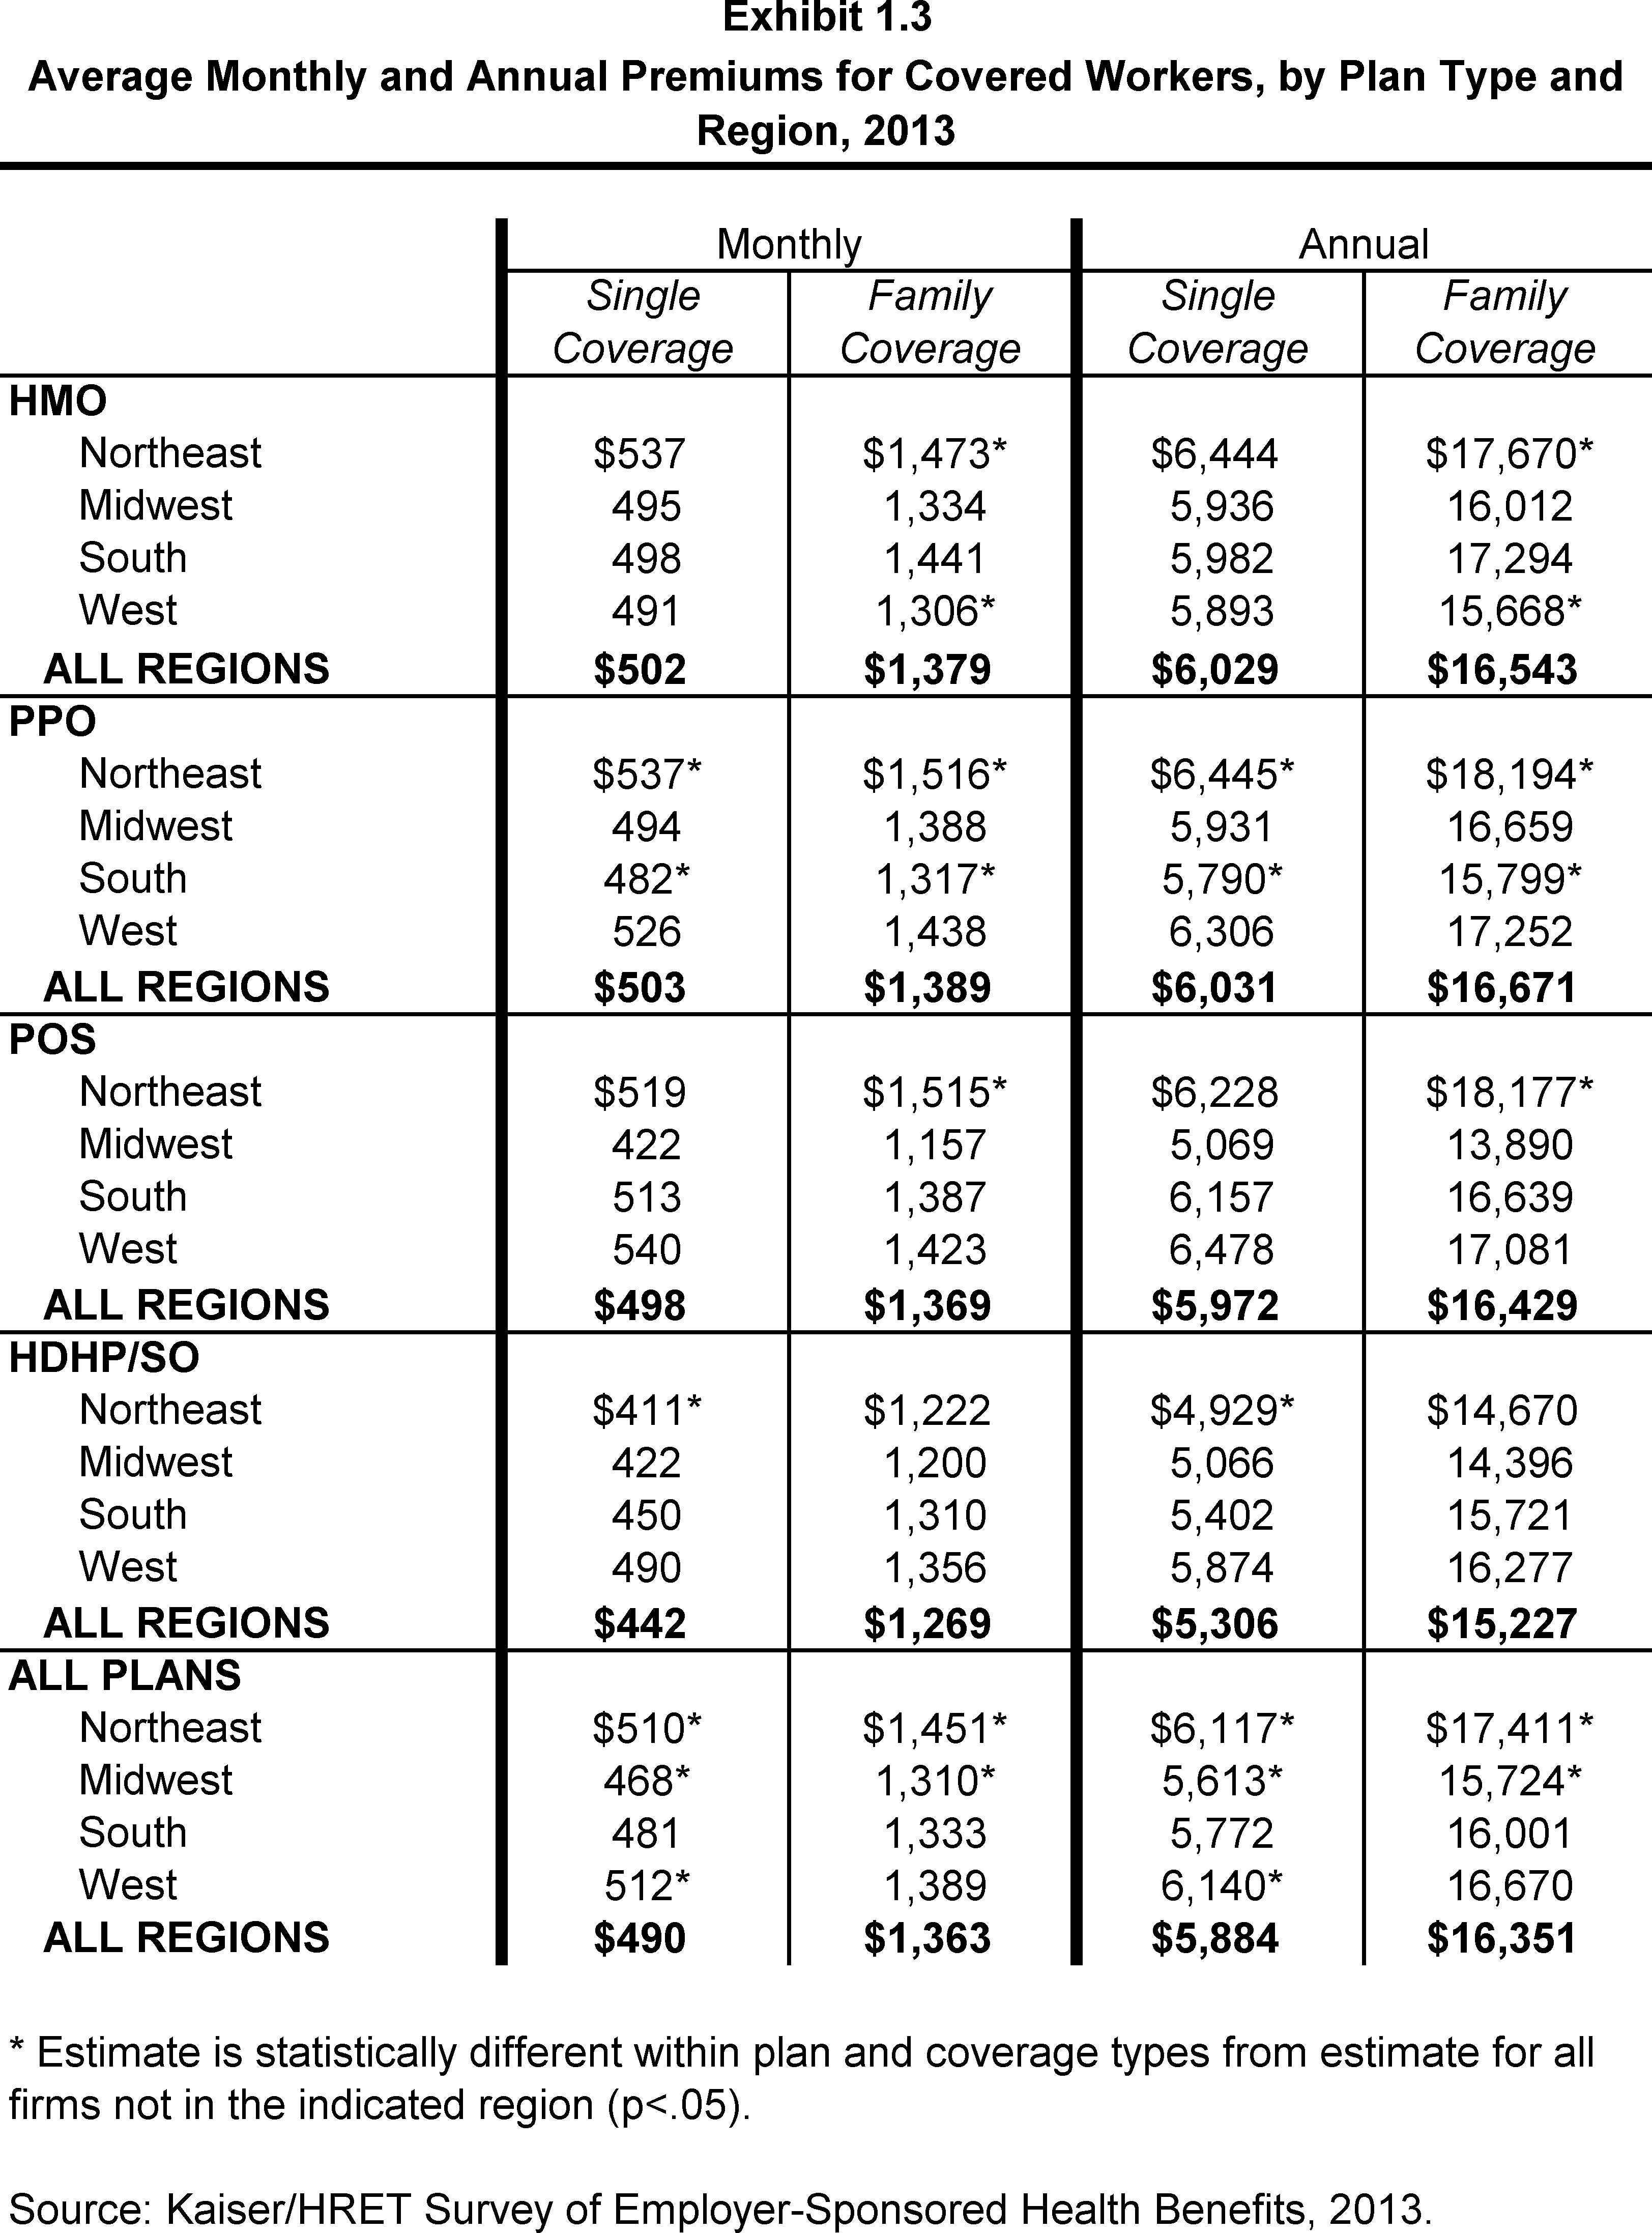
- Average single and family premiums for covered workers are higher in the Northeast ($6,117 and $17,411) and lower in the Midwest ($5,613 and $15,724) than the average premiums for covered workers in all other regions (Exhibit 1.3). Covered workers in the West also face higher premiums for single coverage ($6,140).
- Covered workers in firms where 35% or more of the workers are age 26 or younger have lower average single and family premiums ($5,166 and $14,645) than covered workers in firms where a lower percentage of workers are age 26 or younger ($5,929 and $16,457). Covered workers in firms where 35% or more of the workers are age 50 or older have higher average single and family premiums ($6,263 and $17,424) than covered workers in firms where a lower percentage of workers are age 50 or older ($5,622 and $15,612) (Exhibit 1.5) and (Exhibit 1.6).
- Covered workers in firms with a large percentage of lower-wage workers (at least 35% of workers earn $23,000 per year or less) have lower average single and family premiums ($5,450 and $15,225) than covered workers in firms with a smaller percentage of lower-wage workers ($5,922 and $16,450). Covered worker in firms with a large percentage of higher-wage workers (at least 35% of workers earn $56,000 per year or more) have higher average single and family premiums ($6,025 and $16,989) than covered workers in firms with a smaller percentage of higher-wage workers ($5,760 and $15,789) (Exhibit 1.5).
- There is considerable variation in premiums for both single and family coverage.
- Twenty-one percent of covered workers are employed by firms that have a single premium at least 20% higher than the average single premium, while 22% of covered workers are in firms that have a single premium less than 80% of the average single premium (Exhibit 1.7).
- For family coverage, 21% of covered workers are employed in a firm that has a family premium at least 20% higher than the average family premium, and another 21% of covered workers are in firms that have a family premium less than 80% of the average family premium (Exhibit 1.7) and (Exhibit 1.8).
Premium Changes Over Time
- The average annual single premium ($5,884) in 2013 is 5% higher than the average annual single premium in 2012 ($5,615), and the average annual family premium ($16,351) is 4% higher than the average annual family premium last year ($15,745) (Exhibit 1.11).
- The $16,351 average annual family premium in 2013 is 29% higher than the average family premium in 2008 and 80% higher than the average family premium in 2003 (Exhibit 1.11).
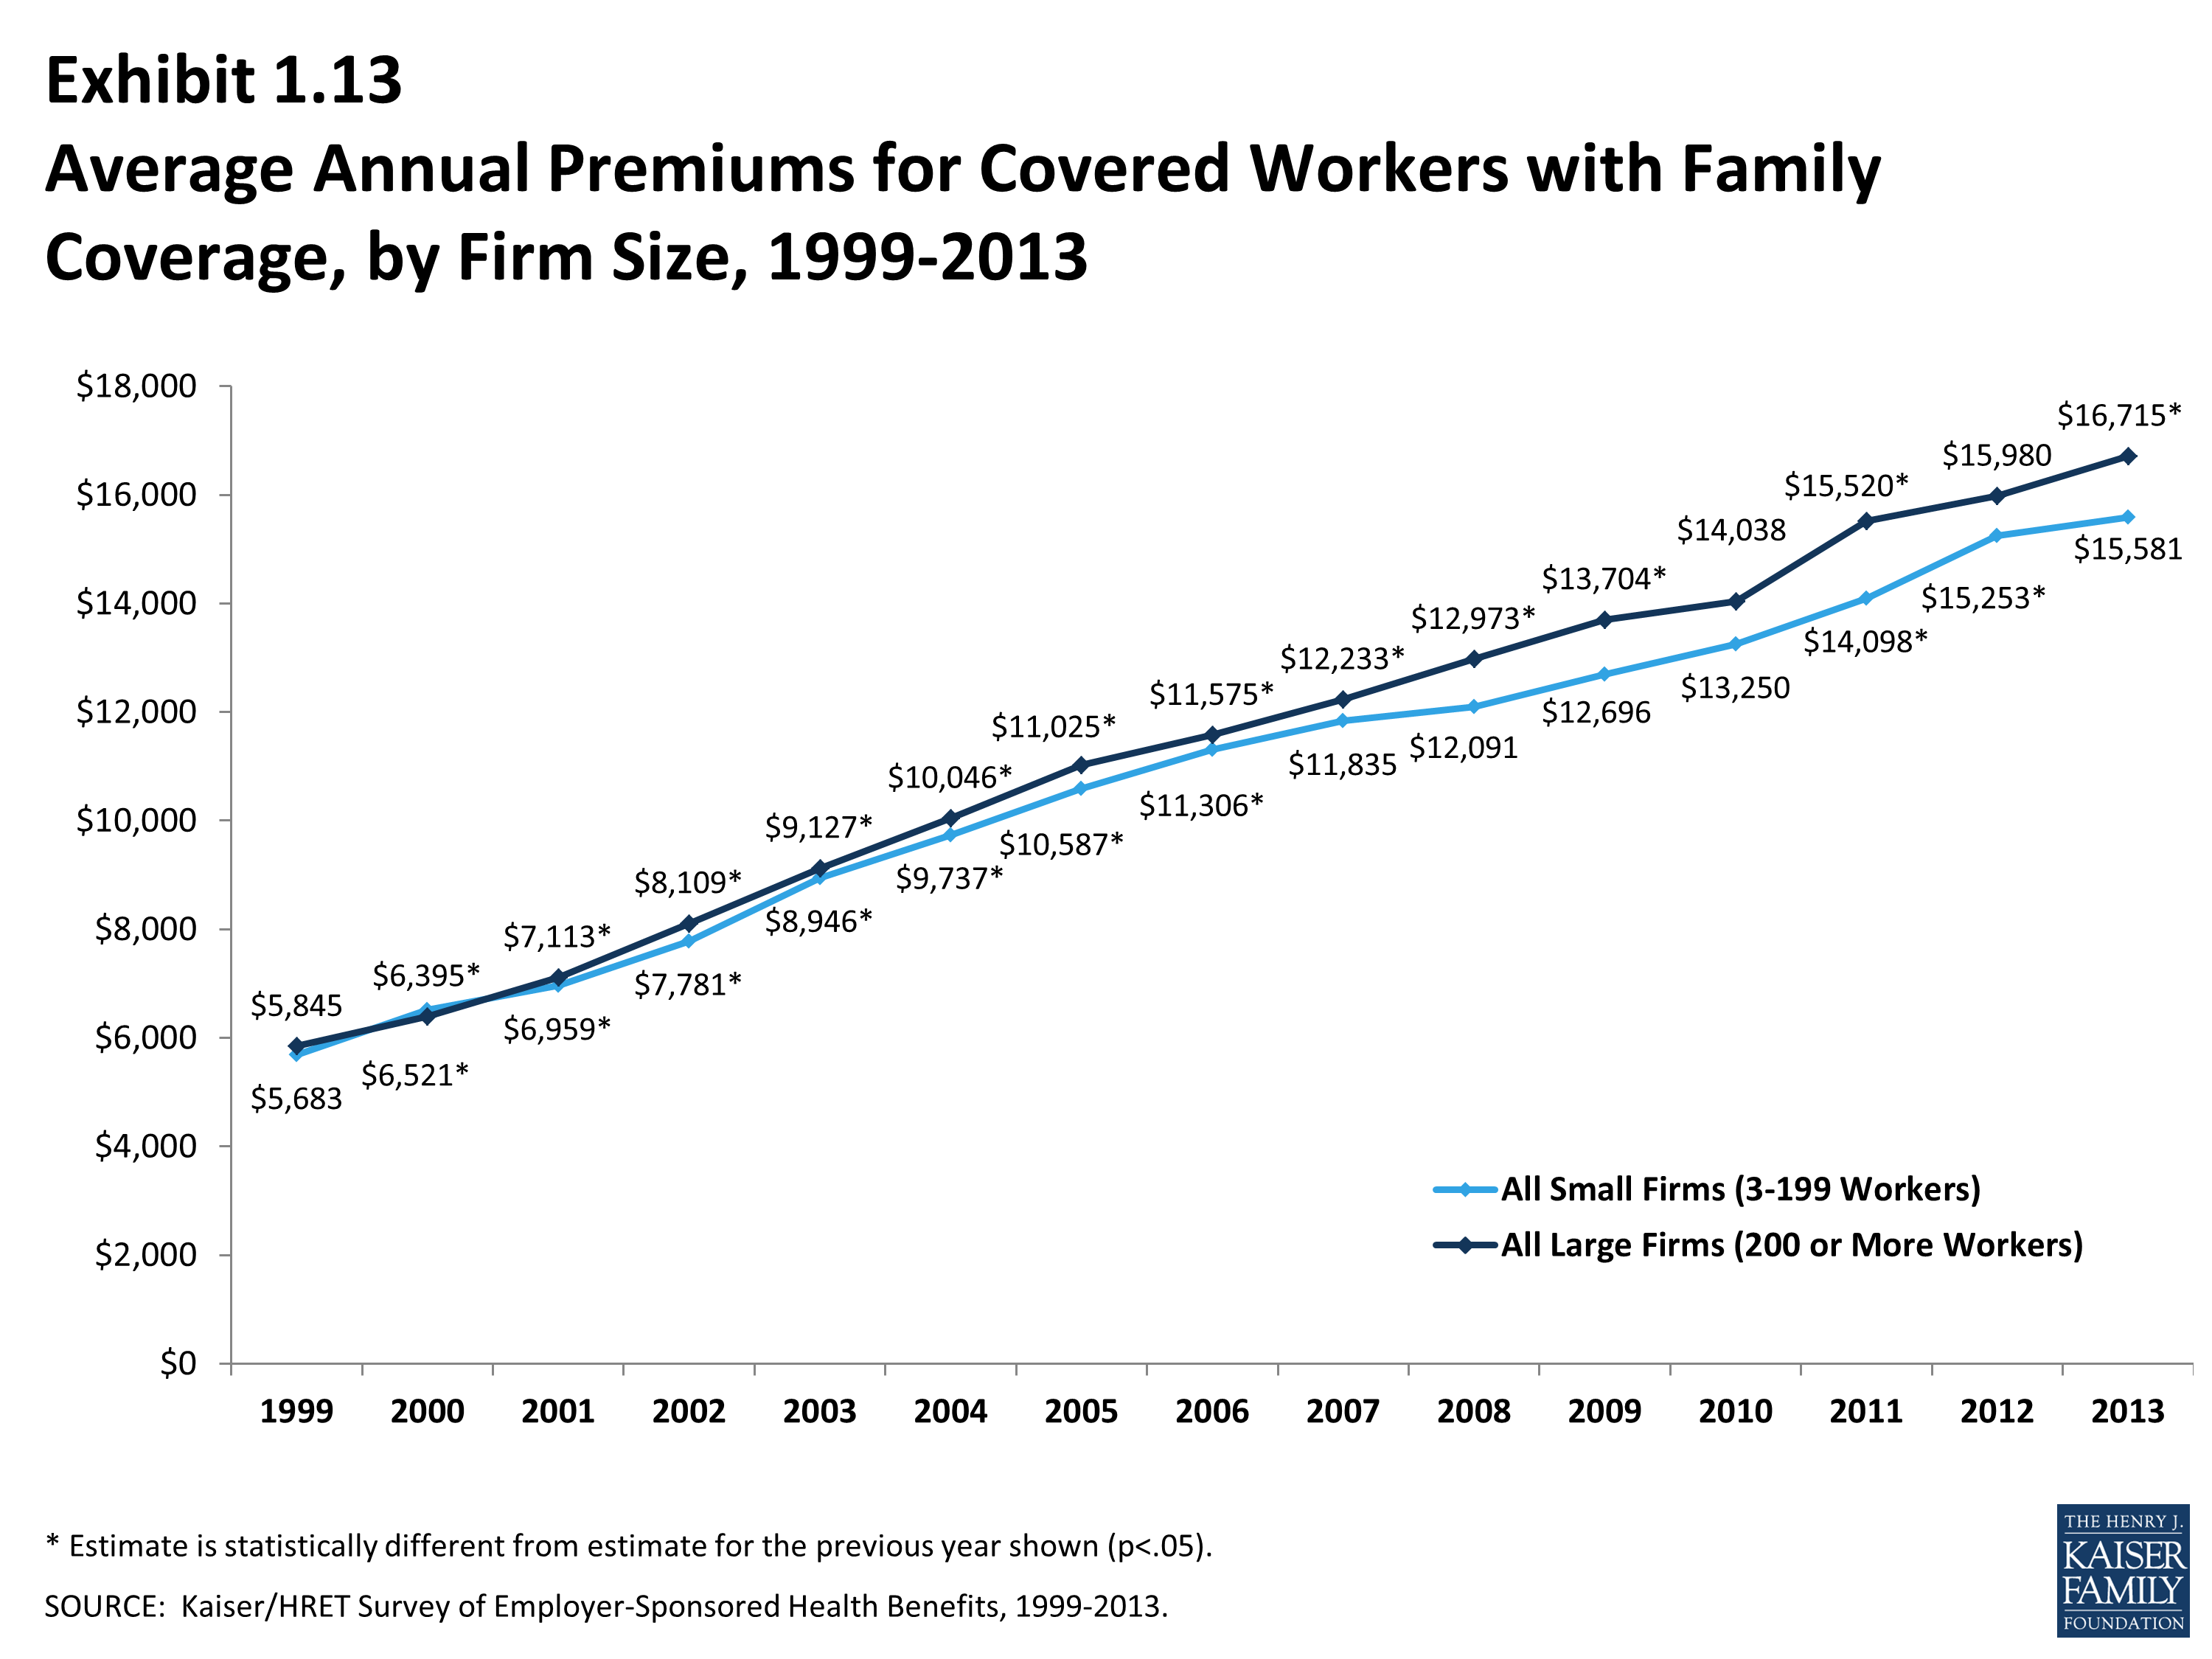
- Premiums for both small and large firms have seen a similar increase since 2008 (29%). For small firms (3 to 199 workers), the average family premium rose from $12,091 in 2008 to $15,581 in 2013. For large firms (200 or more workers), the average family premium rose from $12,973 in 2008 to $16,715 in 2013 (Exhibit 1.13).
- Since 2003, premiums for small firms (3 to 199 workers) have increased 74% ($15,581 in 2013 vs. $8,946 in 2003). The premiums for large firms have increased 83% ($16,715 in 2013 vs. $9,127 in 2003) (Exhibit 1.13).
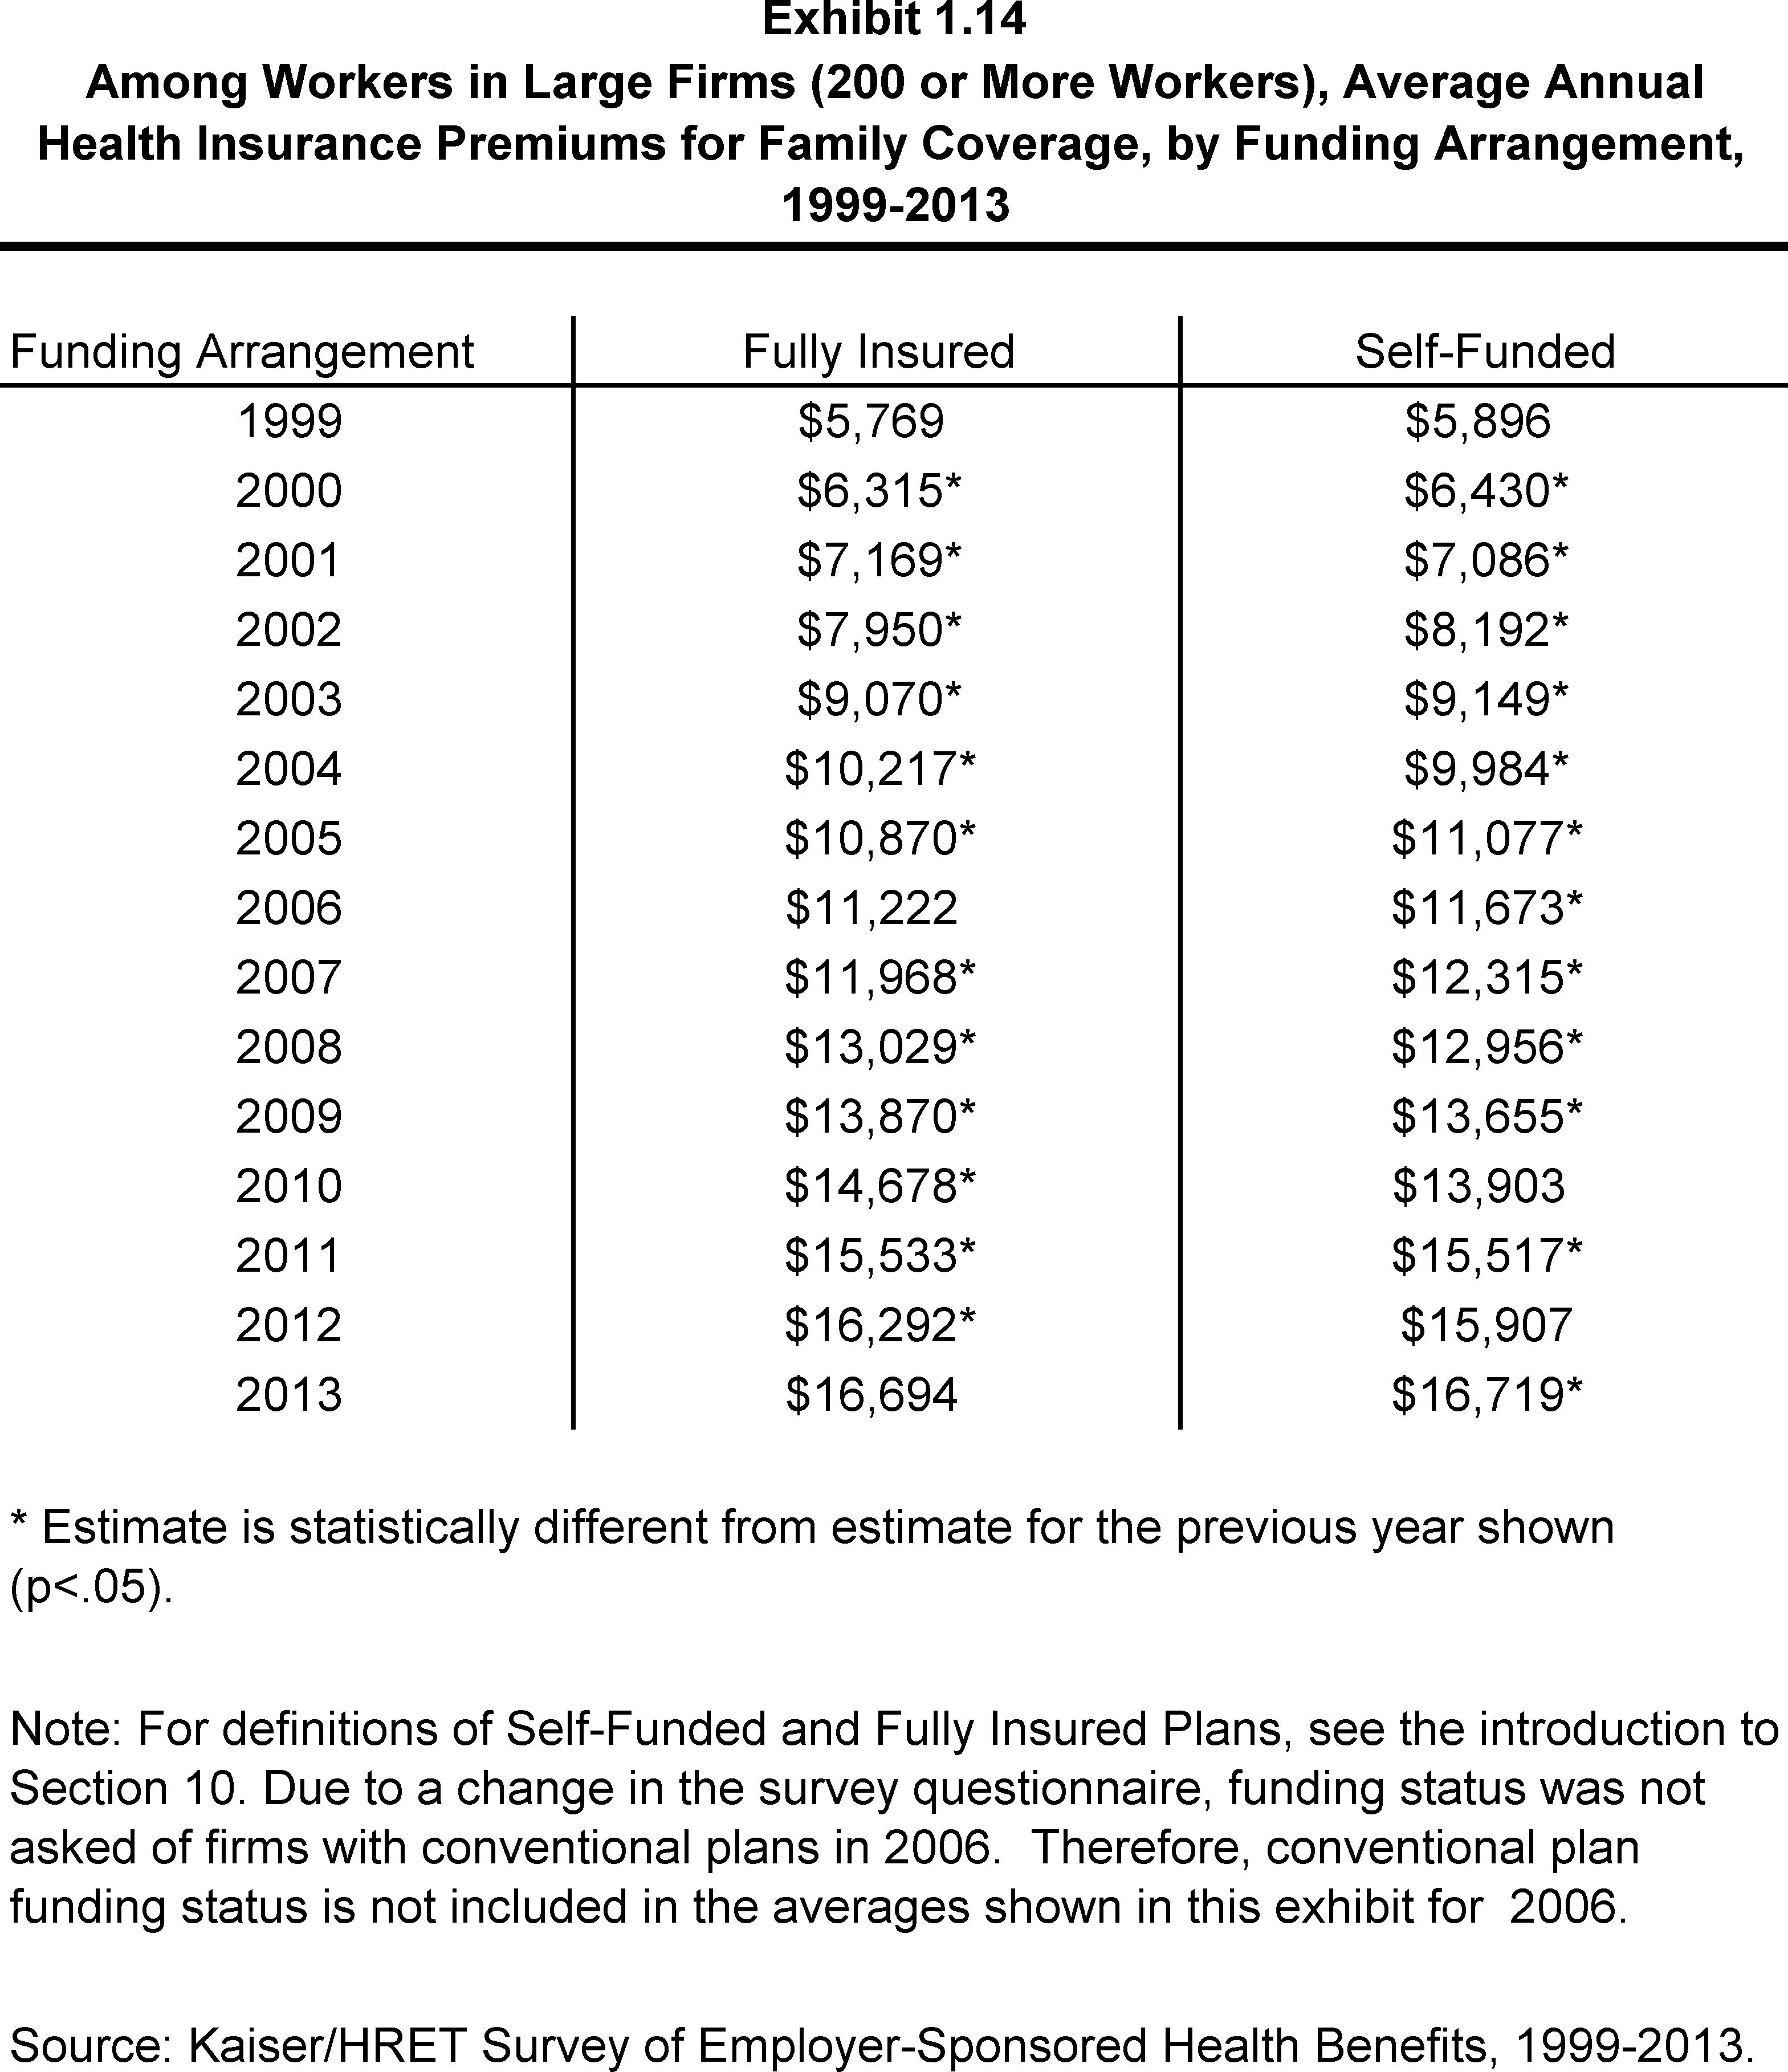
- For large firms (200 or more workers), the average family premium for covered workers in firms that are fully insured has grown at a similar rate to premiums for workers in fully or partially self-funded firms from 2008 to 2013 (28% in fully insured firms vs. 29% in self-funded firms) and from 2003 to 2013 (84% in fully insured firms vs. 83% in self-funded firms) (Exhibit 1.14).
Average Monthly and Annual Premiums for Covered Workers, Single and Family Coverage, by Plan Type, 2013
Average Monthly and Annual Premiums for Covered Workers, by Plan Type and Firm Size, 2013
Average Monthly and Annual Premiums for Covered Workers, by Plan Type and Region, 2013
Average Monthly and Annual Premiums for Covered Workers, by Plan Type and Industry, 2013
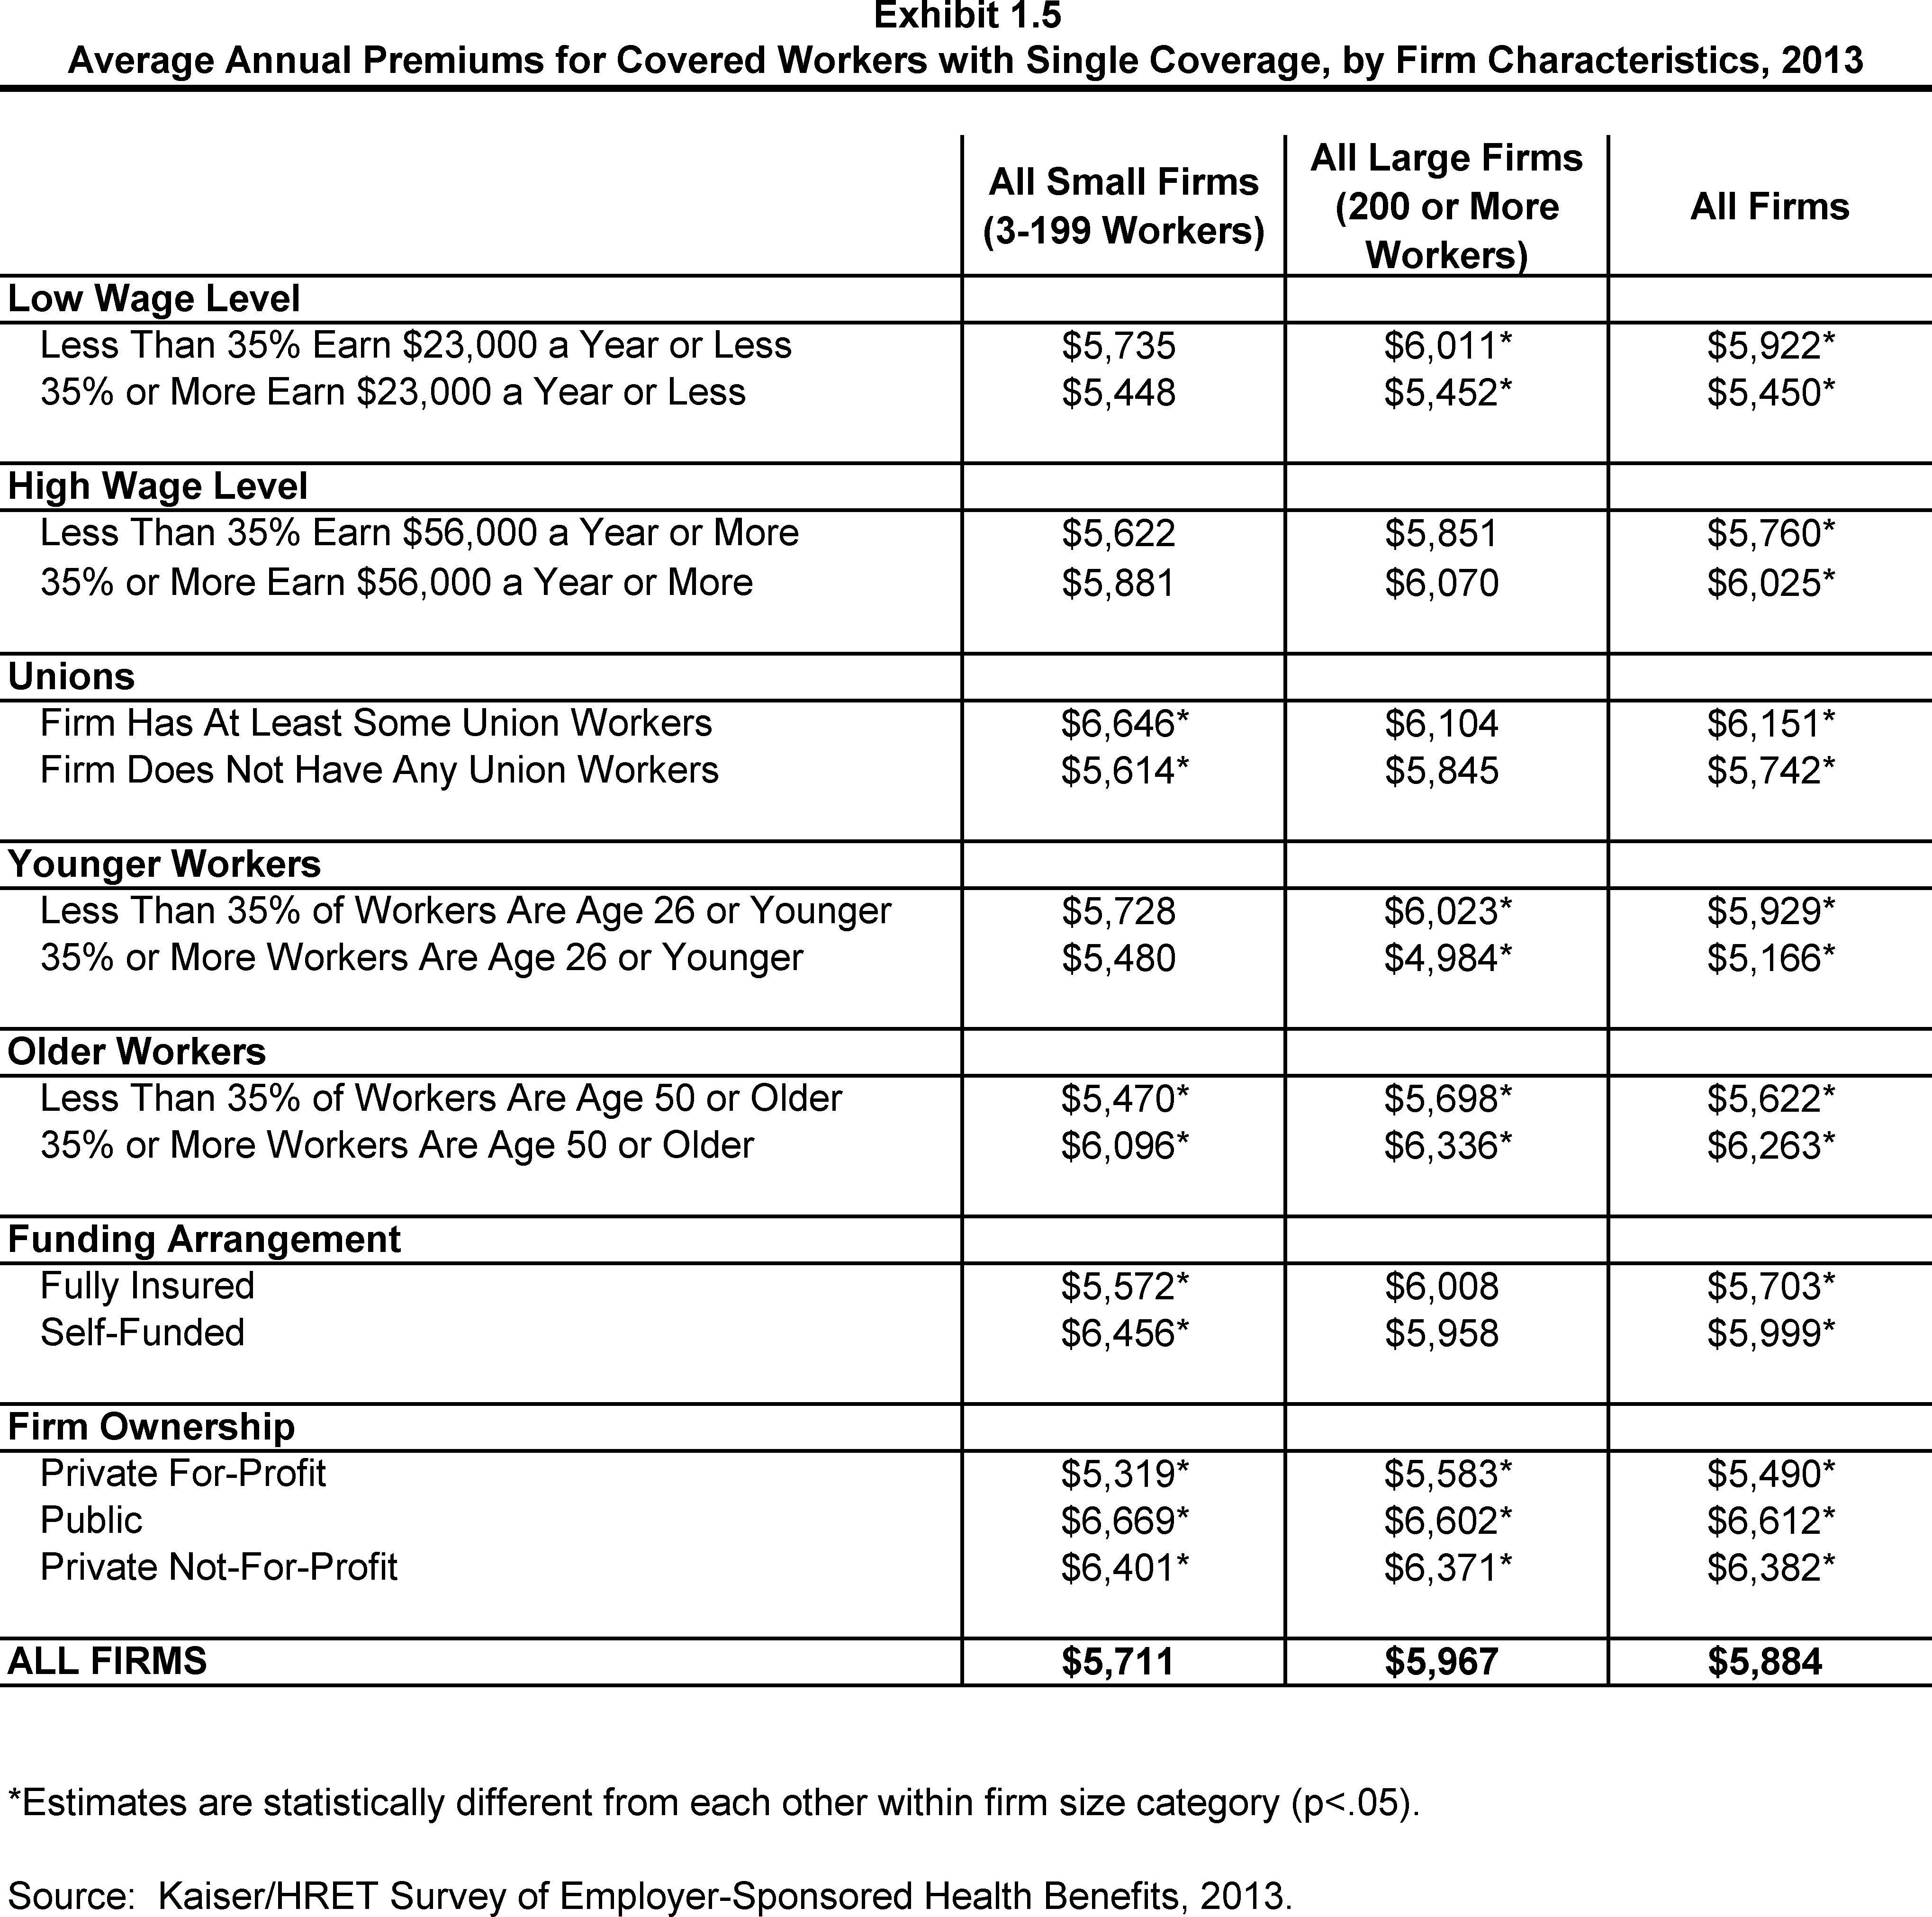
Average Annual Premiums for Covered Workers with Single Coverage, by Firm Characteristics, 2013
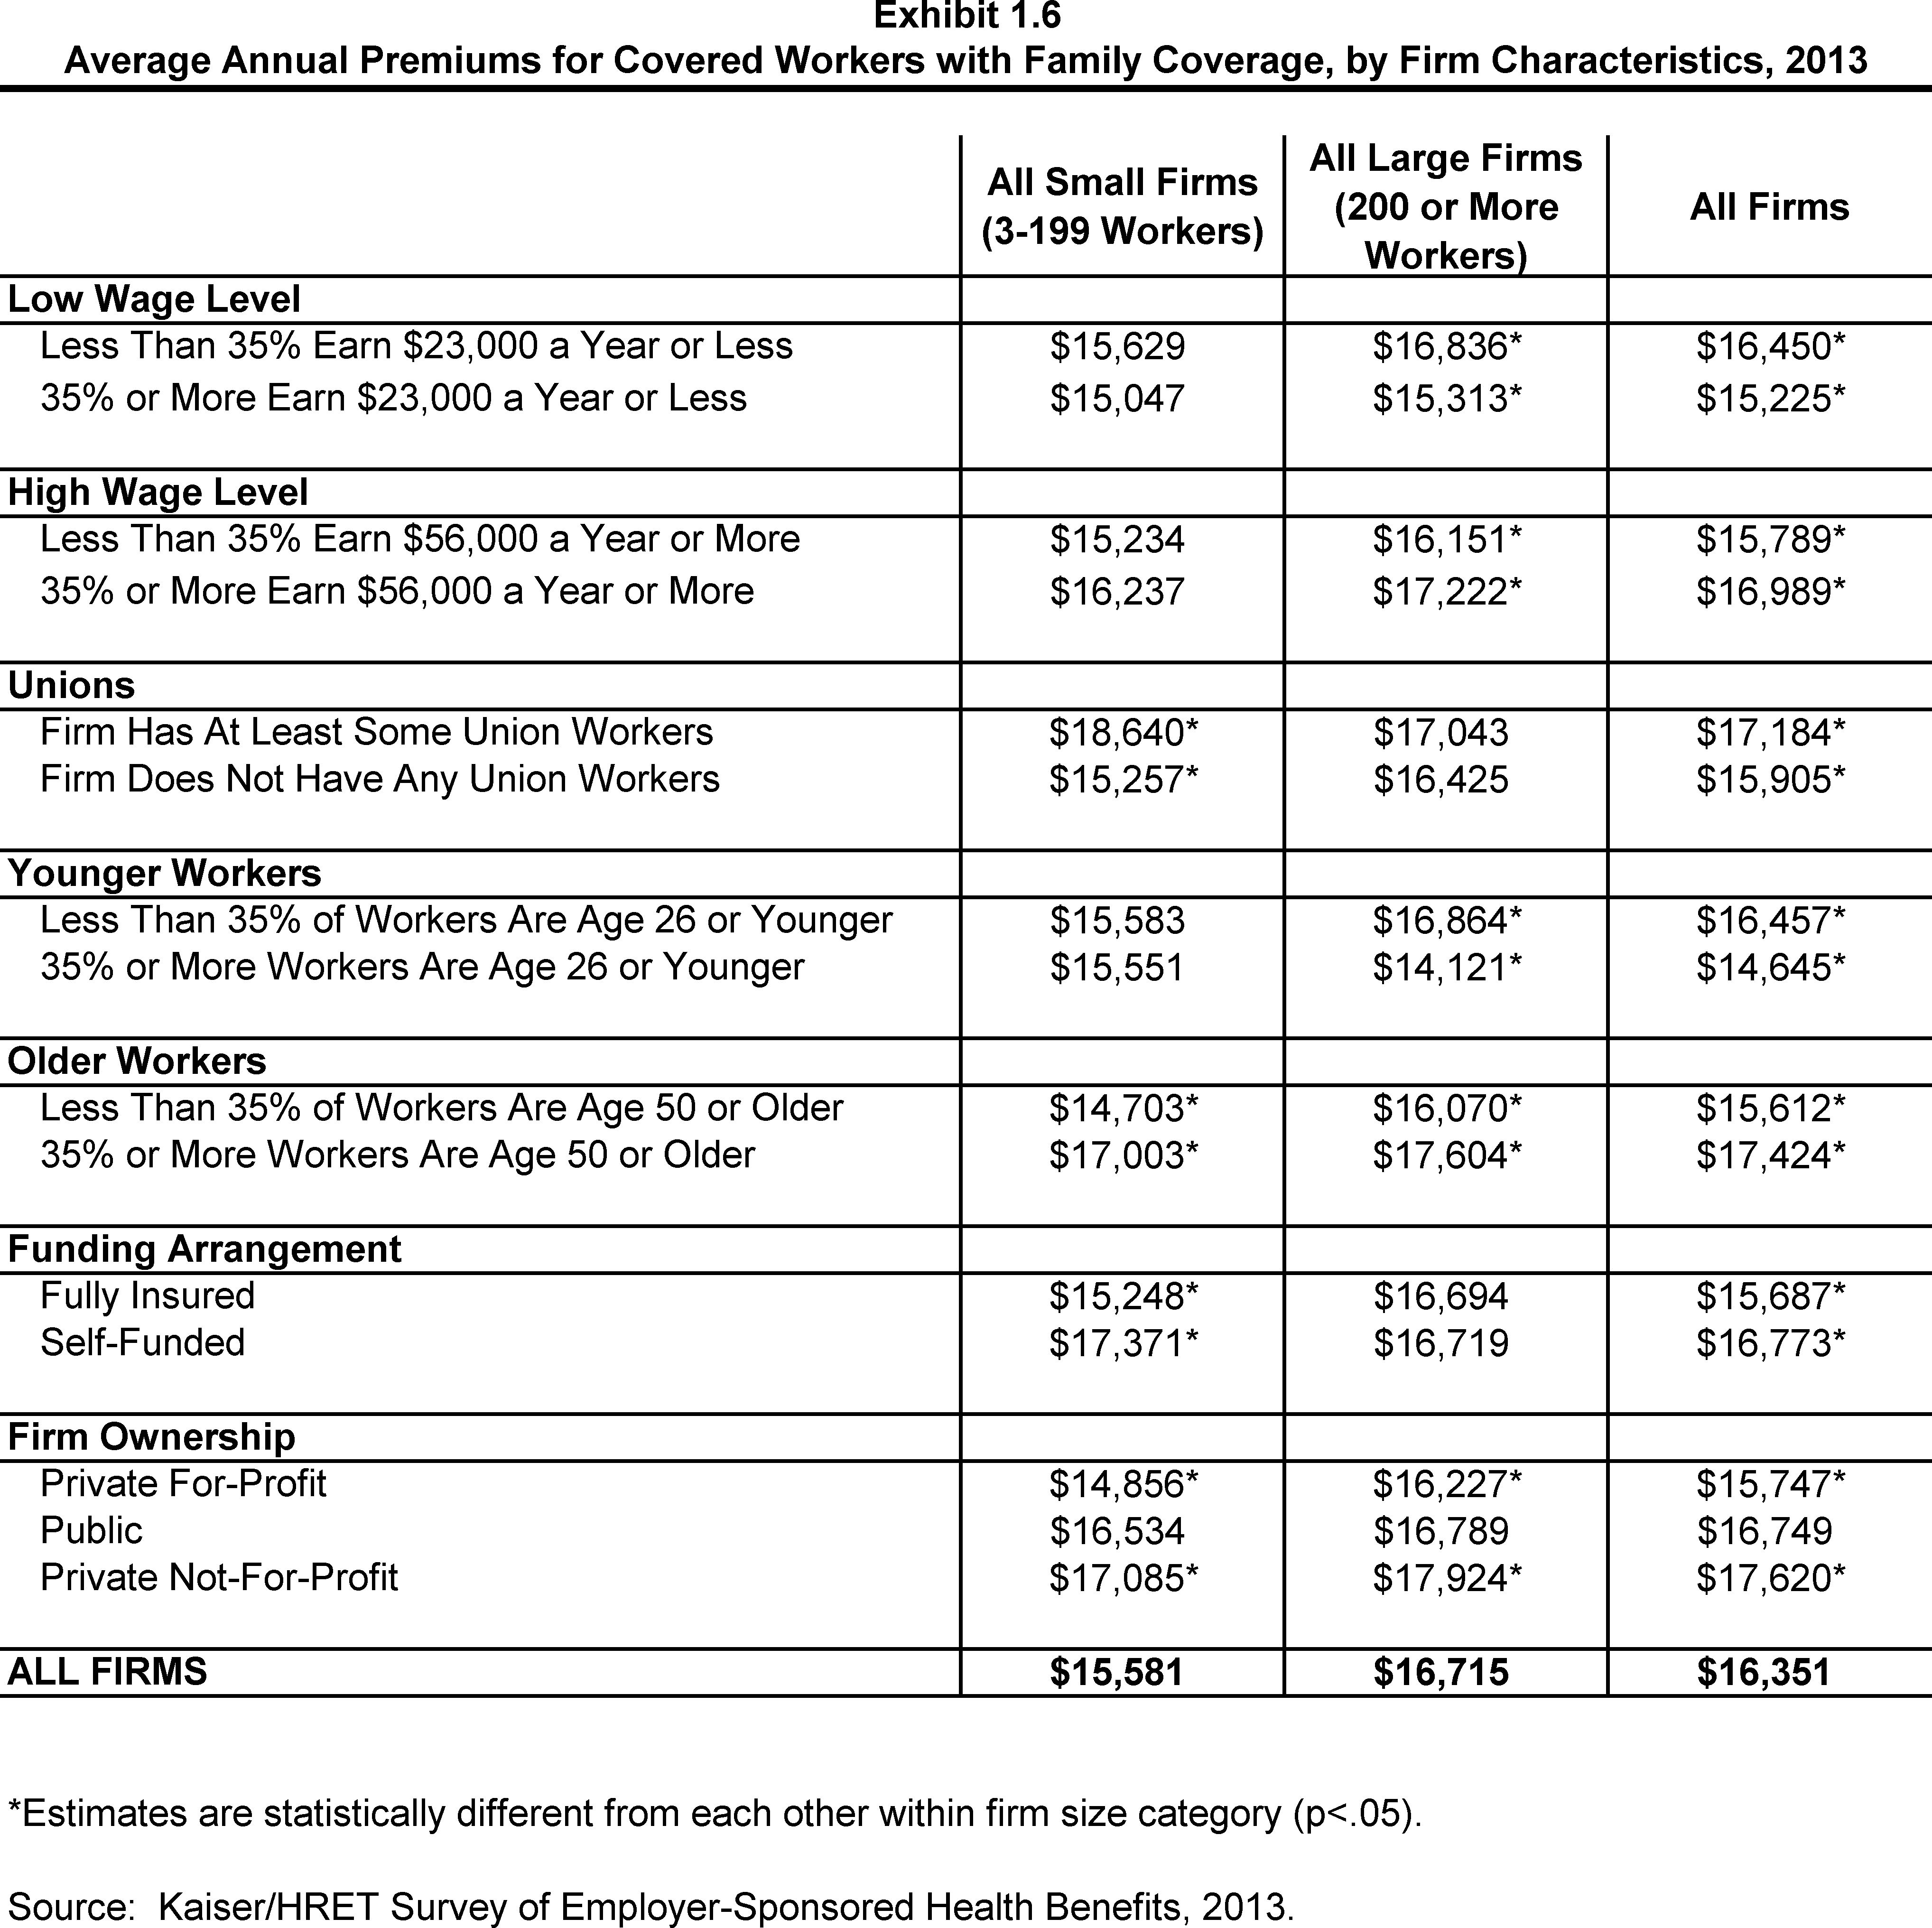
Average Annual Premiums for Covered Workers with Family Coverage, by Firm Characteristics, 2013
Distribution of Annual Premiums for Single and Family Coverage Relative to the Average Annual Single or Family Premium, 2013
Distribution of Premiums for Single and Family Coverage Relative to the Average Annual Single or Family Premium, 2013
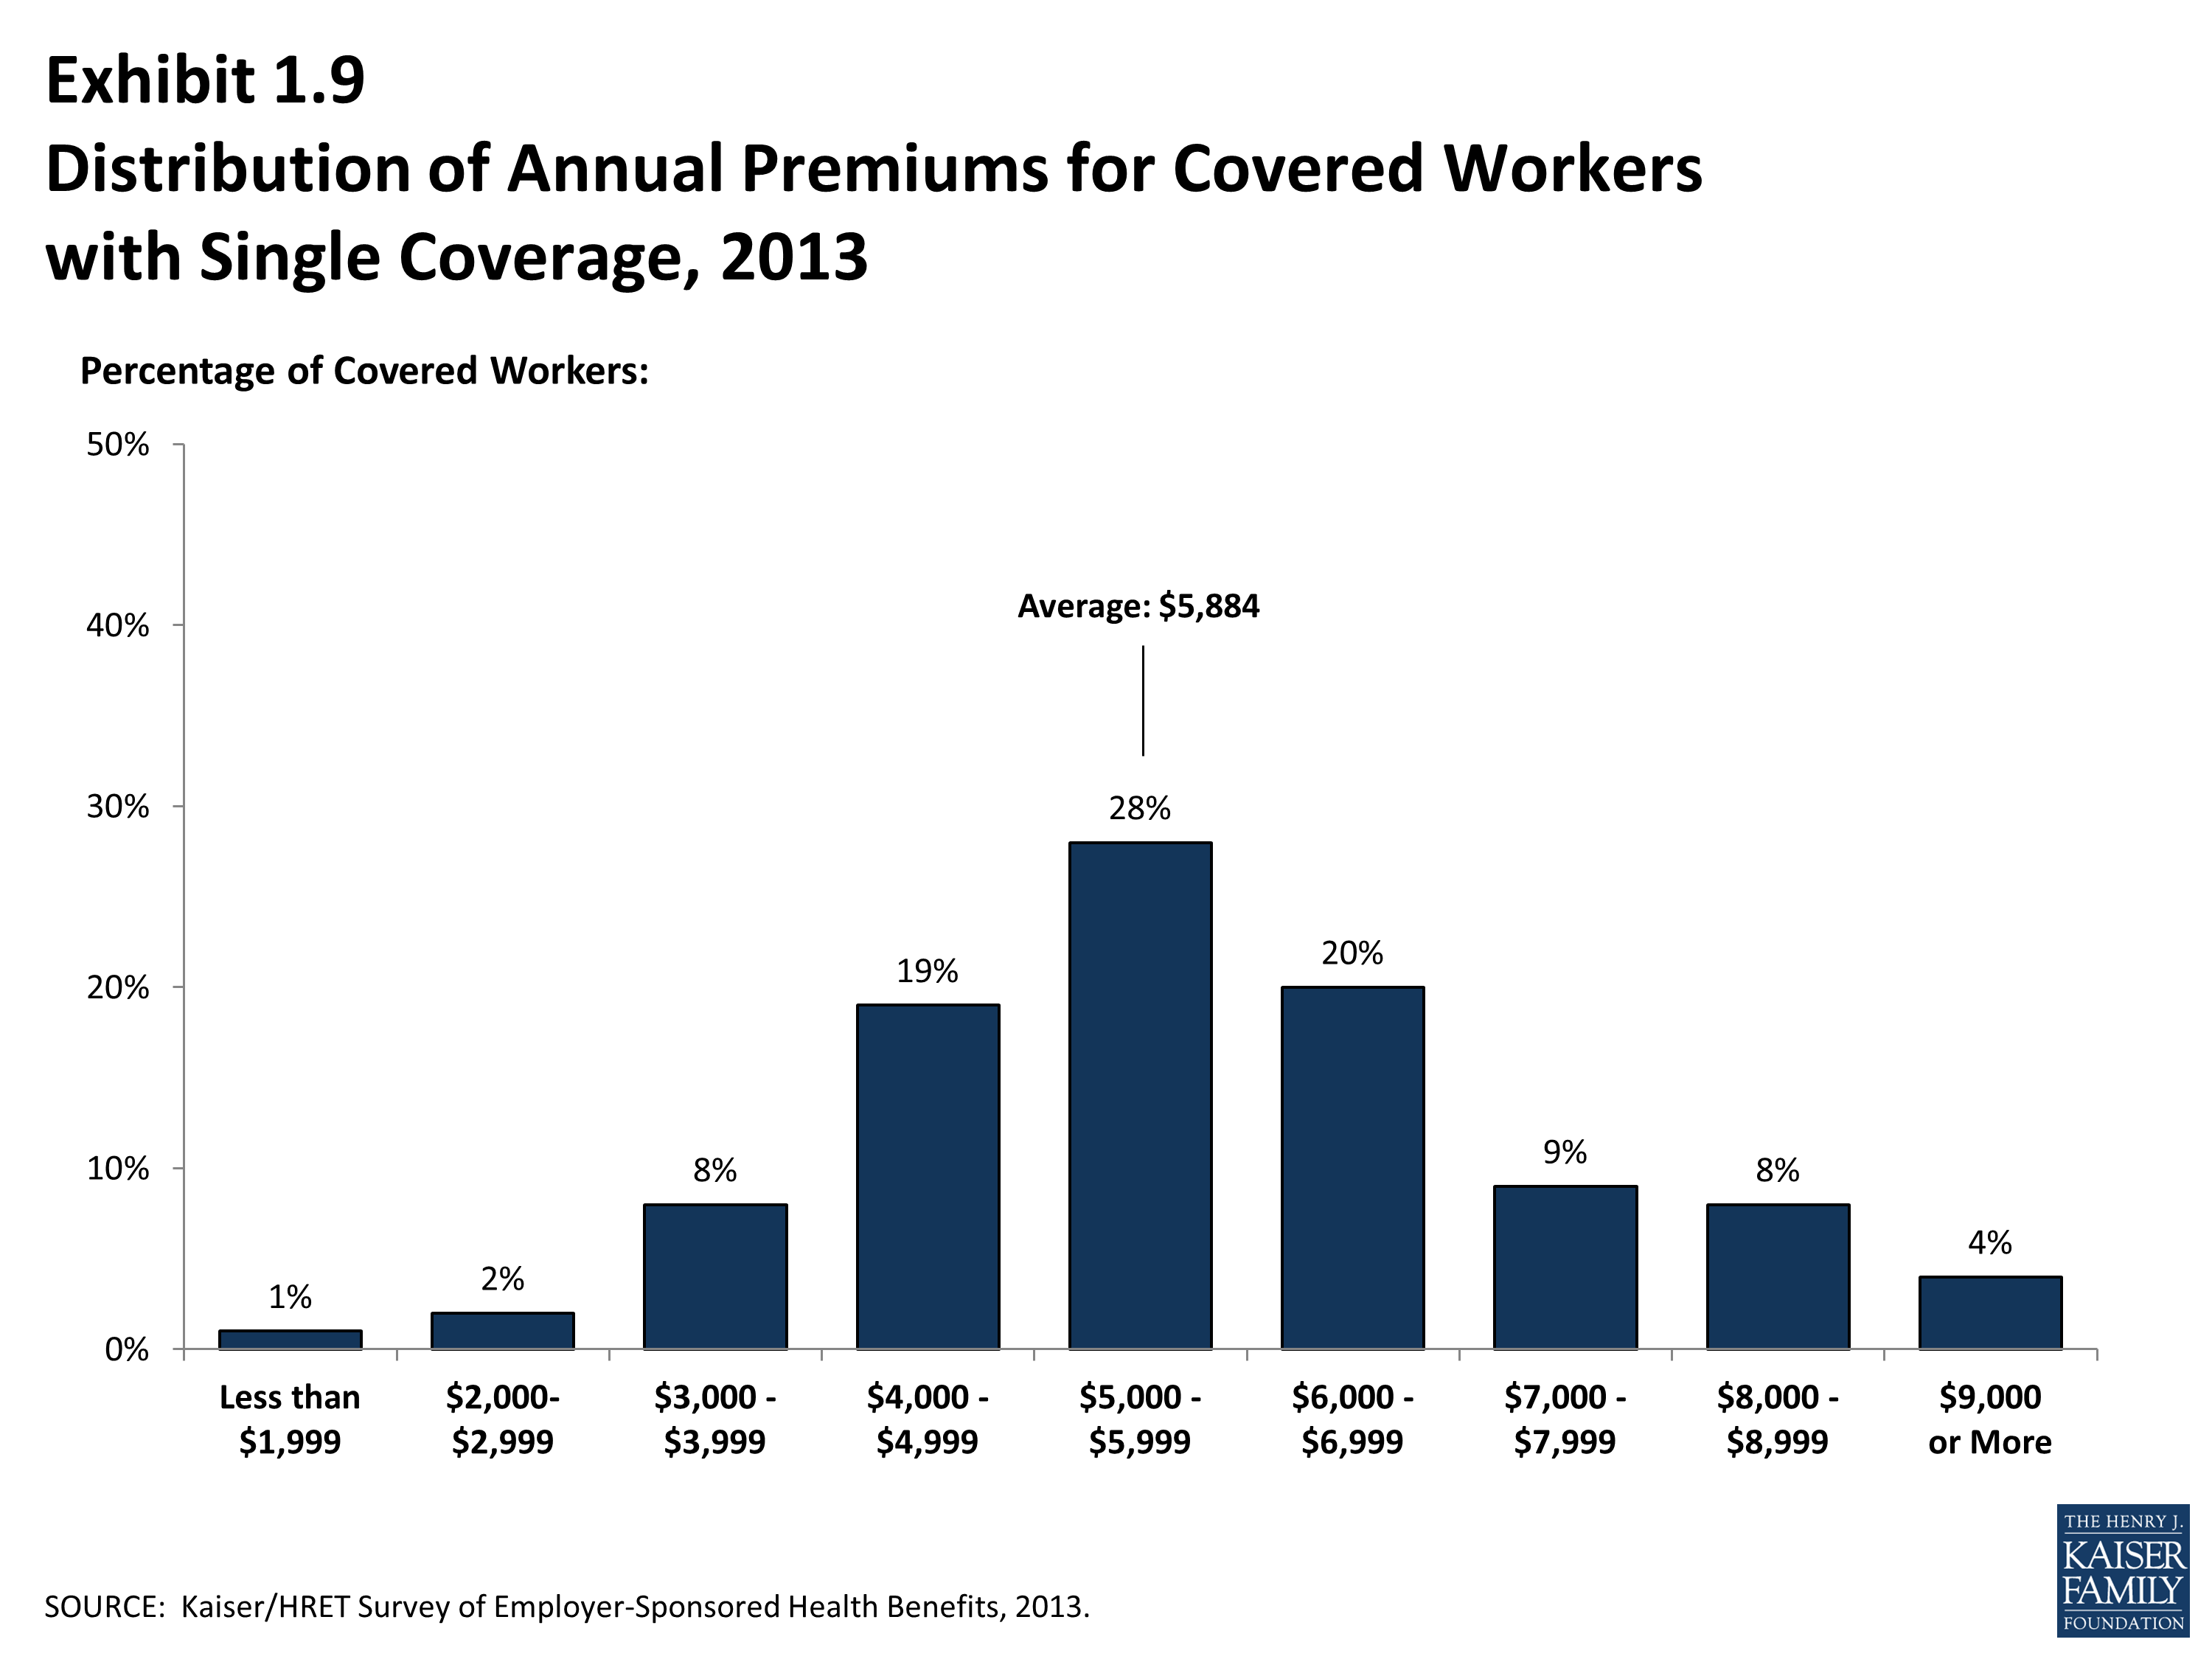
Distribution of Annual Premiums for Covered Workers with Single Coverage, 2013
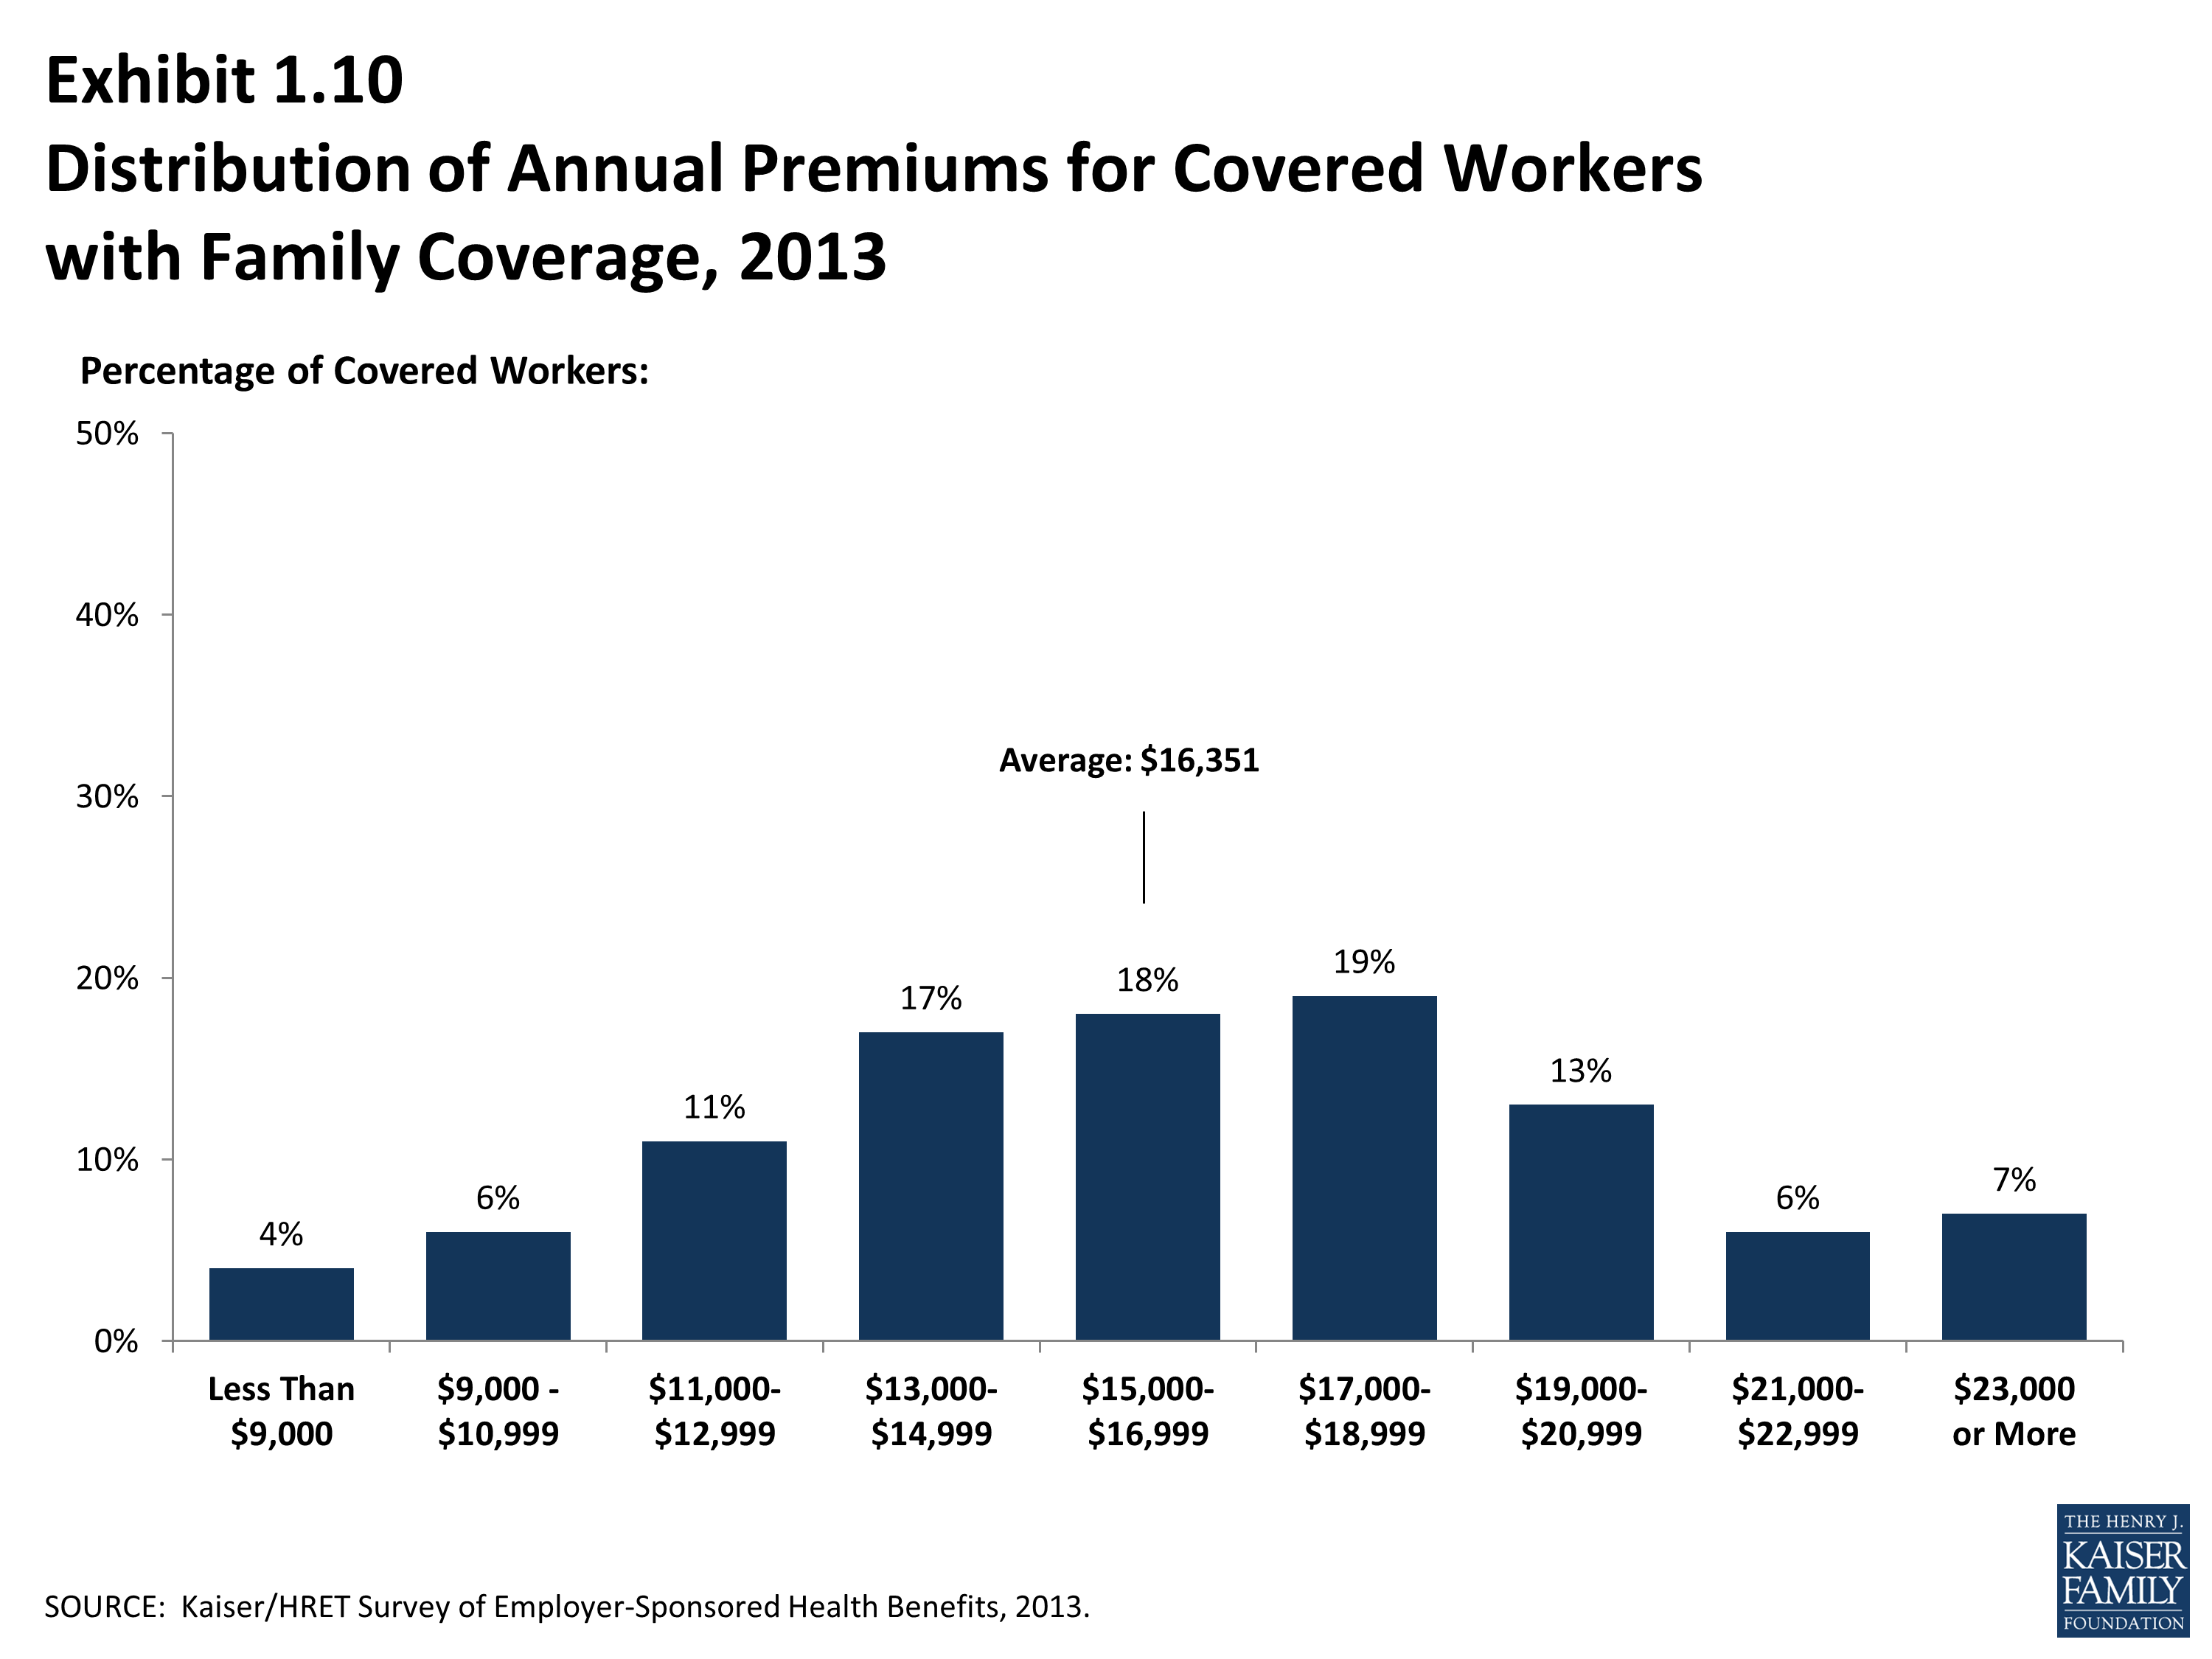
Distribution of Annual Premiums for Covered Workers with Family Coverage, 2013
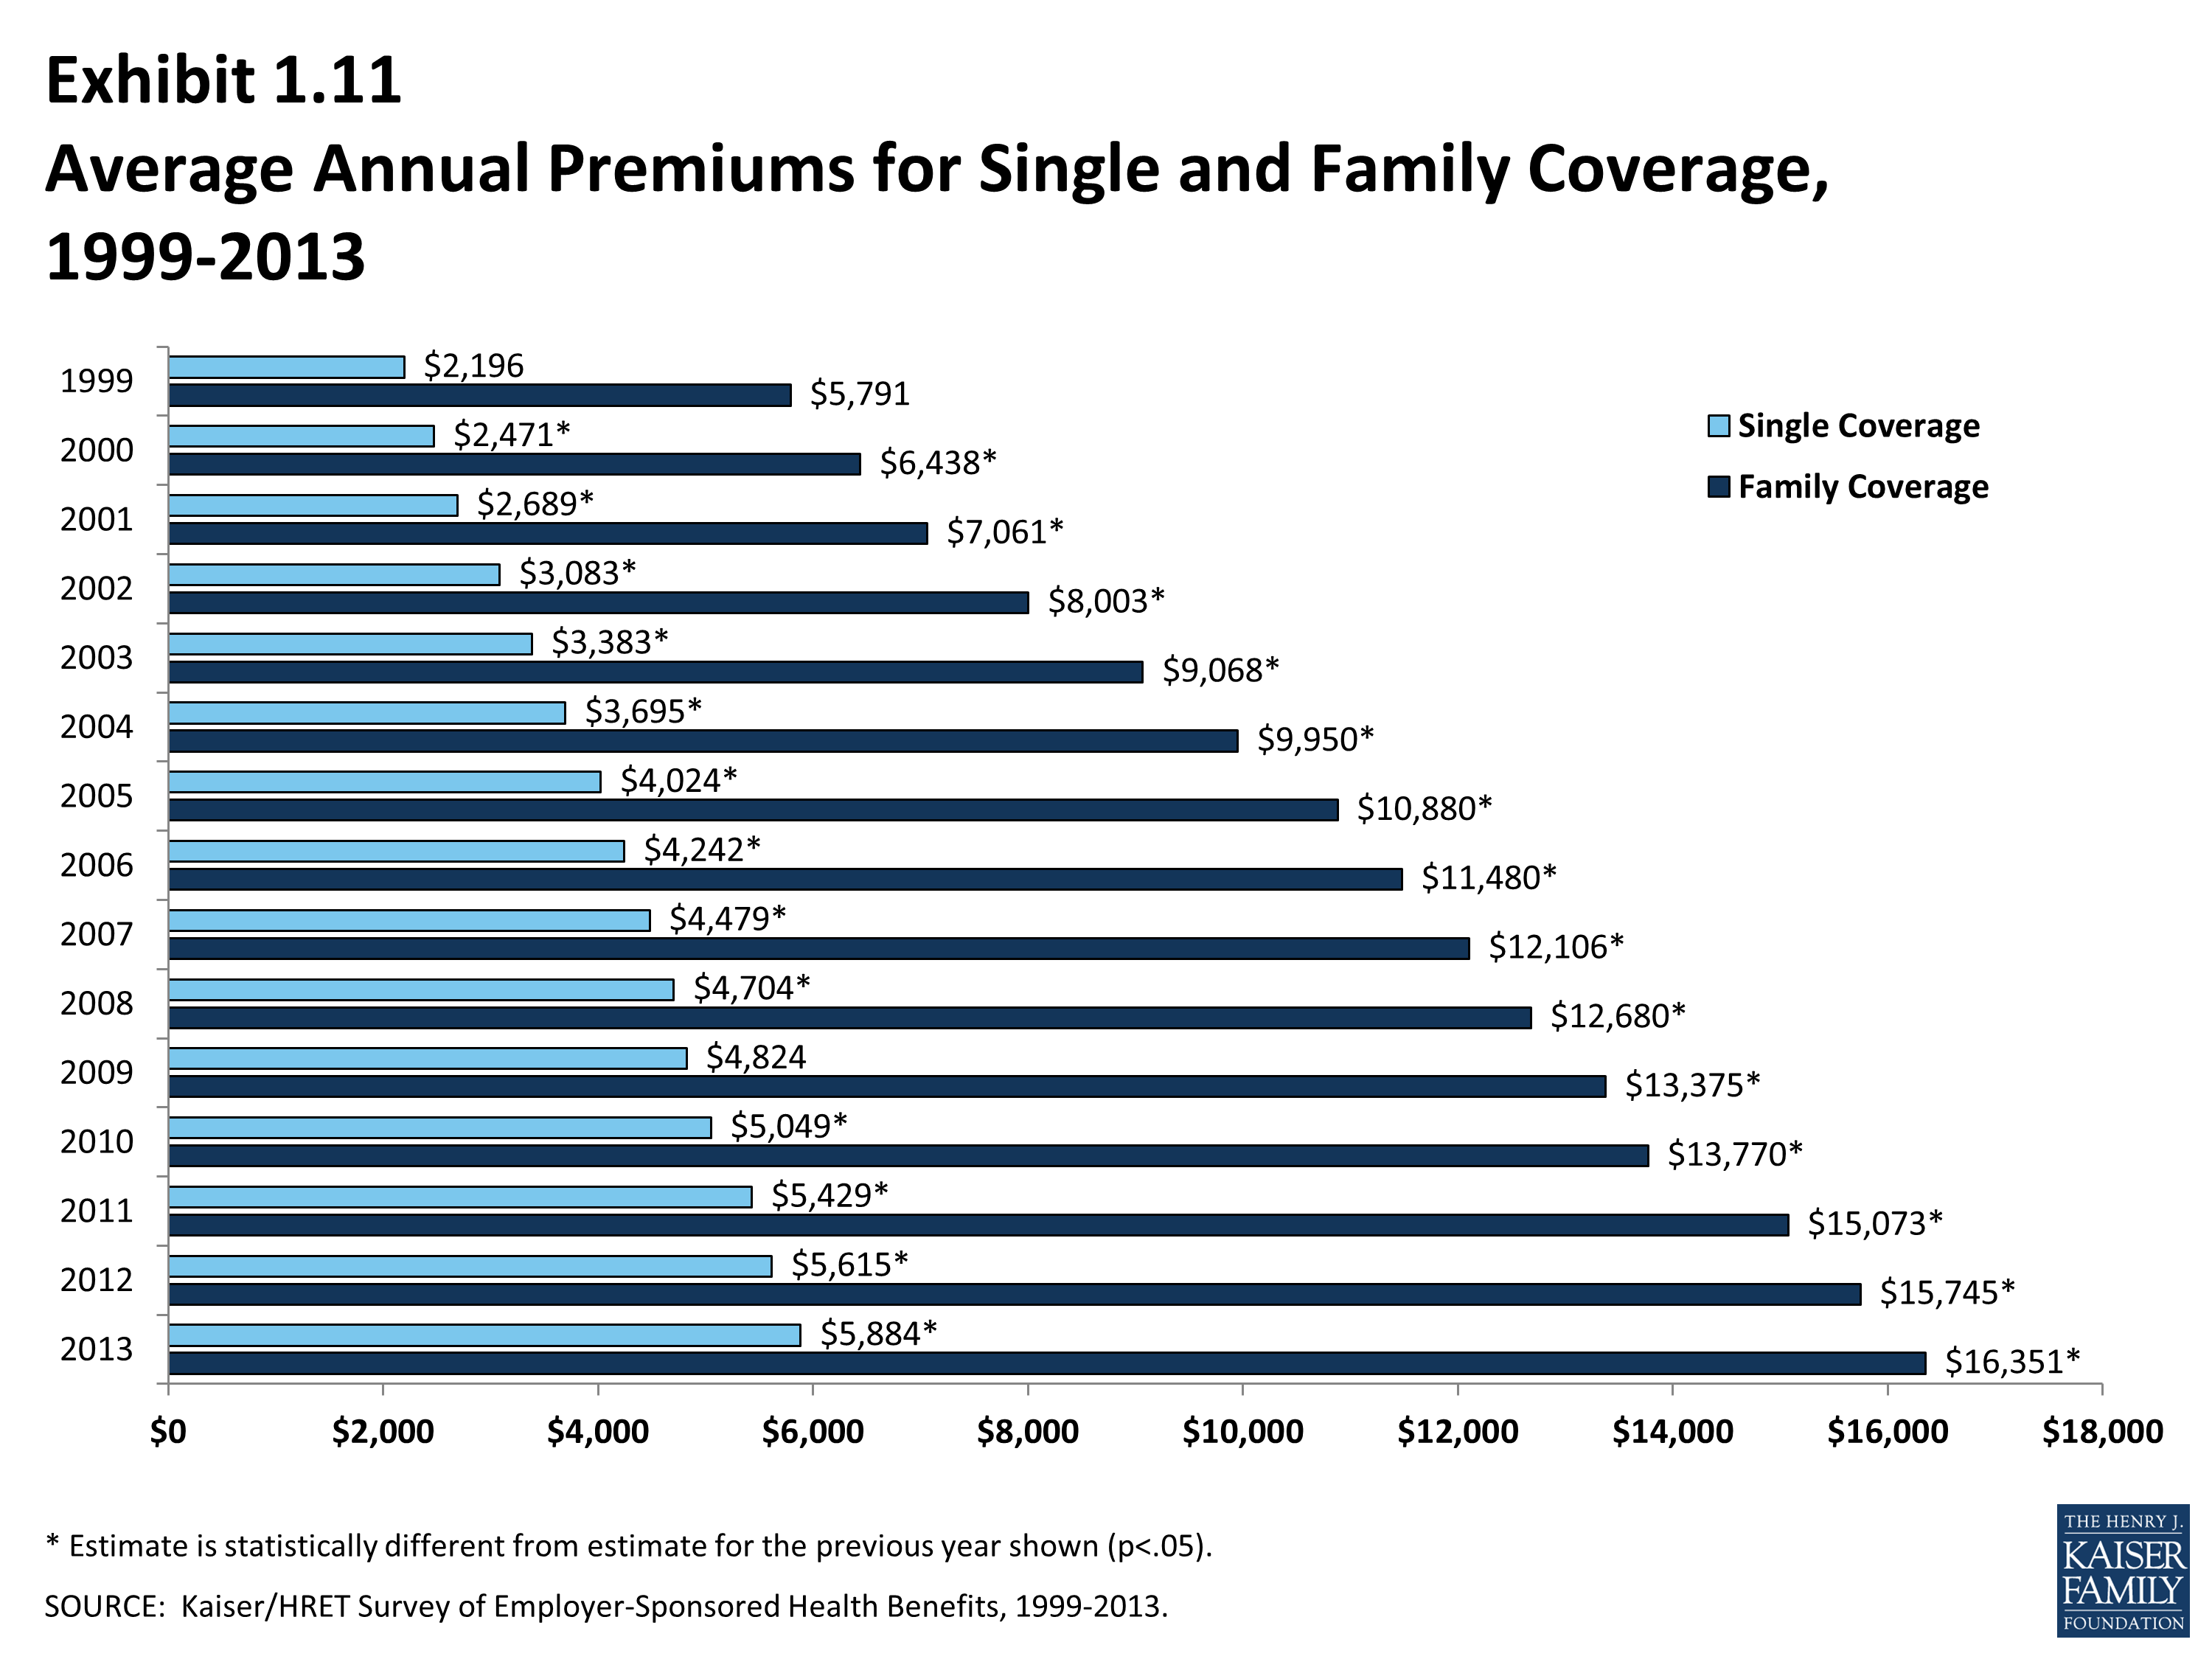
Average Annual Premiums for Single and Family Coverage, 1999-2013
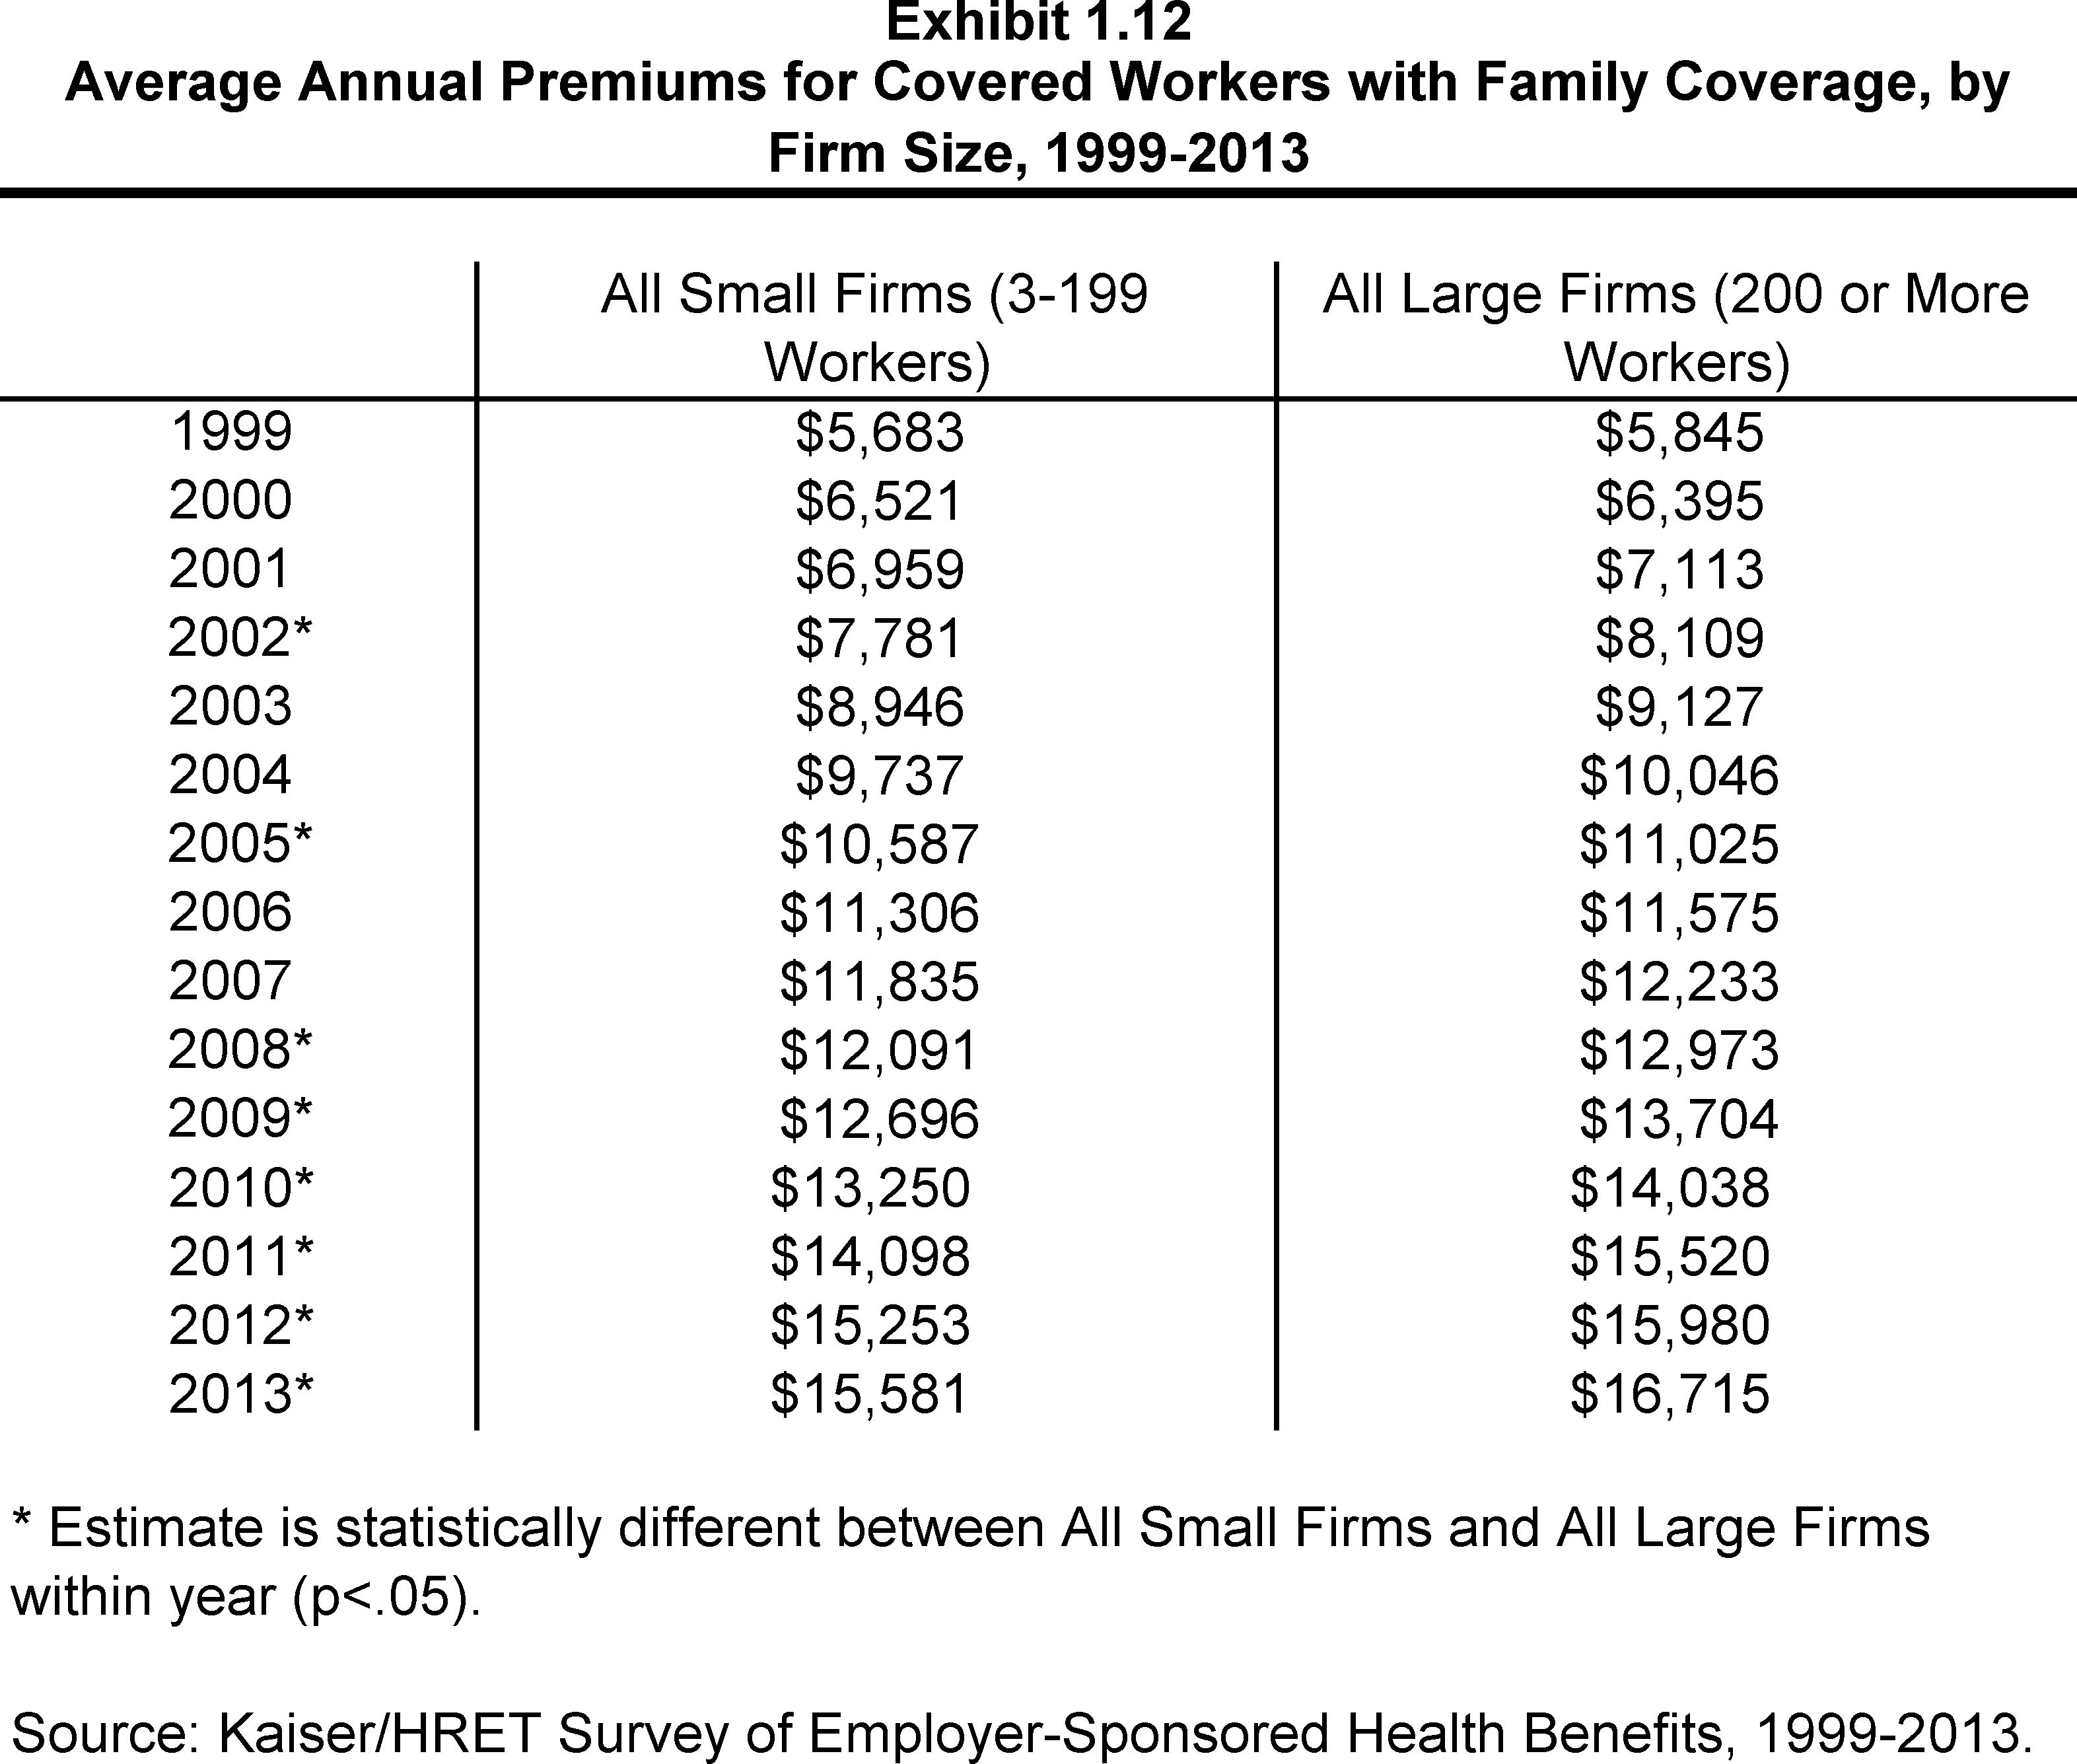
Average Annual Premiums for Covered Workers with Family Coverage, by Firm Size, 1999-2013
Average Annual Premiums for Covered Workers with Family Coverage, by Firm Size, 1999-2013
Among Workers in Large Firms (200 or More Workers), Average Annual Health Insurance Premiums for Family Coverage, by Funding Arrangement, 1999-2013
Section Two: Health Benefits Offer Rates
While nearly all large firms (200 or more workers) offer health benefits, small firms (3-199 workers) are significantly less likely to do so. The percentage of all firms offering health benefits in 2013 (57%) is statistically unchanged from 2012 and 2011 (61% and 60%).
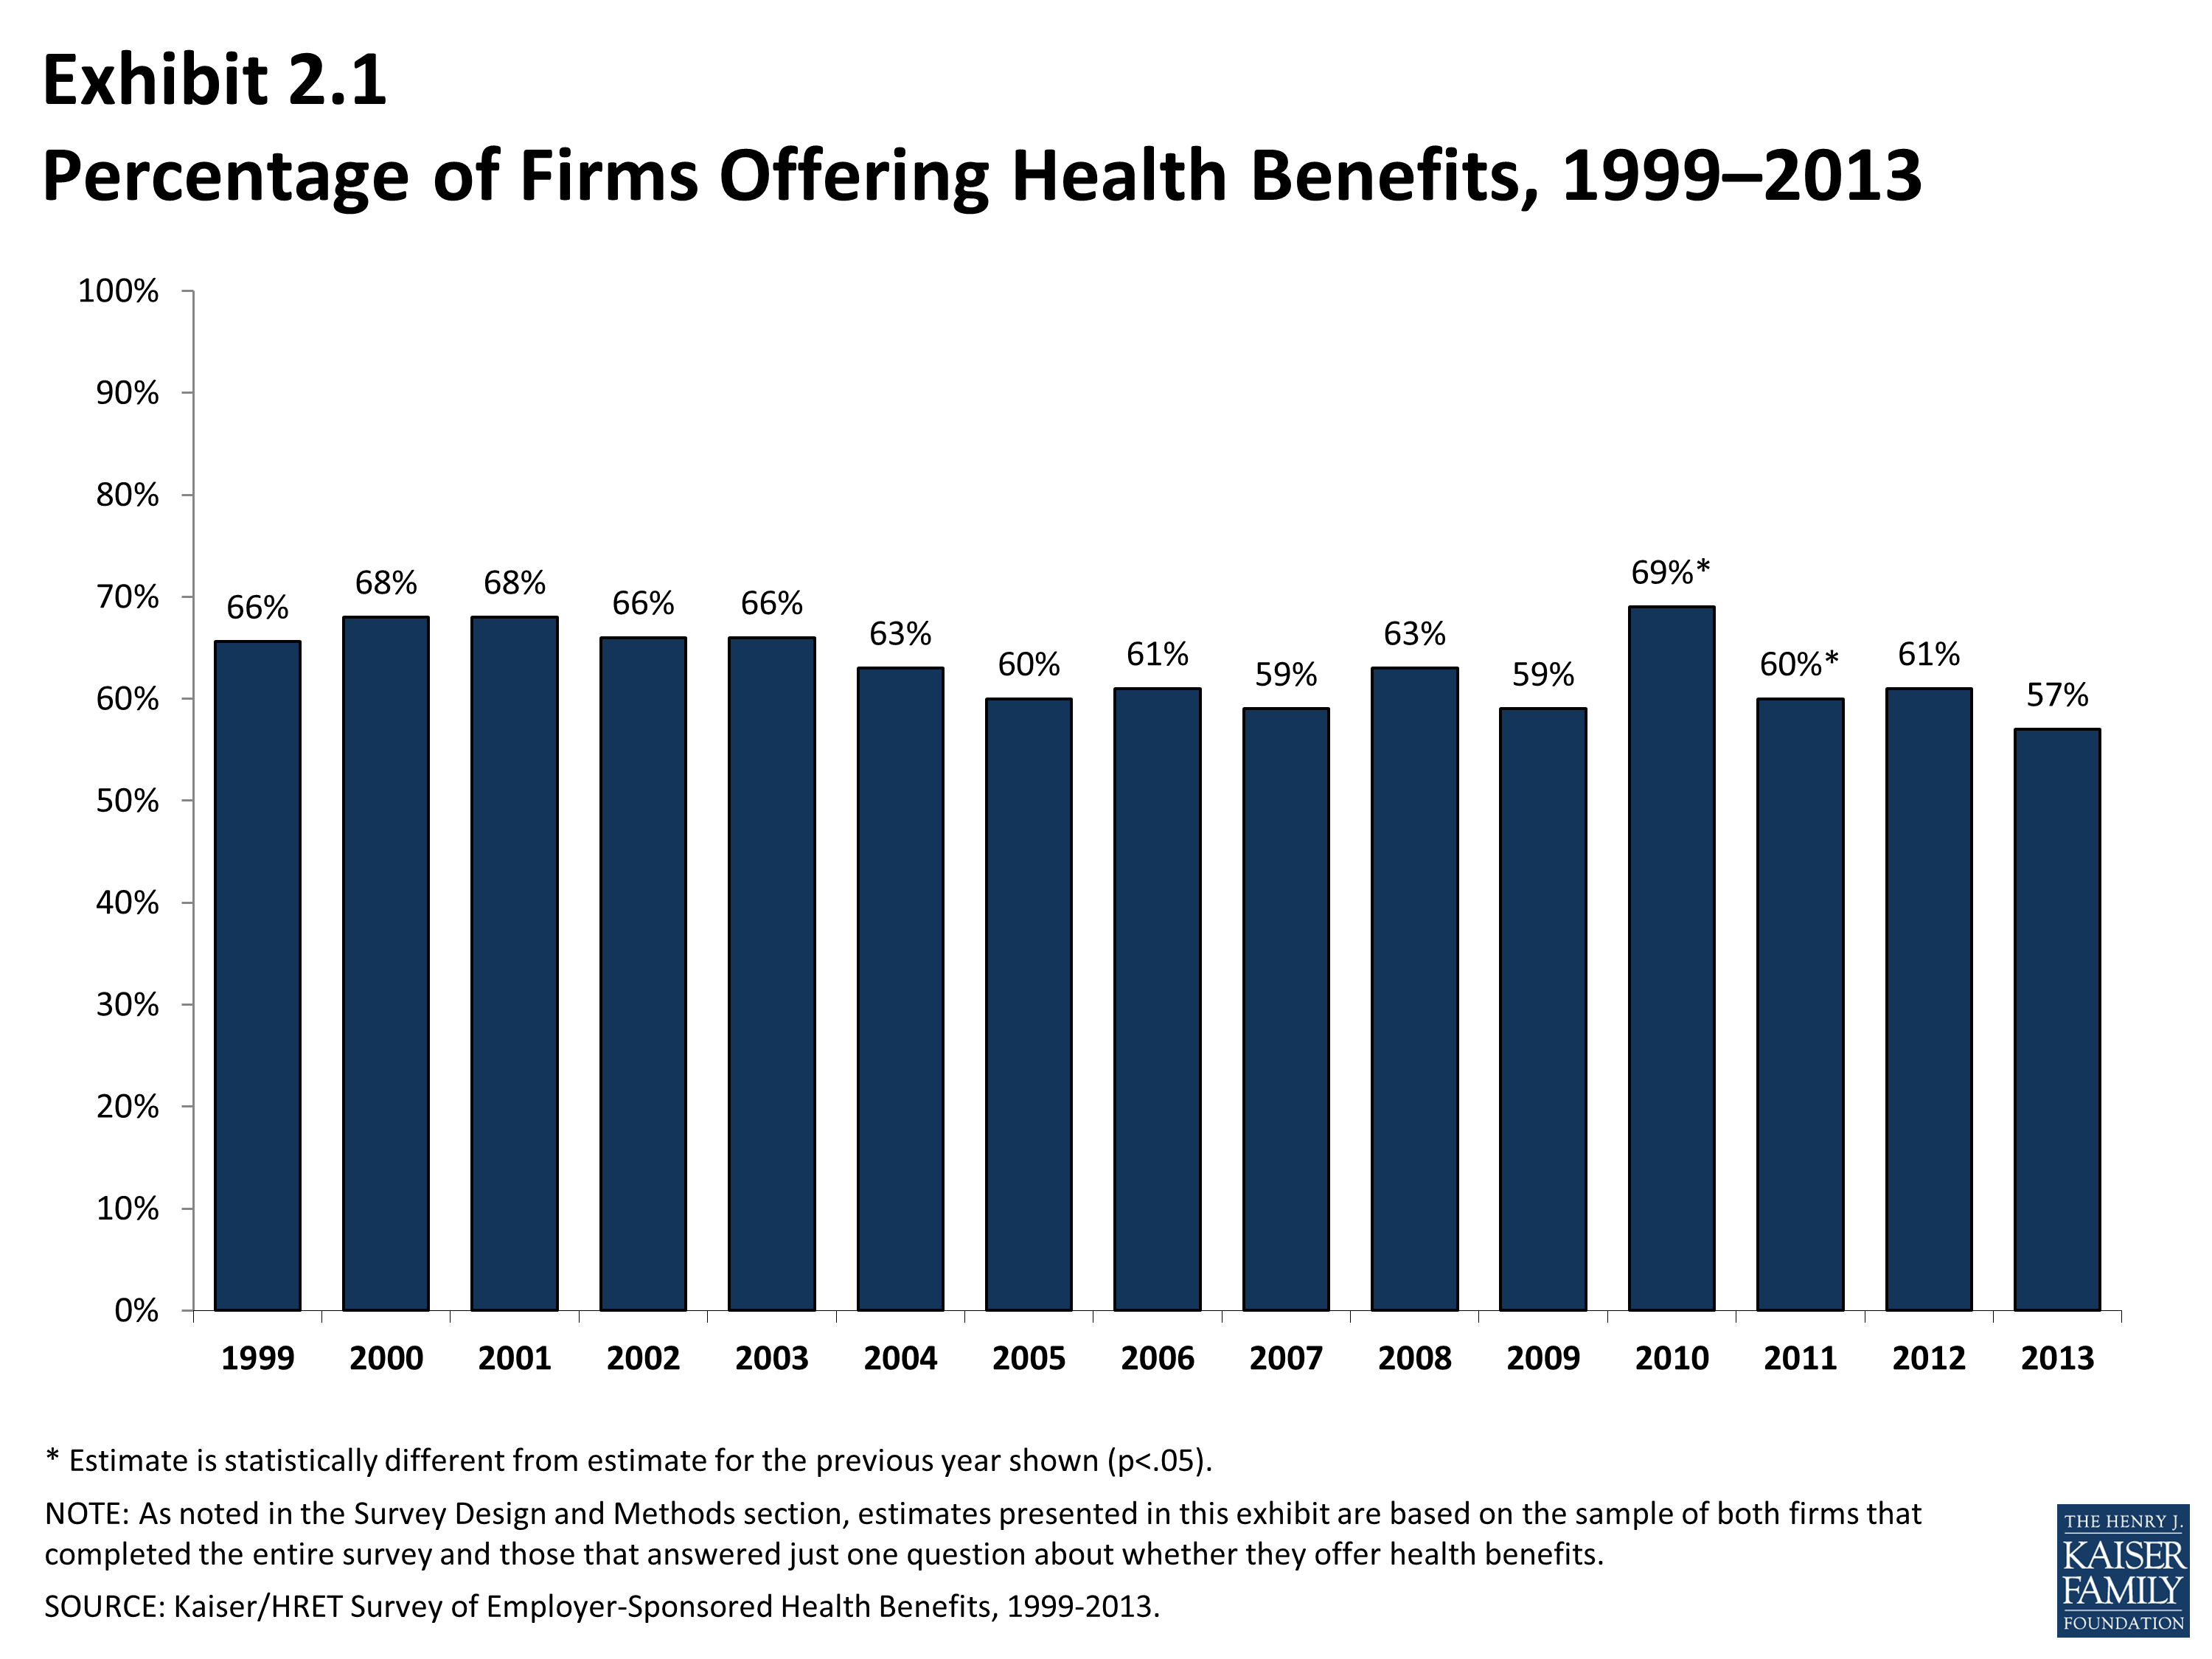
- In 2013, 57% of firms offer health benefits, statistically unchanged from the 61% reported in 2012 (Exhibit 2.1).
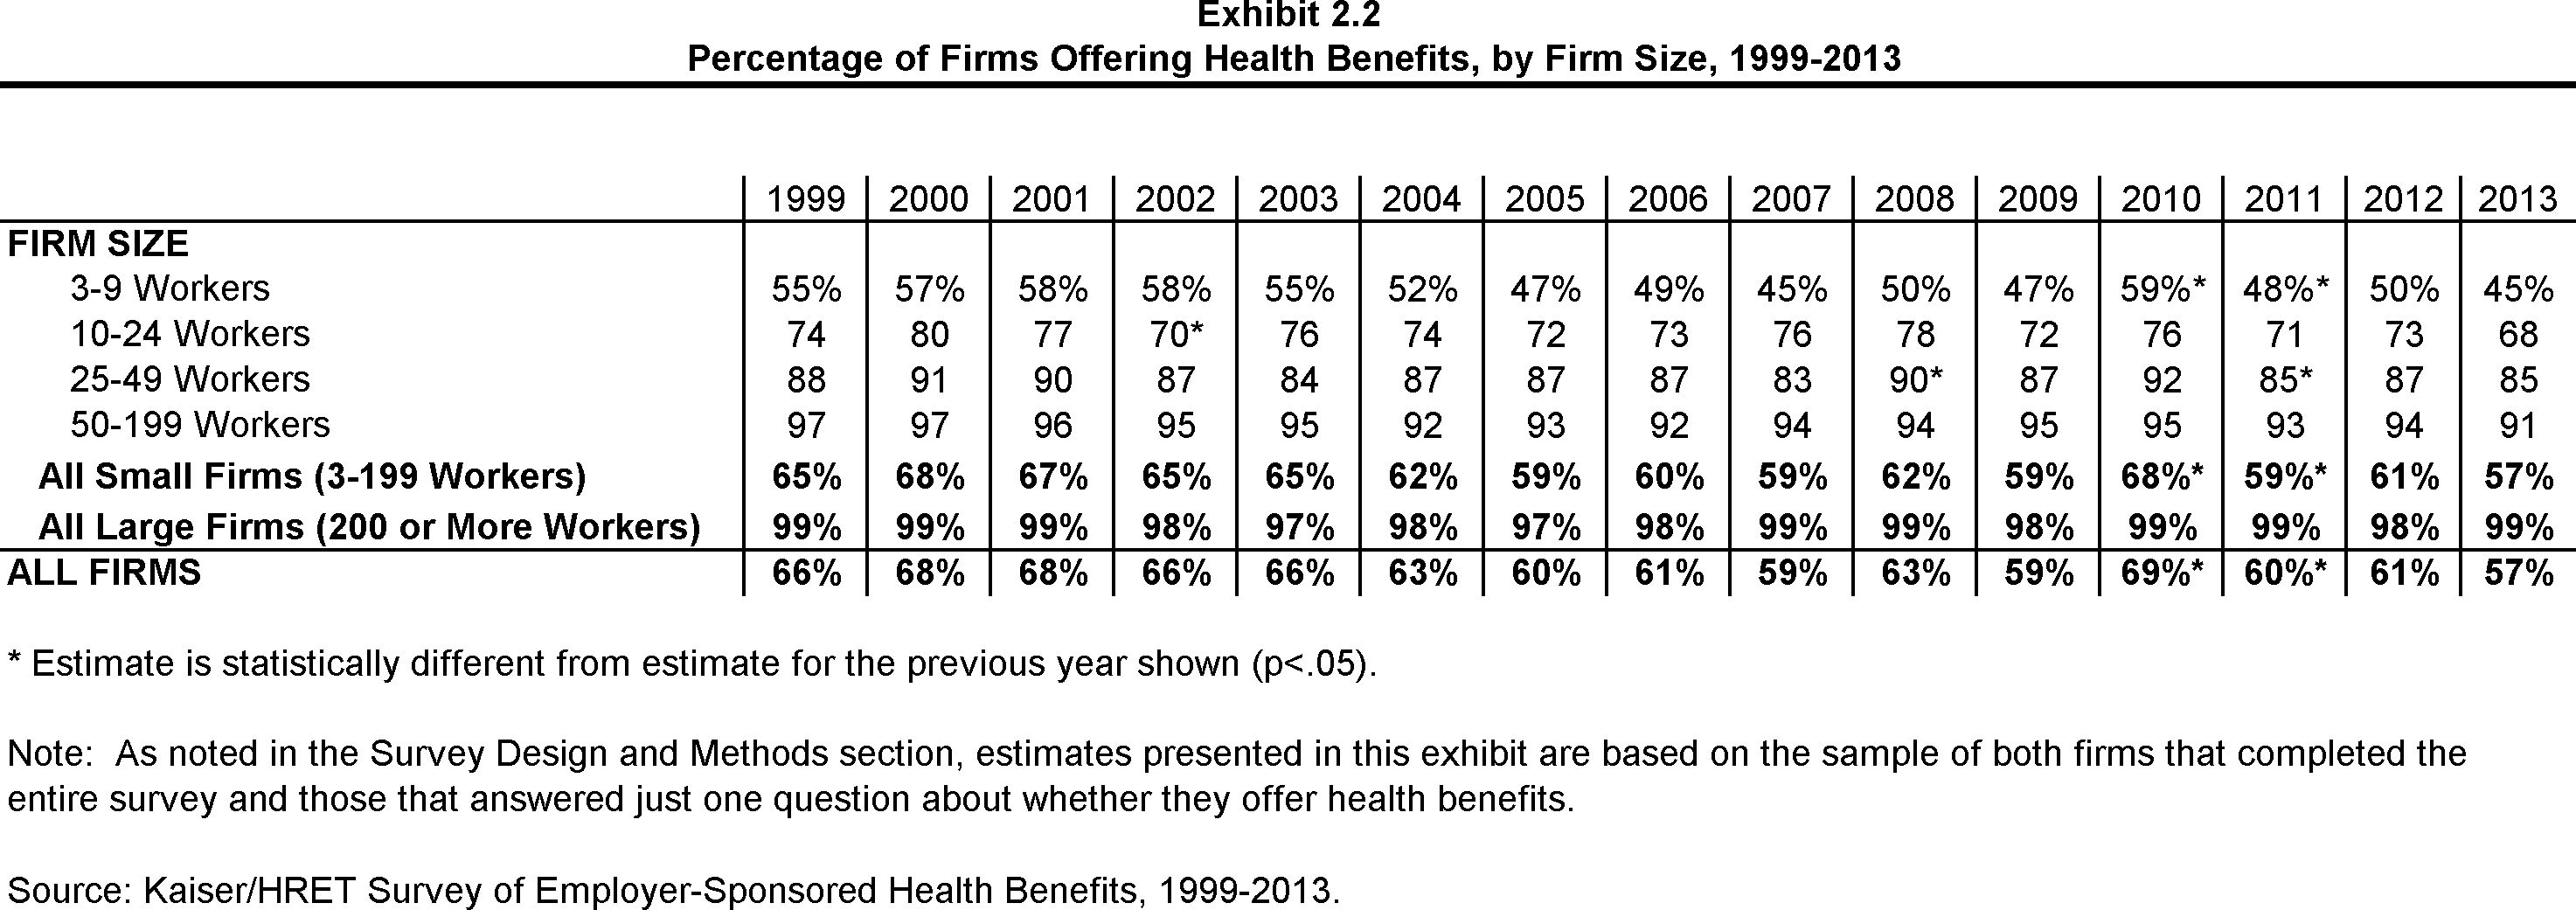
- Similar to 2012, 99% of large firms (200 or more workers) offer health benefits to at least some of their workers (Exhibit 2.2). In contrast, only 57% of small firms (3-199 workers) offer health benefits in 2013.
- Between 1999 and 2013, the offer rate for large firms (200 or more workers) has consistently remained at or above 97%. Since most firms in the country are small, variation in the overall offer rate is driven primarily by changes in the percentages of the smallest firms (3-9 workers) offering health benefits.
- Offer rates vary across different types of firms.
- Smaller firms are less likely to offer health insurance: 45% of firms with 3 to 9 workers offer coverage, compared to 68% of firms with 10 to 24 workers, 85% of firms with 25 to 49 workers, and 91% of firms with 50 to 199 employees (Exhibit 2.3).
- Offering rates throughout different firm size categories in 2013 remained similar to those in 2012 (Exhibit 2.2).
- Firms with fewer lower-wage workers (less than 35% of workers earn $23,000 or less annually) are significantly more likely to offer health insurance than firms with many lower-wage workers (35% or more of workers earn $23,000 or less annually) (60% vs. 23%) (Exhibit 2.4). The offer rate for firms with many lower-wage workers is not significantly different from the 28% reported in 2012. We observe a similar pattern among firms with many higher-wage workers (35% or more of workers earn $56,000 or more annually) (Exhibit 2.4).
- The age of the workforce significantly affects the probability of a firm offering health benefits. Firms where 35% or more of its workers are age 26 or younger are less likely to offer health benefits than firms where less than 35% of workers are age 26 or younger (23% and 59%, respectively) (Exhibit 2.4).
- Among firms offering health benefits, relatively few offer benefits to their part-time and temporary workers.
- In 2013, 25% of all firms that offer health benefits offer them to part-time workers, similar to the 28% reported in 2012 (Exhibit 2.5). Offering firms with 200 or more workers are more likely to offer health benefits to part-time employees than firms with 3 to 199 workers (47% vs. 25%) (Exhibit 2.7).
- Consistently, a very small percentage (3% in 2013) of firms offering health benefits have offered them to temporary workers (Exhibit 2.6). The percentage of firms offering temporary workers benefits is similar for small firms (3-199 workers) and large firms (200 or more workers) (3% vs. 6%) (Exhibit 2.8). The percentage of firms offering health benefits to temporary workers has been stable over time.
Firms Not Offering Health Benefits
- The survey asks firms that do not offer health benefits if they have offered insurance or shopped for insurance in the recent past, and about their most important reasons for not offering. Because such a small percentage of large firms report not offering health benefits, we present responses for smaller firms (3 to 199 workers) that do not offer health benefits.
- The cost of health insurance remains the primary reason cited by firms for not offering health benefits. Among small firms (3-199 workers) not offering health benefits, 50% cite high cost as “the most important reason” for not doing so, followed by: “firm is too small” (16%) and “employees are generally covered under another plan” (15%) (Exhibit 2.9).
- Many non-offering, small firms have either offered health benefits in the past five years, or shopped for alternative coverage options recently.
- Seventeen percent of non-offering, small firms (3-199 workers) have offered health benefits in the past five years, while 18% have shopped for coverage in the past year (Exhibit 2.10).
- Among non-offering, small firms (3-199 workers), 10% report that they provide funds to their employees to purchase health insurance through the individual (non-group) market (Exhibit 2.11).
Percentage of Firms Offering Health Benefits, 1999–2013
Percentage of Firms Offering Health Benefits, by Firm Size, 1999-2013
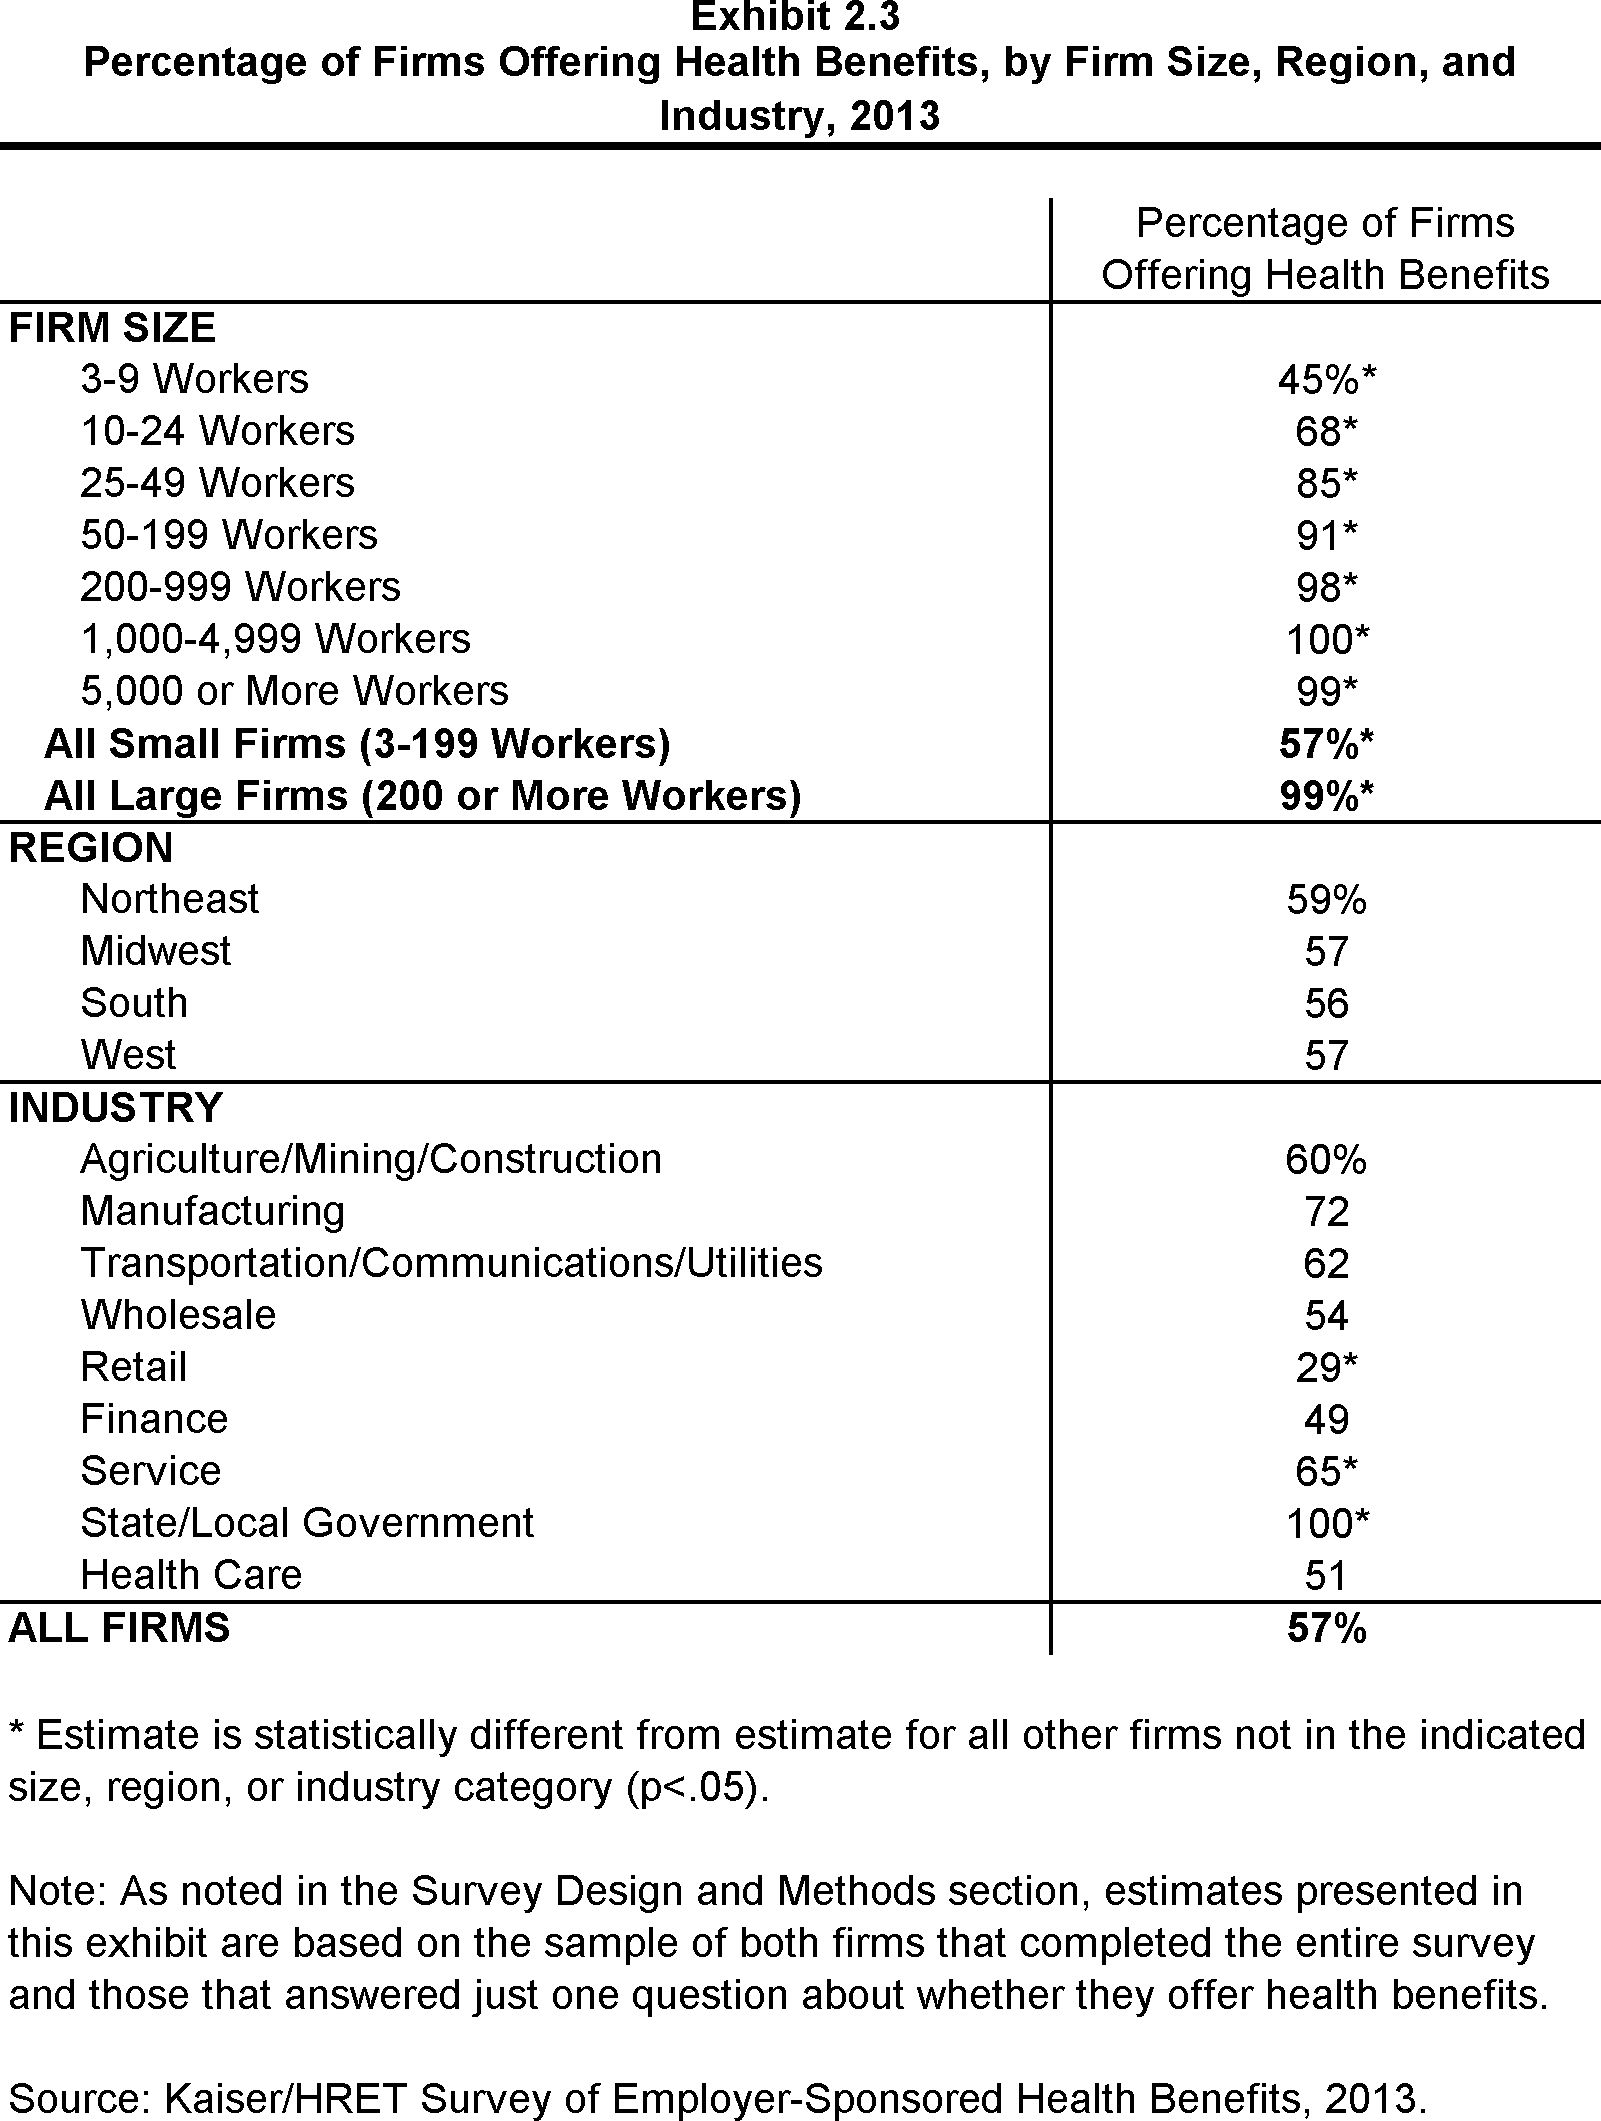
Percentage of Firms Offering Health Benefits, by Firm Size, Region, and Industry, 2013
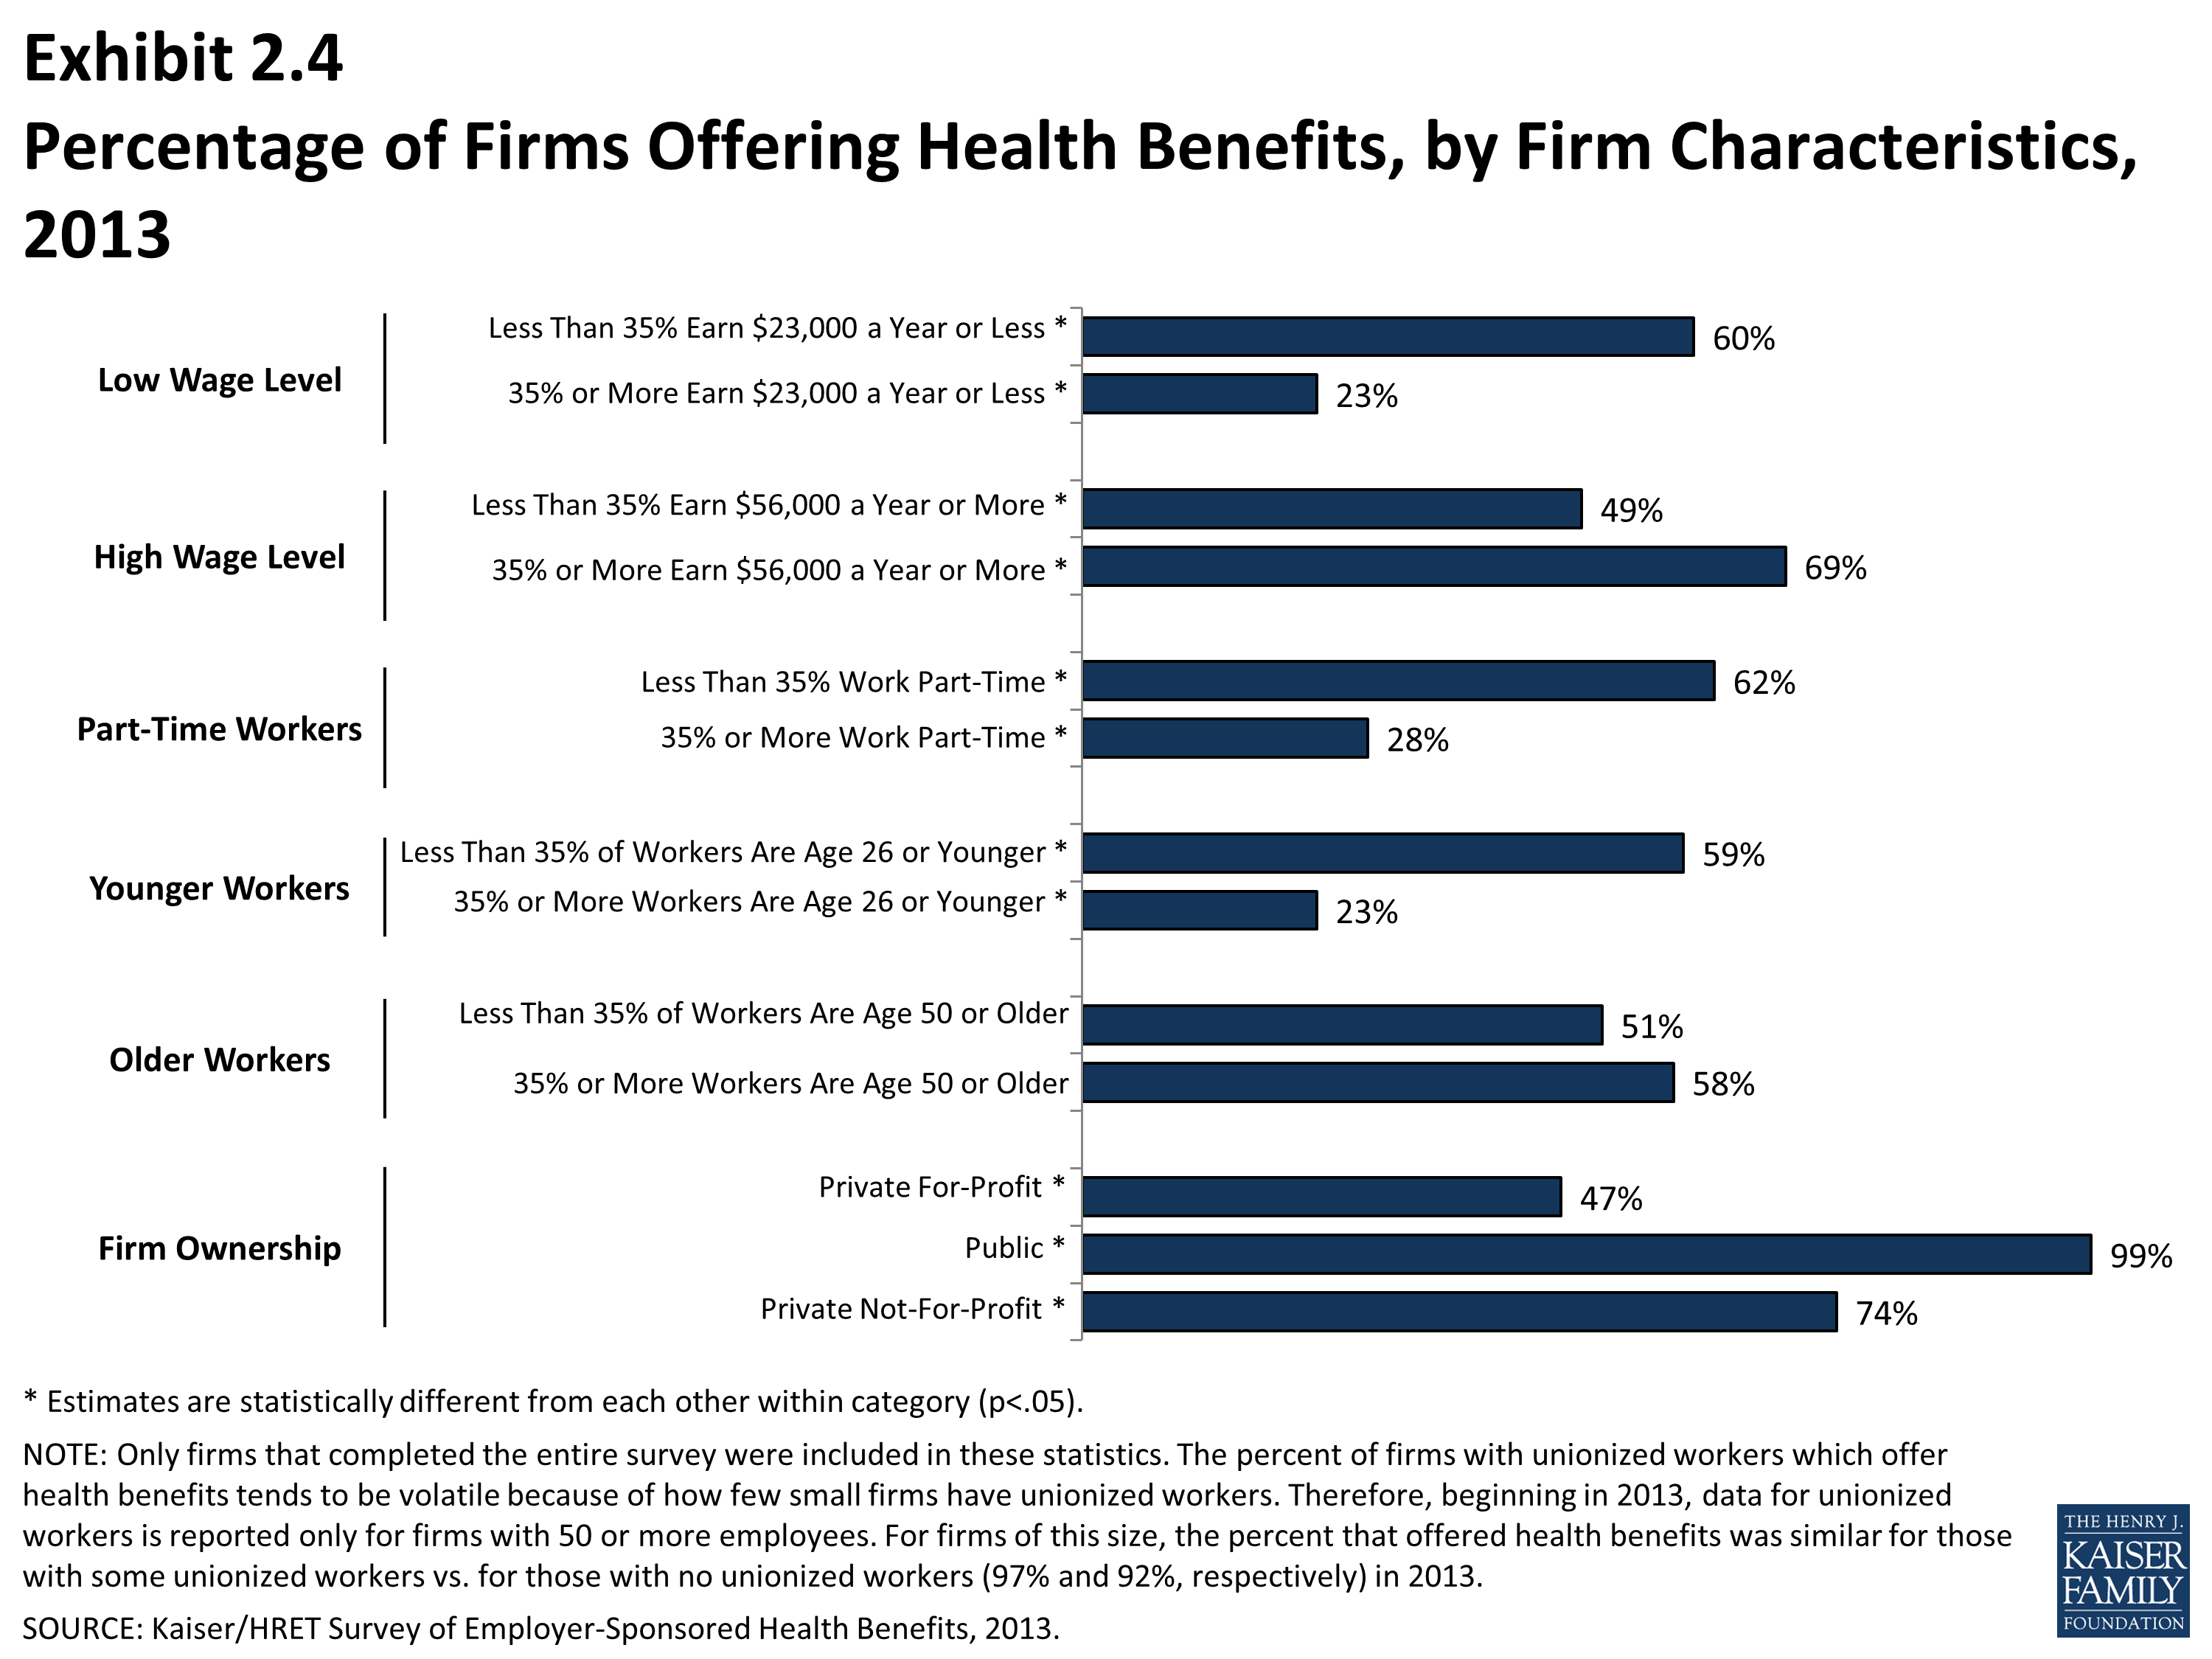
Percentage of Firms Offering Health Benefits, by Firm Characteristics, 2013
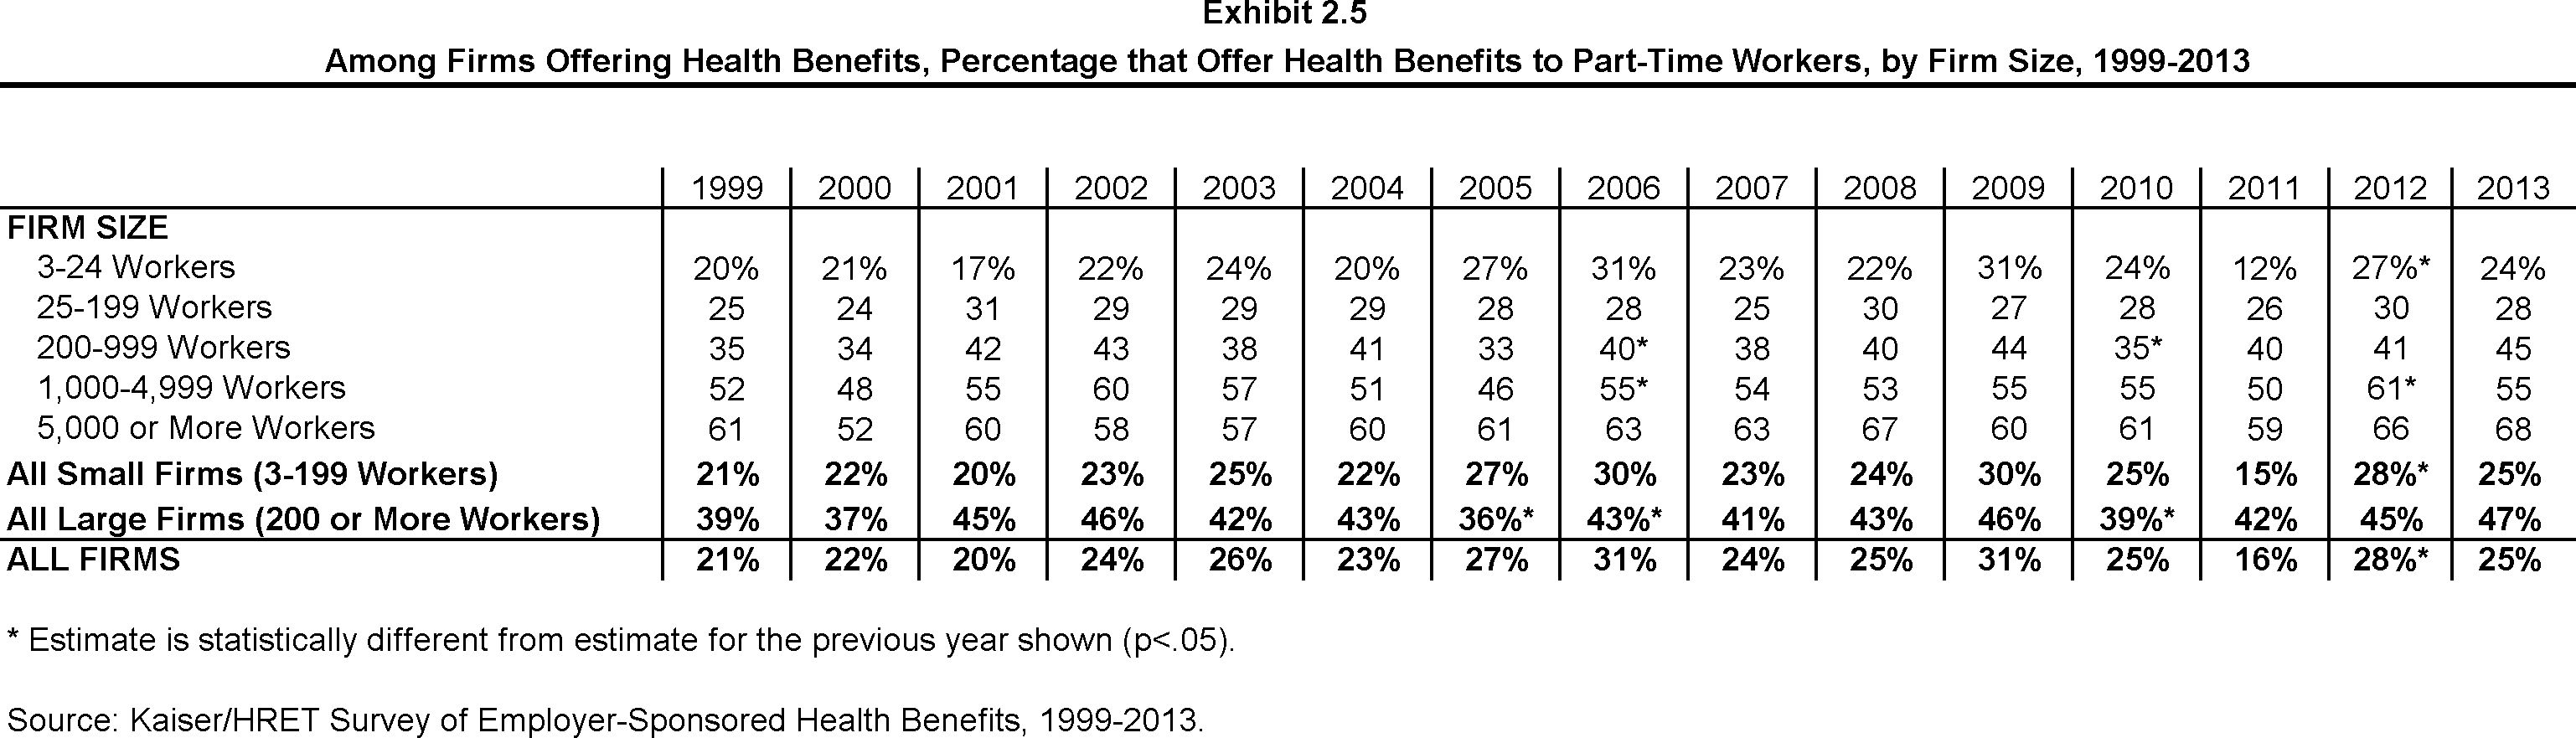
Among Firms Offering Health Benefits, Percentage that Offer Health Benefits to Part-Time Workers, by Firm Size, 1999-2013
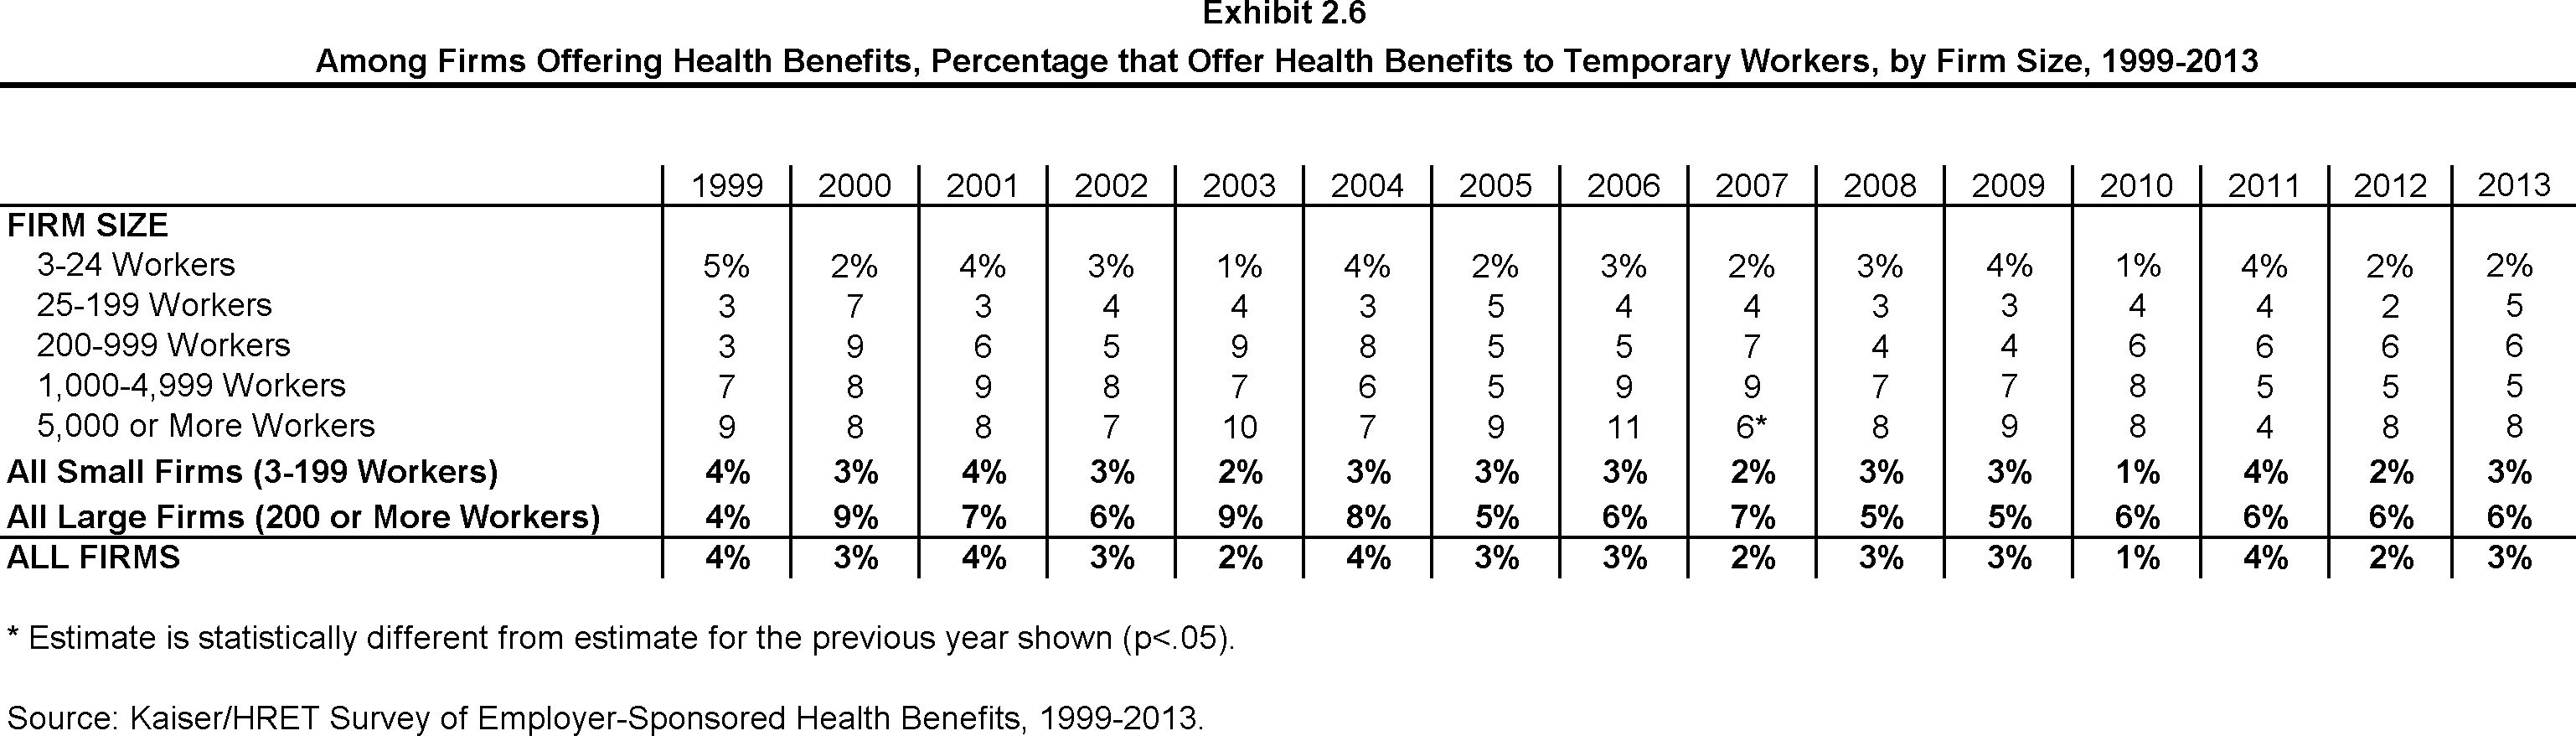
Among Firms Offering Health Benefits, Percentage that Offer Health Benefits to Temporary Workers, by Firm Size, 1999-2013

Among Firms Offering Health Benefits, Percentage That Offer Health Benefits to Part-Time Workers, by Firm Size, 1999–2013
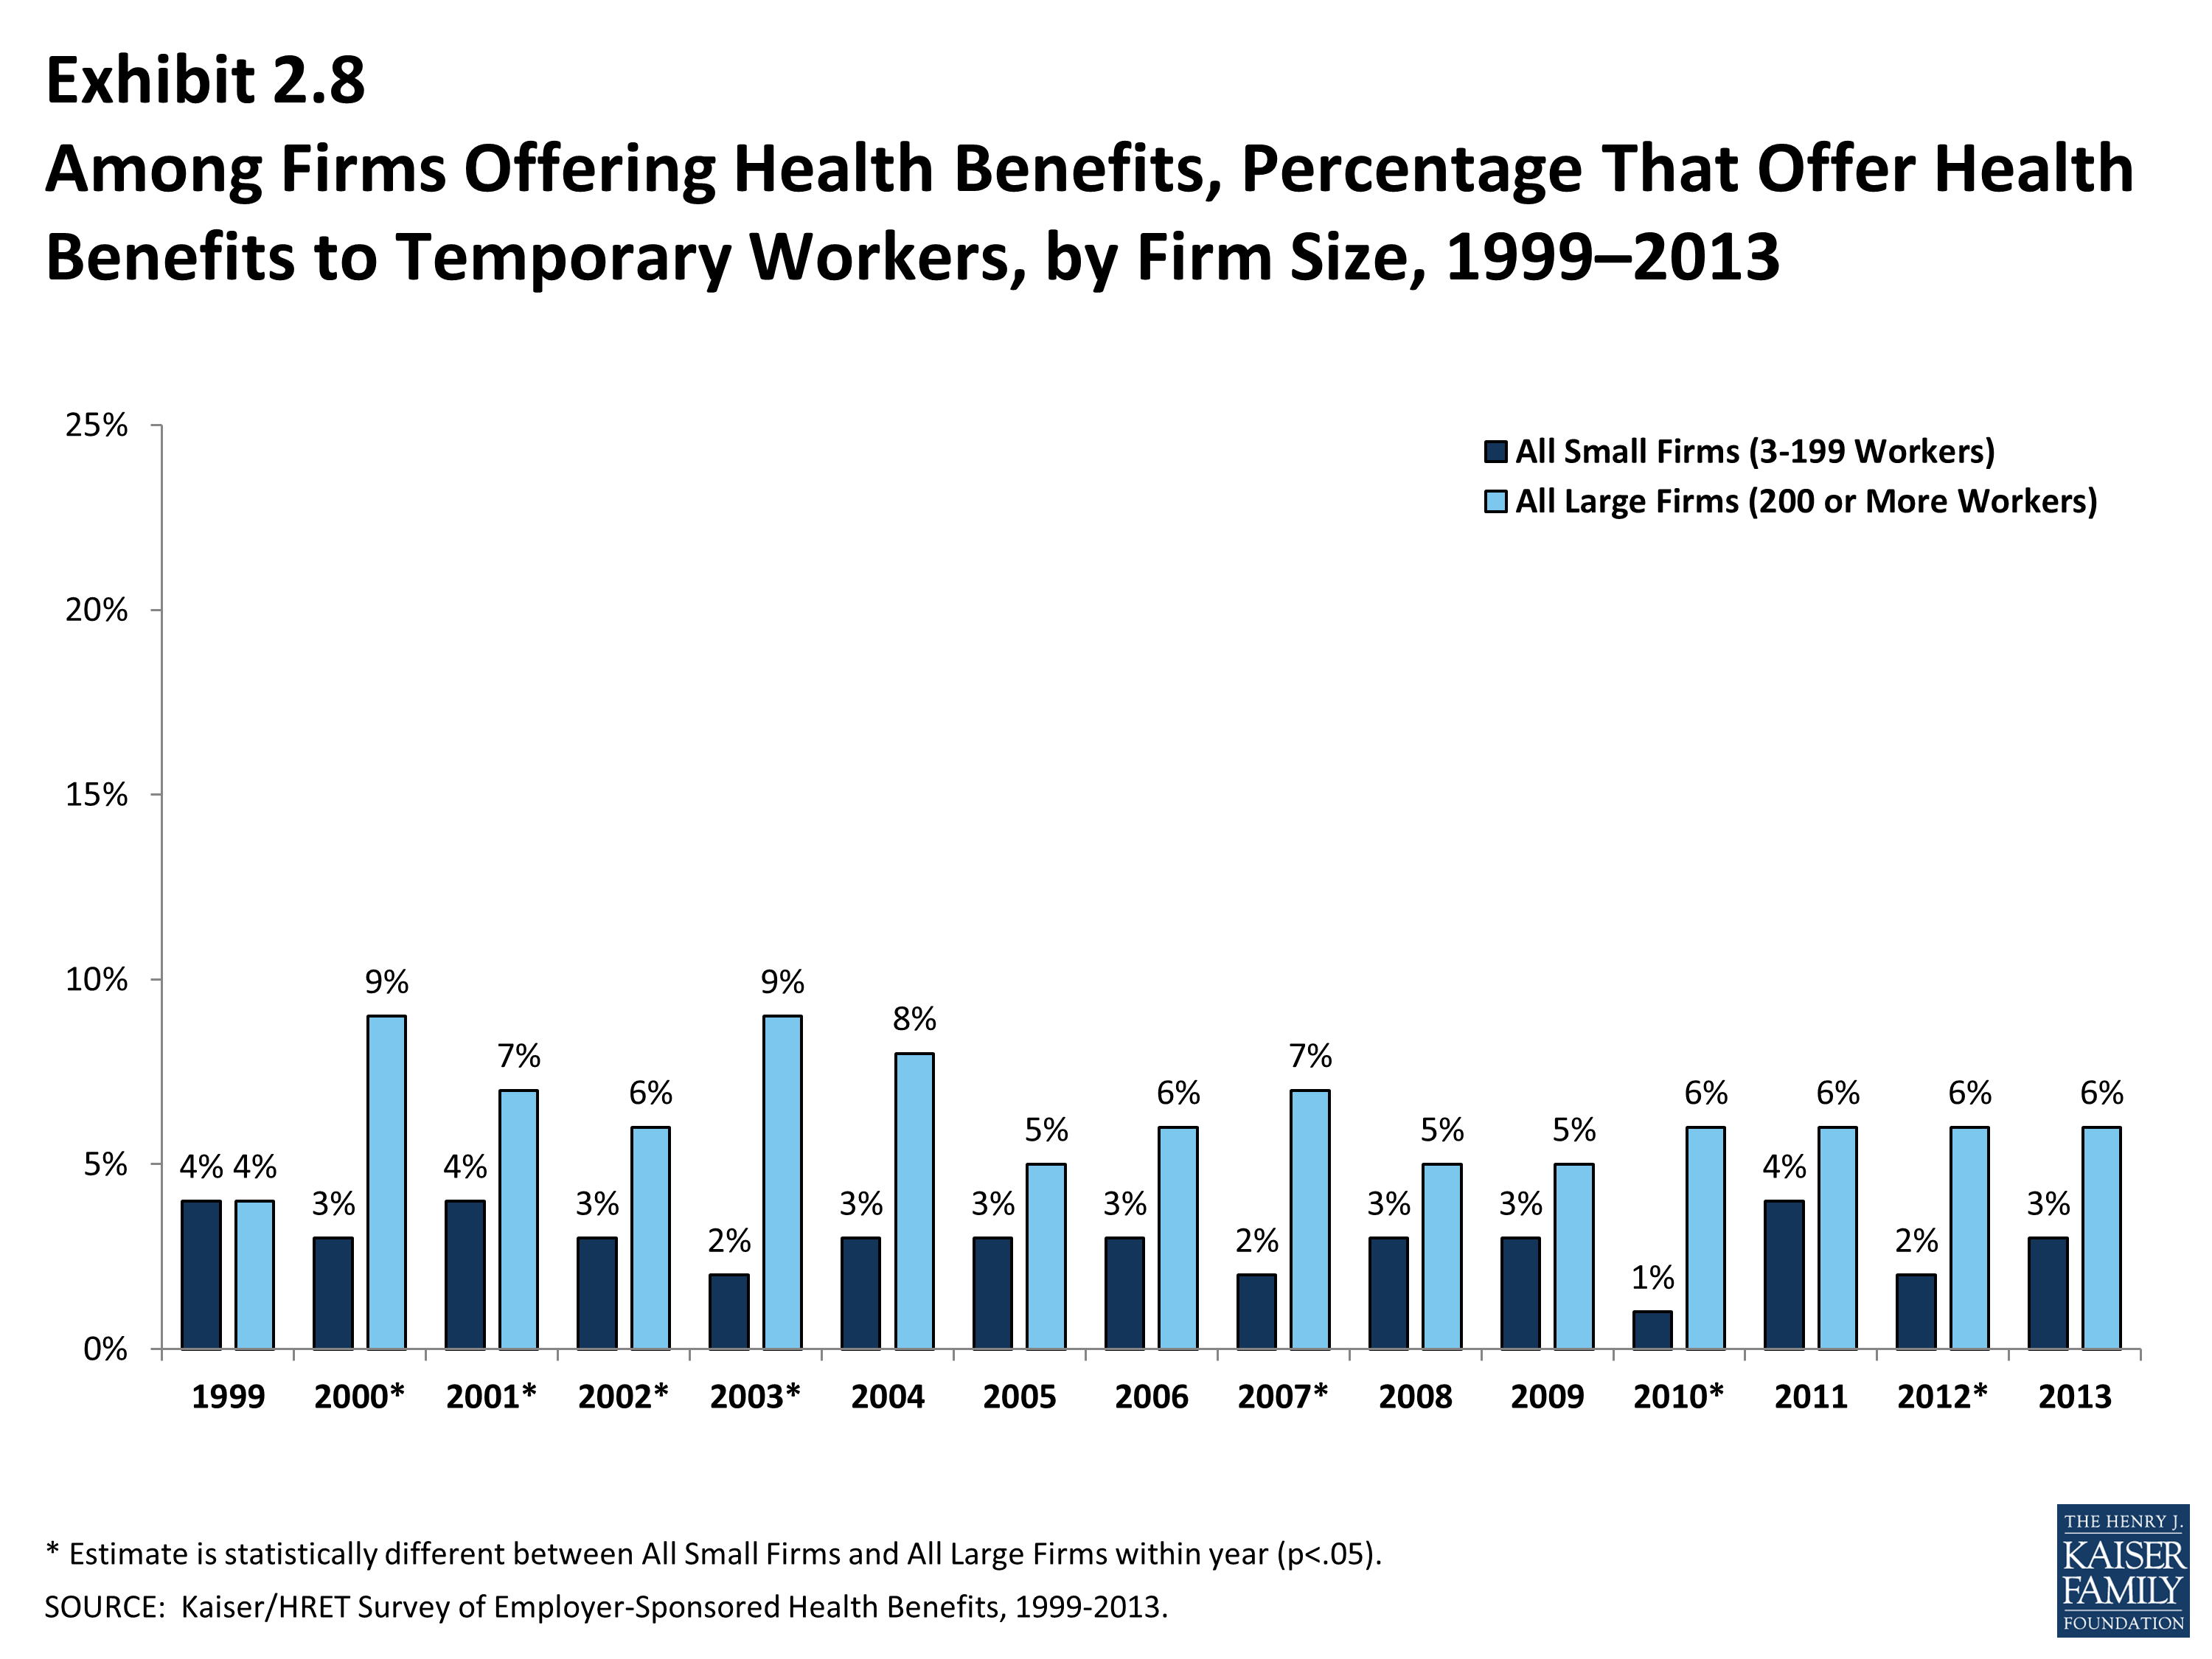
Among Firms Offering Health Benefits, Percentage That Offer Health Benefits to Temporary Workers, by Firm Size, 1999–2013
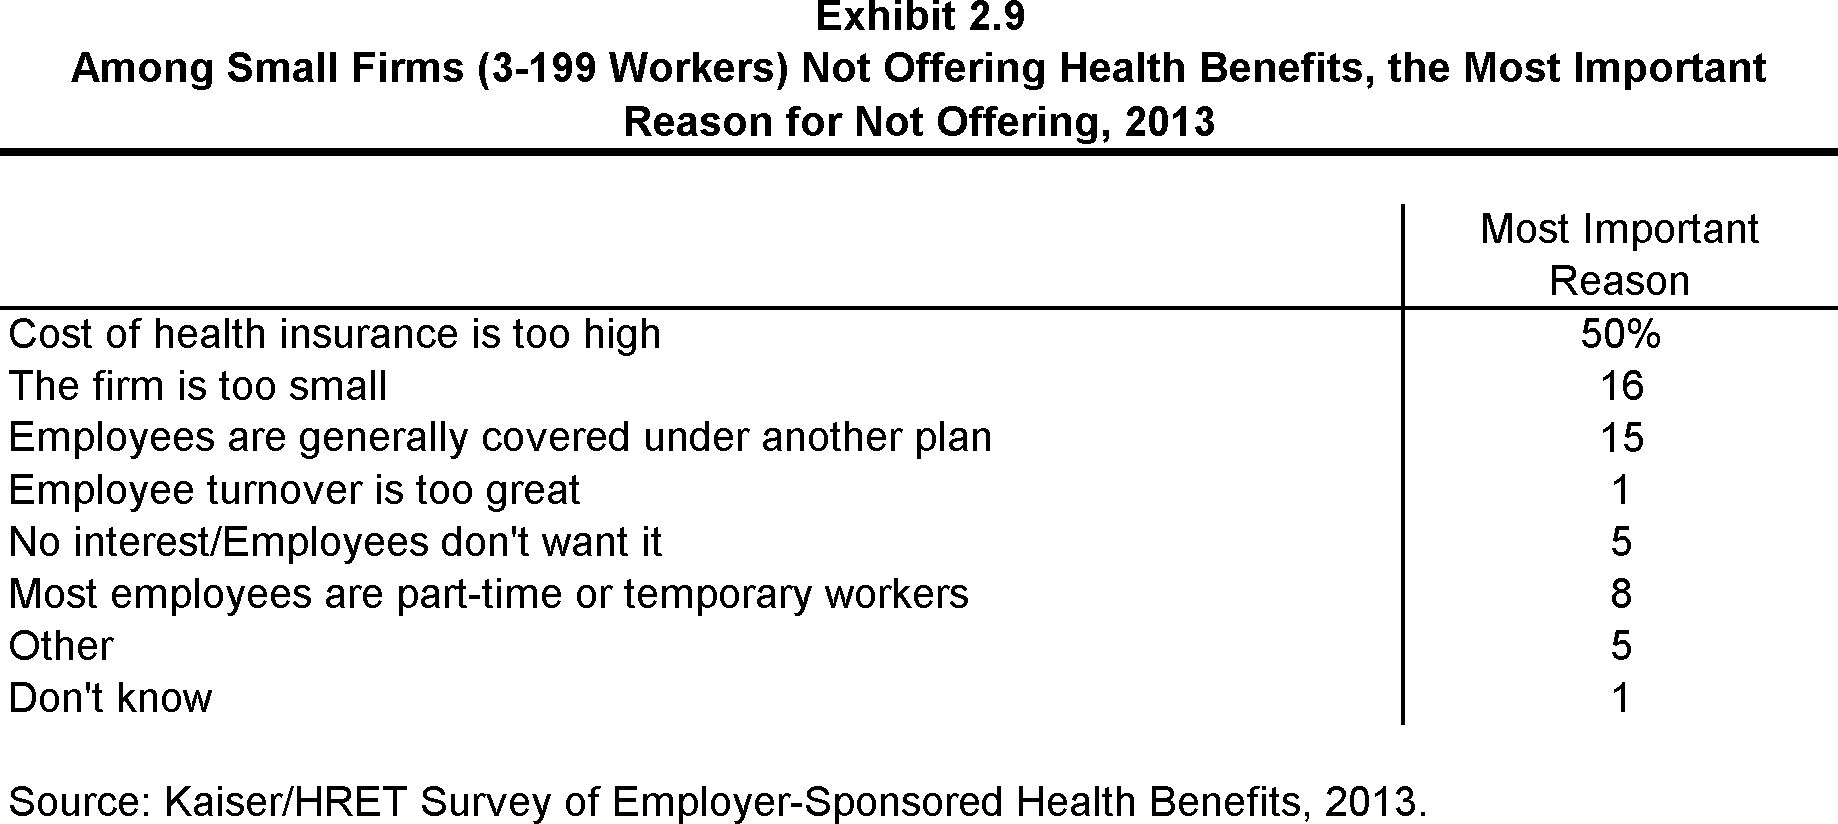
Among Small Firms (3-199 Workers) Not Offering Health Benefits, the Most Important Reason for Not Offering, 2013
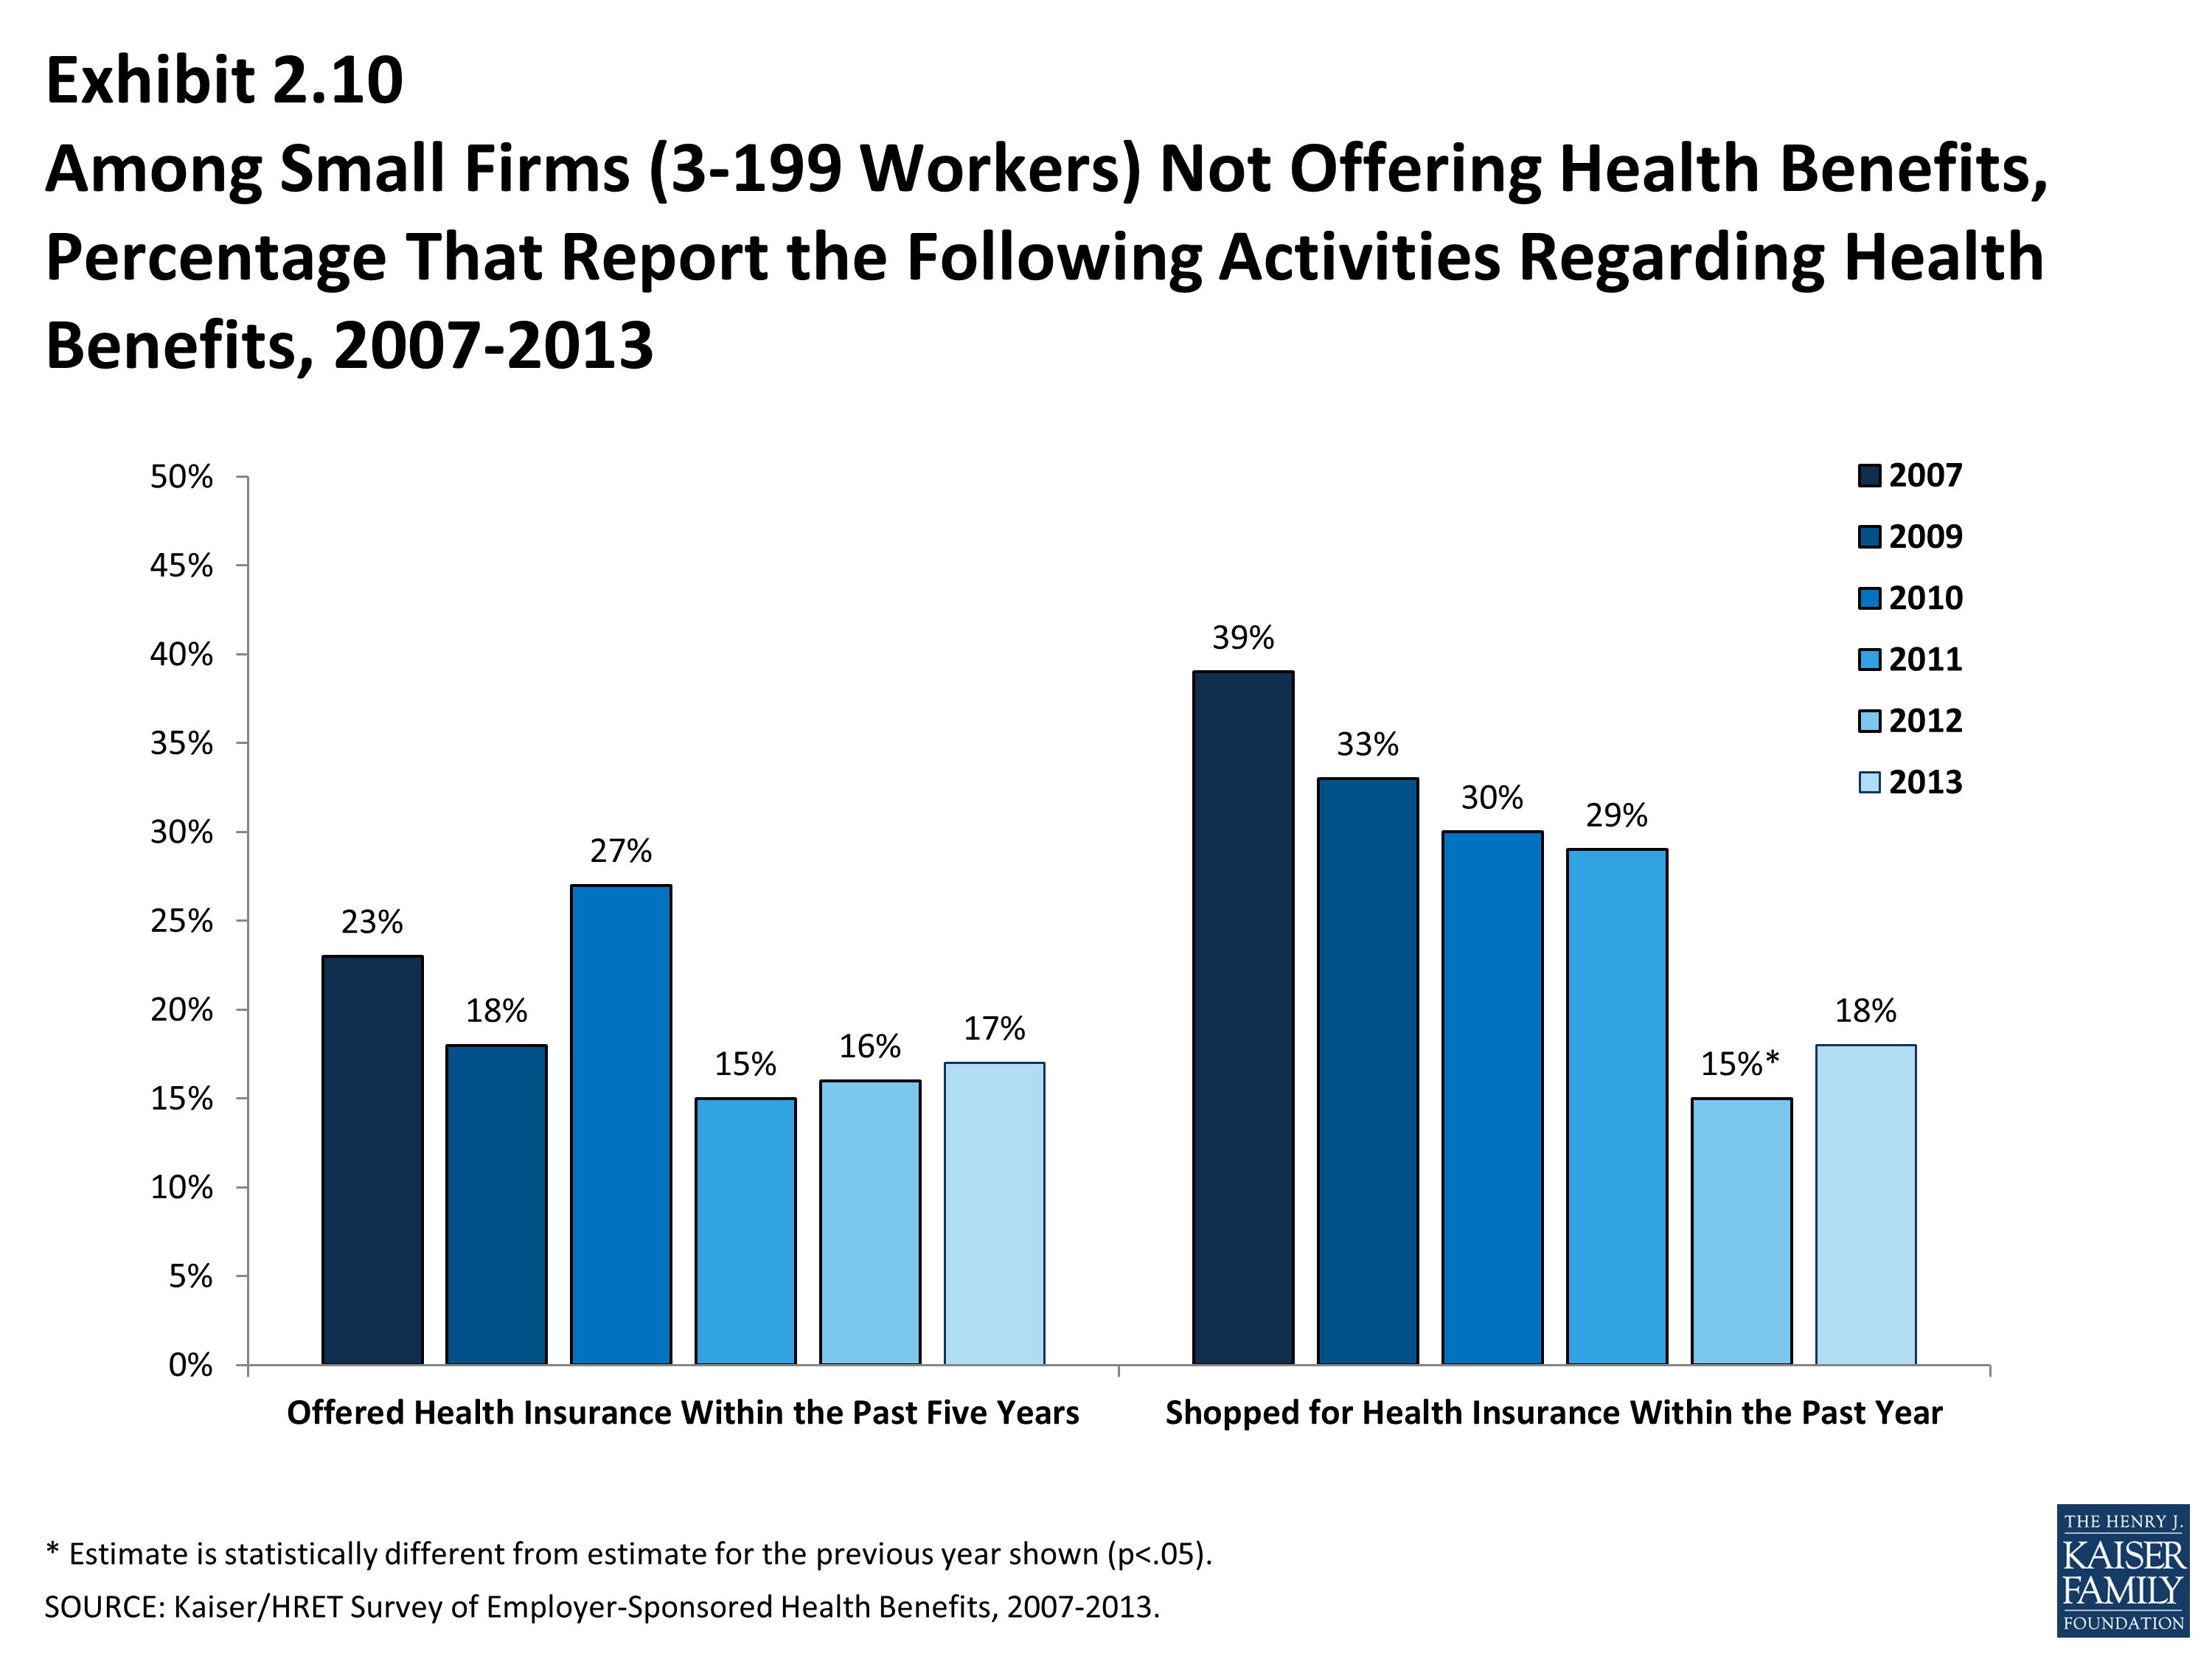
Among Small Firms (3-199 Workers) Not Offering Health Benefits, Percentage That Report the Following Activities Regarding Health Benefits, 2007-2013
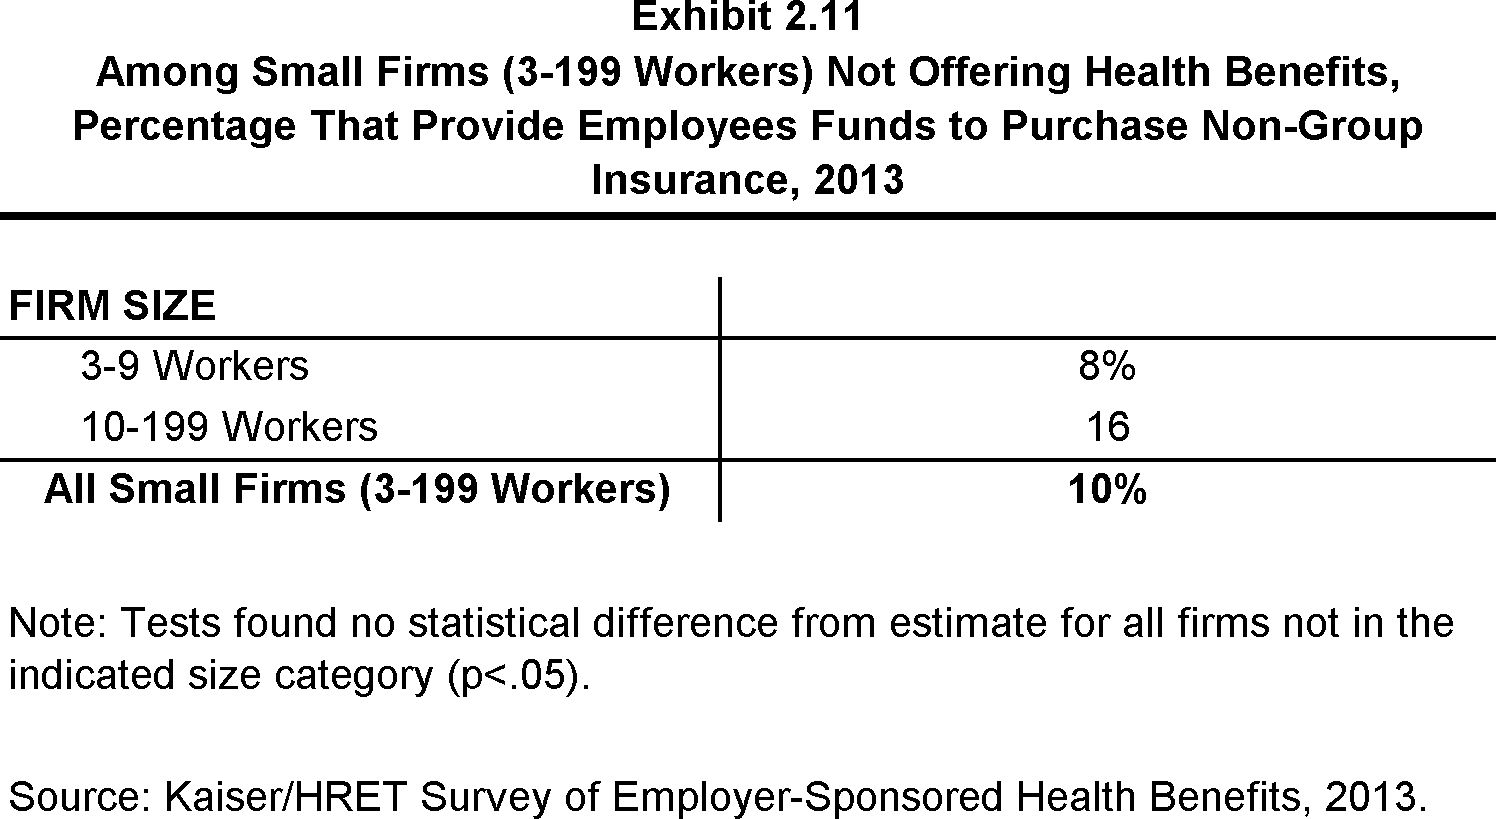
Among Small Firms (3-199 Workers) Not Offering Health Benefits, Percentage That Provide Employees Funds to Purchase Non-Group Insurance, 2013
Section Three: Employee Coverage, Eligibility, and Participation
Employers are the principal source of health insurance in the United States, providing health benefits for about 149 million nonelderly people in America.1 Most workers are offered health coverage at work, and the majority of workers who are offered coverage take it. Workers may not be covered by their own employer for several reasons: their employer may not offer coverage, they may be ineligible for benefits offered by their firm, they may choose to elect coverage through their spouse’s employer, or they may refuse coverage from their firm.
- Among firms offering health benefits, 62% percent of workers are covered by health benefits through their own employer (Exhibit 3.2). When considering both firms that offer health benefits and those that don’t, 56% of workers are covered under their employer’s plan (Exhibit 3.1). This coverage rate has remained stable over time.
Eligibility
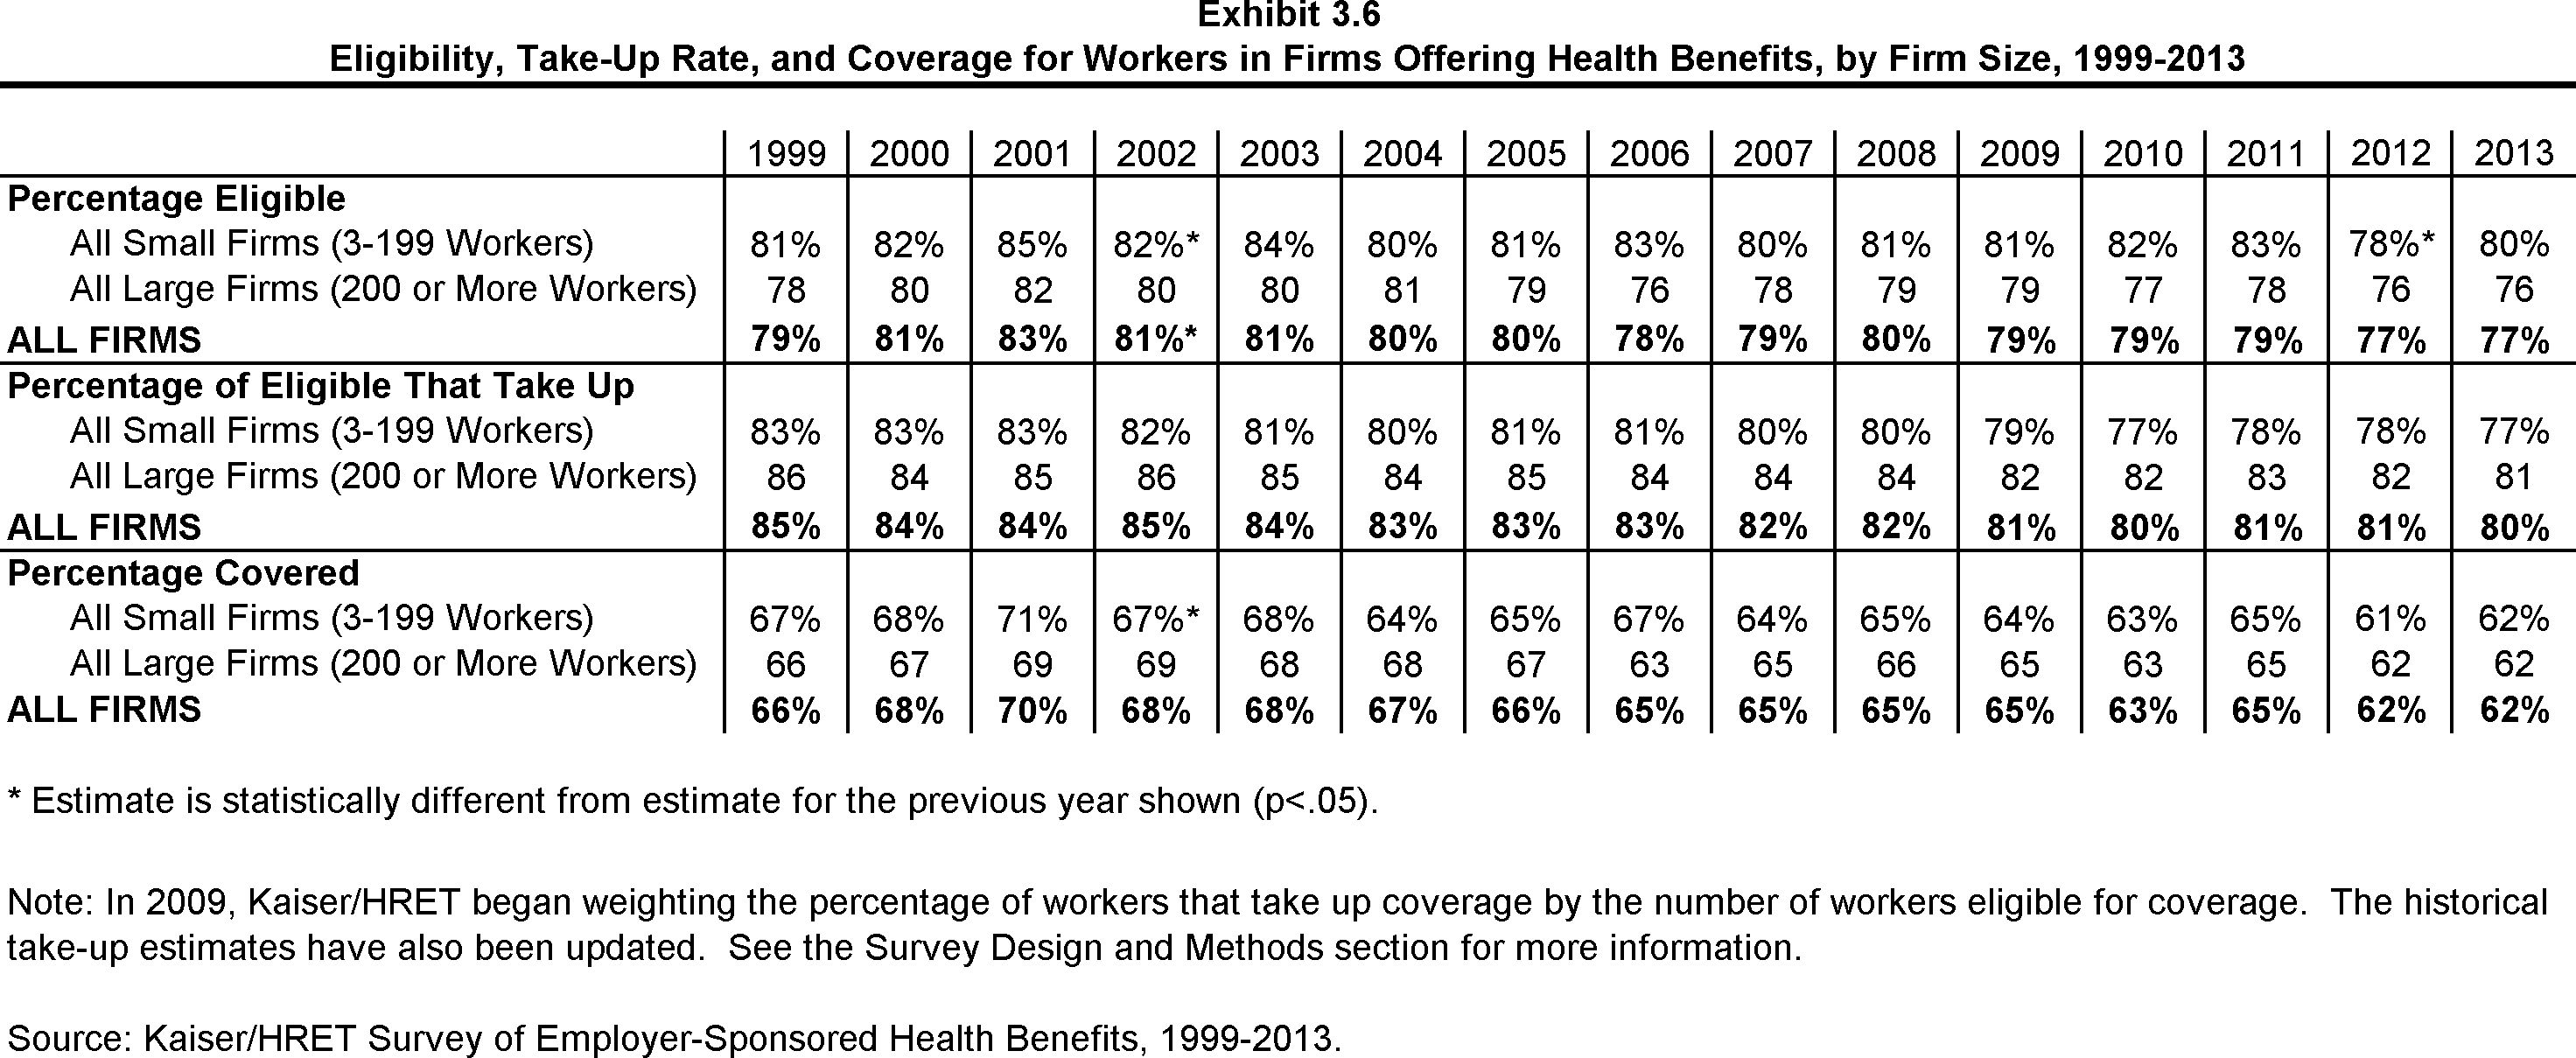
- Not all employees are eligible for the health benefits offered by their firm, and not all eligible employees take up the offer of coverage. The share of workers covered in a firm is a product of both the percentage of workers who are eligible for the firm’s health insurance and the percentage who choose to “take up” (i.e., elect to participate in) the benefit.
- Seventy-seven percent of workers in firms offering health benefits are eligible for the coverage offered by their employer (Exhibit 3.2).
- Eligibility varies considerably by wage level. Employees in firms with a lower proportion of lower-wage workers (less than 35% of workers earn $23,000 or less annually) are more likely to be eligible for health benefits than employees in firms with a higher proportion of lower-wage workers (80% vs. 61%). We observe a similar pattern among firms with many higher-wage workers (35% or more of workers earn $56,000 or more annually) (84% vs. 73%) (Exhibit 3.3).
- Eligibility also varies by the age of the workforce. Those in firms with fewer younger workers (less than 35% of workers are age 26 or younger) are more likely to be eligible for health benefits than are workers in firms with many younger workers, at 78% versus 63% (Exhibit 3.3).
Take-up Rate
- Employees who are offered health benefits generally elect to take up the coverage. In 2013, 80% of eligible workers take up coverage when it is offered to them, which is similar to the 81% reported last year (Exhibit 3.2).2
- The likelihood of a worker accepting a firm’s offer of coverage also varies by workforce wage level. Eligible employees in firms with a lower proportion of lower-wage workers are more likely to take up coverage (81%) than eligible employees in firms with a higher proportion of lower-wage workers (35% or more of workers earn $23,000 or less annually) (68%) (Exhibit 3.4). Similar patterns are seen in firms with a higher proportion of younger workers, with workers in these firms being less likely to take up coverage than those in firms with a smaller share of younger workers (70% vs. 81%).
- Almost nine out of ten workers at public employers who offer health benefits take up coverage (89%). However, workers at private for-profit employers are significantly less likely to do so – only 77% of these workers take up coverage (Exhibit 3.4).
Coverage
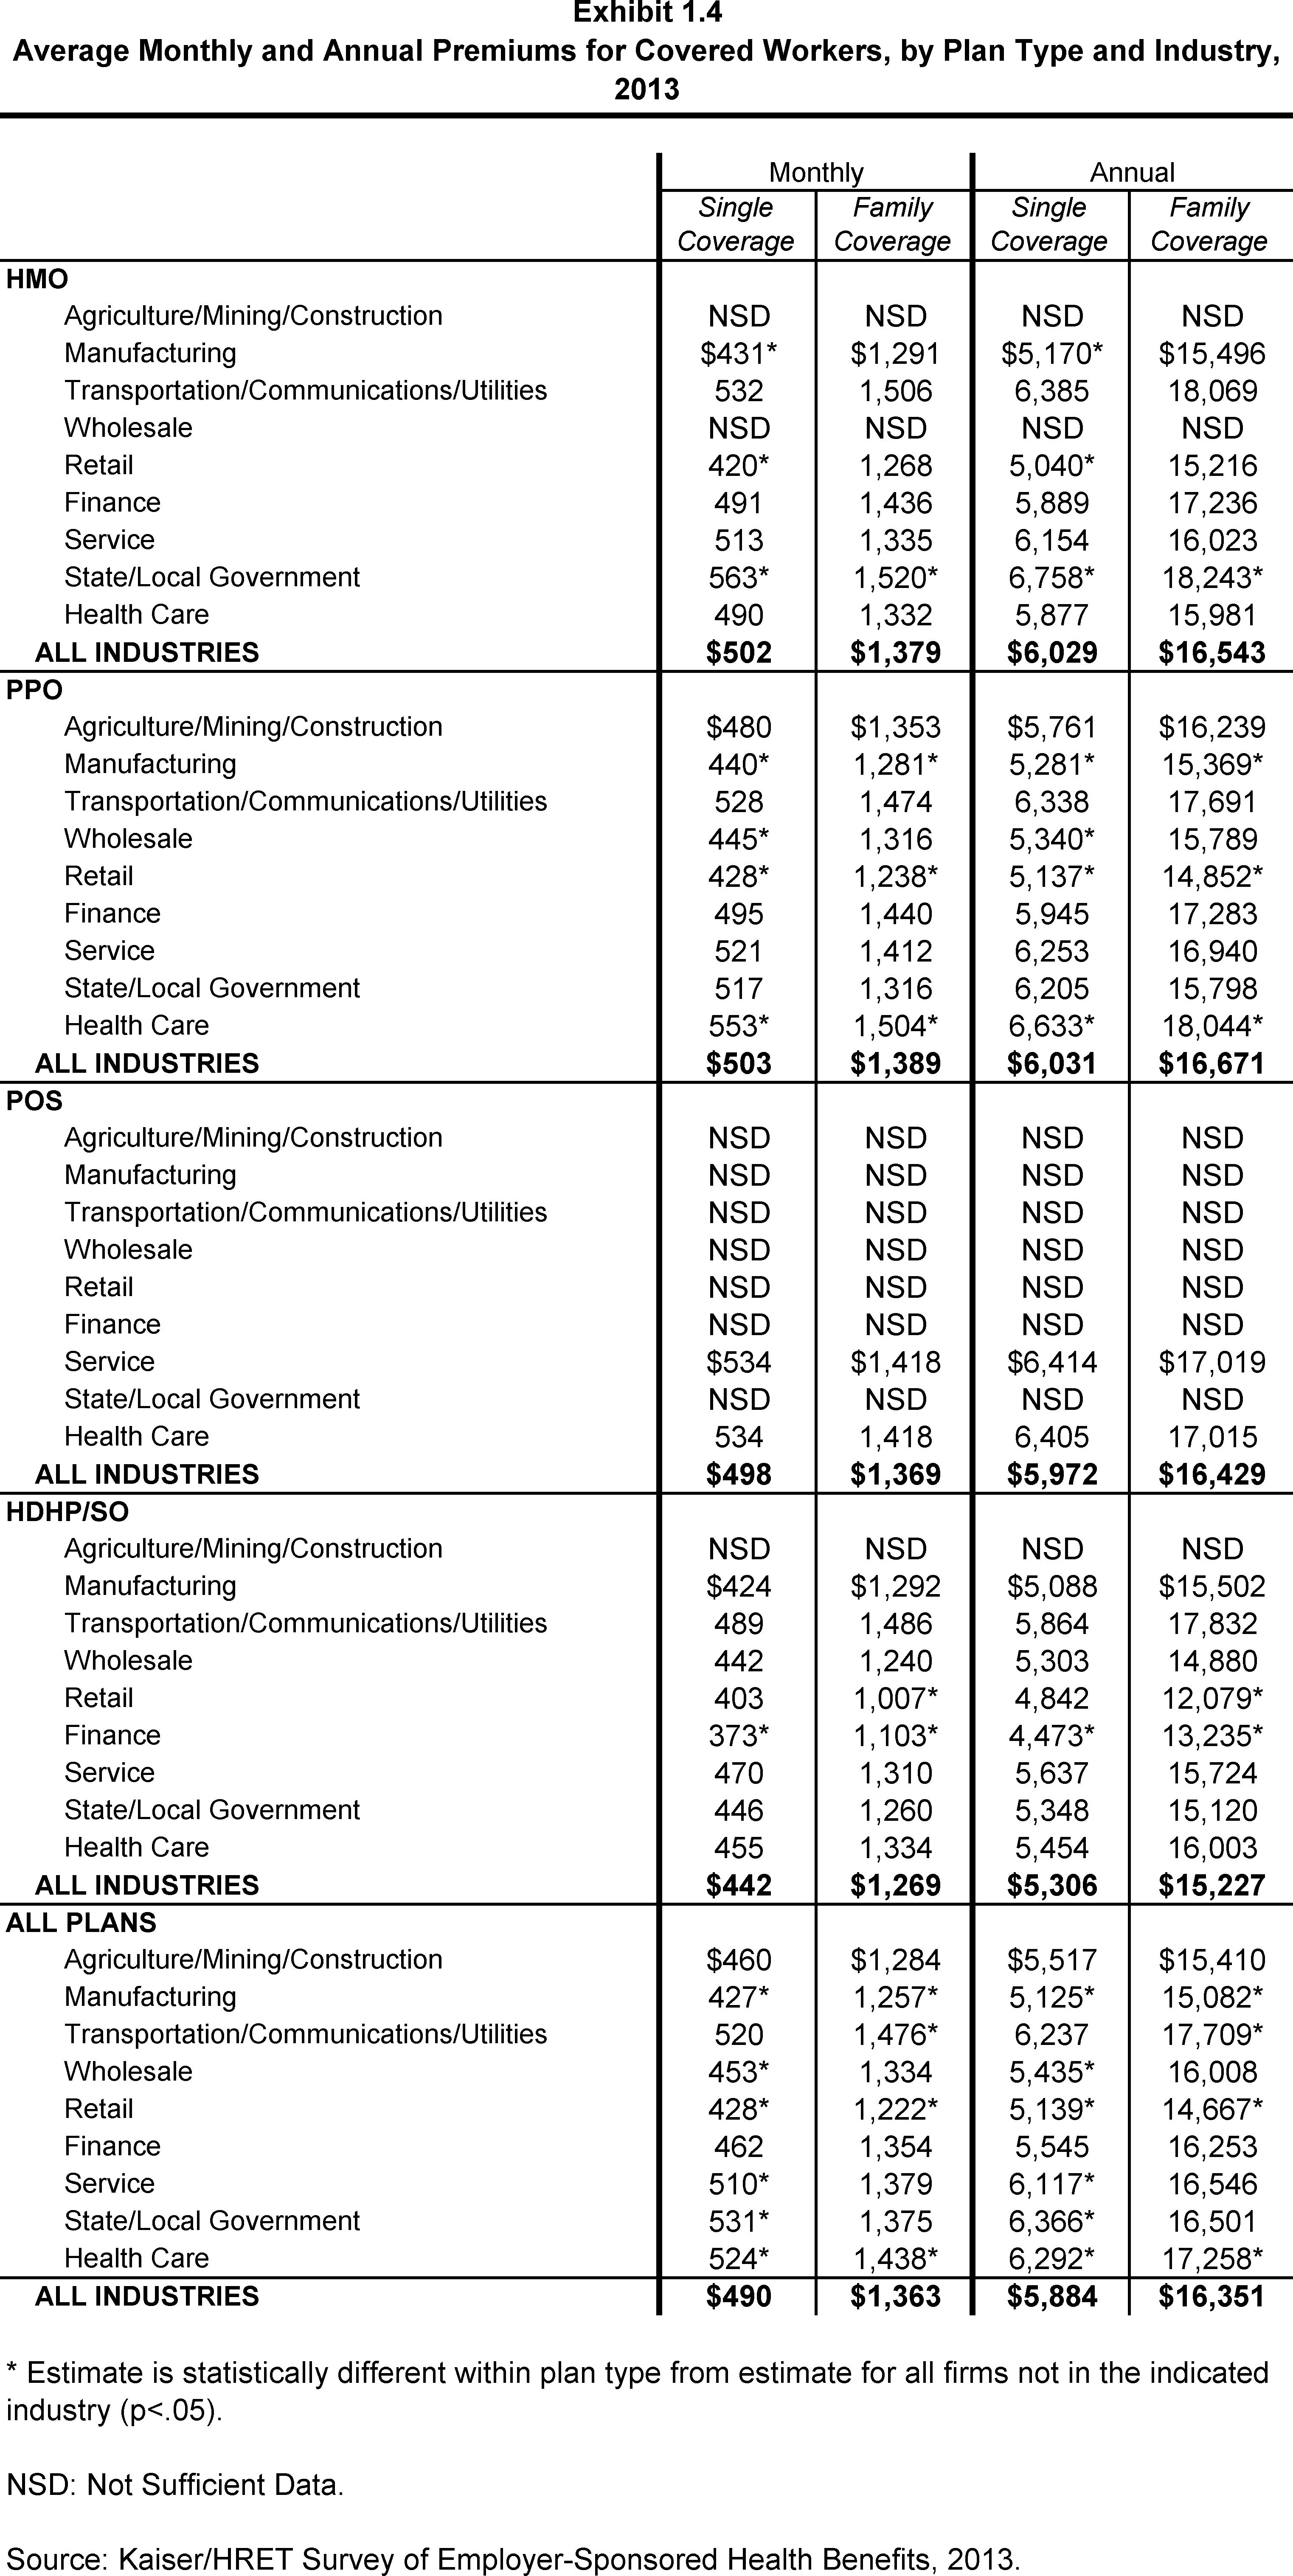
- There is significant variation by industry in the coverage rate among workers in firms offering health benefits. For example, only 37% of workers in retail firms offering health benefits are covered by the health benefits offered by their firm, compared to 74% of workers in finance, and 74% of workers in the transportation/communications/utilities industry category (Exhibit 3.2).
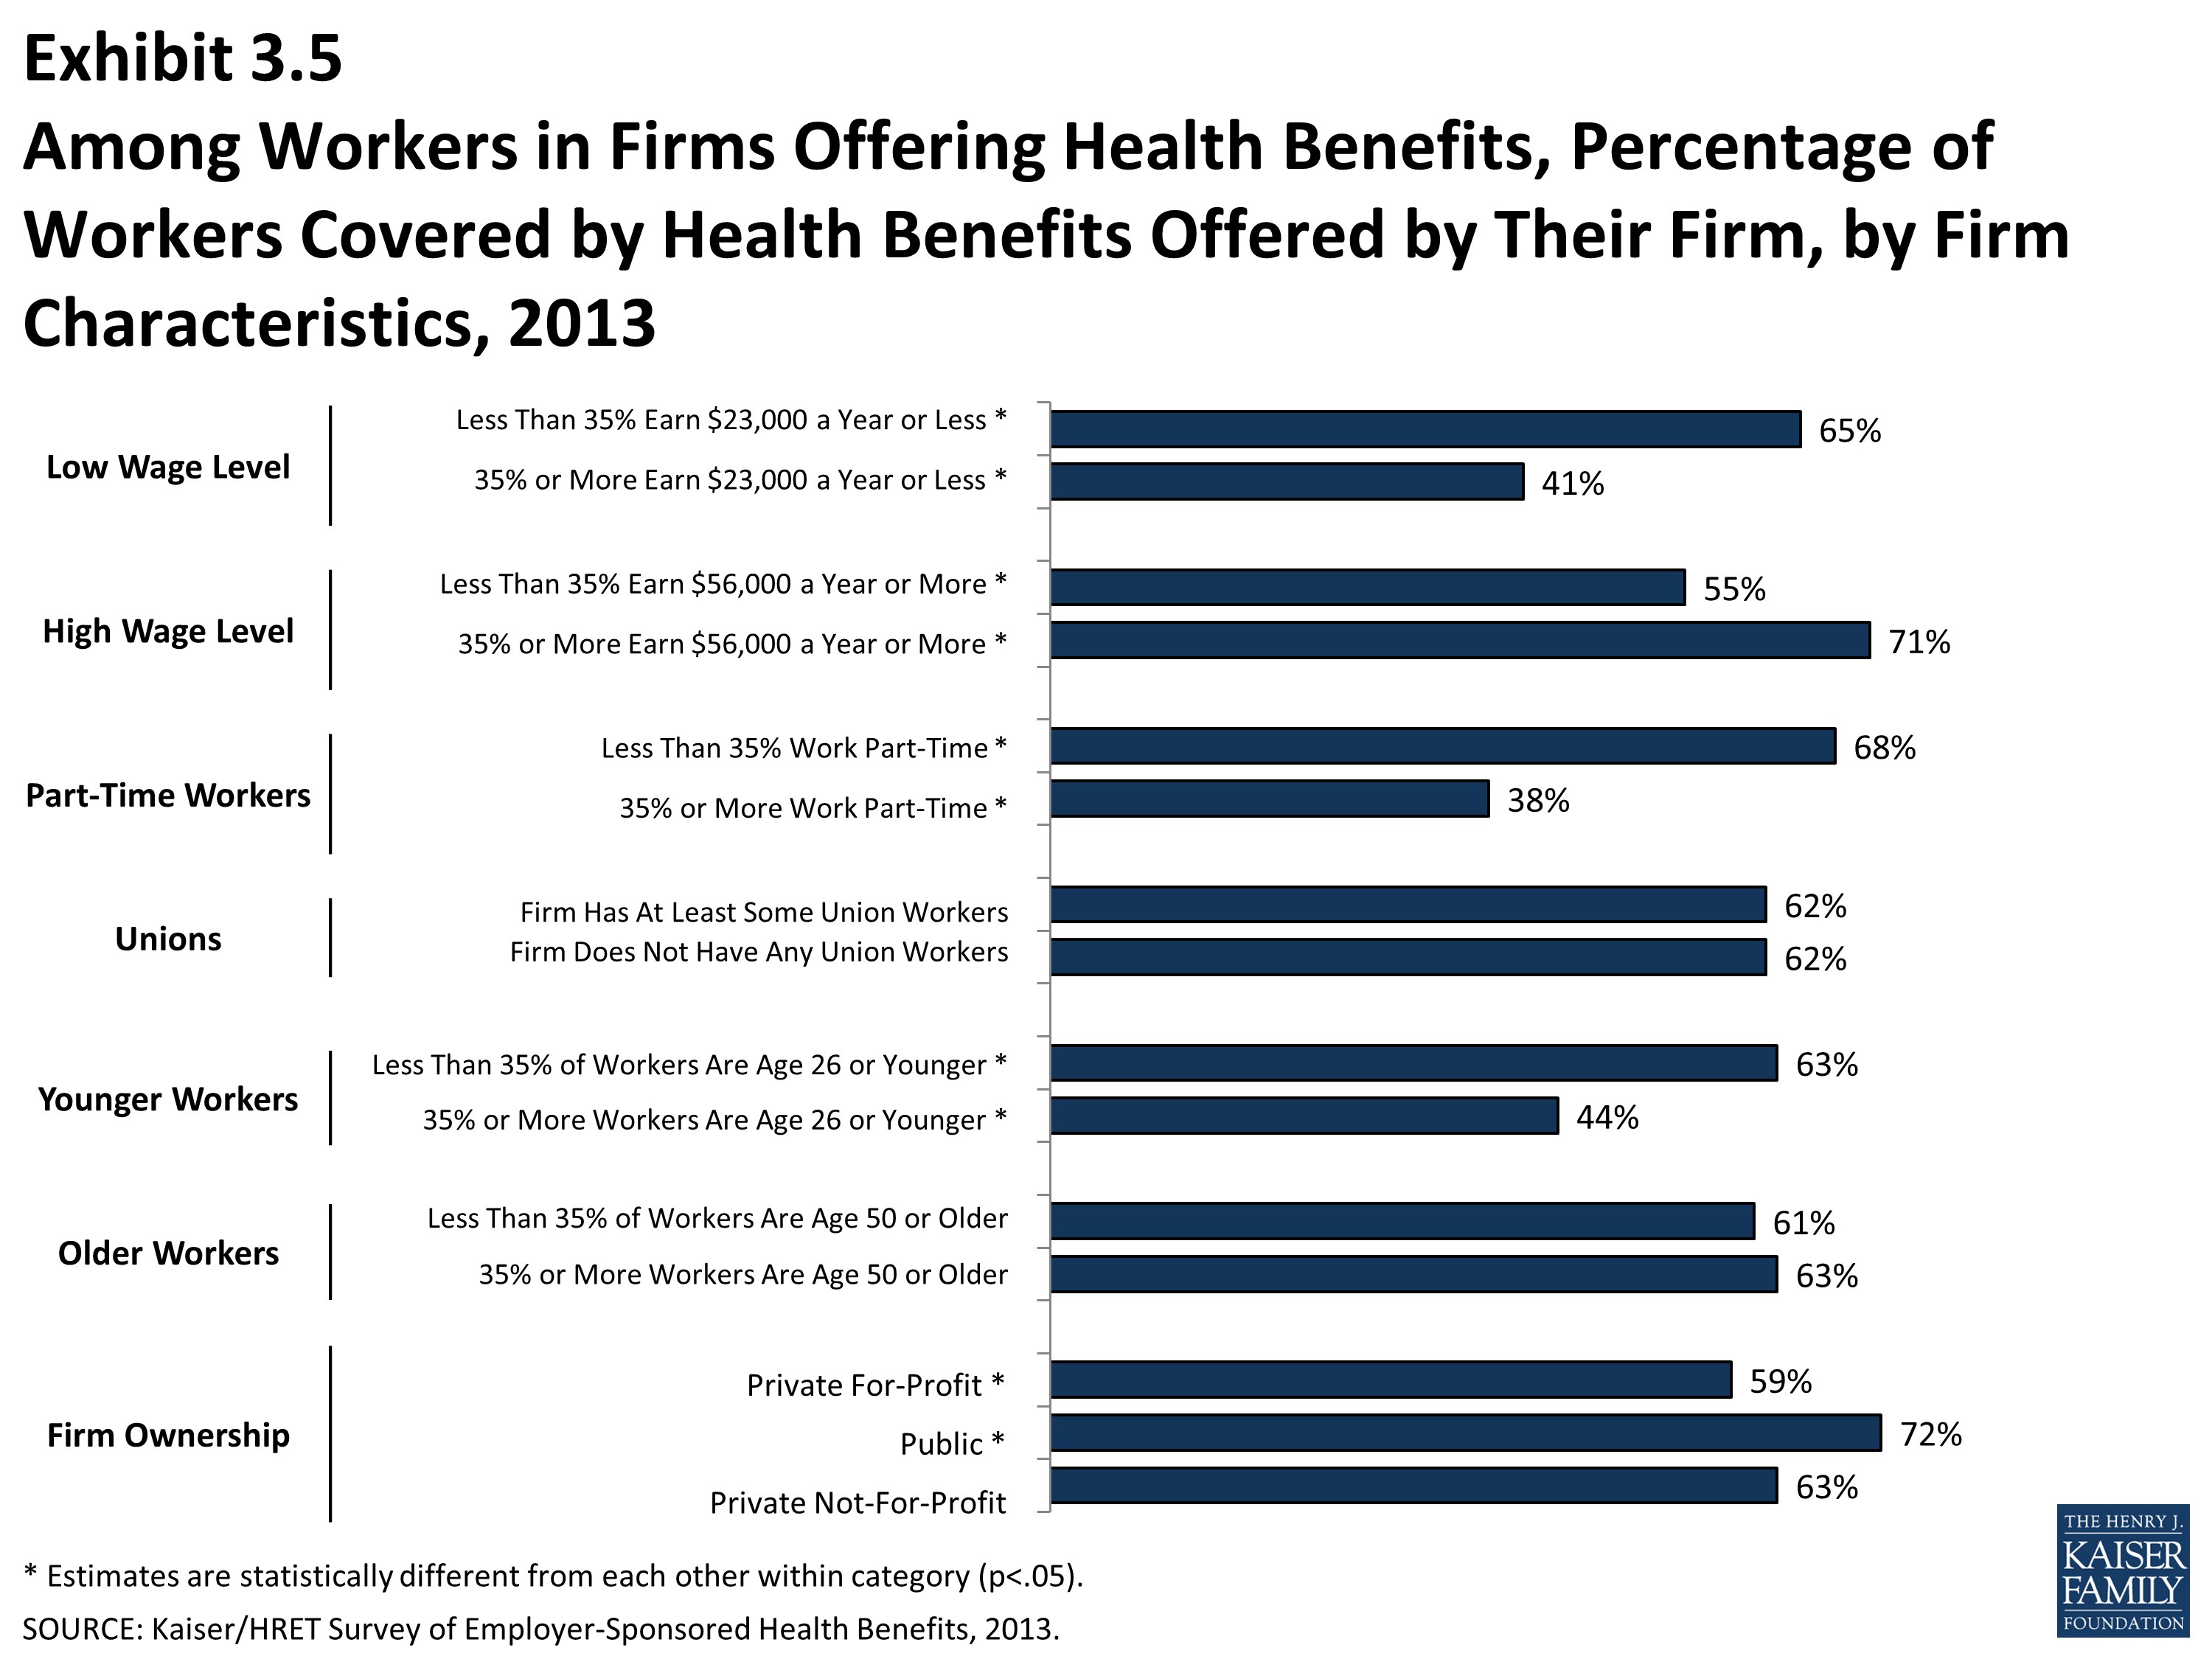
- Among workers in firms offering health benefits, those in firms with relatively few part-time workers (less than 35% of workers are part-time) are much more likely to be covered by their own firm than workers in firms with a greater percentage of part-time workers (68% vs. 38%) (Exhibit 3.5).
- Among workers in firms offering health benefits, those in firms with fewer lower-wage workers (less than 35% of workers earn $23,000 or less annually) are more likely to be covered by their own firm than workers in firms with many lower-wage workers (65% vs. 41%) (Exhibit 3.5). A comparable pattern exists in firms with a larger proportion of higher wage workers (35% or more earn $56,000 or more annually) offering health benefits.
- Among workers in firms offering health benefits, those in firms with fewer younger workers (less than 35% of workers are age 26 or younger) are more likely to be covered by their own firm than workers in firms with many younger workers (63% vs. 44%) (Exhibit 3.5).
Average Waiting Periods
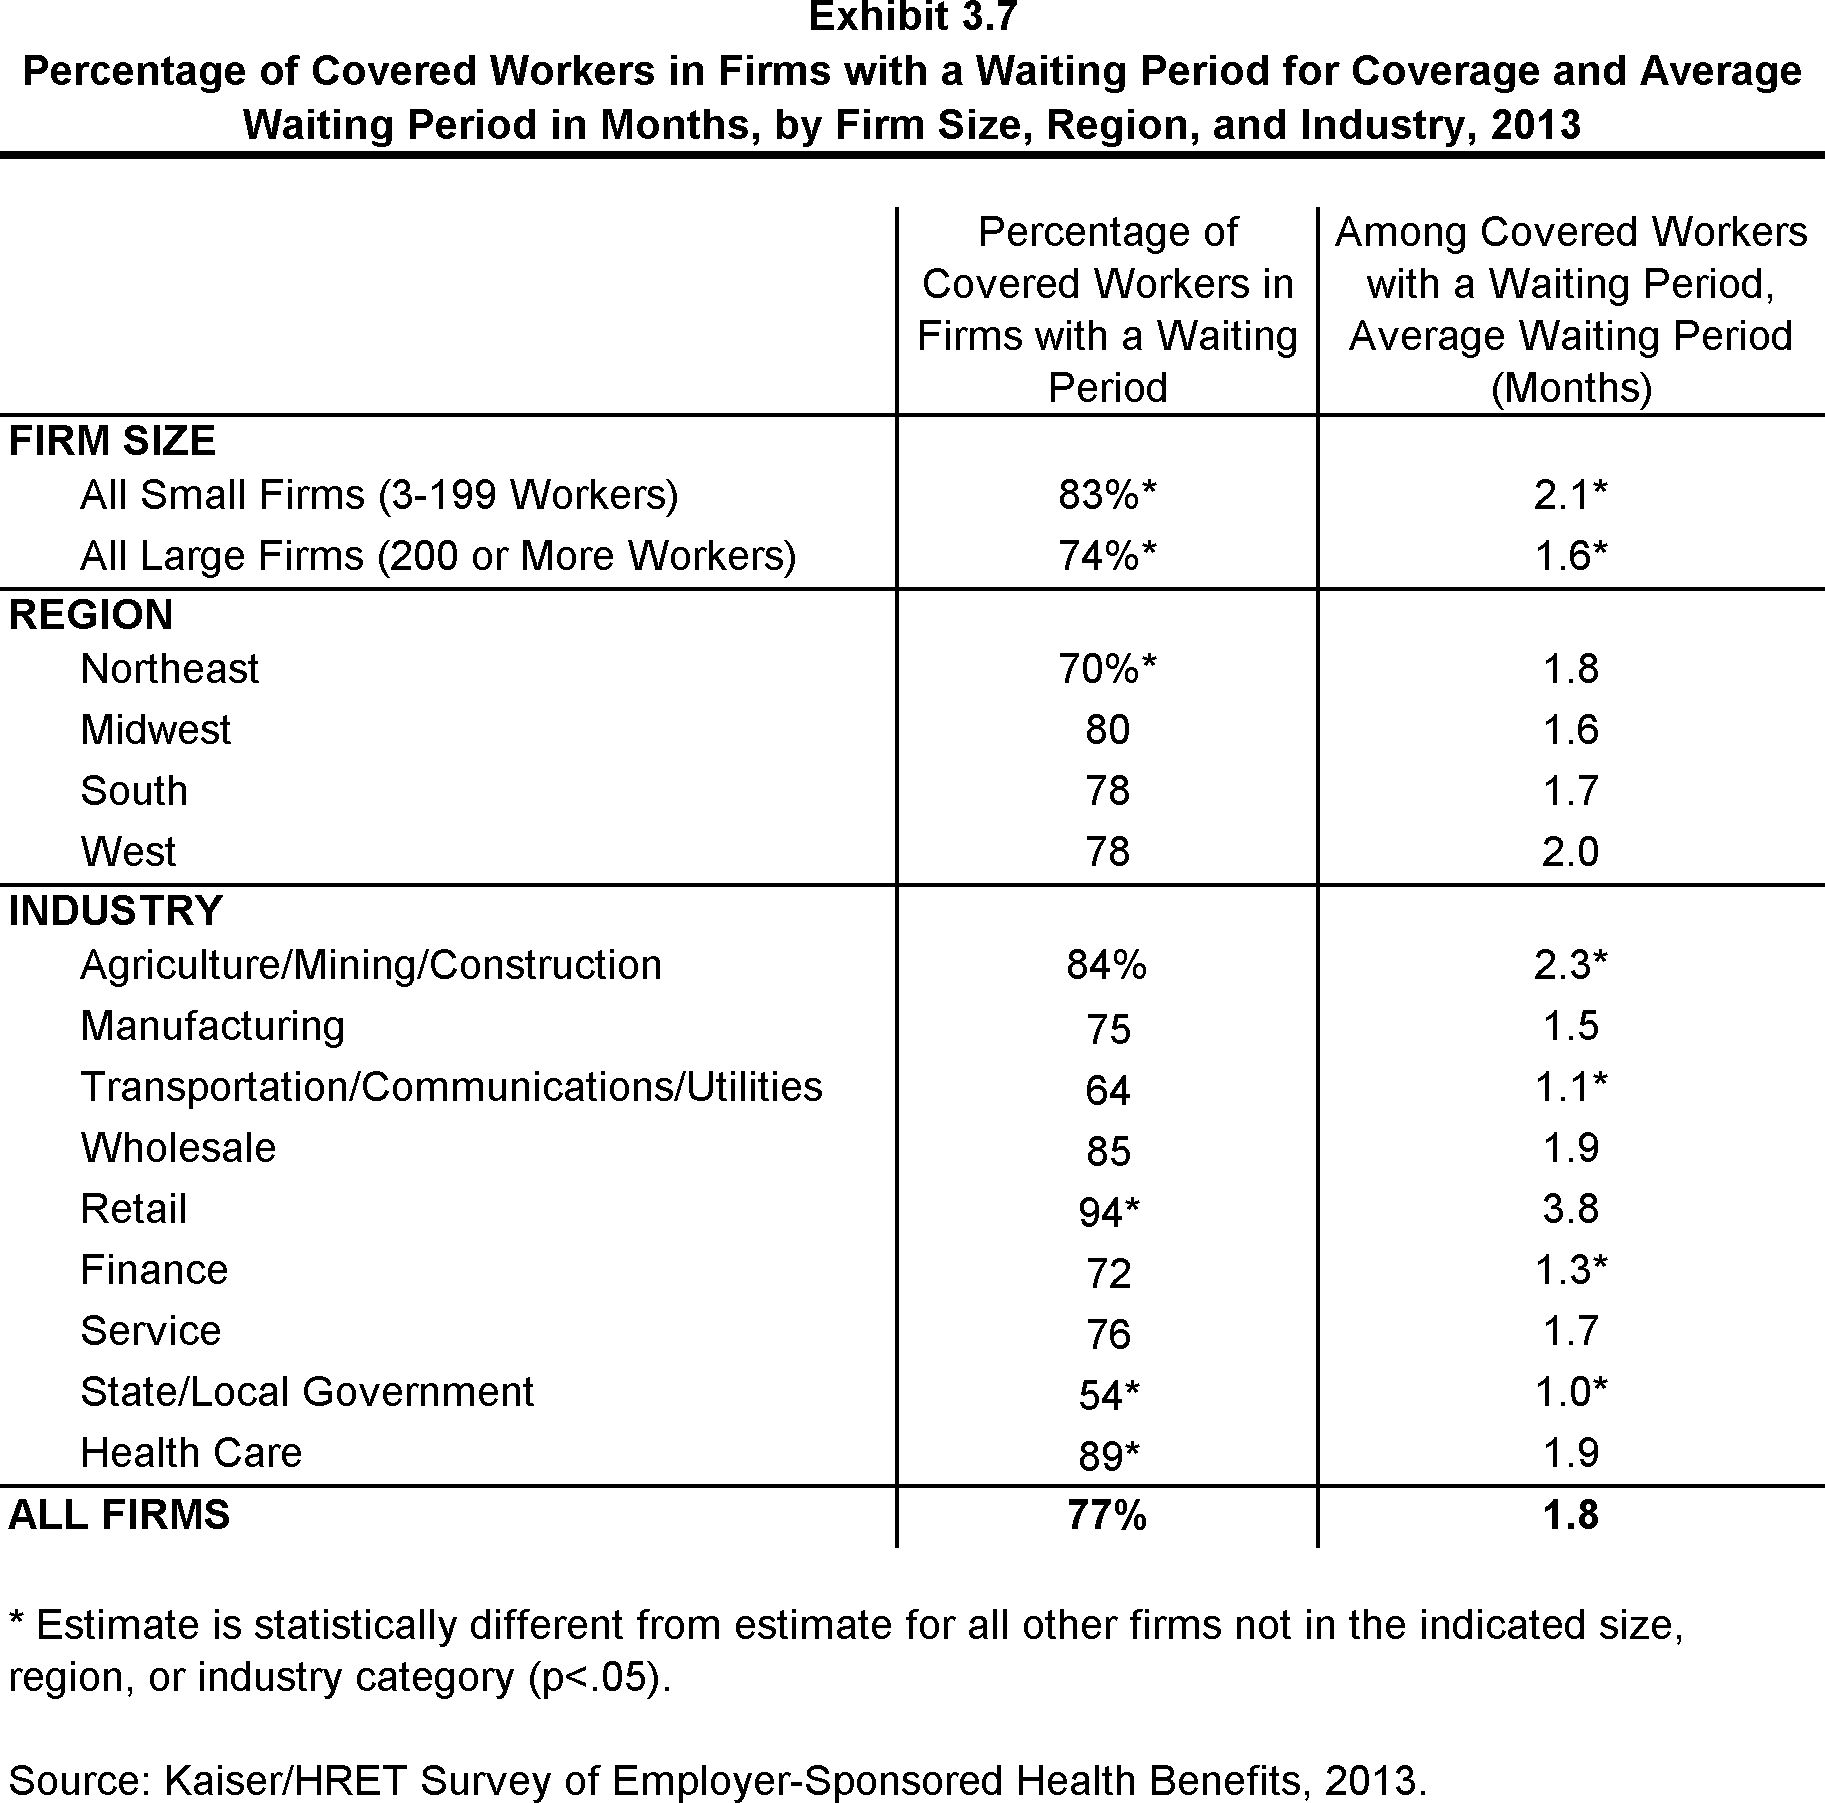
- Seventy-seven percent of covered workers face a waiting period before coverage is available. Covered workers in small firms (3-199 workers) are more likely than those in large firms to have a waiting period, at 83% versus 74% (Exhibit 3.7). Workers in the Northeast are less likely to face a wait for coverage than all other regions (70%).
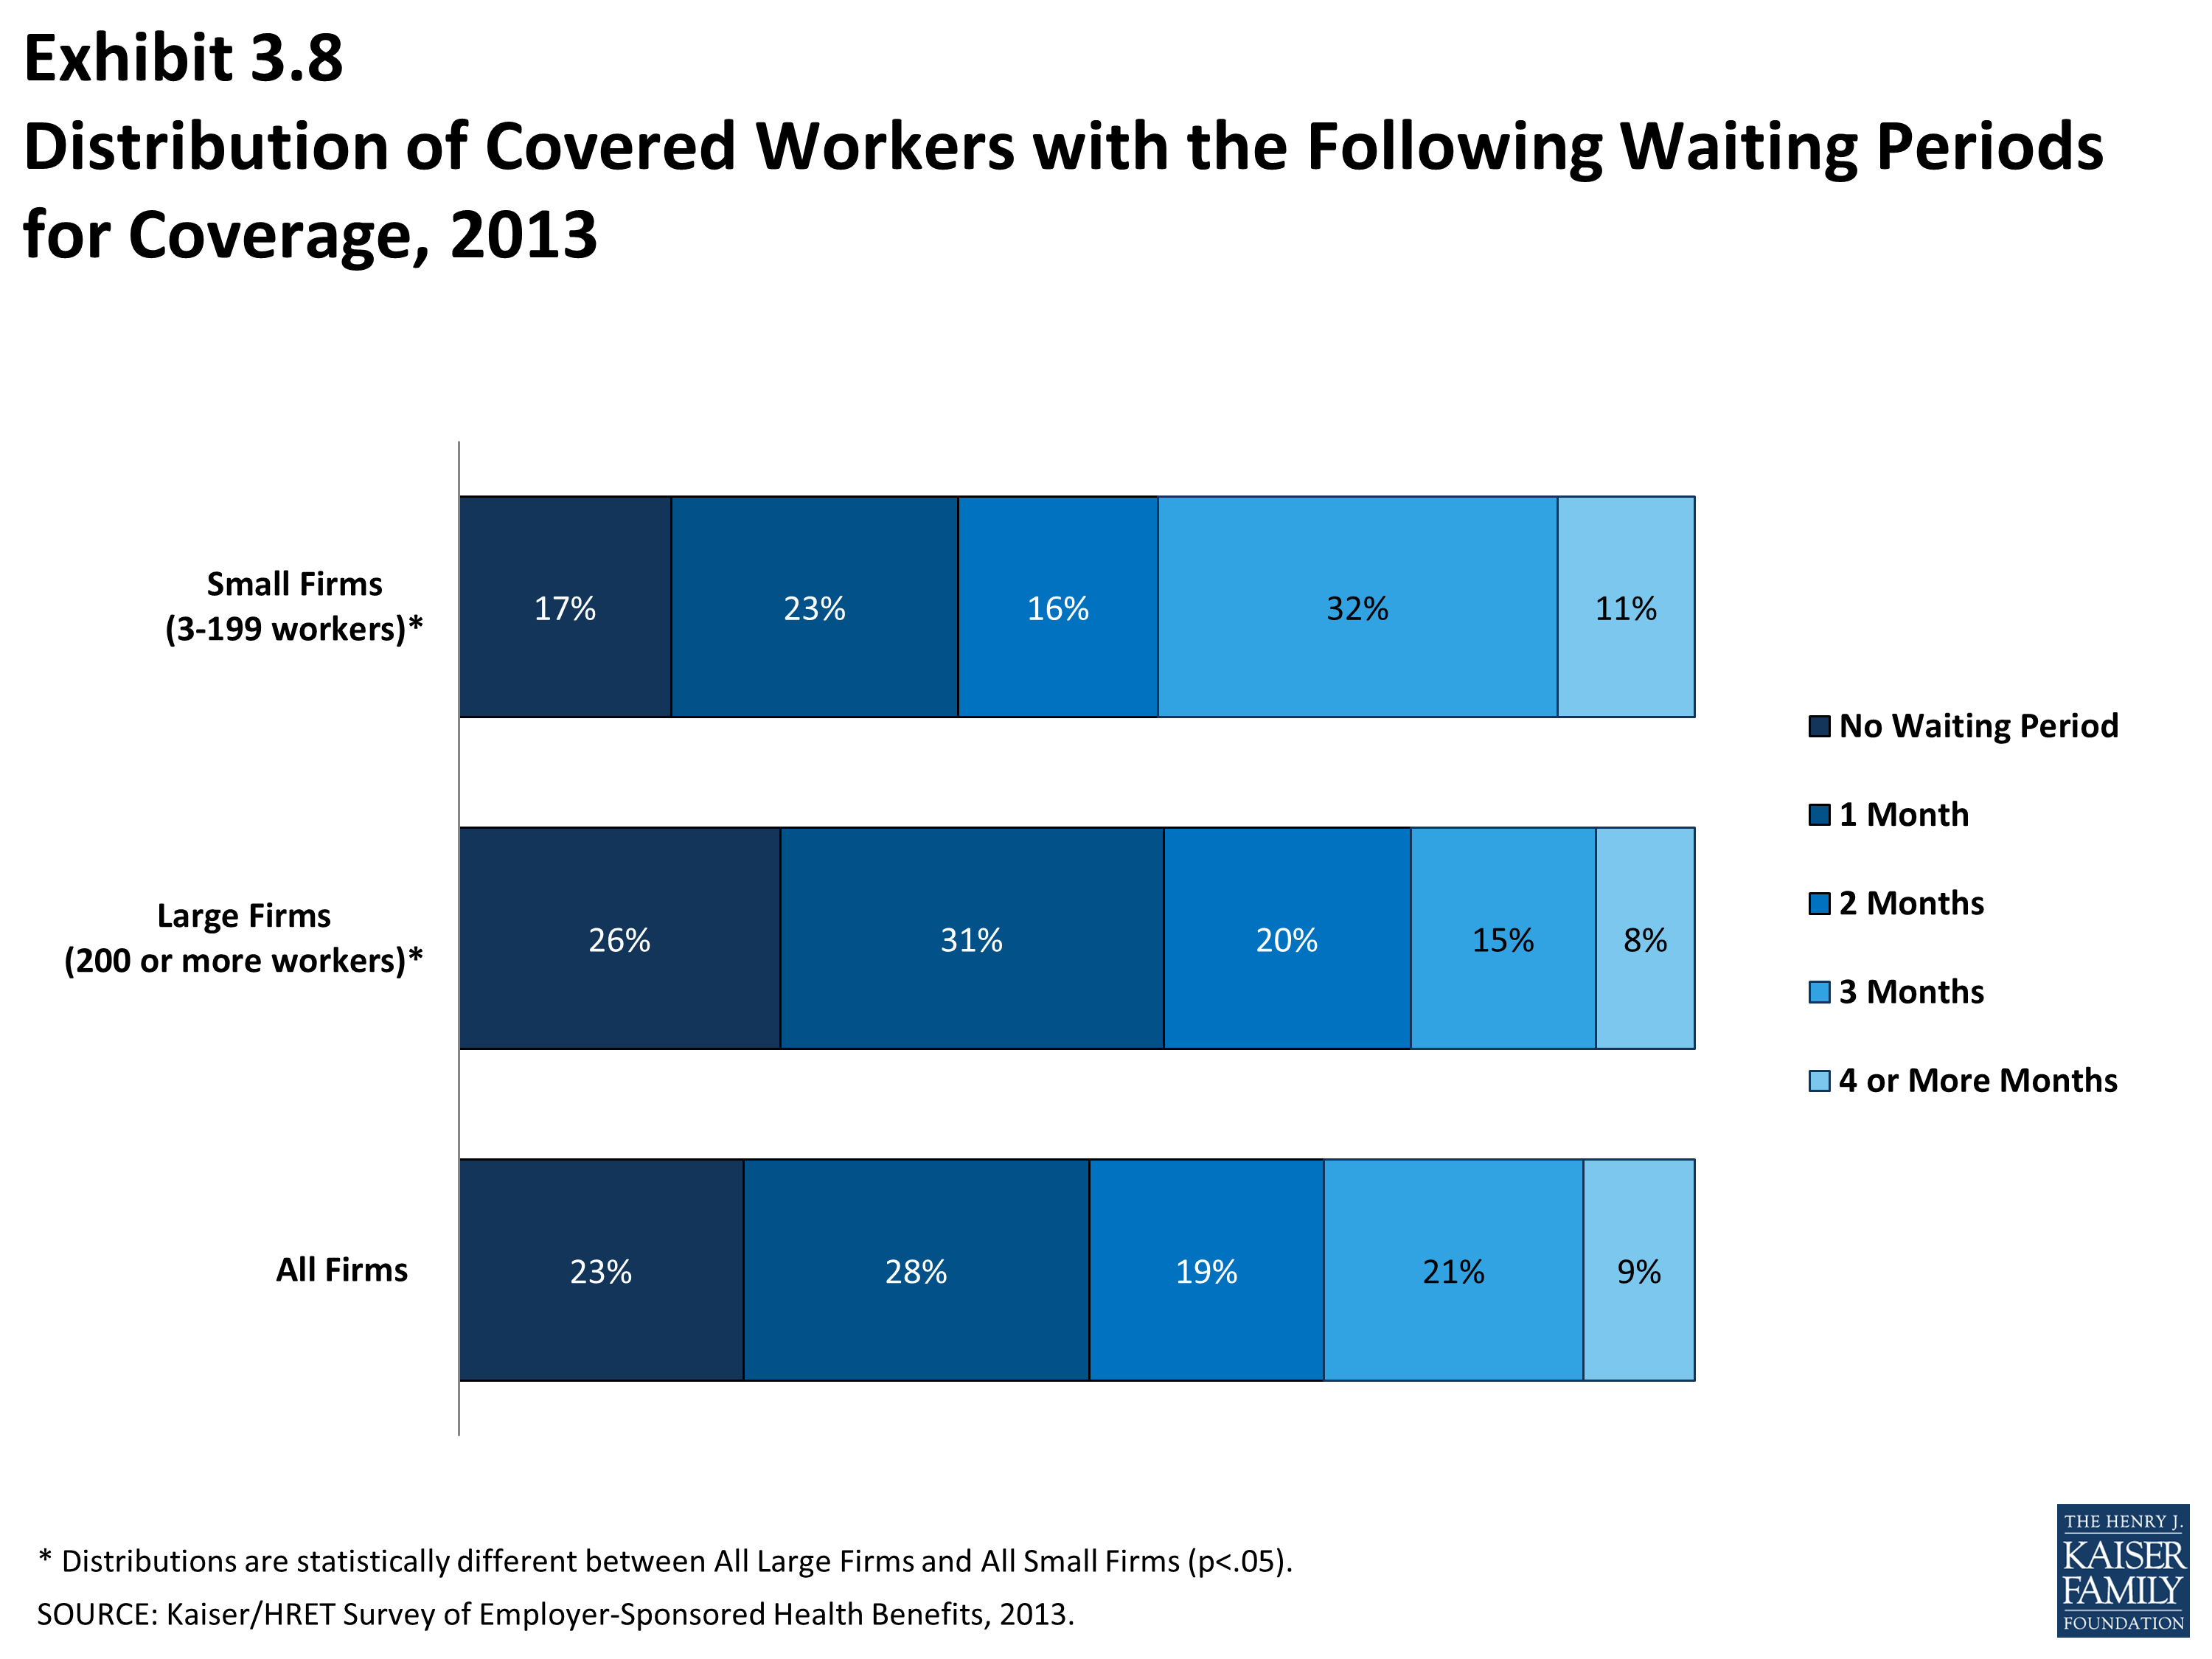
- The average waiting period among covered workers who face a waiting period is 1.8 months (Exhibit 3.7). While 30% of covered workers face a waiting period of 3 months or more, only 9% face a waiting period of 4 months or more. Workers in small firms (3-199 workers) generally have longer waiting periods than workers in larger firms (Exhibit 3.8).
- Ninety-one percent of covered workers at firms with many lower wage workers (firms where more than 35% of the workforce makes $23,000 or less) compared to 76% at firms with few lower-wage workers face a waiting period before coverage is available.
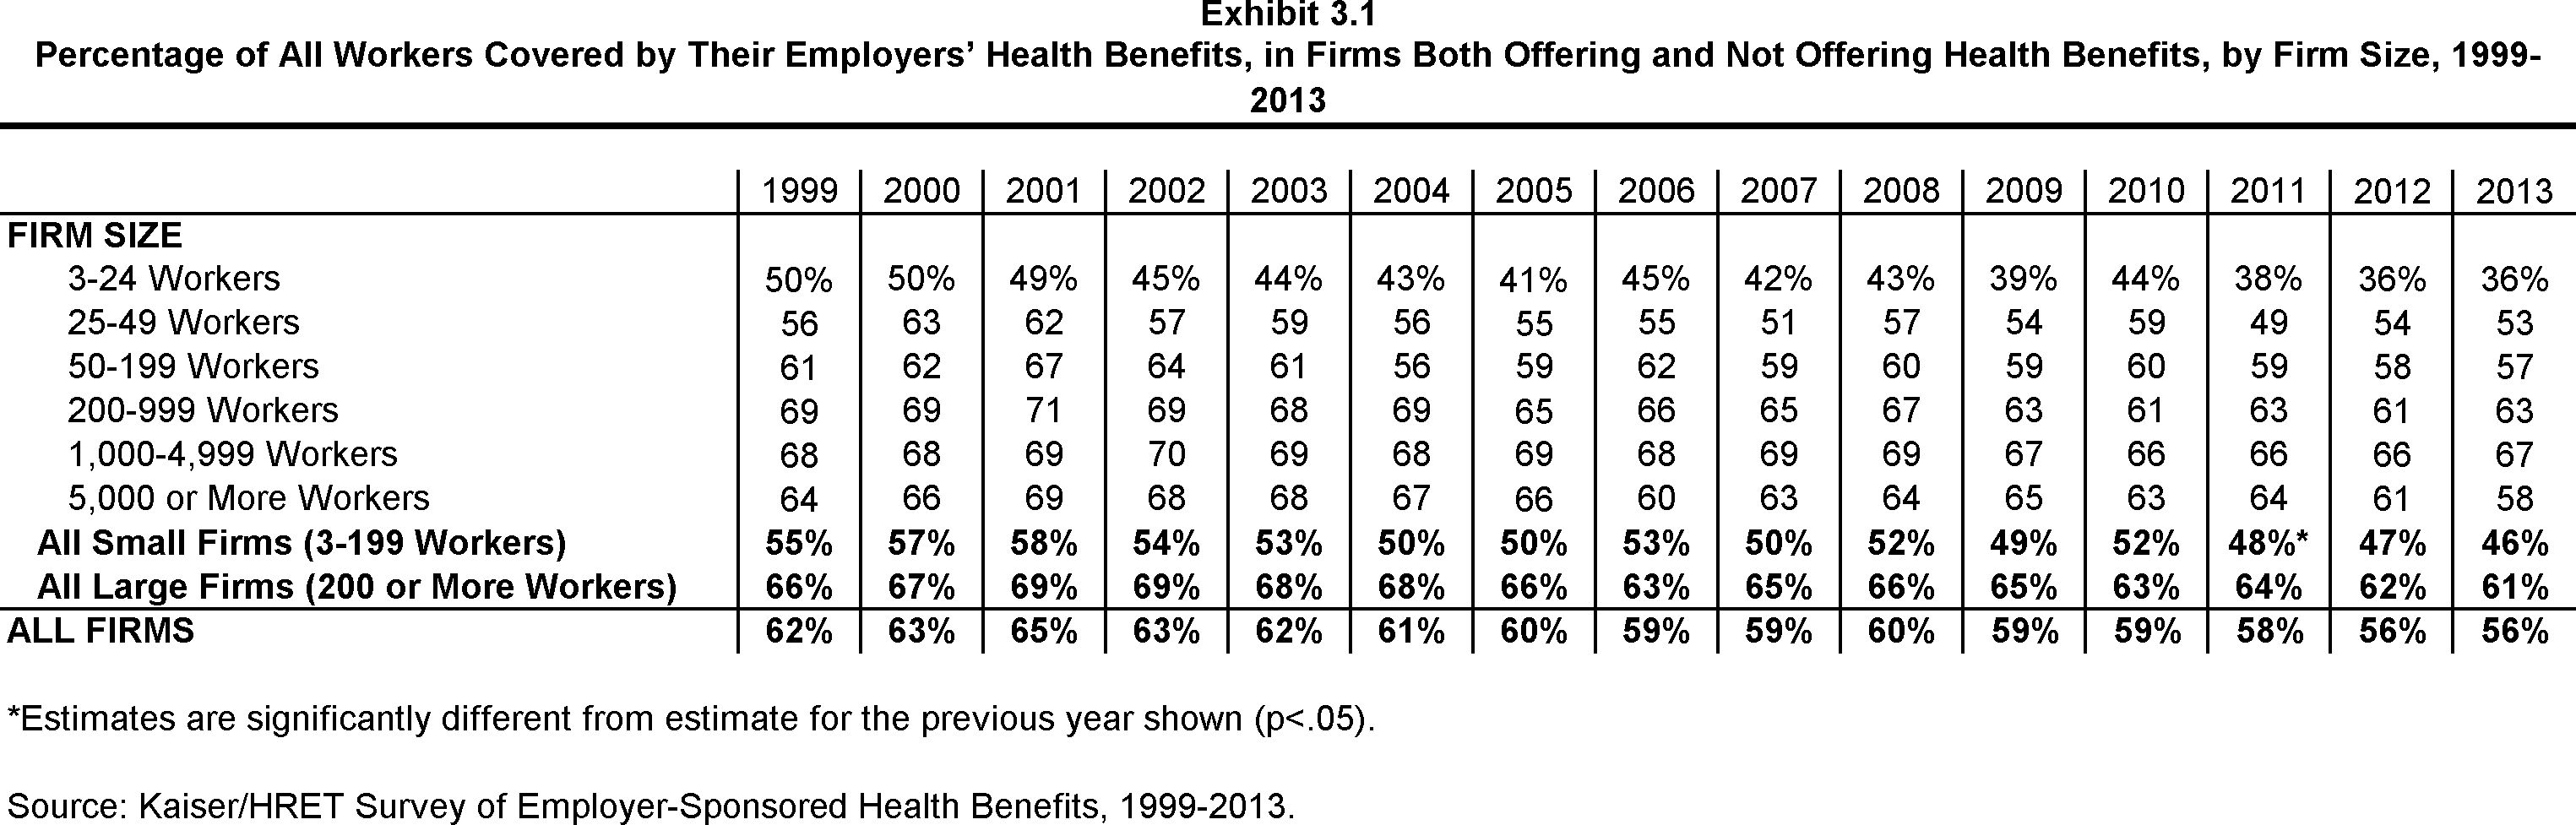
Percentage of All Workers Covered by Their Employers’ Health Benefits, in Firms Both Offering and Not Offering Health Benefits, by Firm Size, 1999-2013
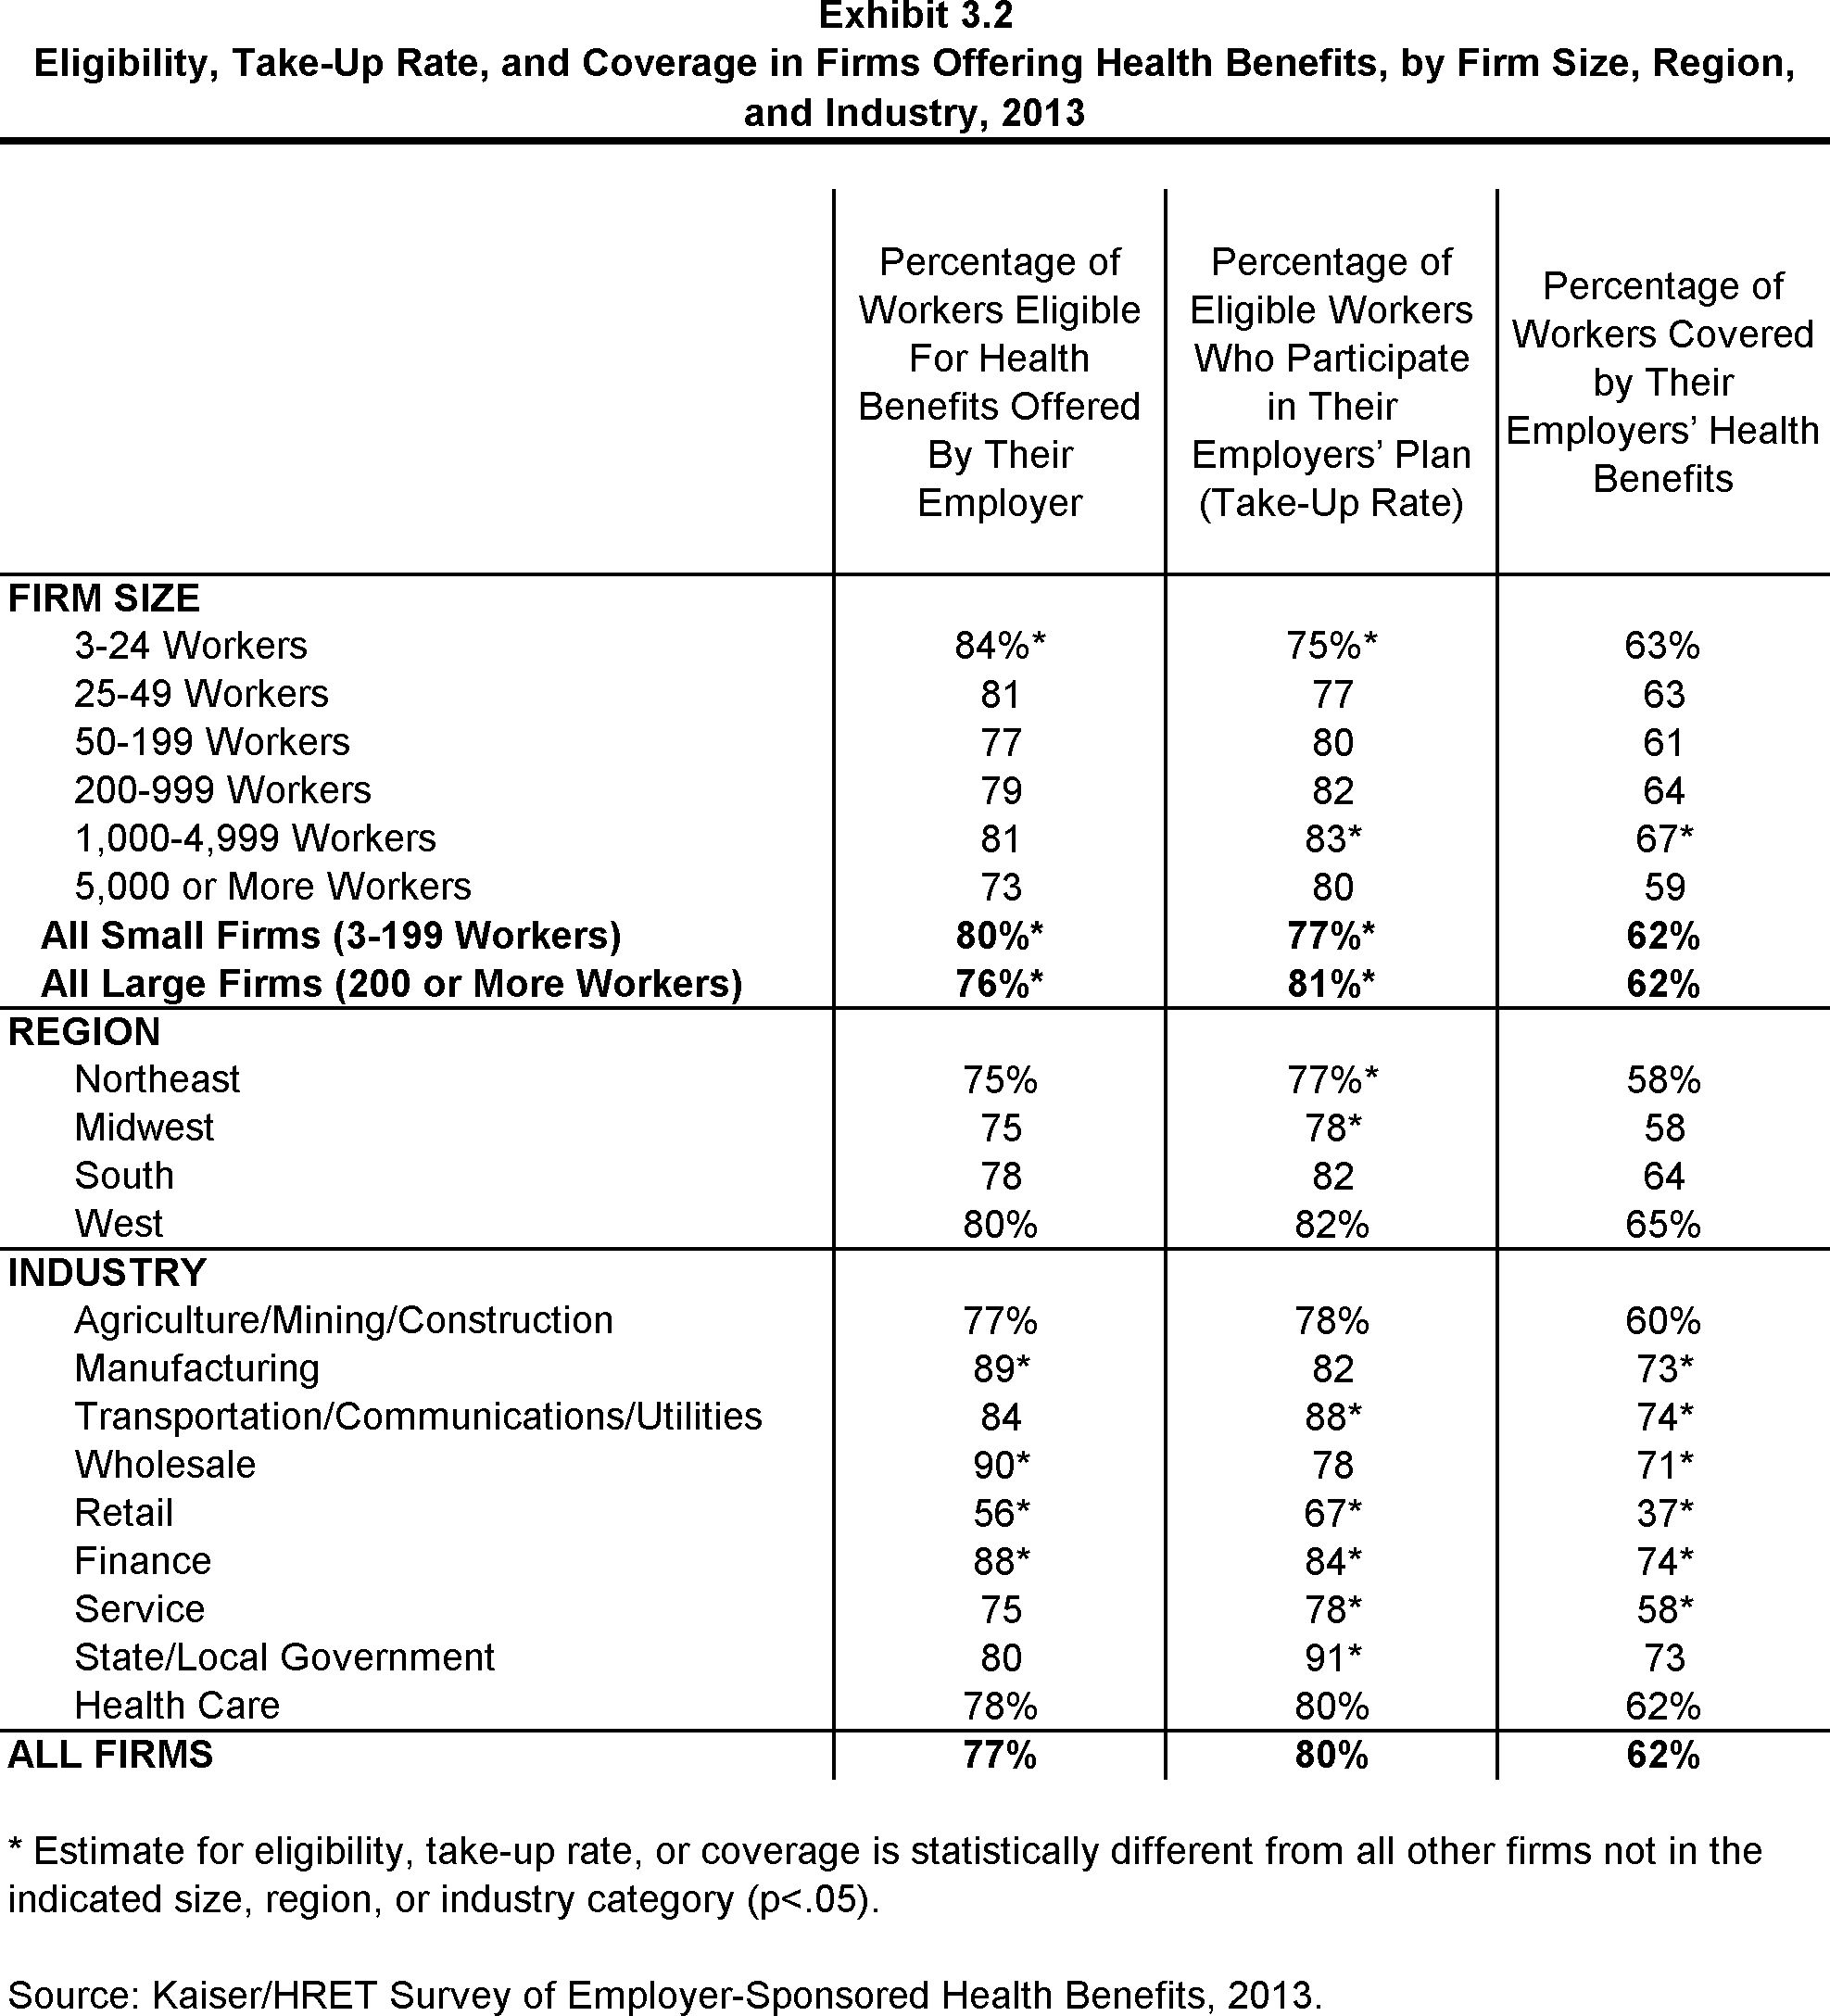
Eligibility, Take-Up Rate, and Coverage in Firms Offering Health Benefits, by Firm Size, Region, and Industry, 2013
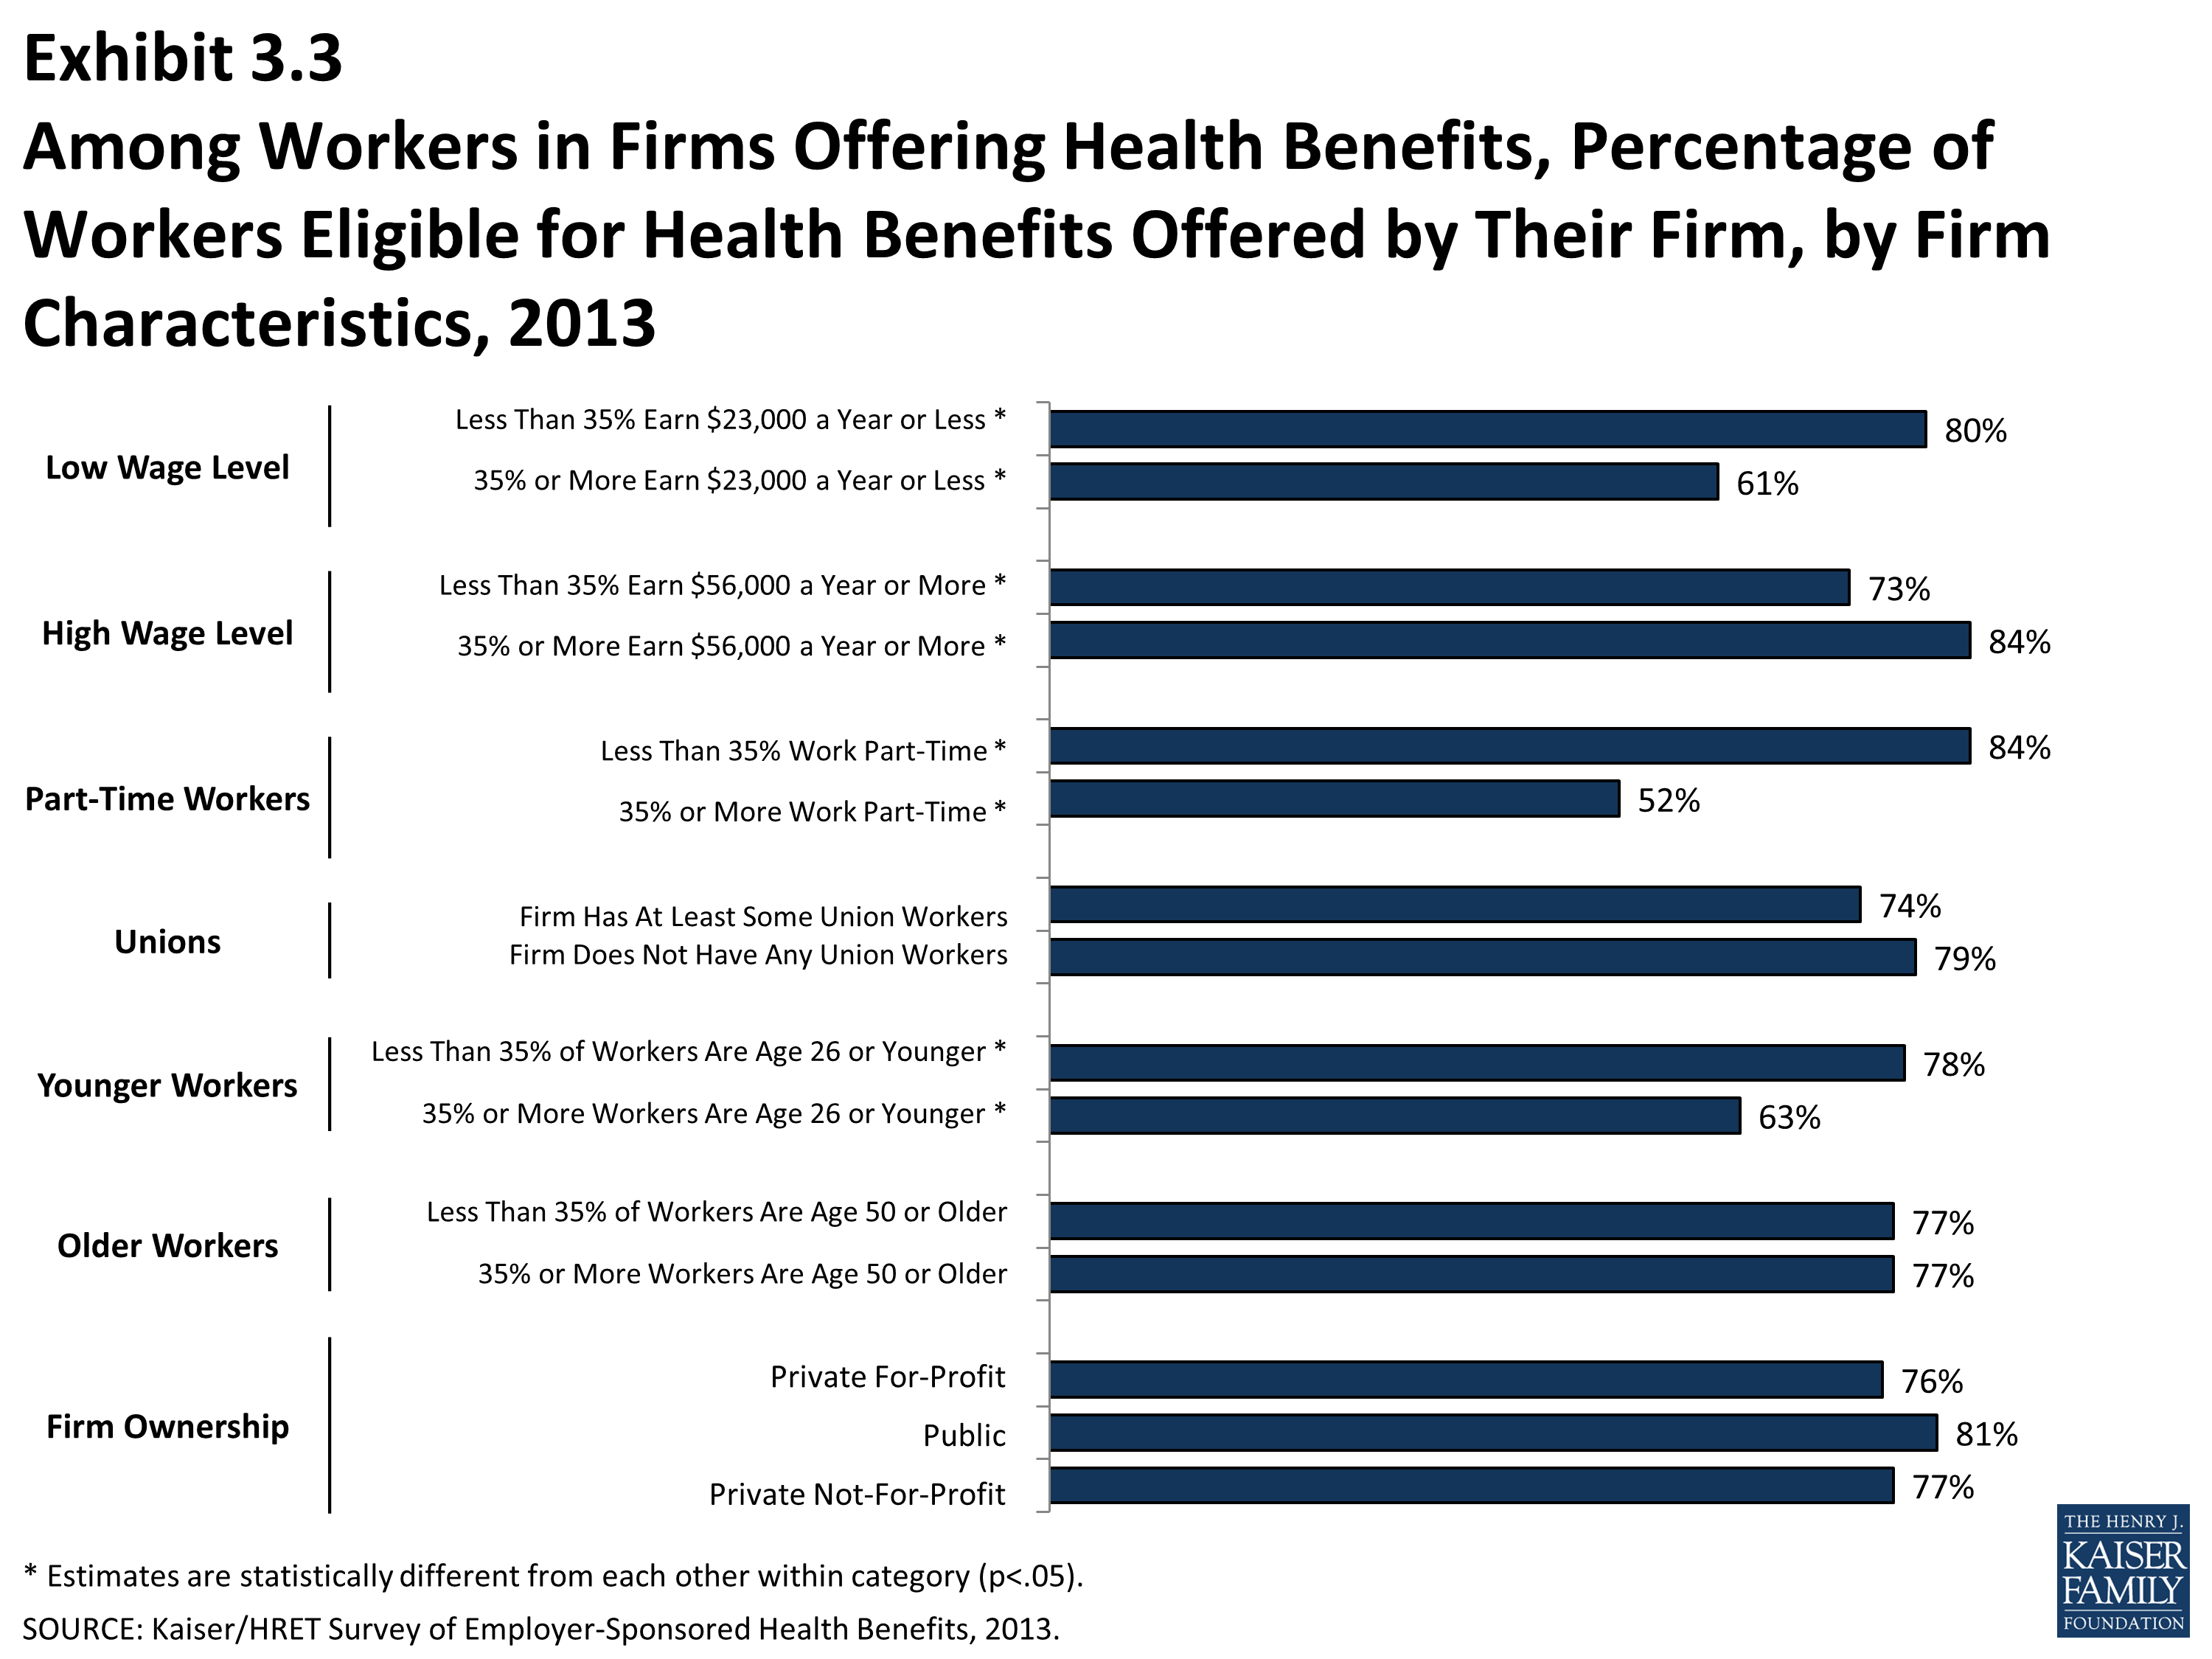
Among Workers in Firms Offering Health Benefits, Percentage of Workers Eligible for Health Benefits Offered by Their Firm, by Firm Characteristics, 2013
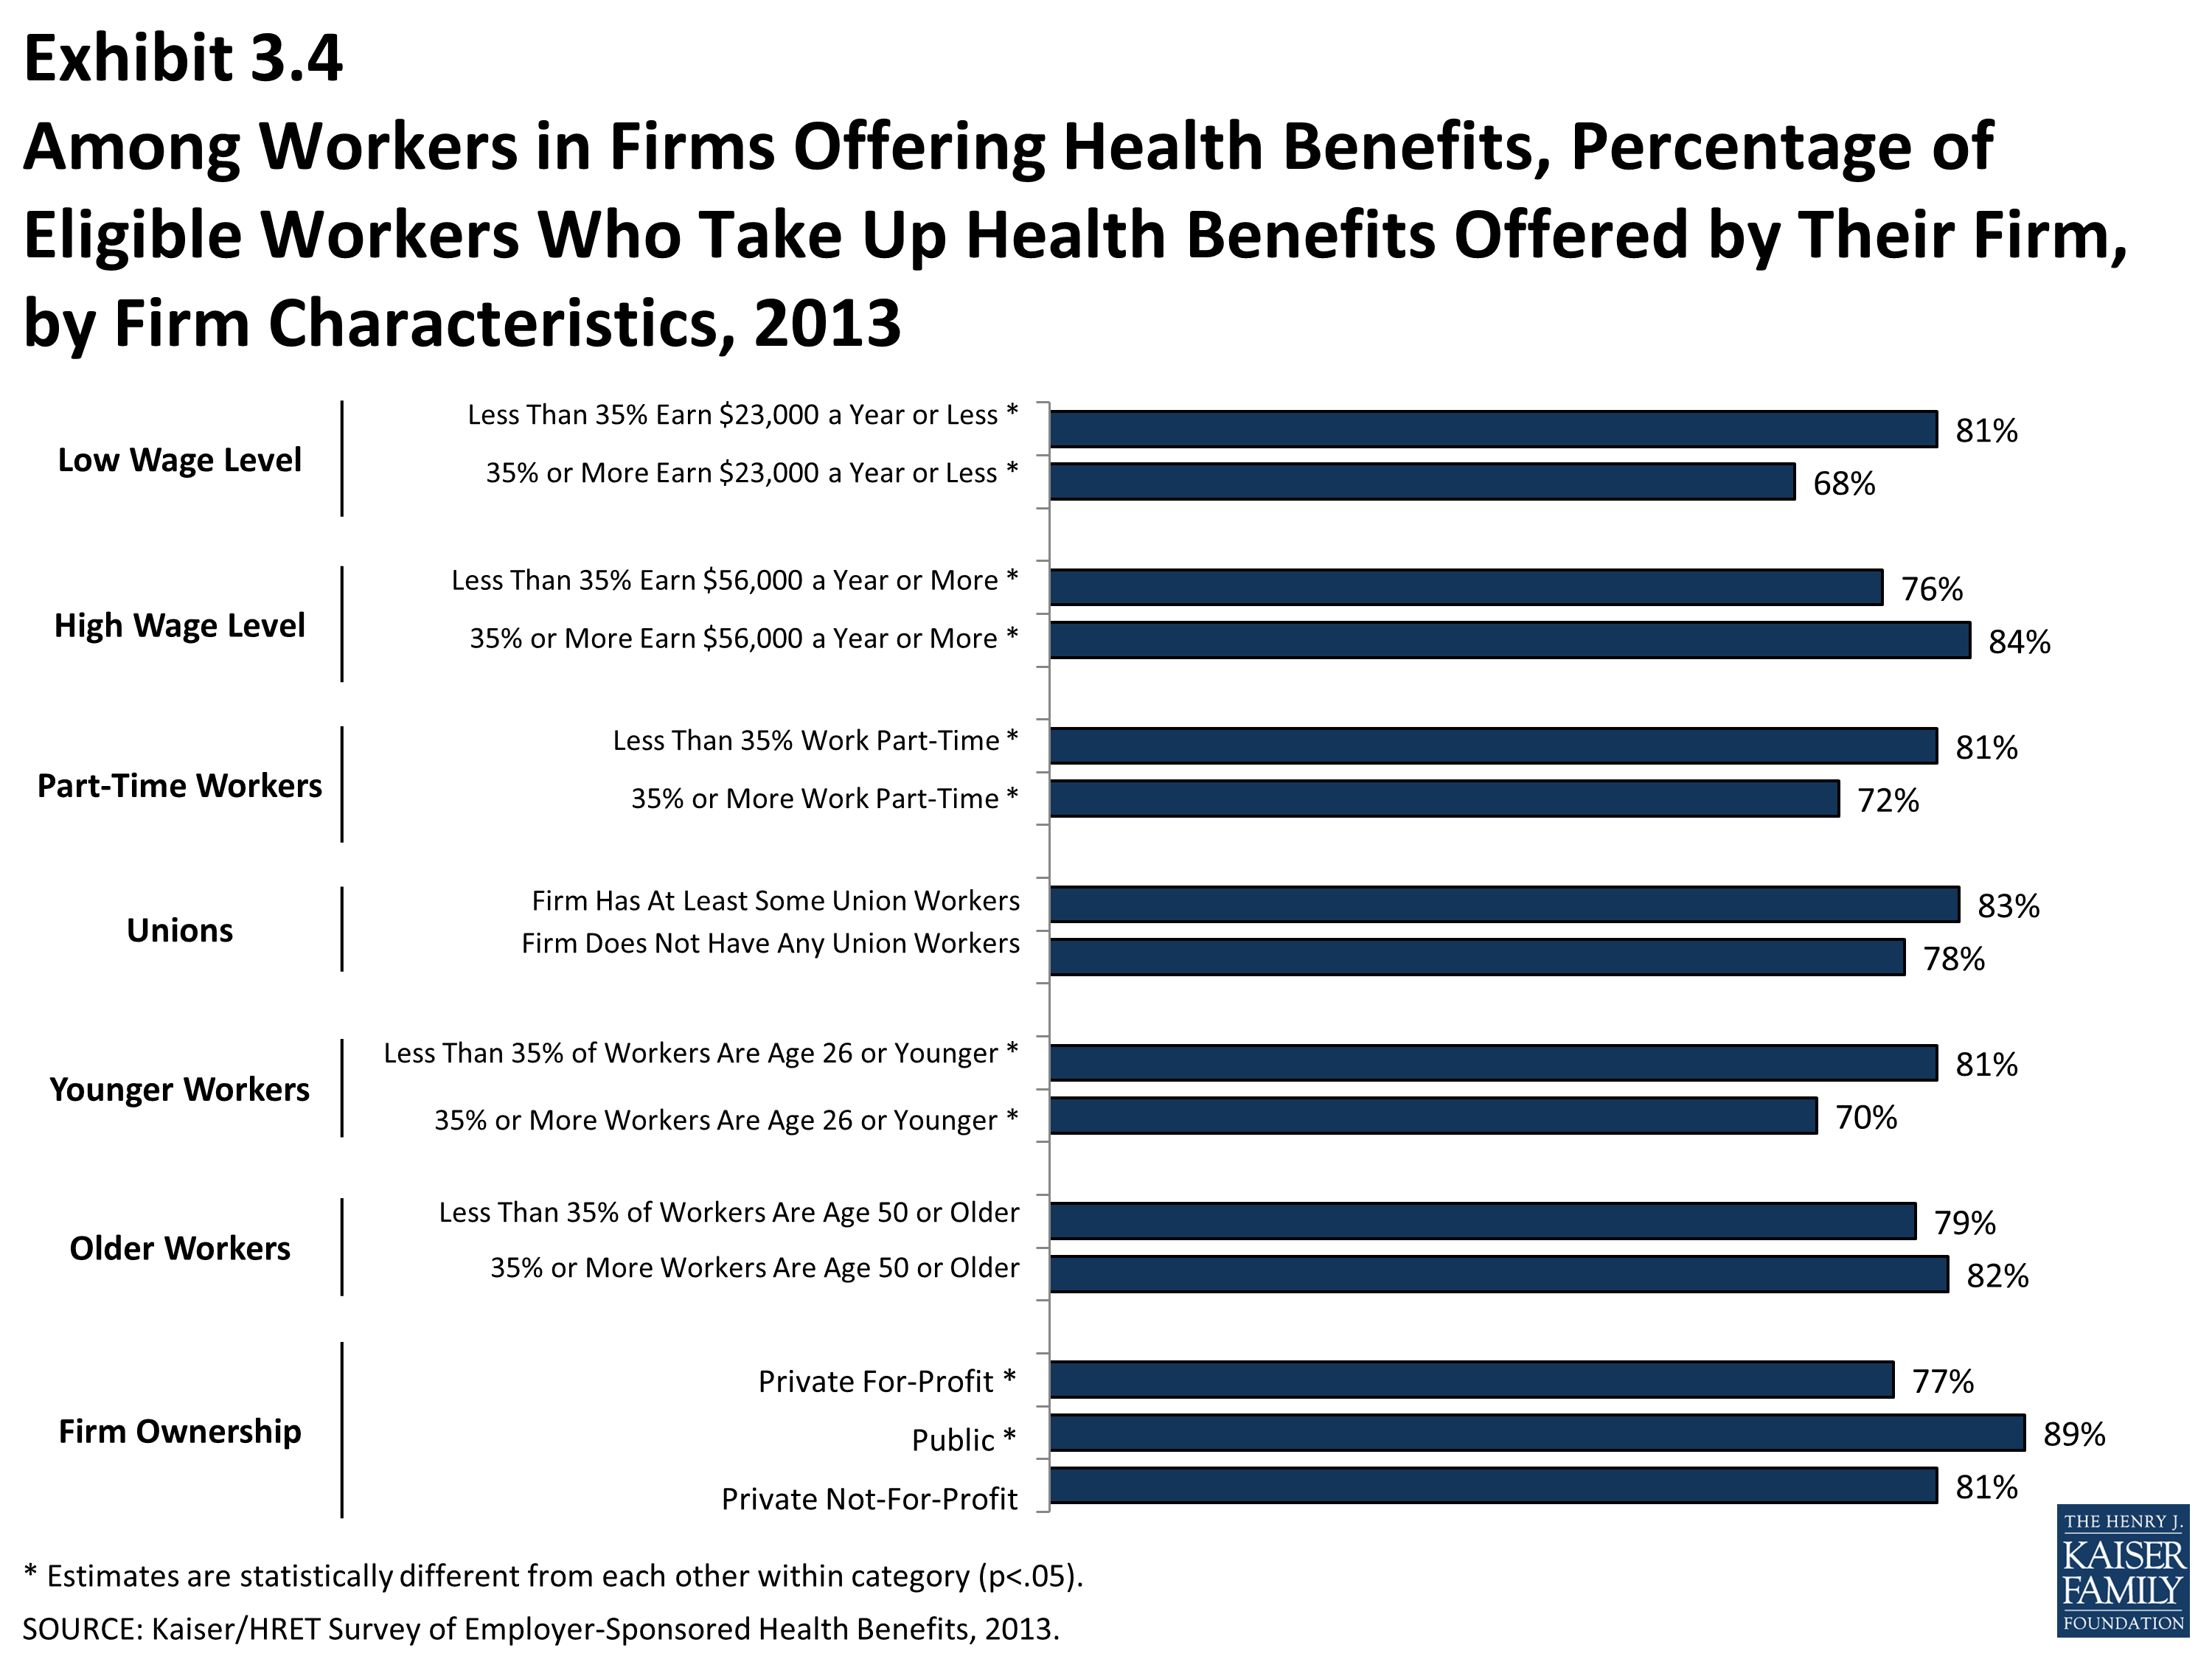
Among Workers in Firms Offering Health Benefits, Percentage of Eligible Workers Who Take Up Health Benefits Offered by Their Firm, by Firm Characteristics, 2013
Among Workers in Firms Offering Health Benefits, Percentage of Workers Covered by Health Benefits Offered by Their Firm, by Firm Characteristics, 2013
Eligibility, Take-Up Rate, and Coverage for Workers in Firms Offering Health Benefits, by Firm Size, 1999-2013
Percentage of Covered Workers in Firms with a Waiting Period for Coverage and Average Waiting Period in Months, by Firm Size, Region, and Industry, 2013
Distribution of Covered Workers with the Following Waiting Periods for Coverage, 2013
Section Four: Types of Plans Offered
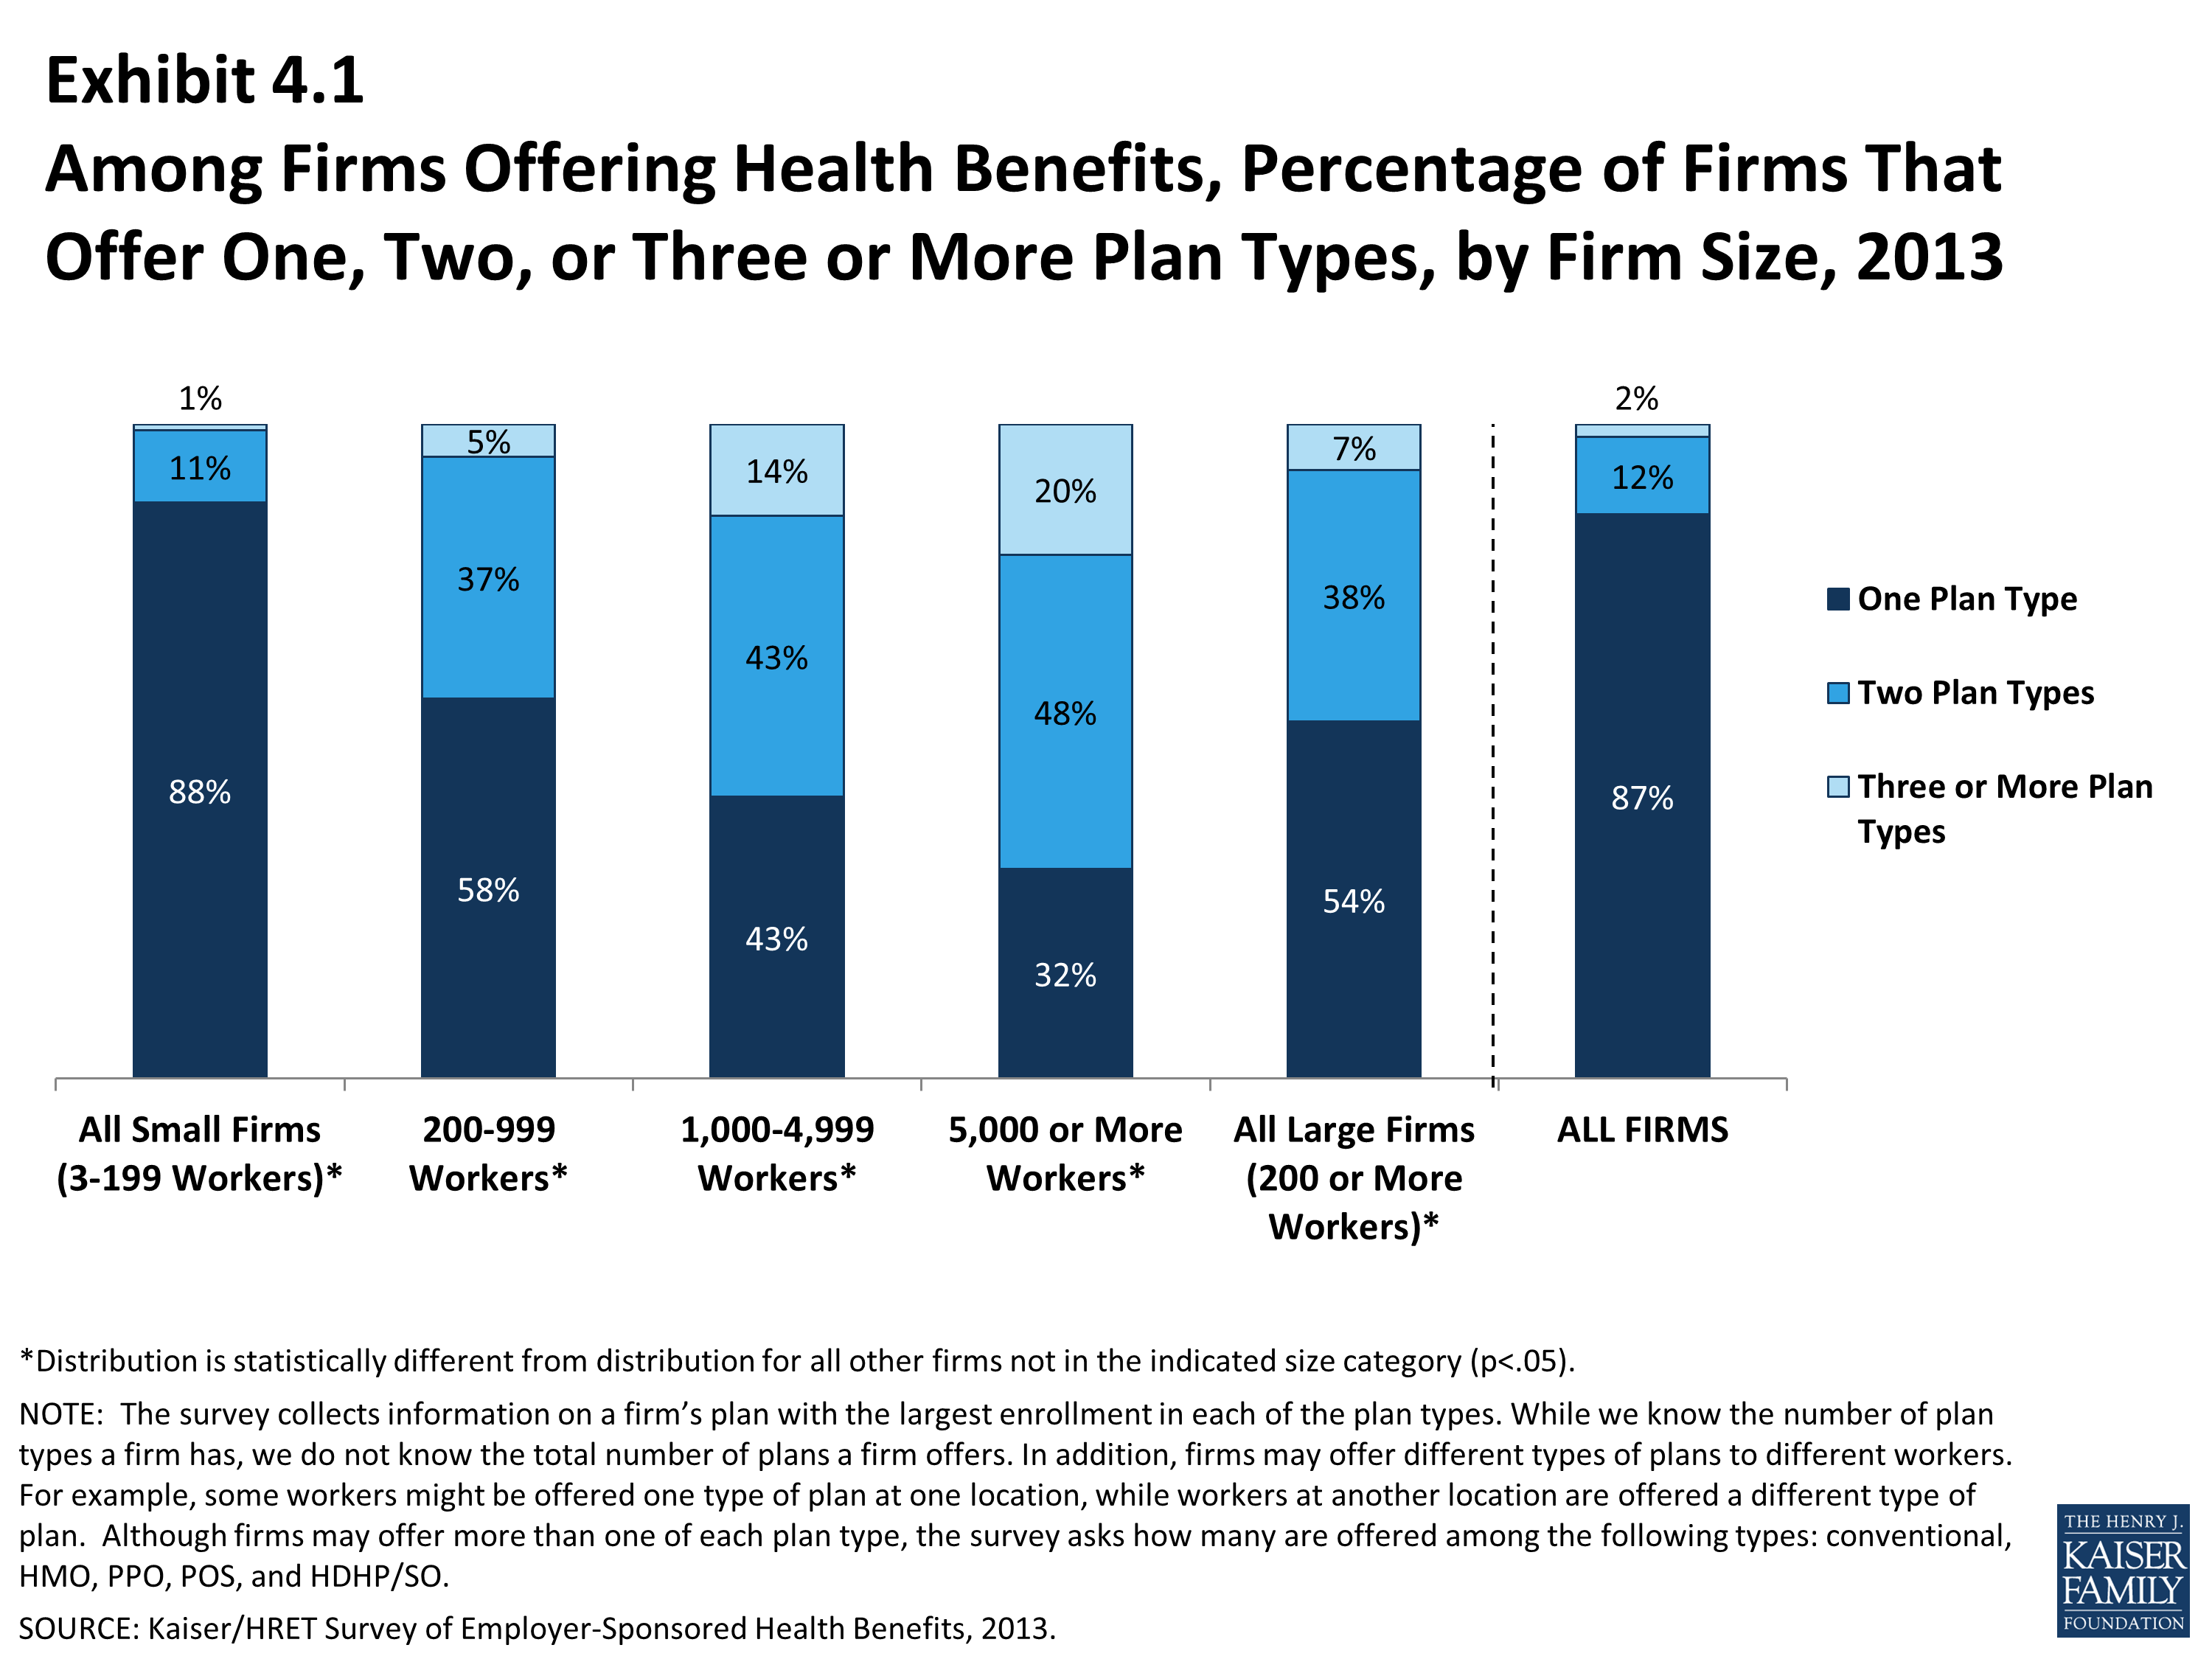
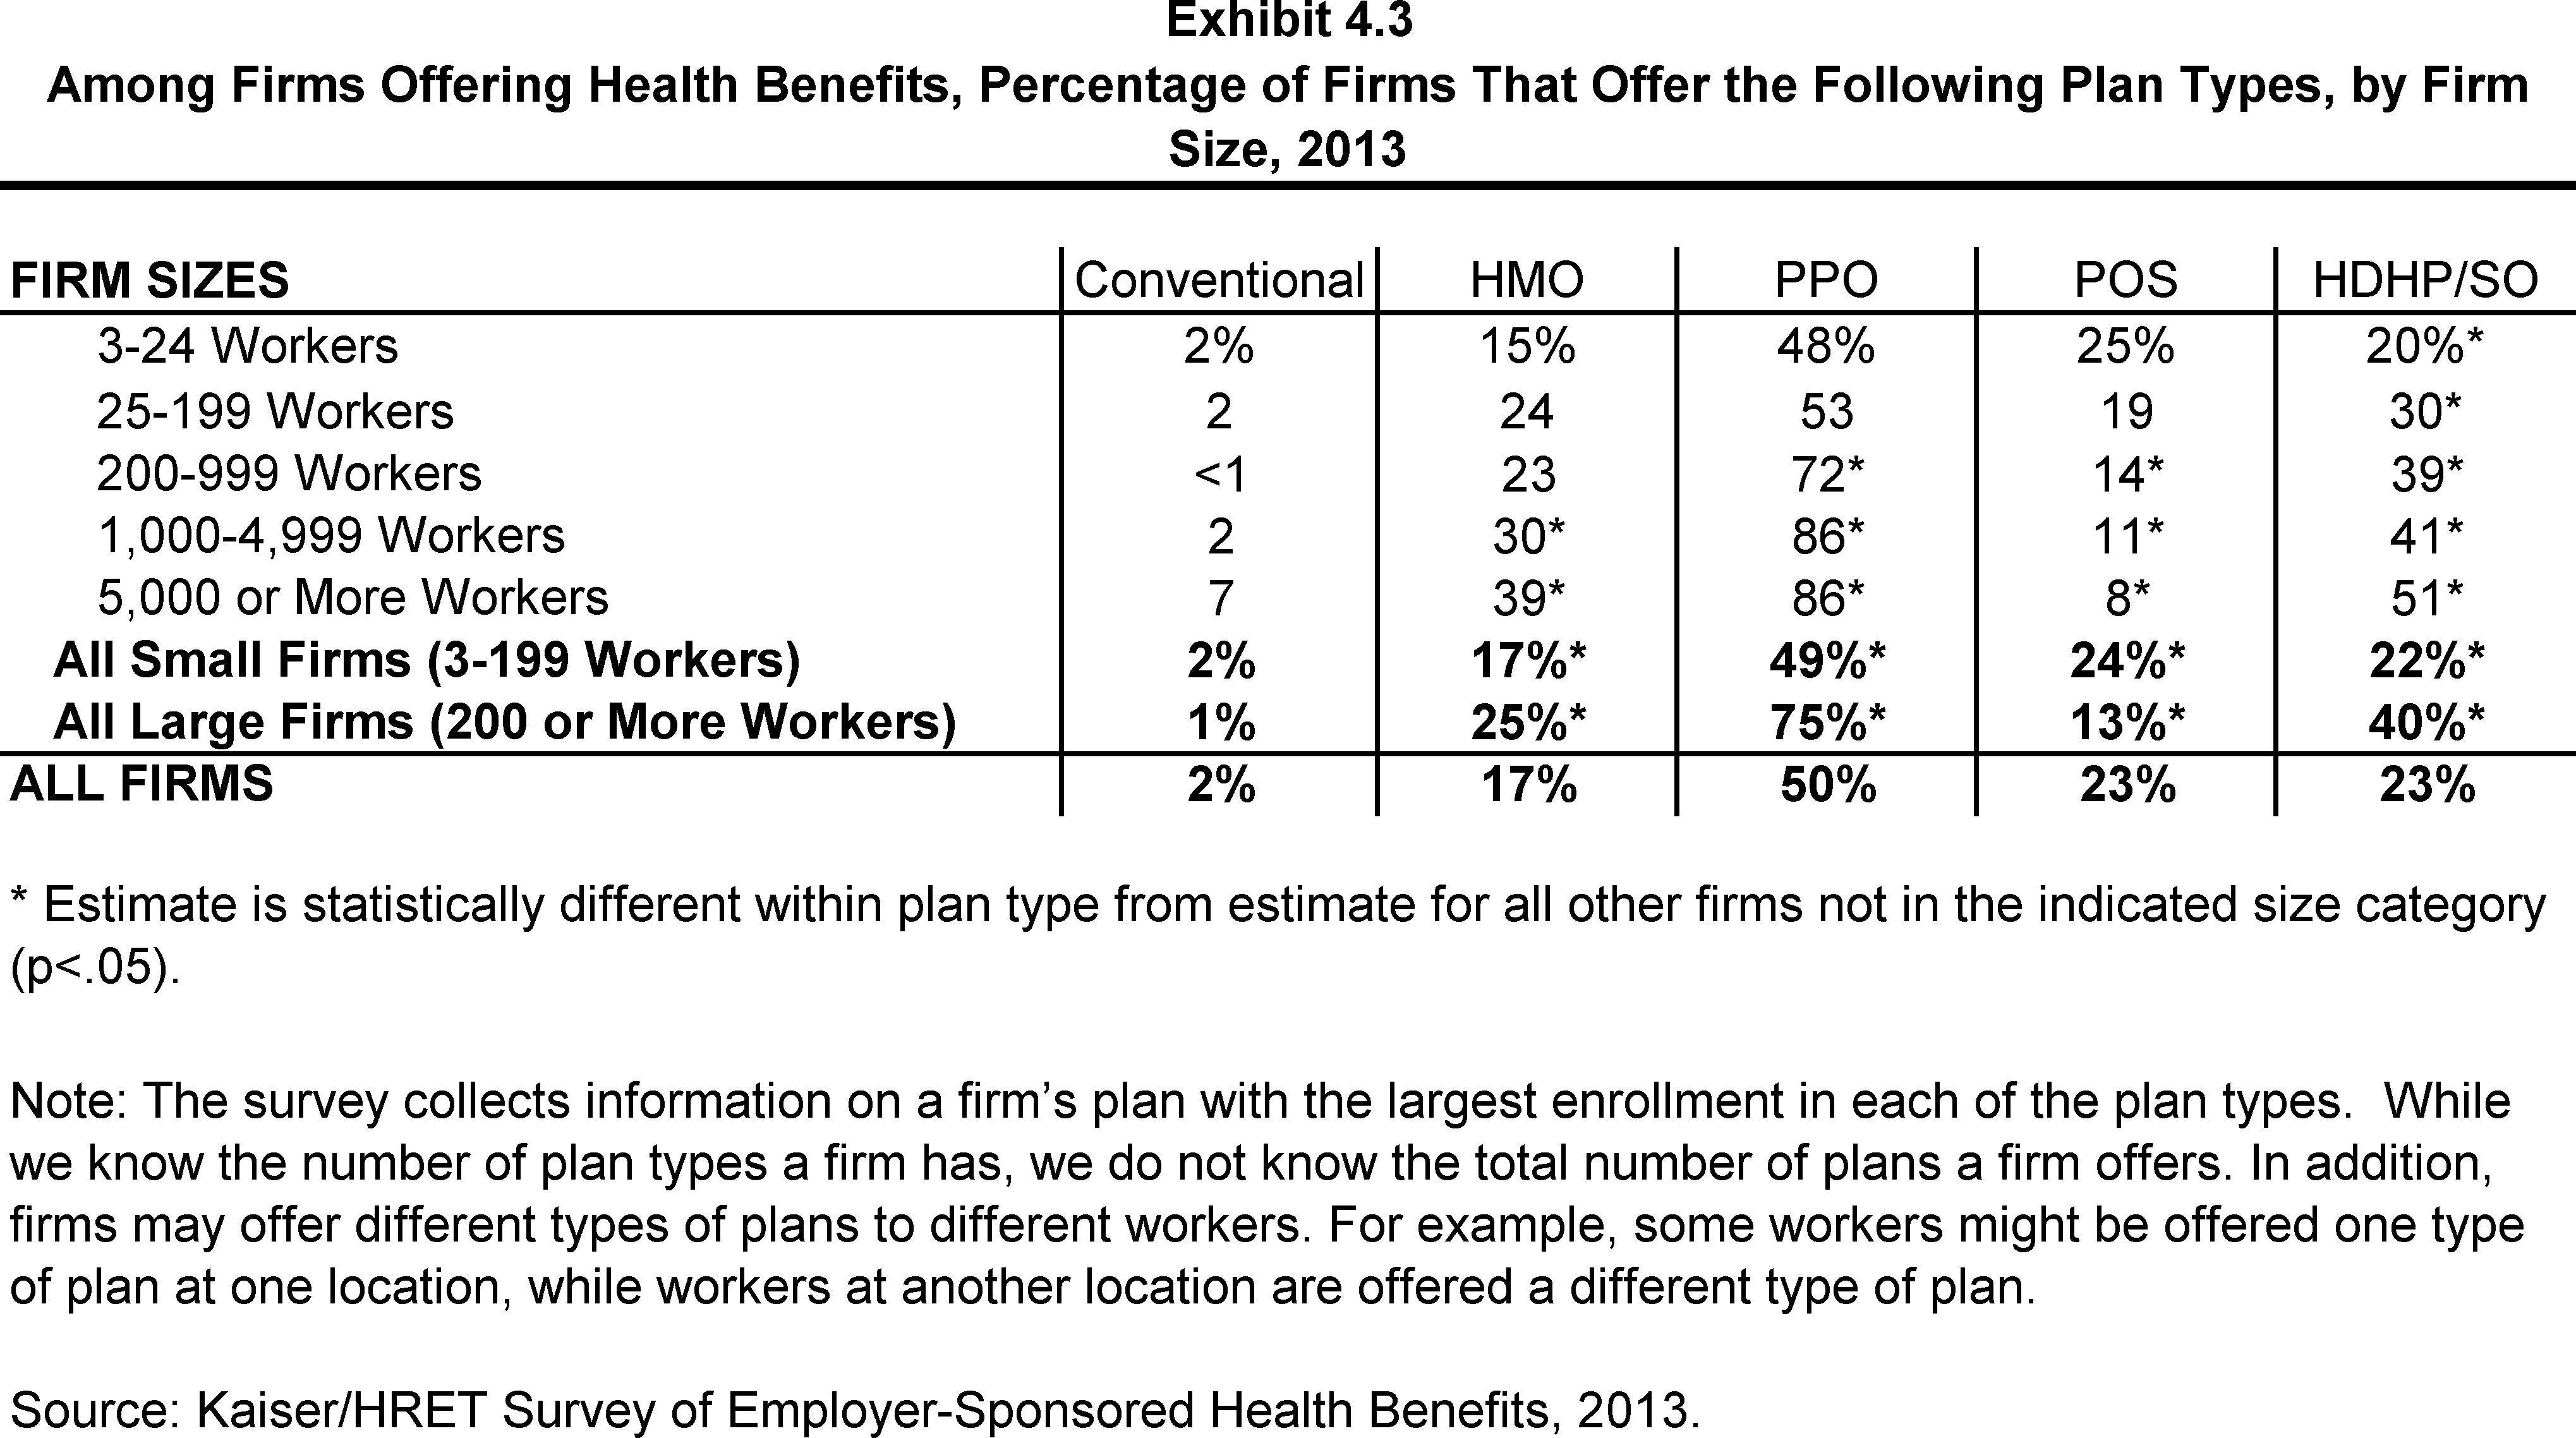
Most firms that offer health benefits offer only one type of health plan (82%) (See Text Box). Larger firms are more likely to offer more than one type of health plan. Employers are most likely to offer their workers a PPO, HMO, or HDHP/SO plan and are least likely to offer a conventional plan.
- Eighty-two percent of firms offering health benefits in 2012 offer only one type of health plan. Large firms (200 or more workers) are more likely to offer more than one plan type than small firms (3-199 workers): 45% vs. 17% (Exhibit 4.1).
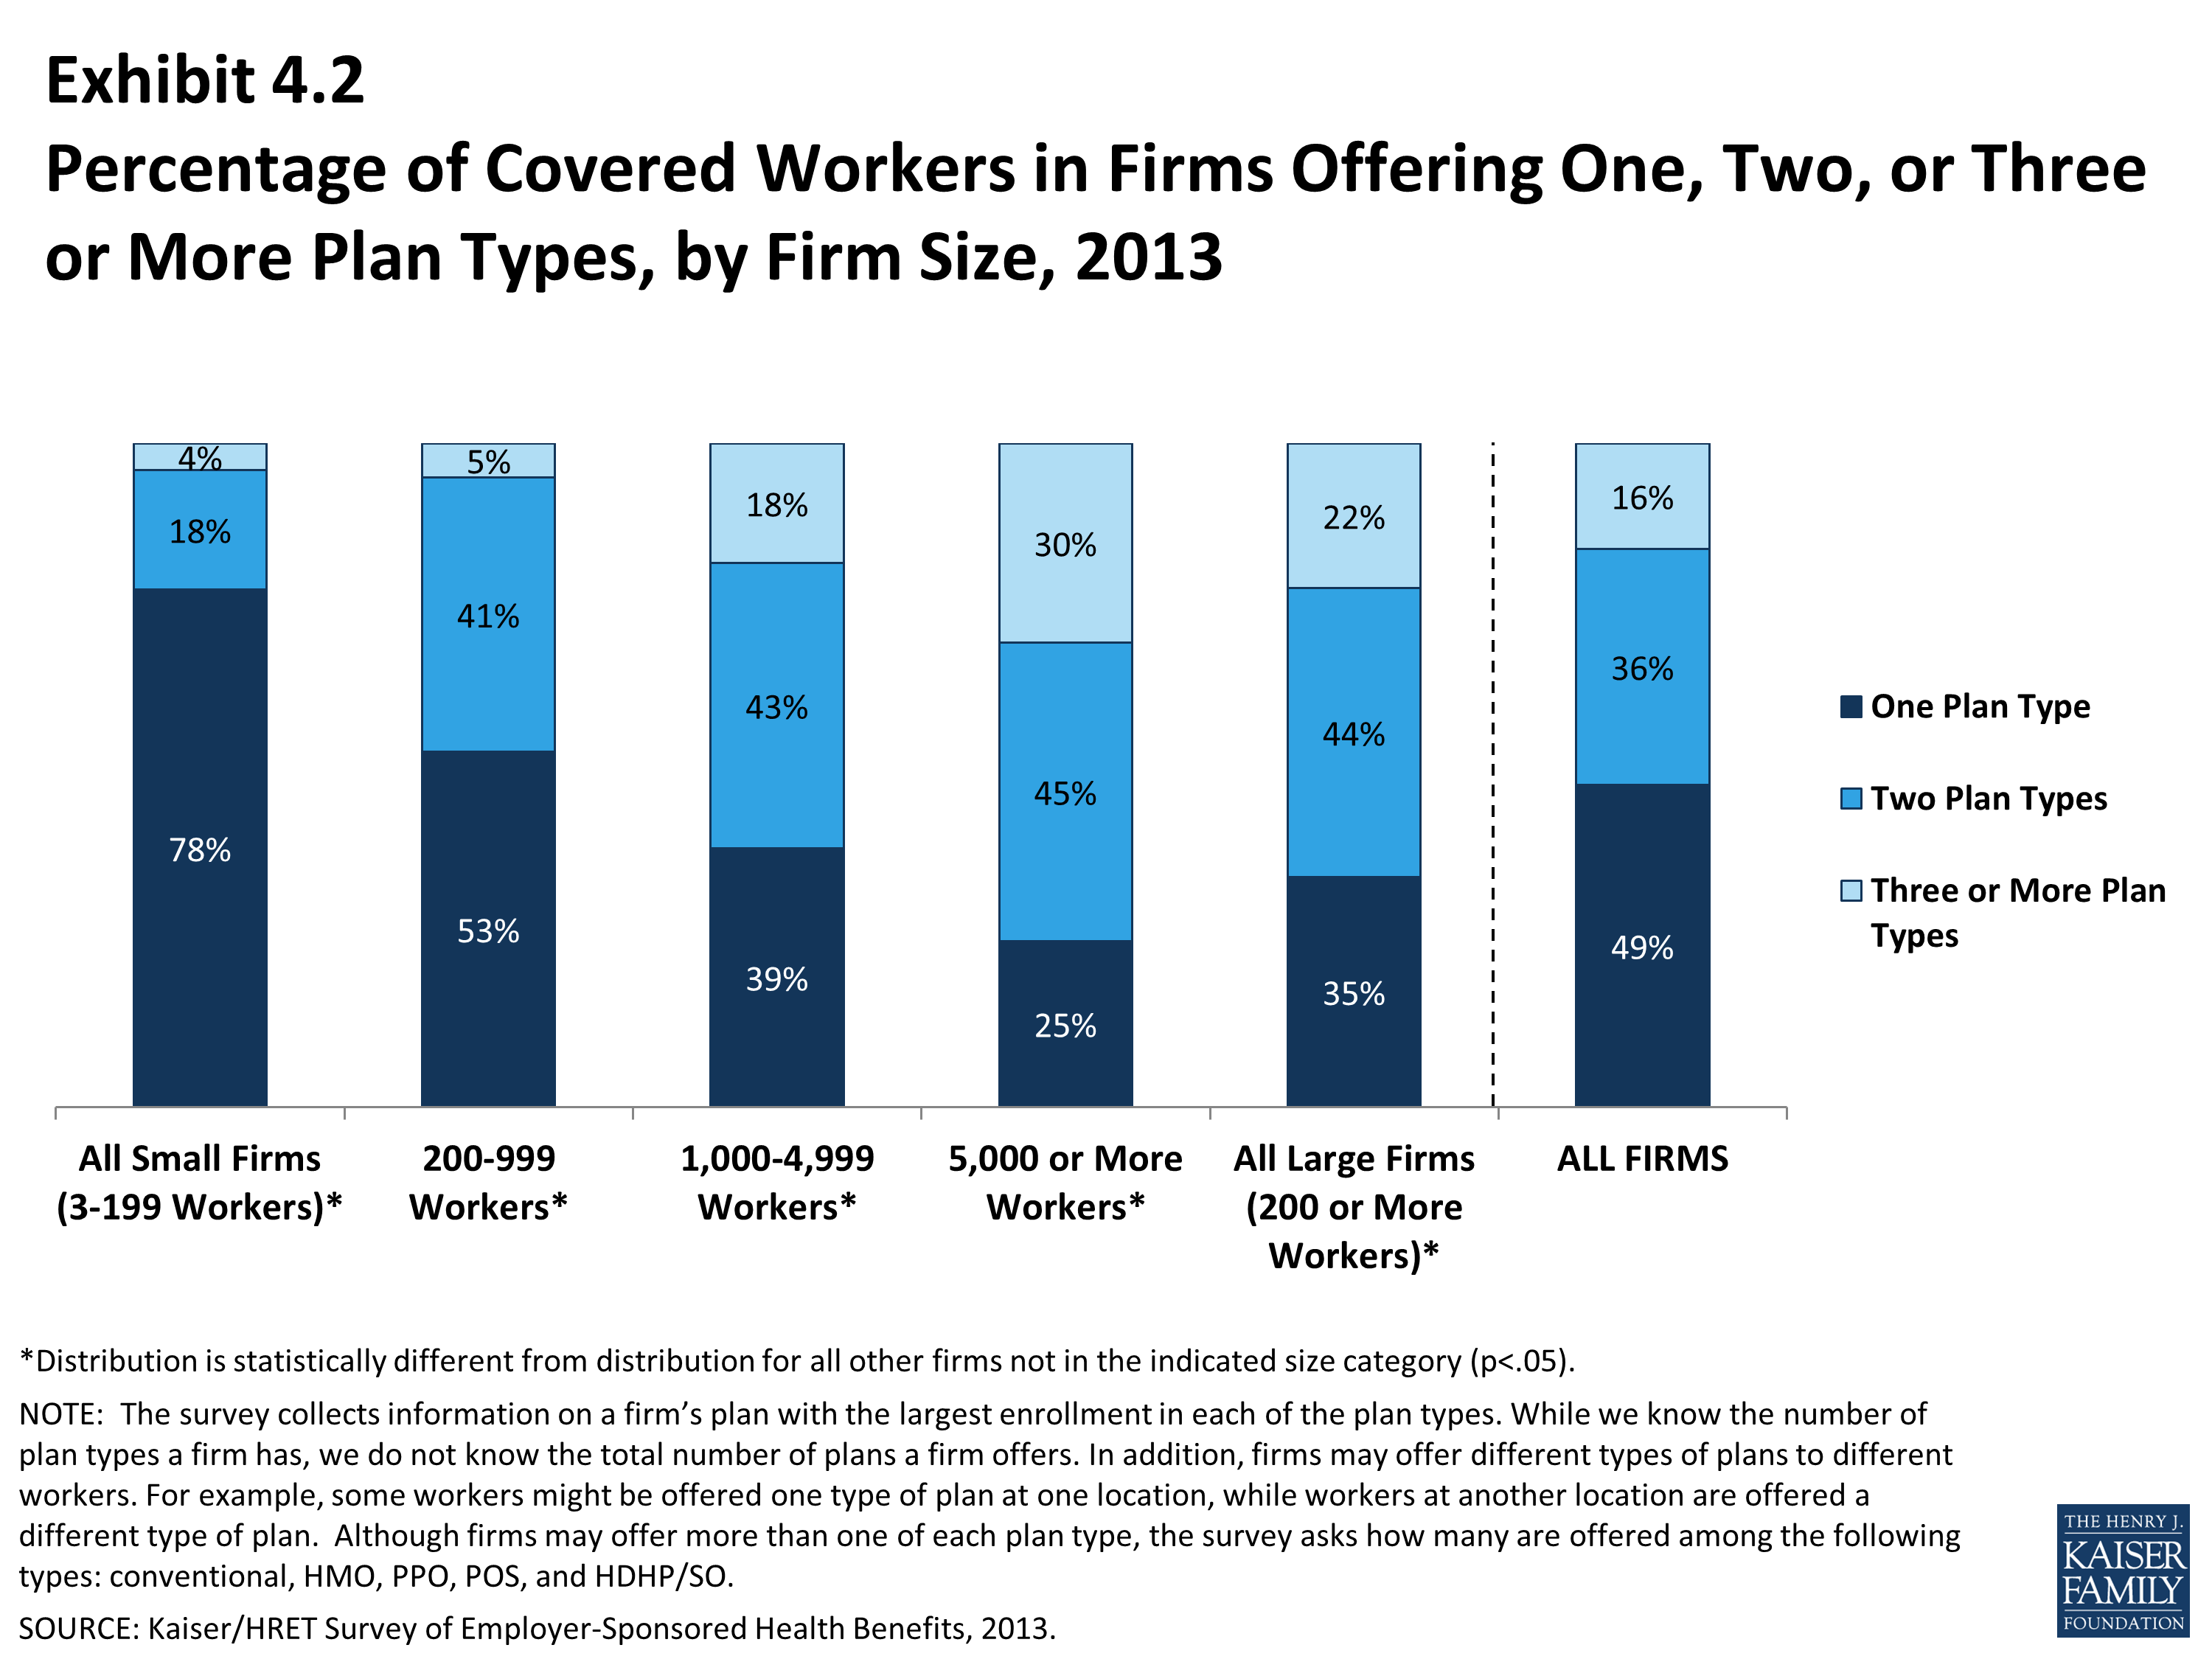
- Over half (52%) of covered workers are employed in a firm that offers more than one health plan type. Sixty-five percent of covered workers in large firms (200 or more workers) are employed by a firm that offers more than one plan type, compared to 26% in small firms (3-199 workers) (Exhibit 4.2).
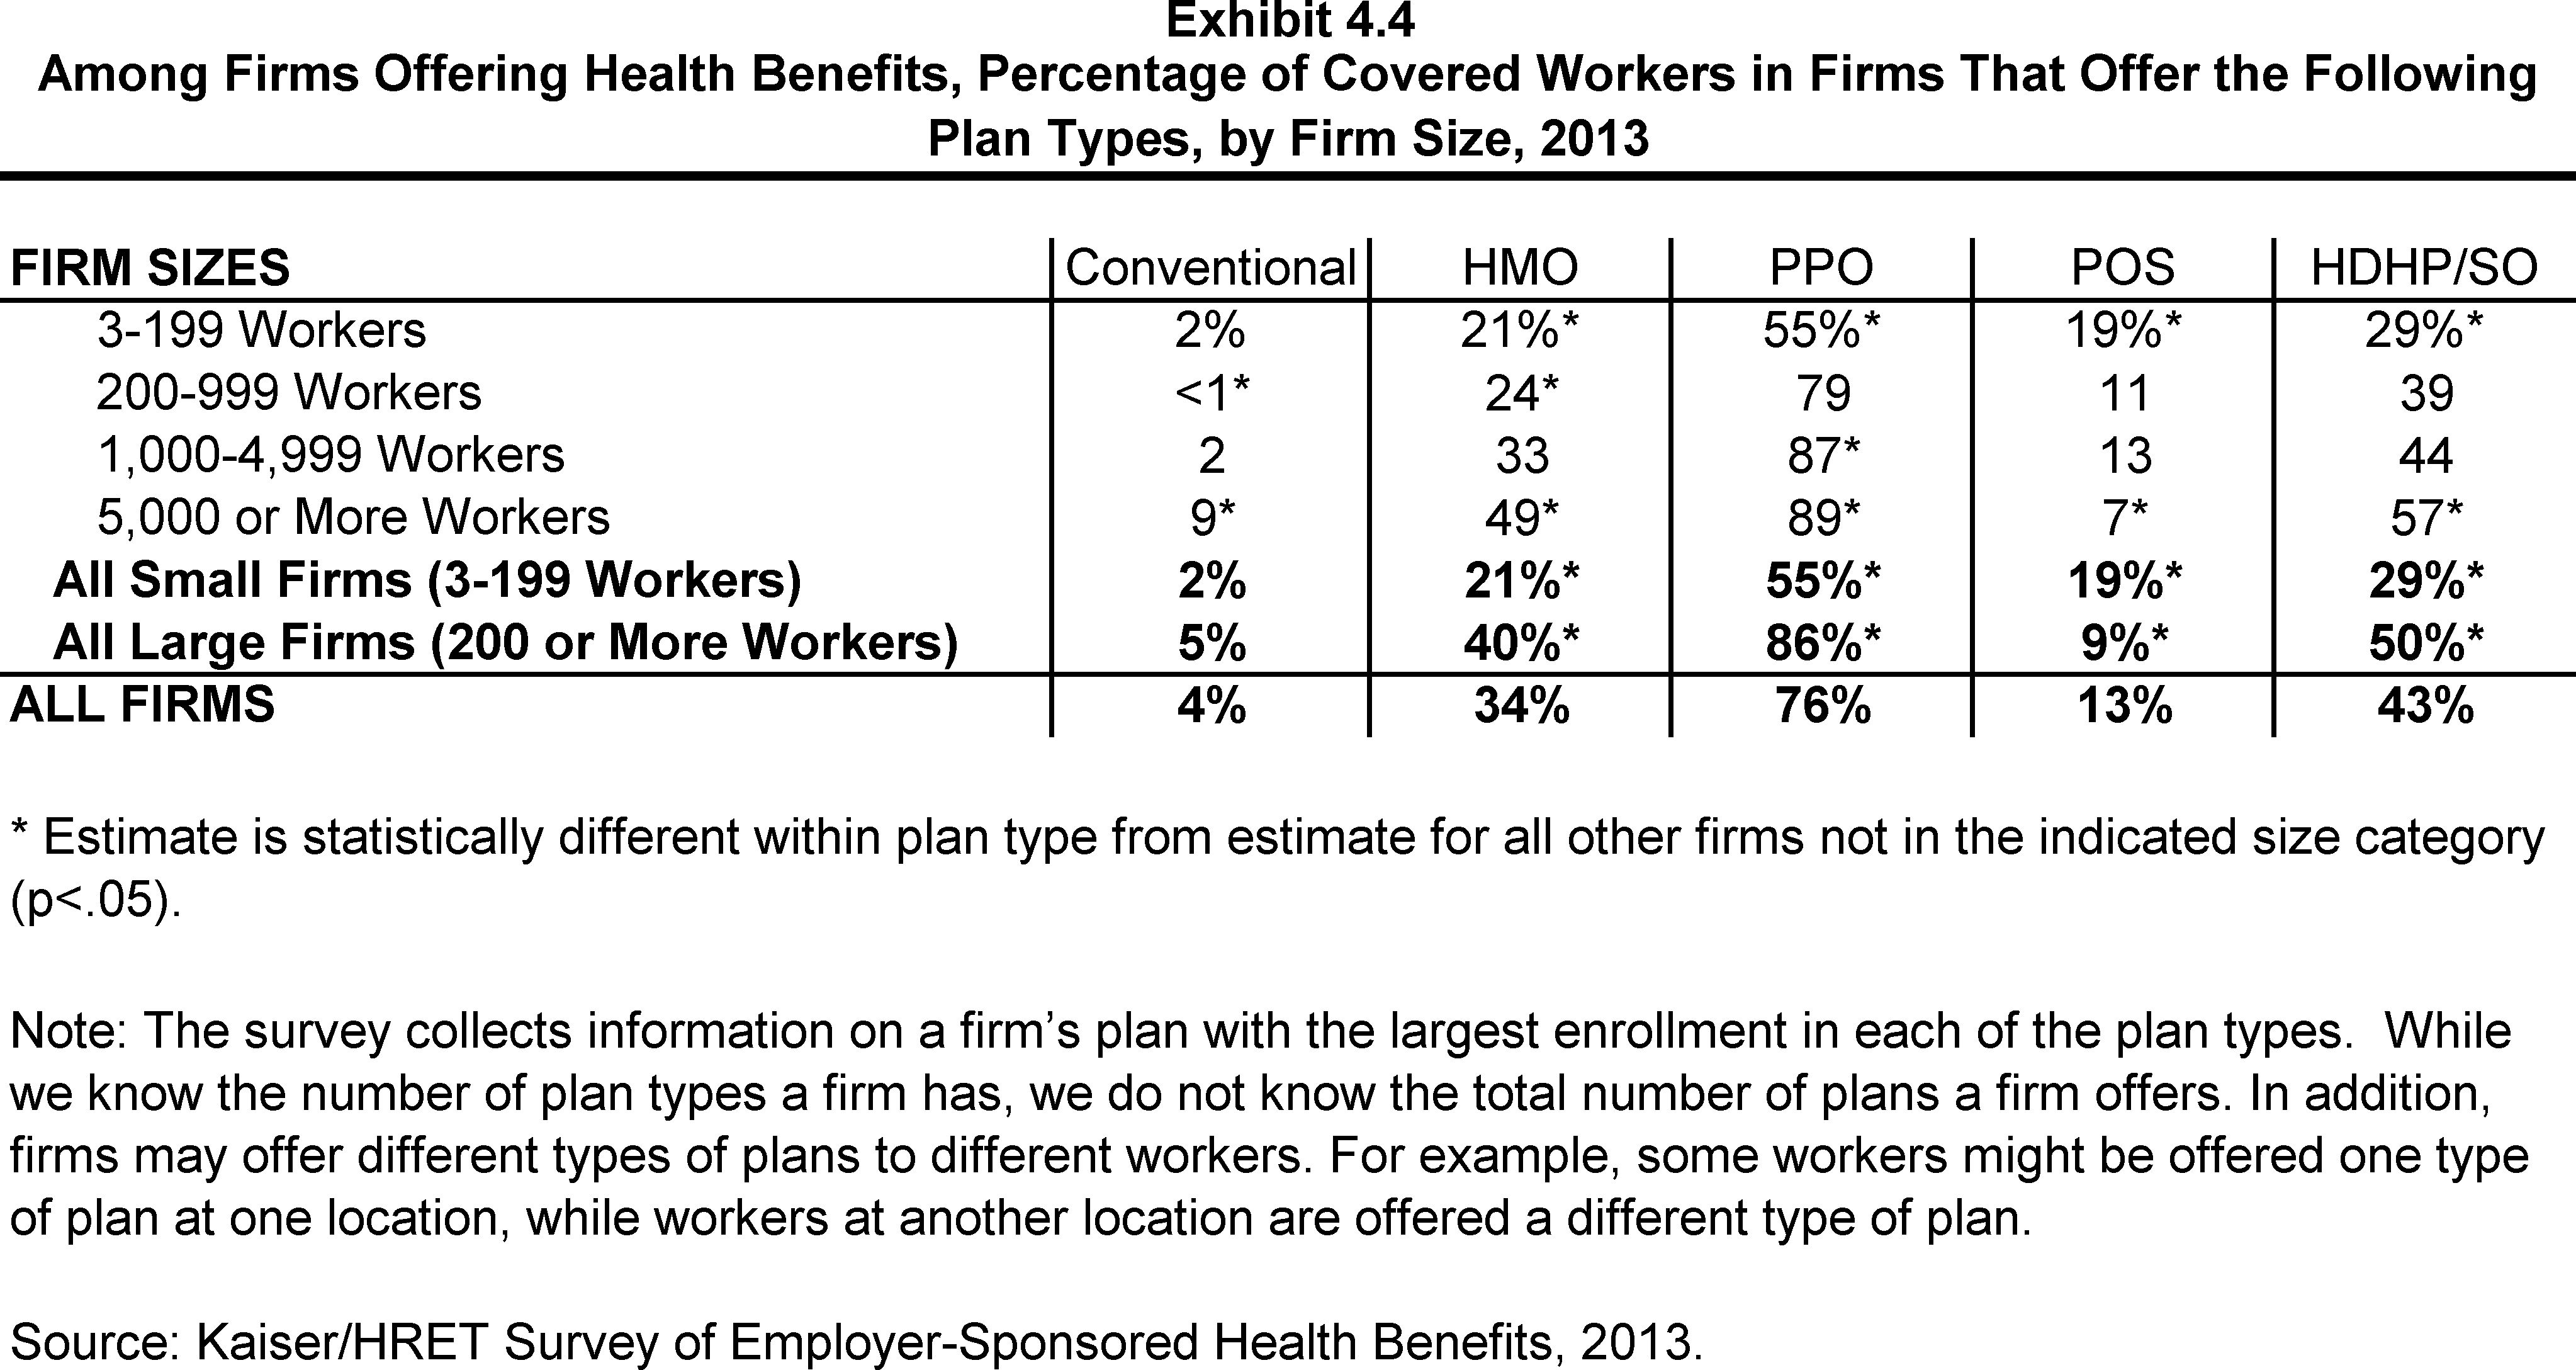
- Three quarters (75%) of covered workers in firms offering health benefits work in a firm that offers one or more PPOs; 39% work in firms that offer one or more HDHP/SOs; 37% work in firms that offer one or more HMOs; 14% work in firms that offer one or more POS plans; and 4% work in firms that offer one or more conventional plans (Exhibit 4.4).1
The survey collects information on a firm’s plan with the largest enrollment in each of the plan types. While we know the number of plan types a firm has, we do not know the total number of plans a firm offers. In addition, firms may offer different types of plans to different workers. For example, some workers might be offered one type of plan at one location, while workers at another location are offered a different type of plan.
Among Firms Offering Health Benefits, Percentage of Firms That Offer One, Two, or Three or More Plan Types, by Firm Size, 2013
Percentage of Covered Workers in Firms Offering One, Two, or Three or More Plan Types, by Firm Size, 2013
Among Firms Offering Health Benefits, Percentage of Firms That Offer the Following Plan Types, by Firm Size, 2013
Among Firms Offering Health Benefits, Percentage of Covered Workers in Firms That Offer the Following Plan Types, by Firm Size, 2013
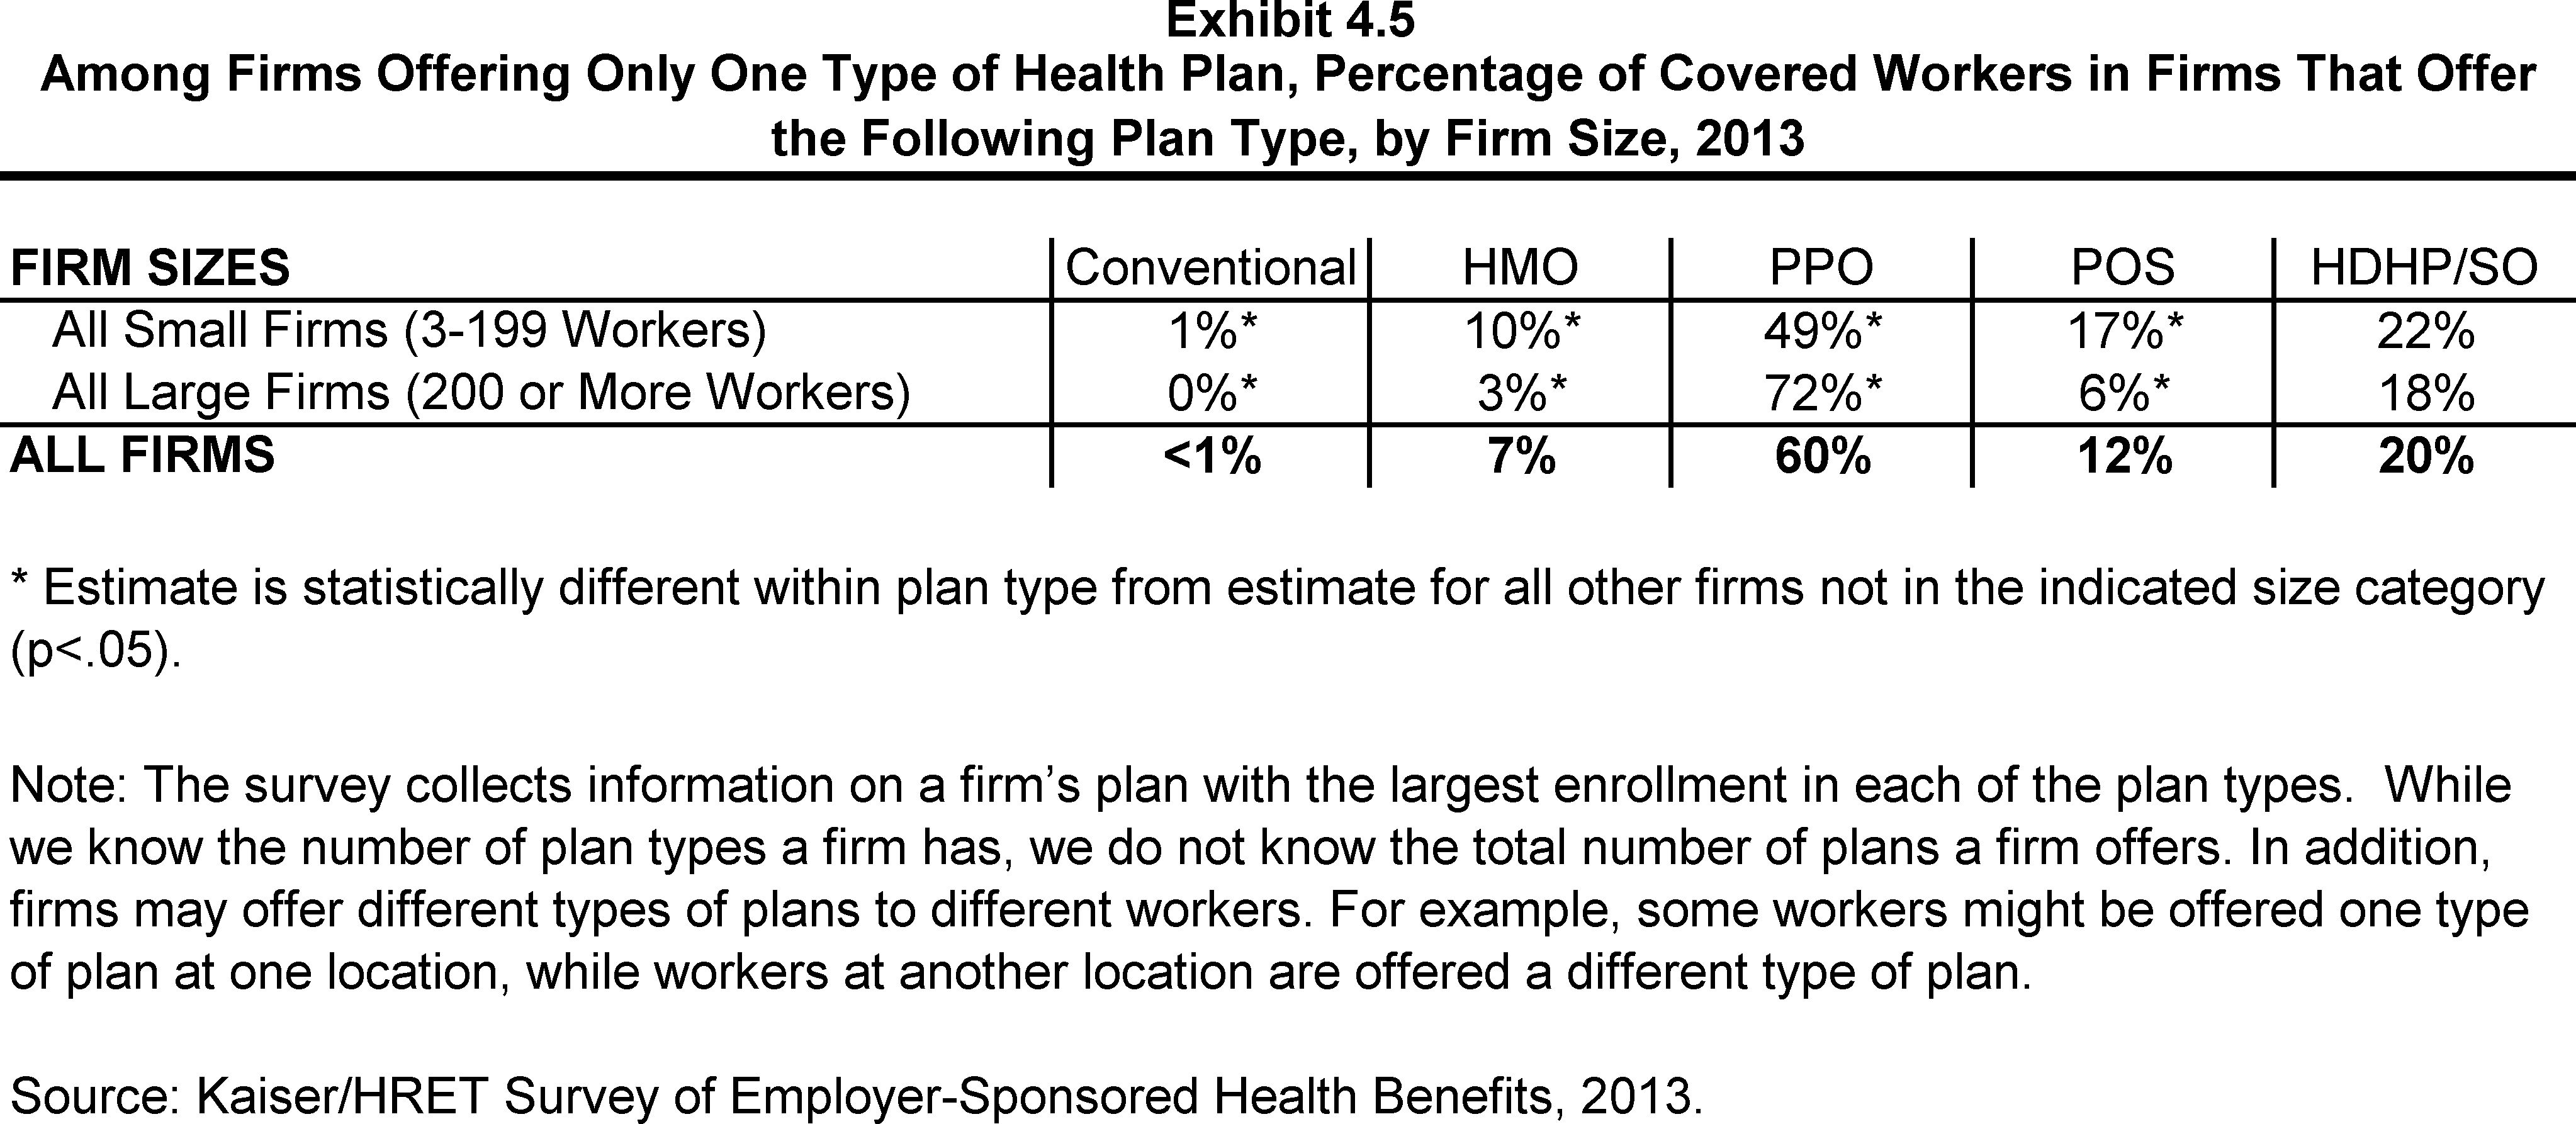
Among Firms Offering Only One Type of Health Plan, Percentage of Covered Workers in Firms That Offer the Following Plan Type, by Firm Size, 2013
Section Five: Market Shares of Health Plans
Enrollment remains highest in PPO plans, covering more than half of covered workers, followed by HDHP/SOs, HMO plans, POS plans, and conventional plans. Enrollment distribution varies by firm size, for example, PPOs are relatively more popular for covered workers at large firms (200 or more workers) than smaller firms (62% vs. 47%) and POS plans are relatively more popular among smaller firms than large firms (16% vs. 5%) (Exhibit 5.2).
- Fifty-seven percent of covered workers are enrolled in PPOs, followed by HDHP/SOs (20%), HMOs (14%), POS plans (9%), and conventional plans (<1%) (Exhibit 5.1).
- After years of significant annual increases in the percentage of covered workers enrolled in HDHP/SO plans (8% in 2009, 13% in 2010, and 17% in 2011), there has been a similar level of enrollment over the past two years (19% in 2012 and 20% in 2013) (Exhibit 5.1).
- Enrollment in HMO plans is similar to 2012, but has declined significantly since 2011.
- Plan enrollment patterns vary by firm size. Workers in large firms (200 or more workers) are more likely than workers in small firms (3-199 workers) to enroll in PPOs (62% vs. 47%). Workers in small firms are more likely than workers in large firms to enroll in POS plans (16% vs. 5%) (Exhibit 5.3).
- Plan enrollment patterns also differ across regions.
- HMO enrollment is significantly higher in the West (25%) and significantly lower in the South (10%) and Midwest (7%) (Exhibit 5.3).
- Workers in the South (66%) are more likely to be enrolled in PPO plans than workers in other regions; workers in the West (49%) are less likely to be enrolled in a PPO (Exhibit 5.3).
- Enrollment in HDHP/SOs is higher among workers in the Midwest (27%) than in other regions (Exhibit 5.3).
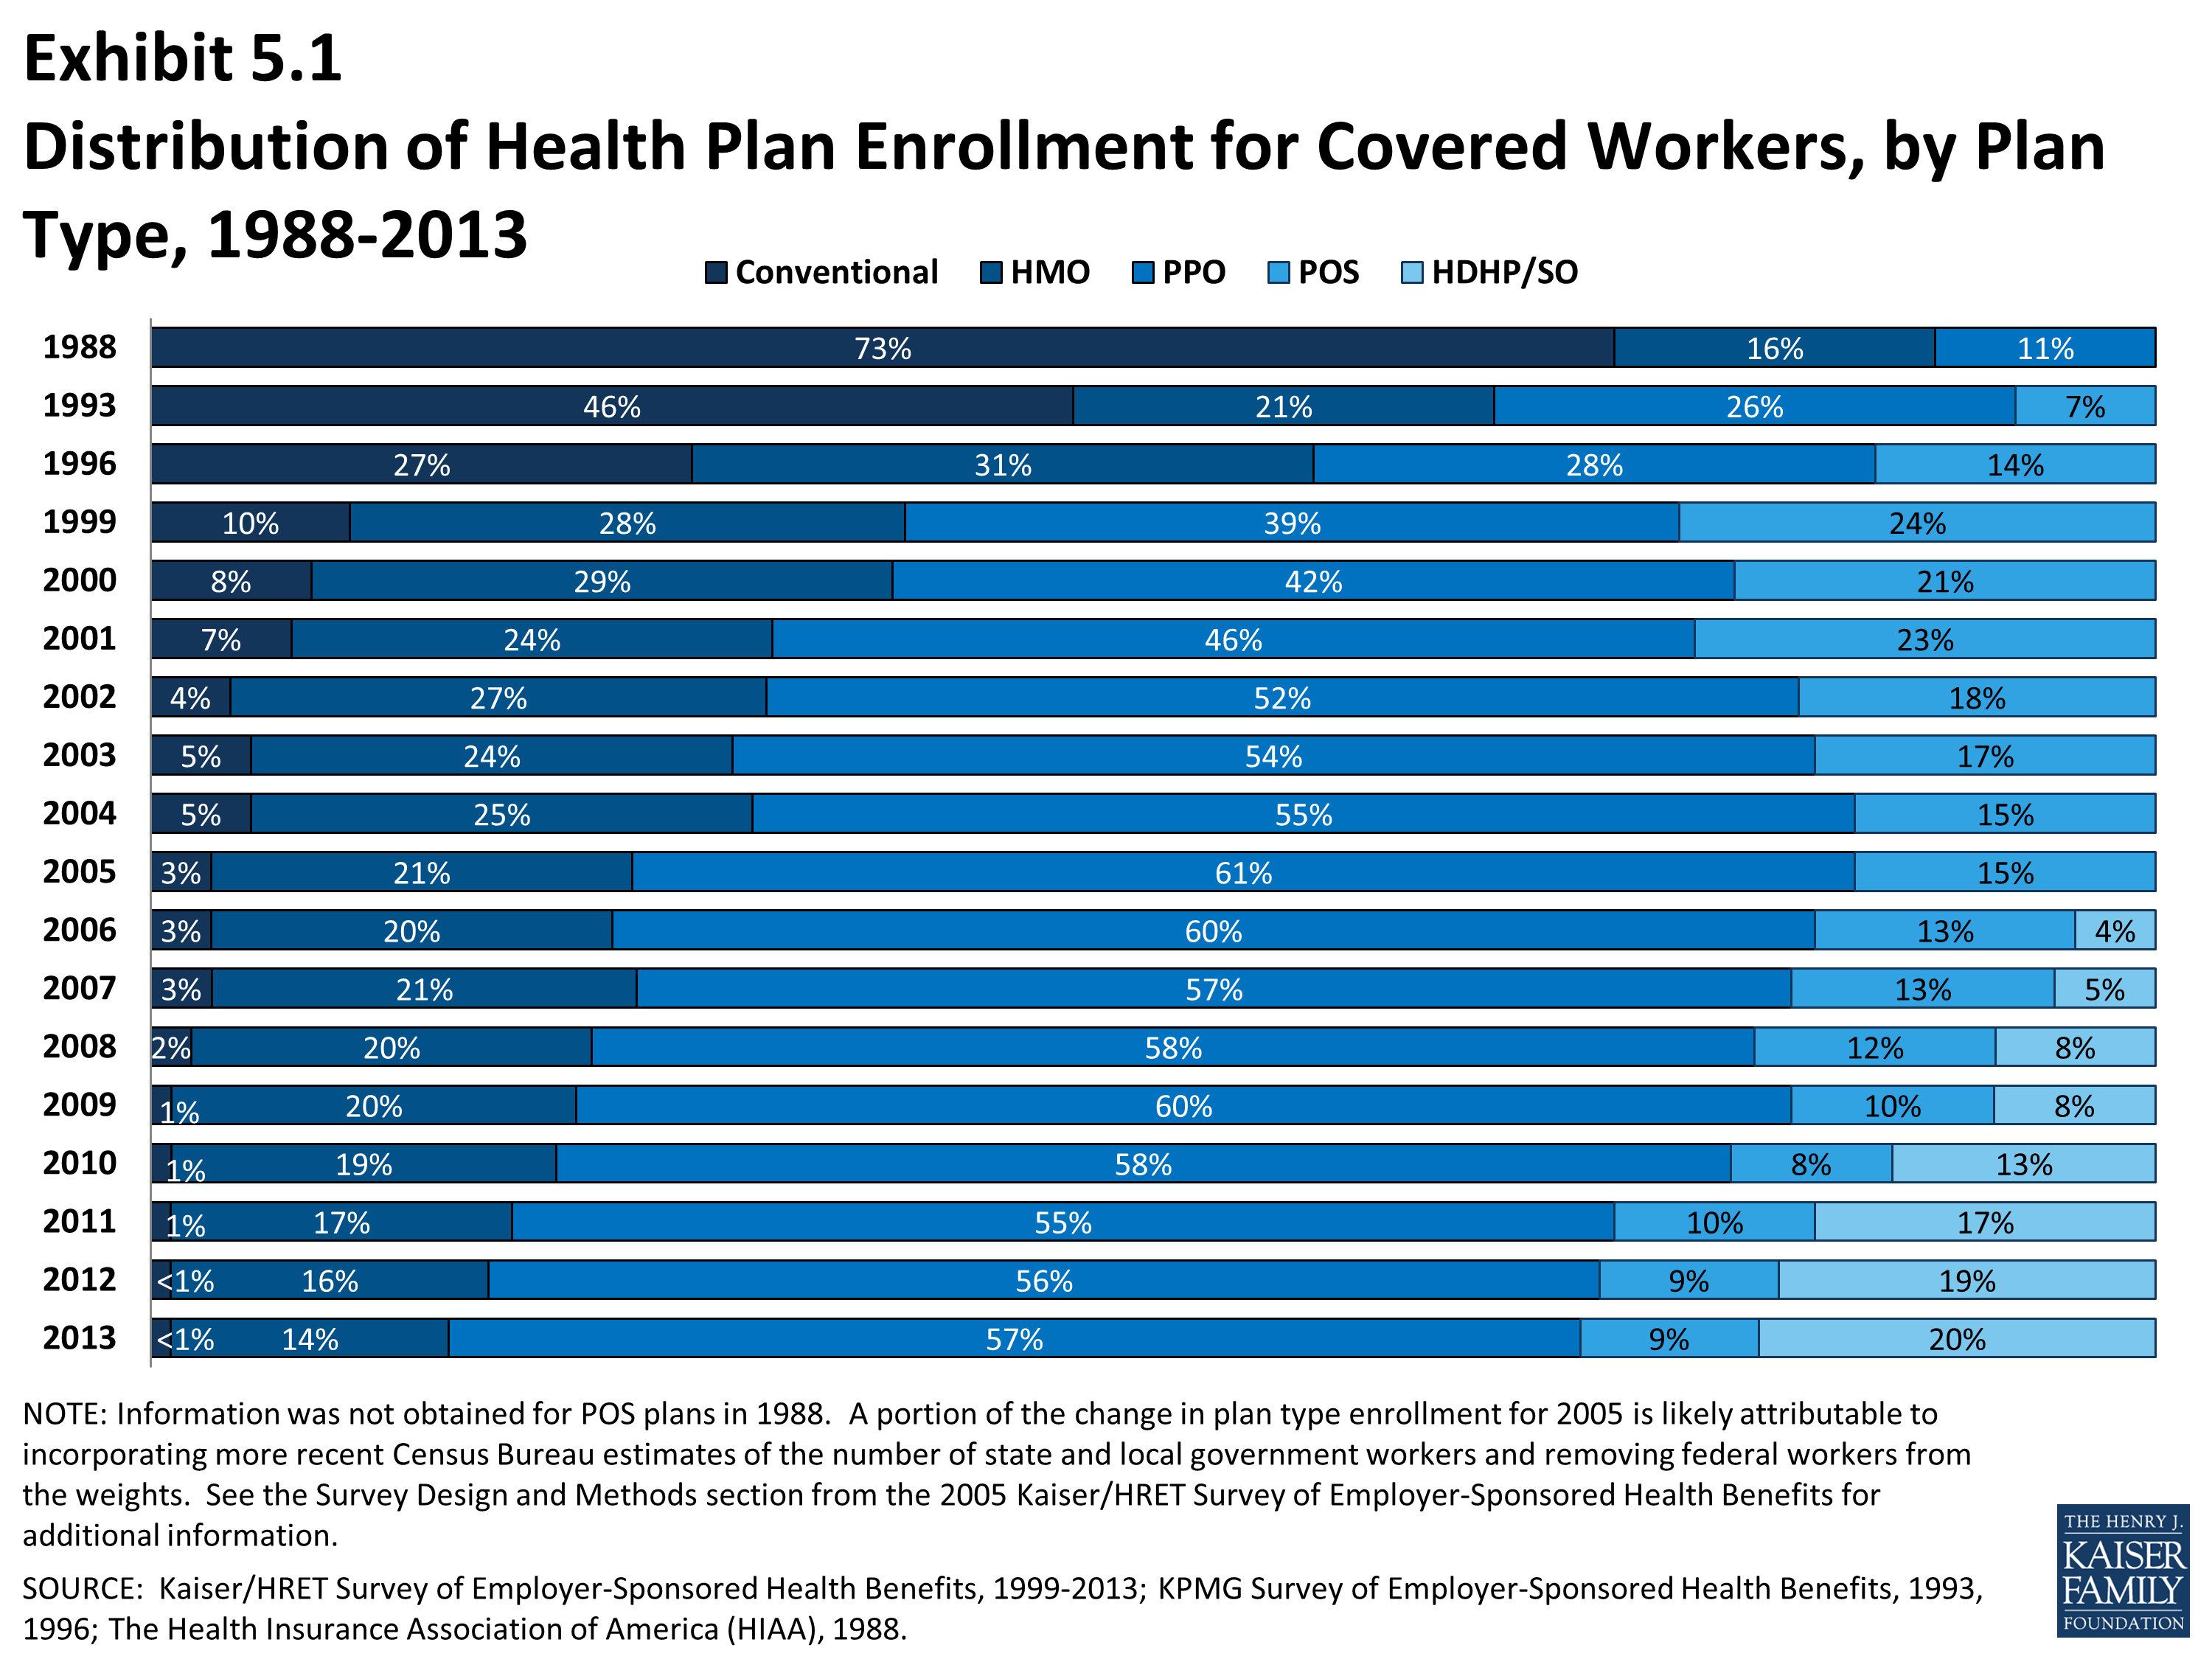
Distribution of Health Plan Enrollment for Covered Workers, by Plan Type, 1988-2013
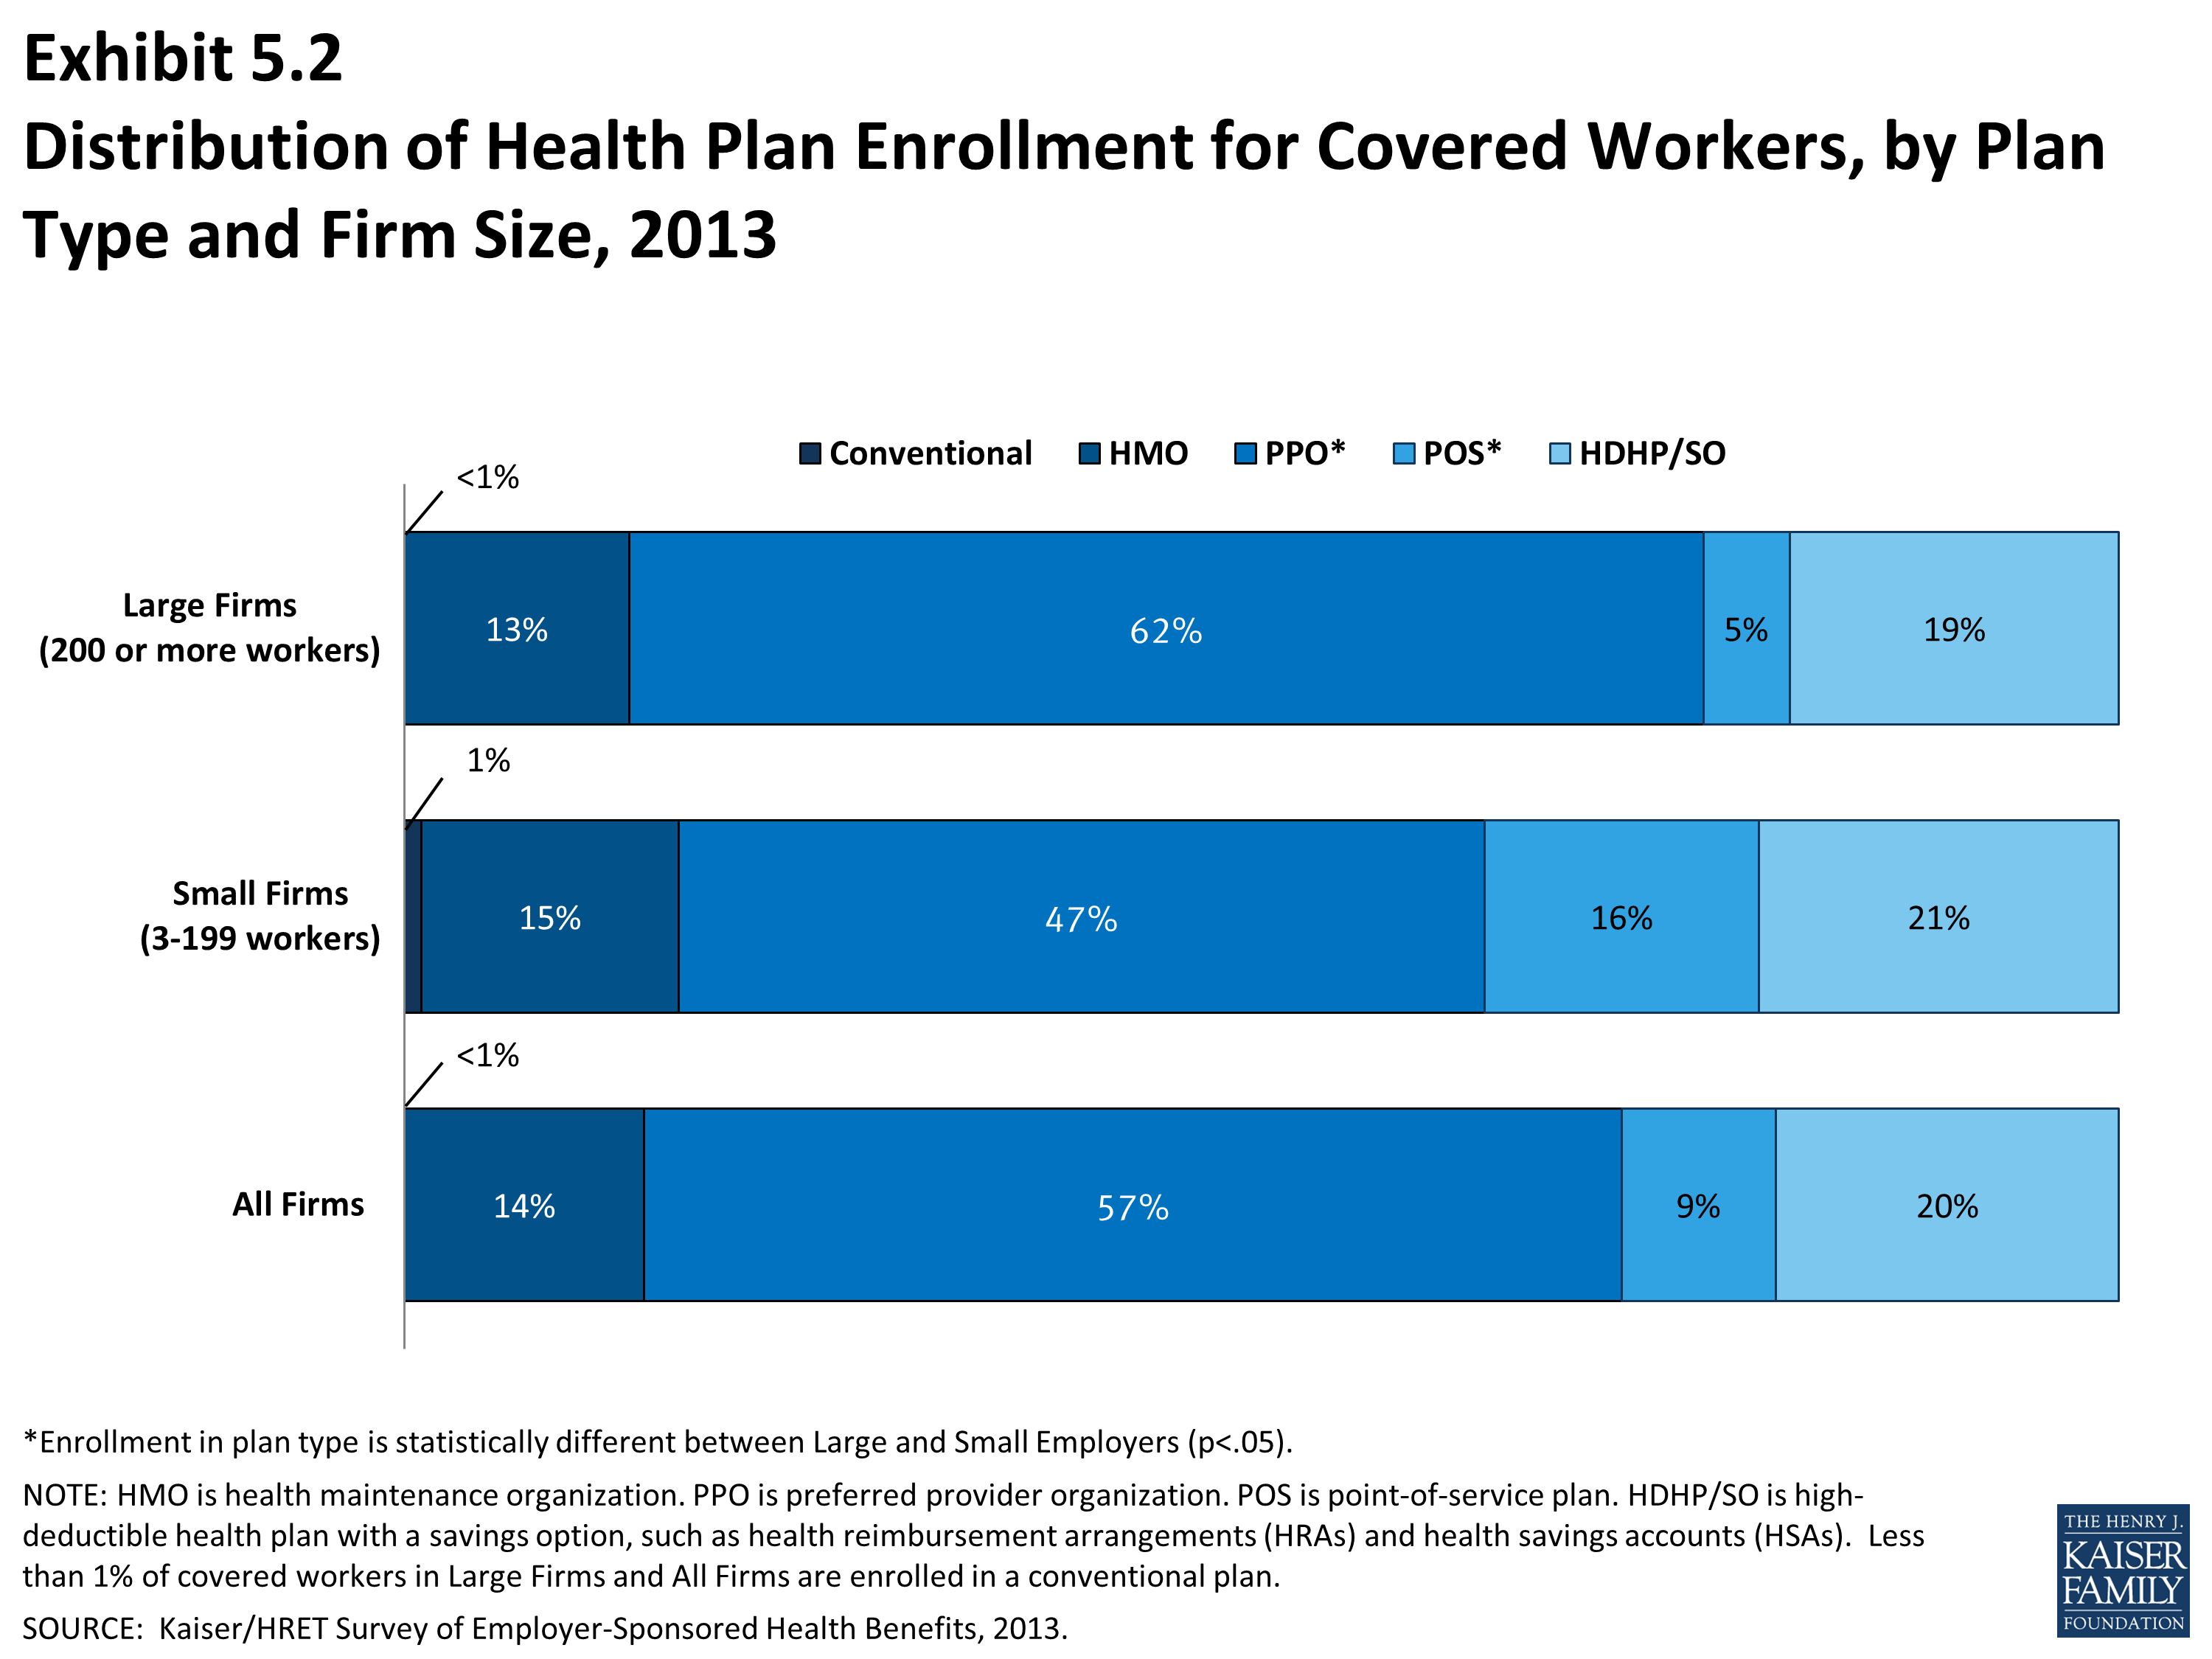
Distribution of Health Plan Enrollment for Covered Workers, by Plan Type and Firm Size, 2013
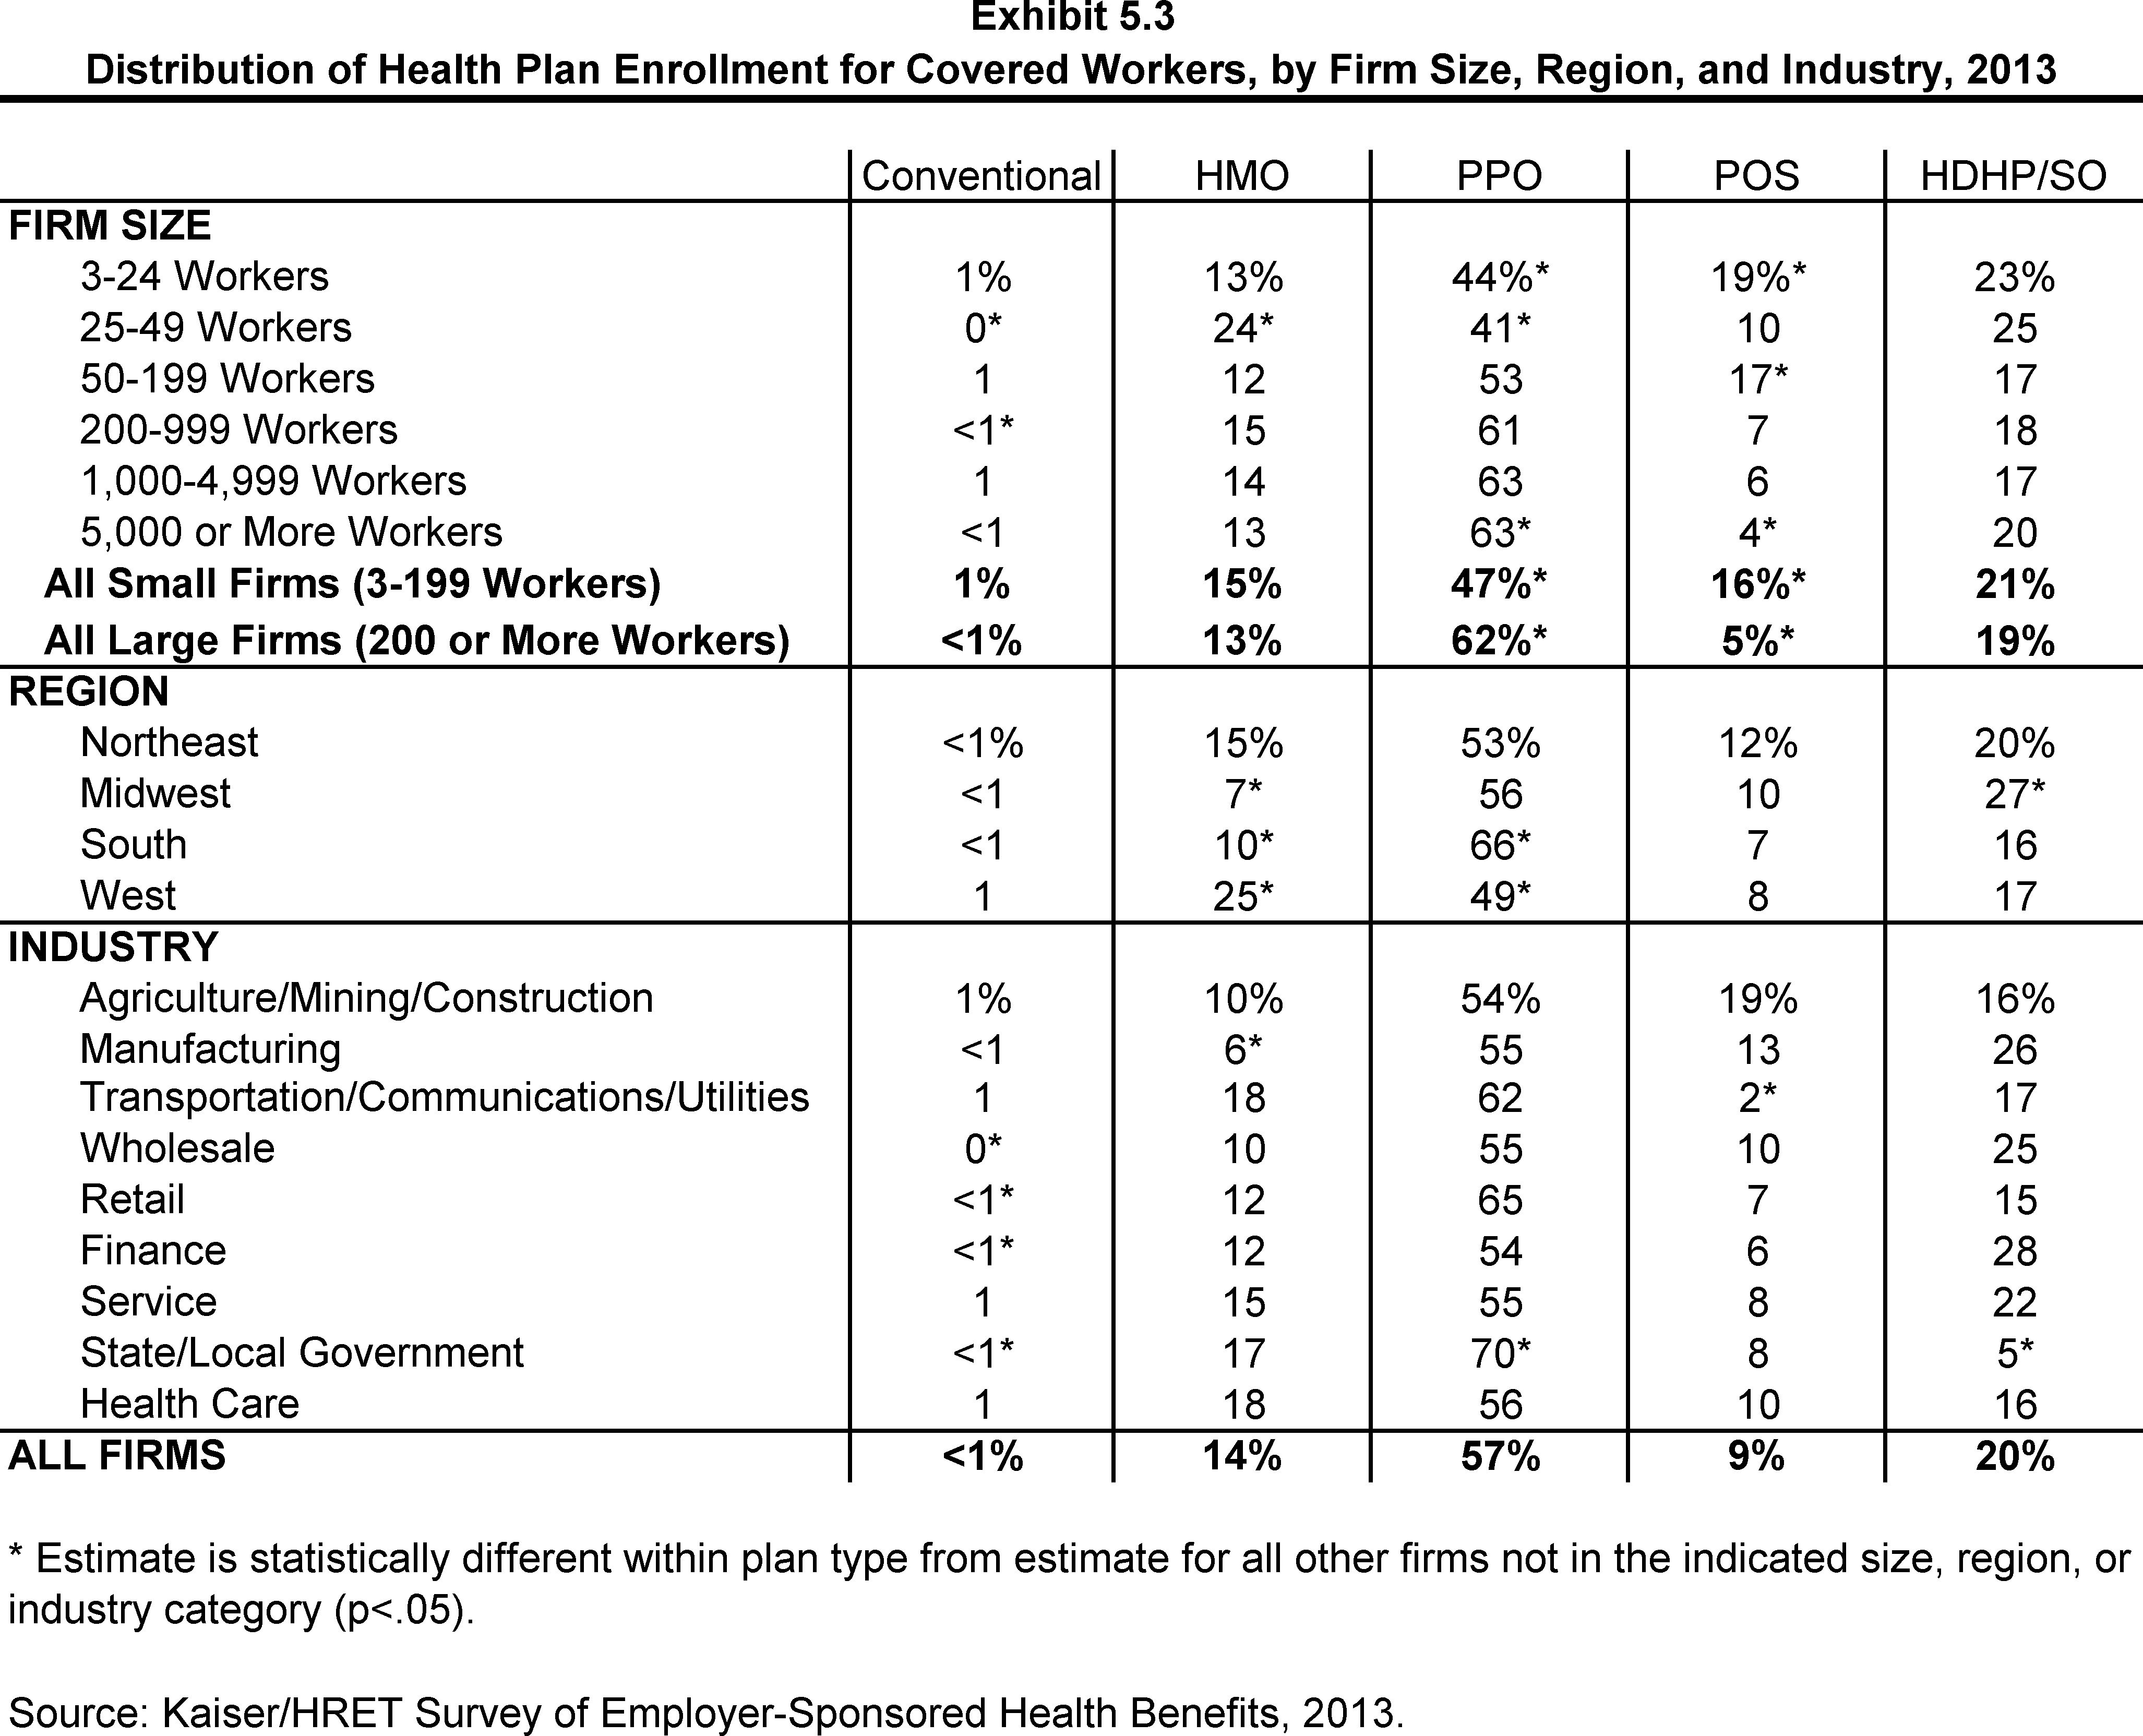
Distribution of Health Plan Enrollment for Covered Workers, by Firm Size, Region, and Industry, 2013
Section Six: Worker and Employer Contributions for Premiums
Premium contributions by covered workers average 18% for single coverage and 29% for family coverage.1 The average monthly worker contributions are $83 for single coverage ($999 annually) and $380 for family coverage ($4,565 annually). These percentage and dollar values are similar to the values reported in 2012.
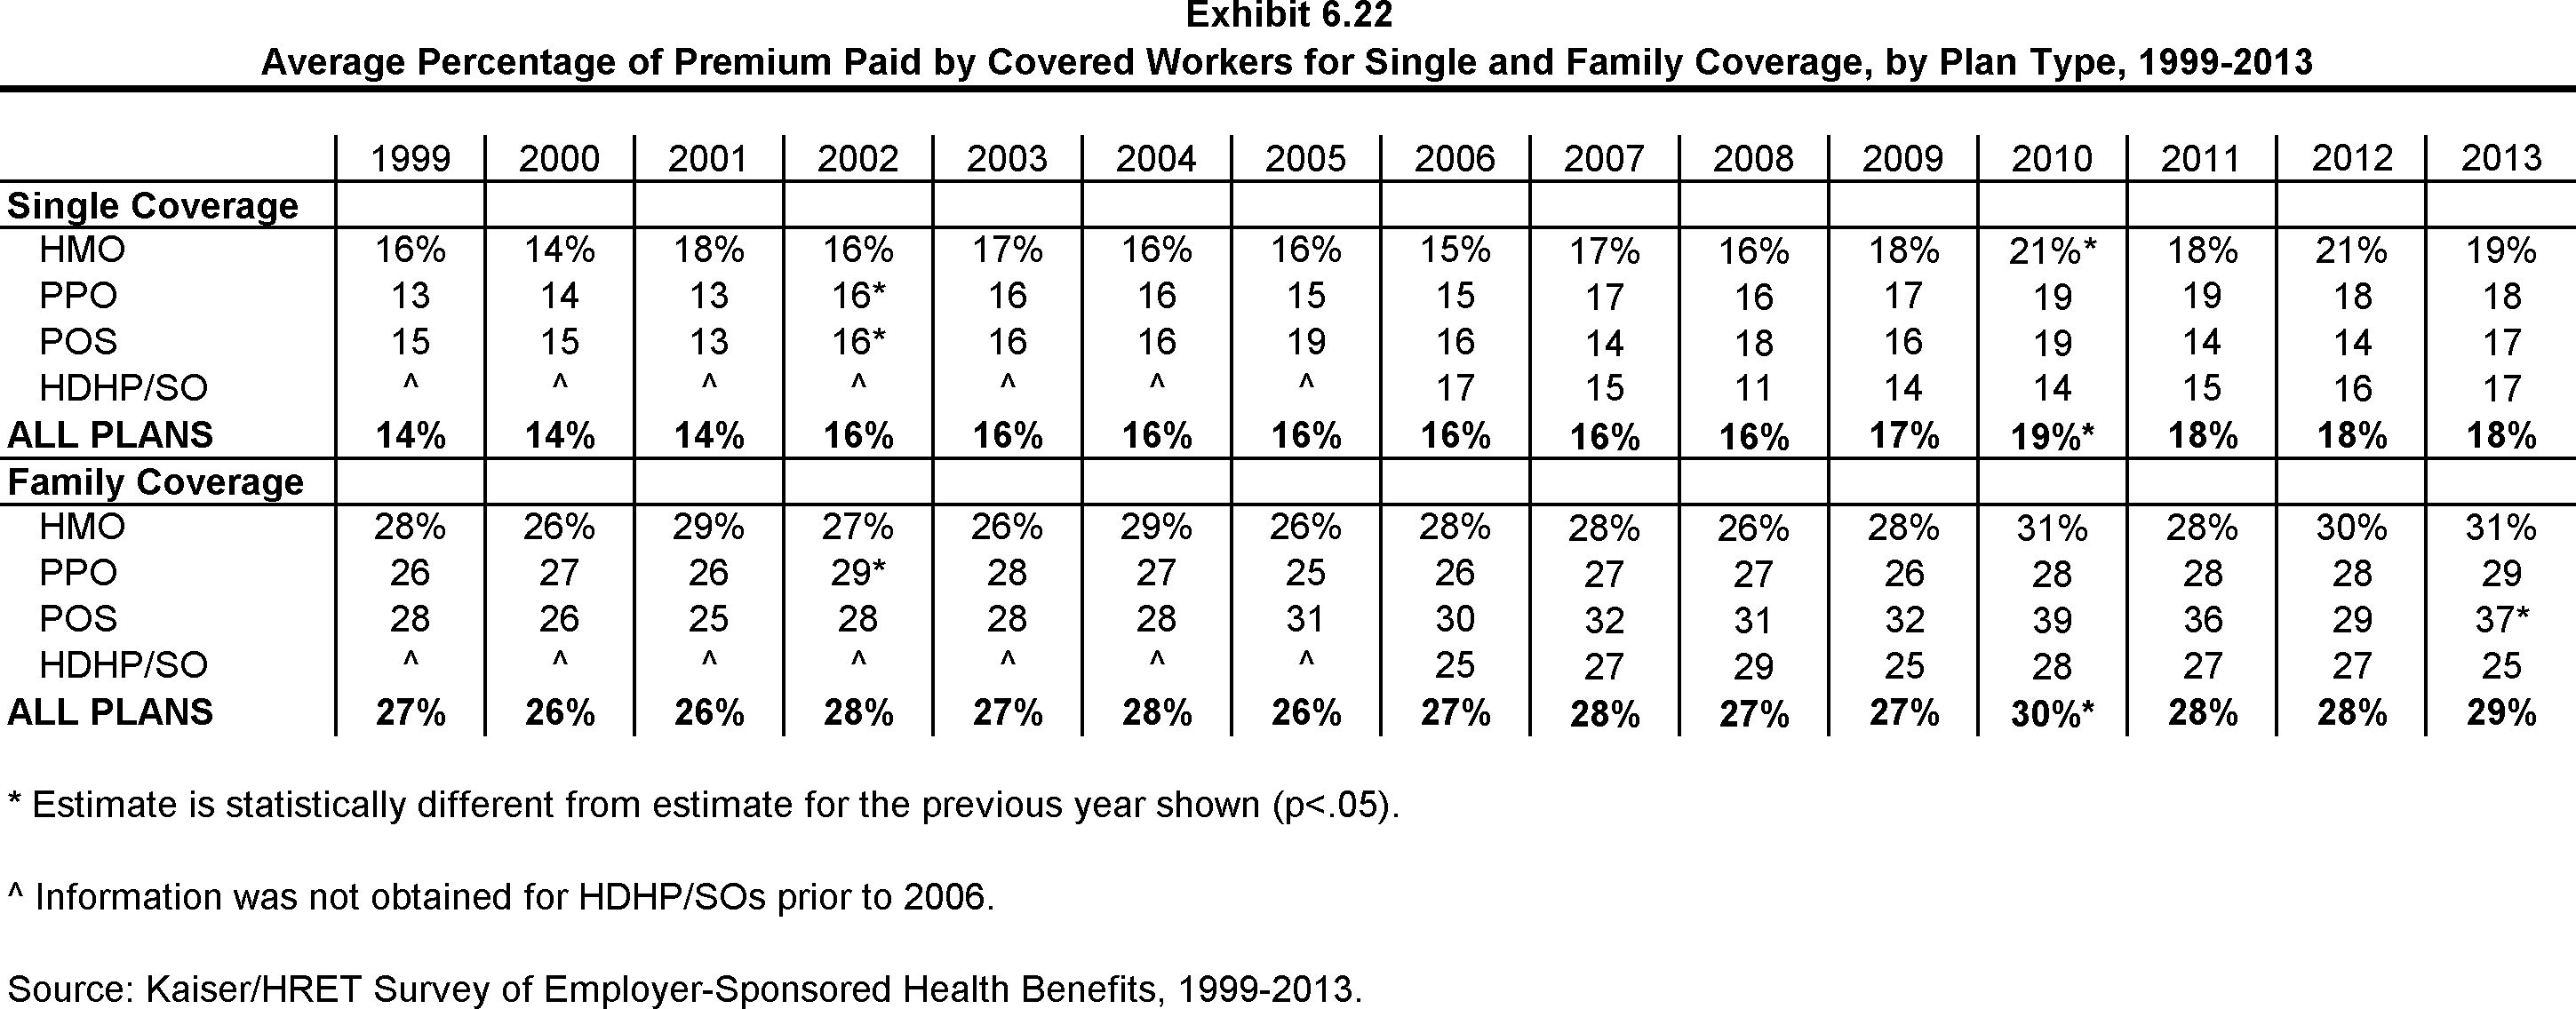
- In 2013, covered workers on average contribute 18% of the premium for single coverage and 29% of the premium for family coverage, similar to the contribution percentages reported for 2012 (Exhibit 6.1). The premium contributions have remained stable over the last three years for both single and family coverage.
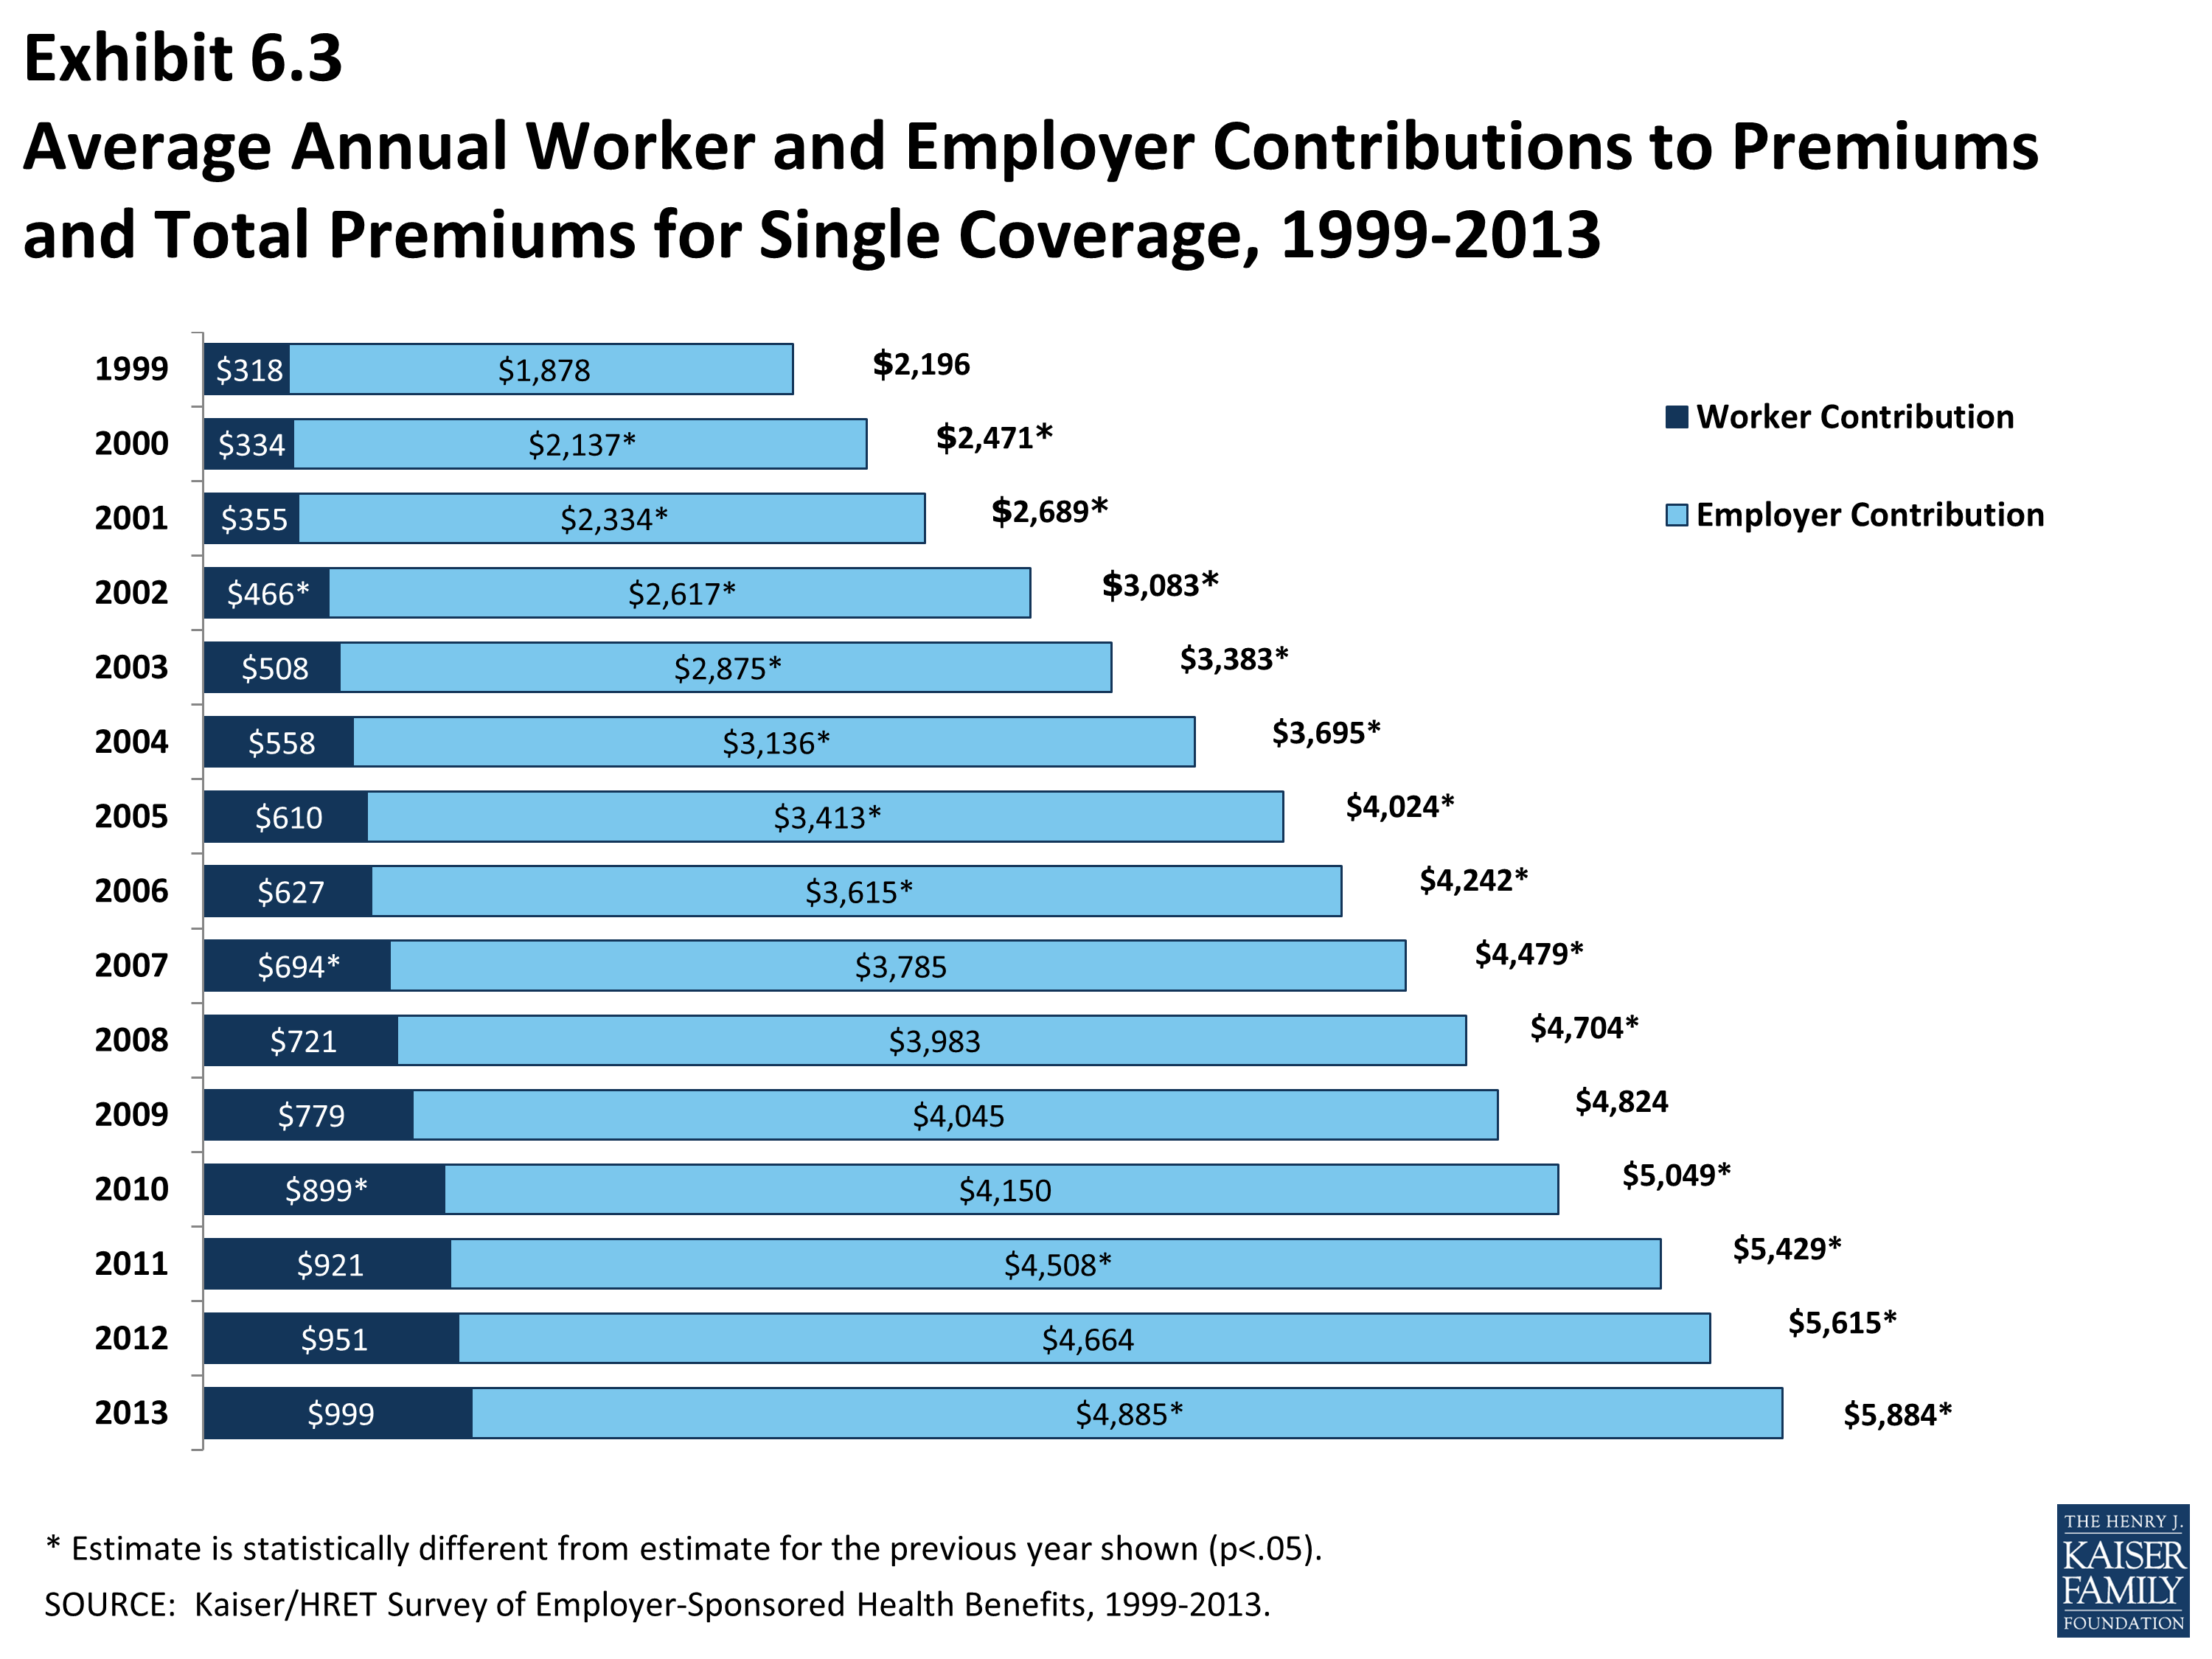
- On average, workers with single coverage contribute $83 per month ($999 annually), and workers with family coverage contribute $380 per month ($4,565 annually), towards their health insurance premiums, similar to the amounts reported in 2012 (Exhibit 6.2), (Exhibit 6.3), and (Exhibit 6.4).
- Worker contributions in HDHP/SOs are lower than the overall average worker contributions for family coverage ($3,649 vs. $4,565) (Exhibit 6.5). Similarly, covered workers enrolled in HDHP/SO plans contribute less on average for family coverage than covered workers enrolled in other plan types ($3,649 vs. $4,787).
- Worker contributions in POS plans are higher for family coverage ($5,590) compared to the overall worker contribution for family coverage (Exhibit 6.5).
- In addition to differences between plan types, there are differences in worker contributions by type of firm. As in previous years, workers in small firms (3-199 workers) contribute a lower amount annually for single coverage than workers in large firms (200 or more workers), $862 vs. $1,065. In contrast, workers in small firms with family coverage contribute significantly more annually than workers with family coverage in large firms ($5,284 vs. $4,226) (Exhibit 6.8).
- There is a great deal of variation in worker contributions to premiums.
- Twenty-seven percent of covered workers contribute $1,399 or more annually (140% or more of the average worker contribution) for single coverage, while 15% of covered workers have an annual worker contribution of less than $600 (less than 60% of the average worker contribution) (Exhibit 6.14).
- For family coverage, 21% of covered workers contribute $6,392 or more annually (140% or more of the average worker contribution), while 20% of covered workers have an annual worker contribution of less than $2,739 (less than 60% of the average worker contribution) (Exhibit 6.14).
- The majority of covered workers are employed by a firm that contributes at least half of the premium for single and family coverage.
- Fourteen percent of covered workers with single coverage and 5% of covered workers with family coverage work for a firm that pays 100% of the premium (Exhibit 6.15).
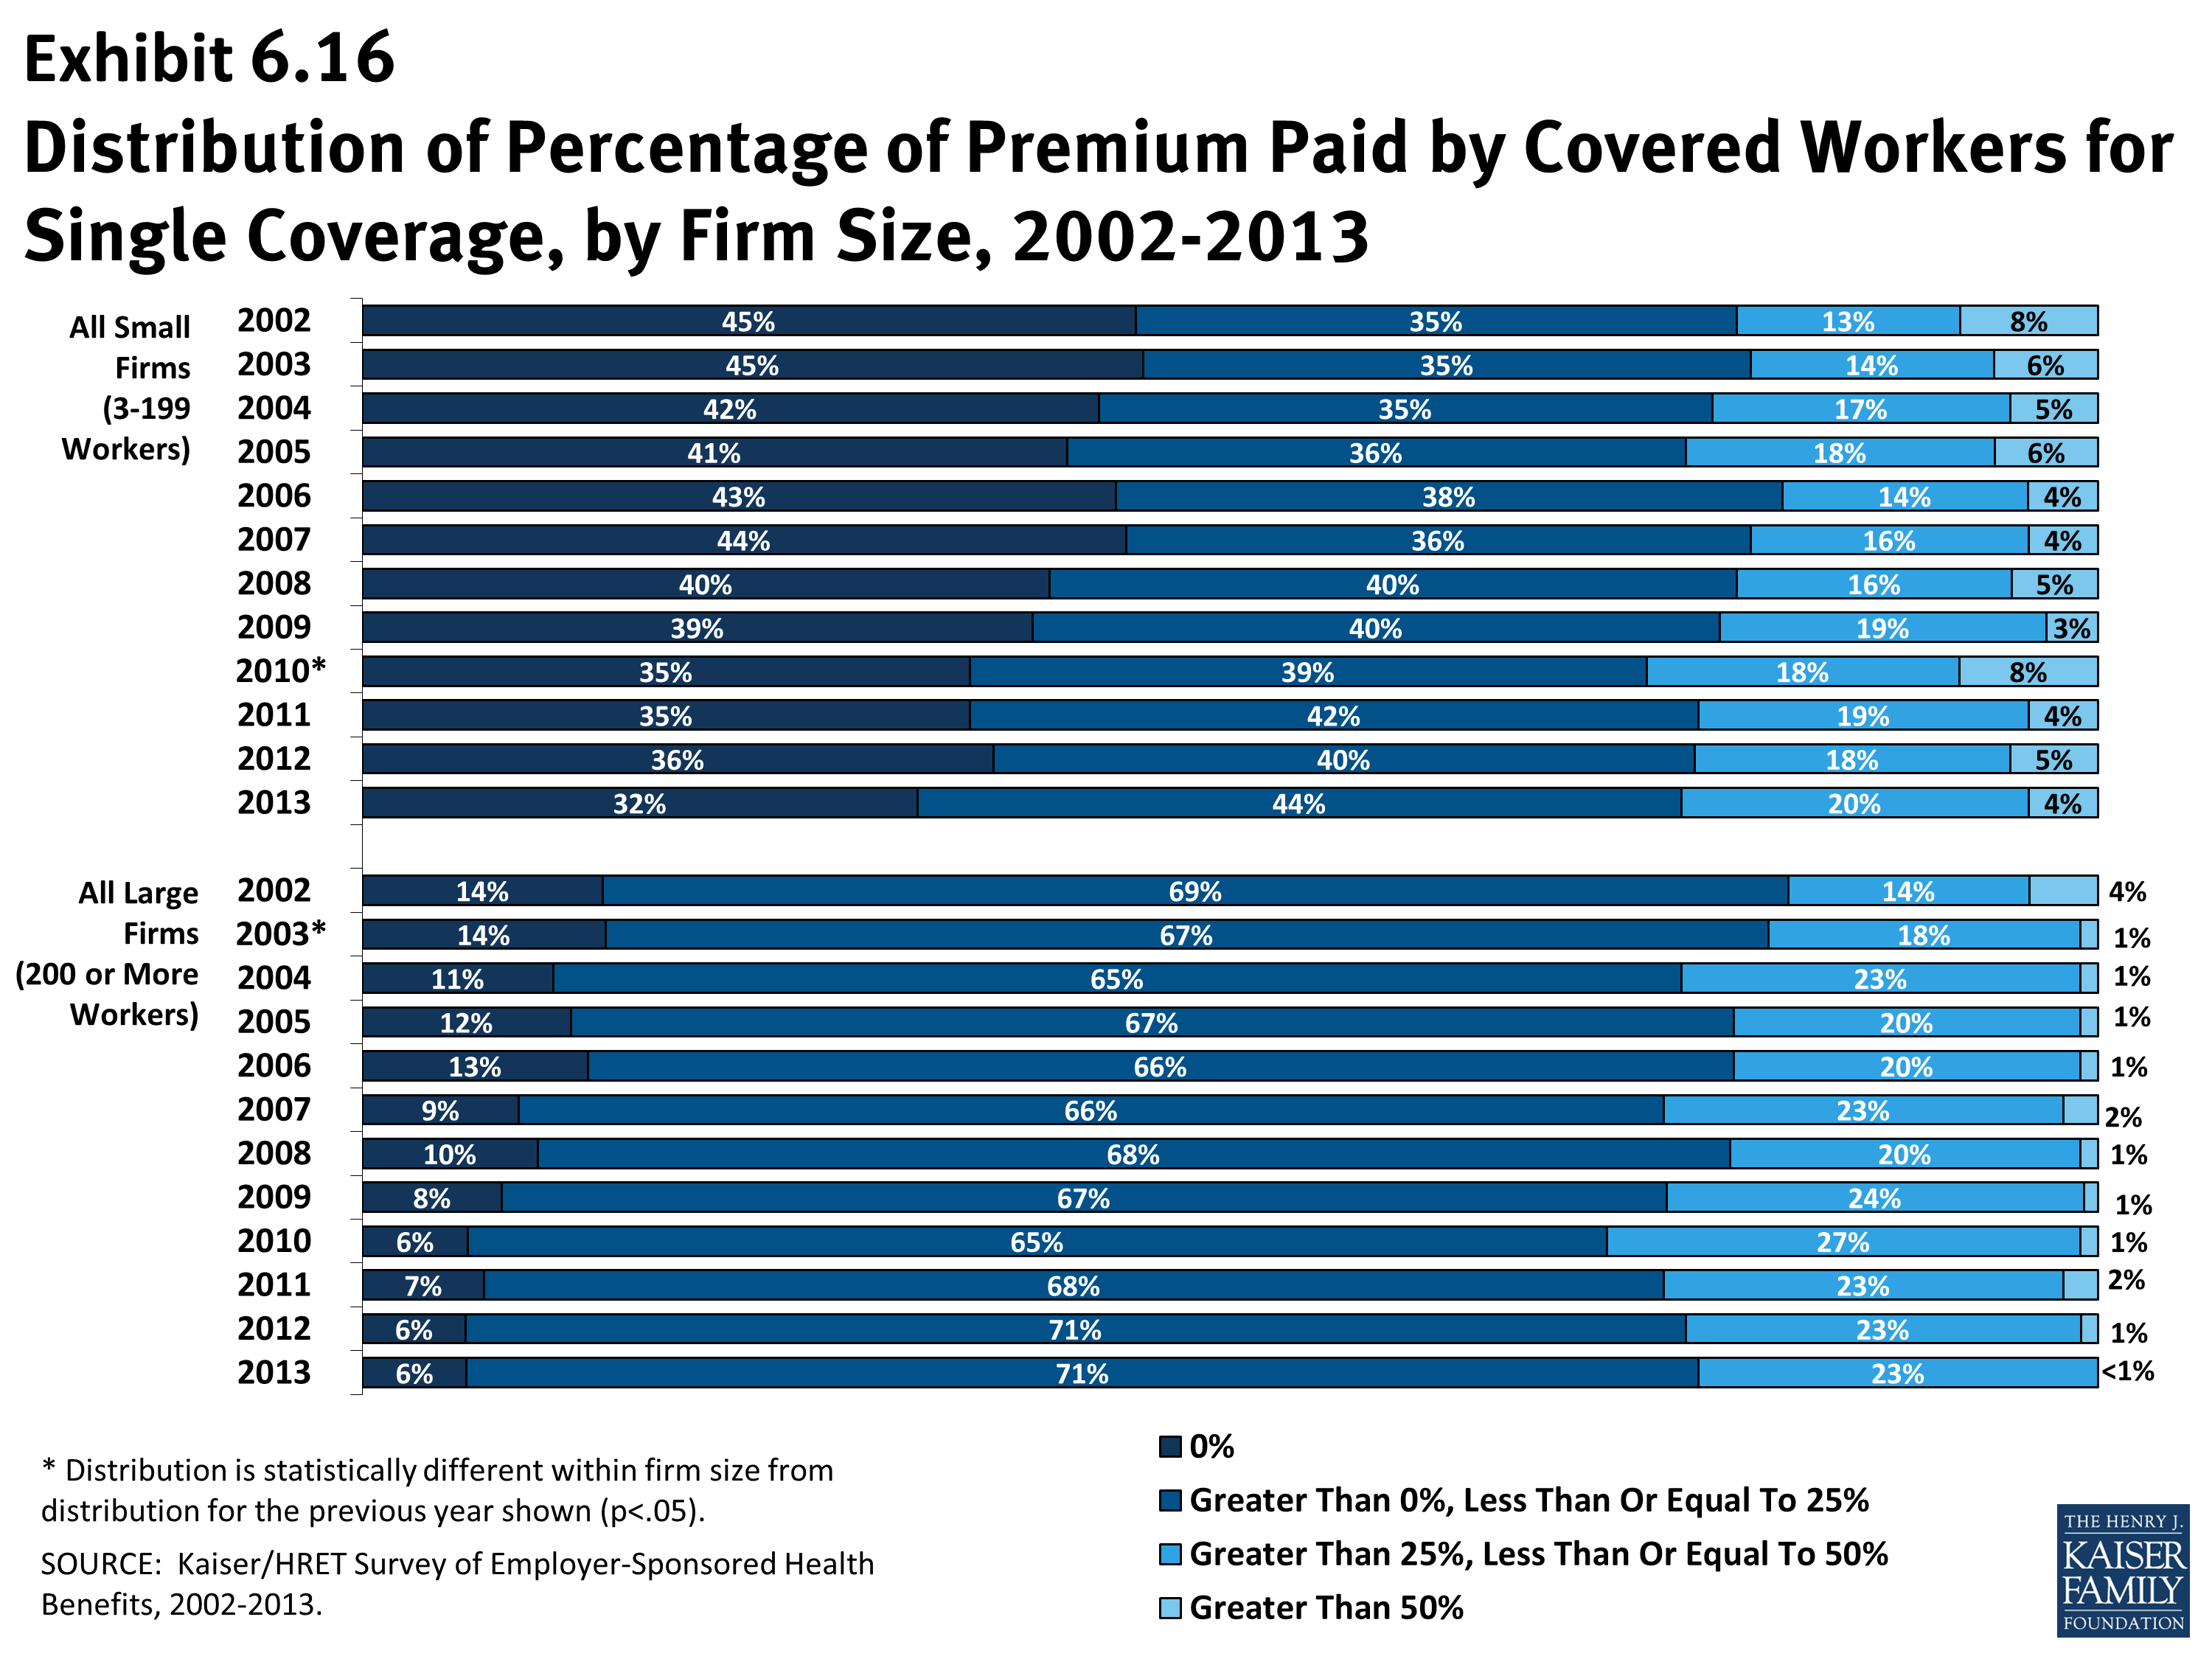
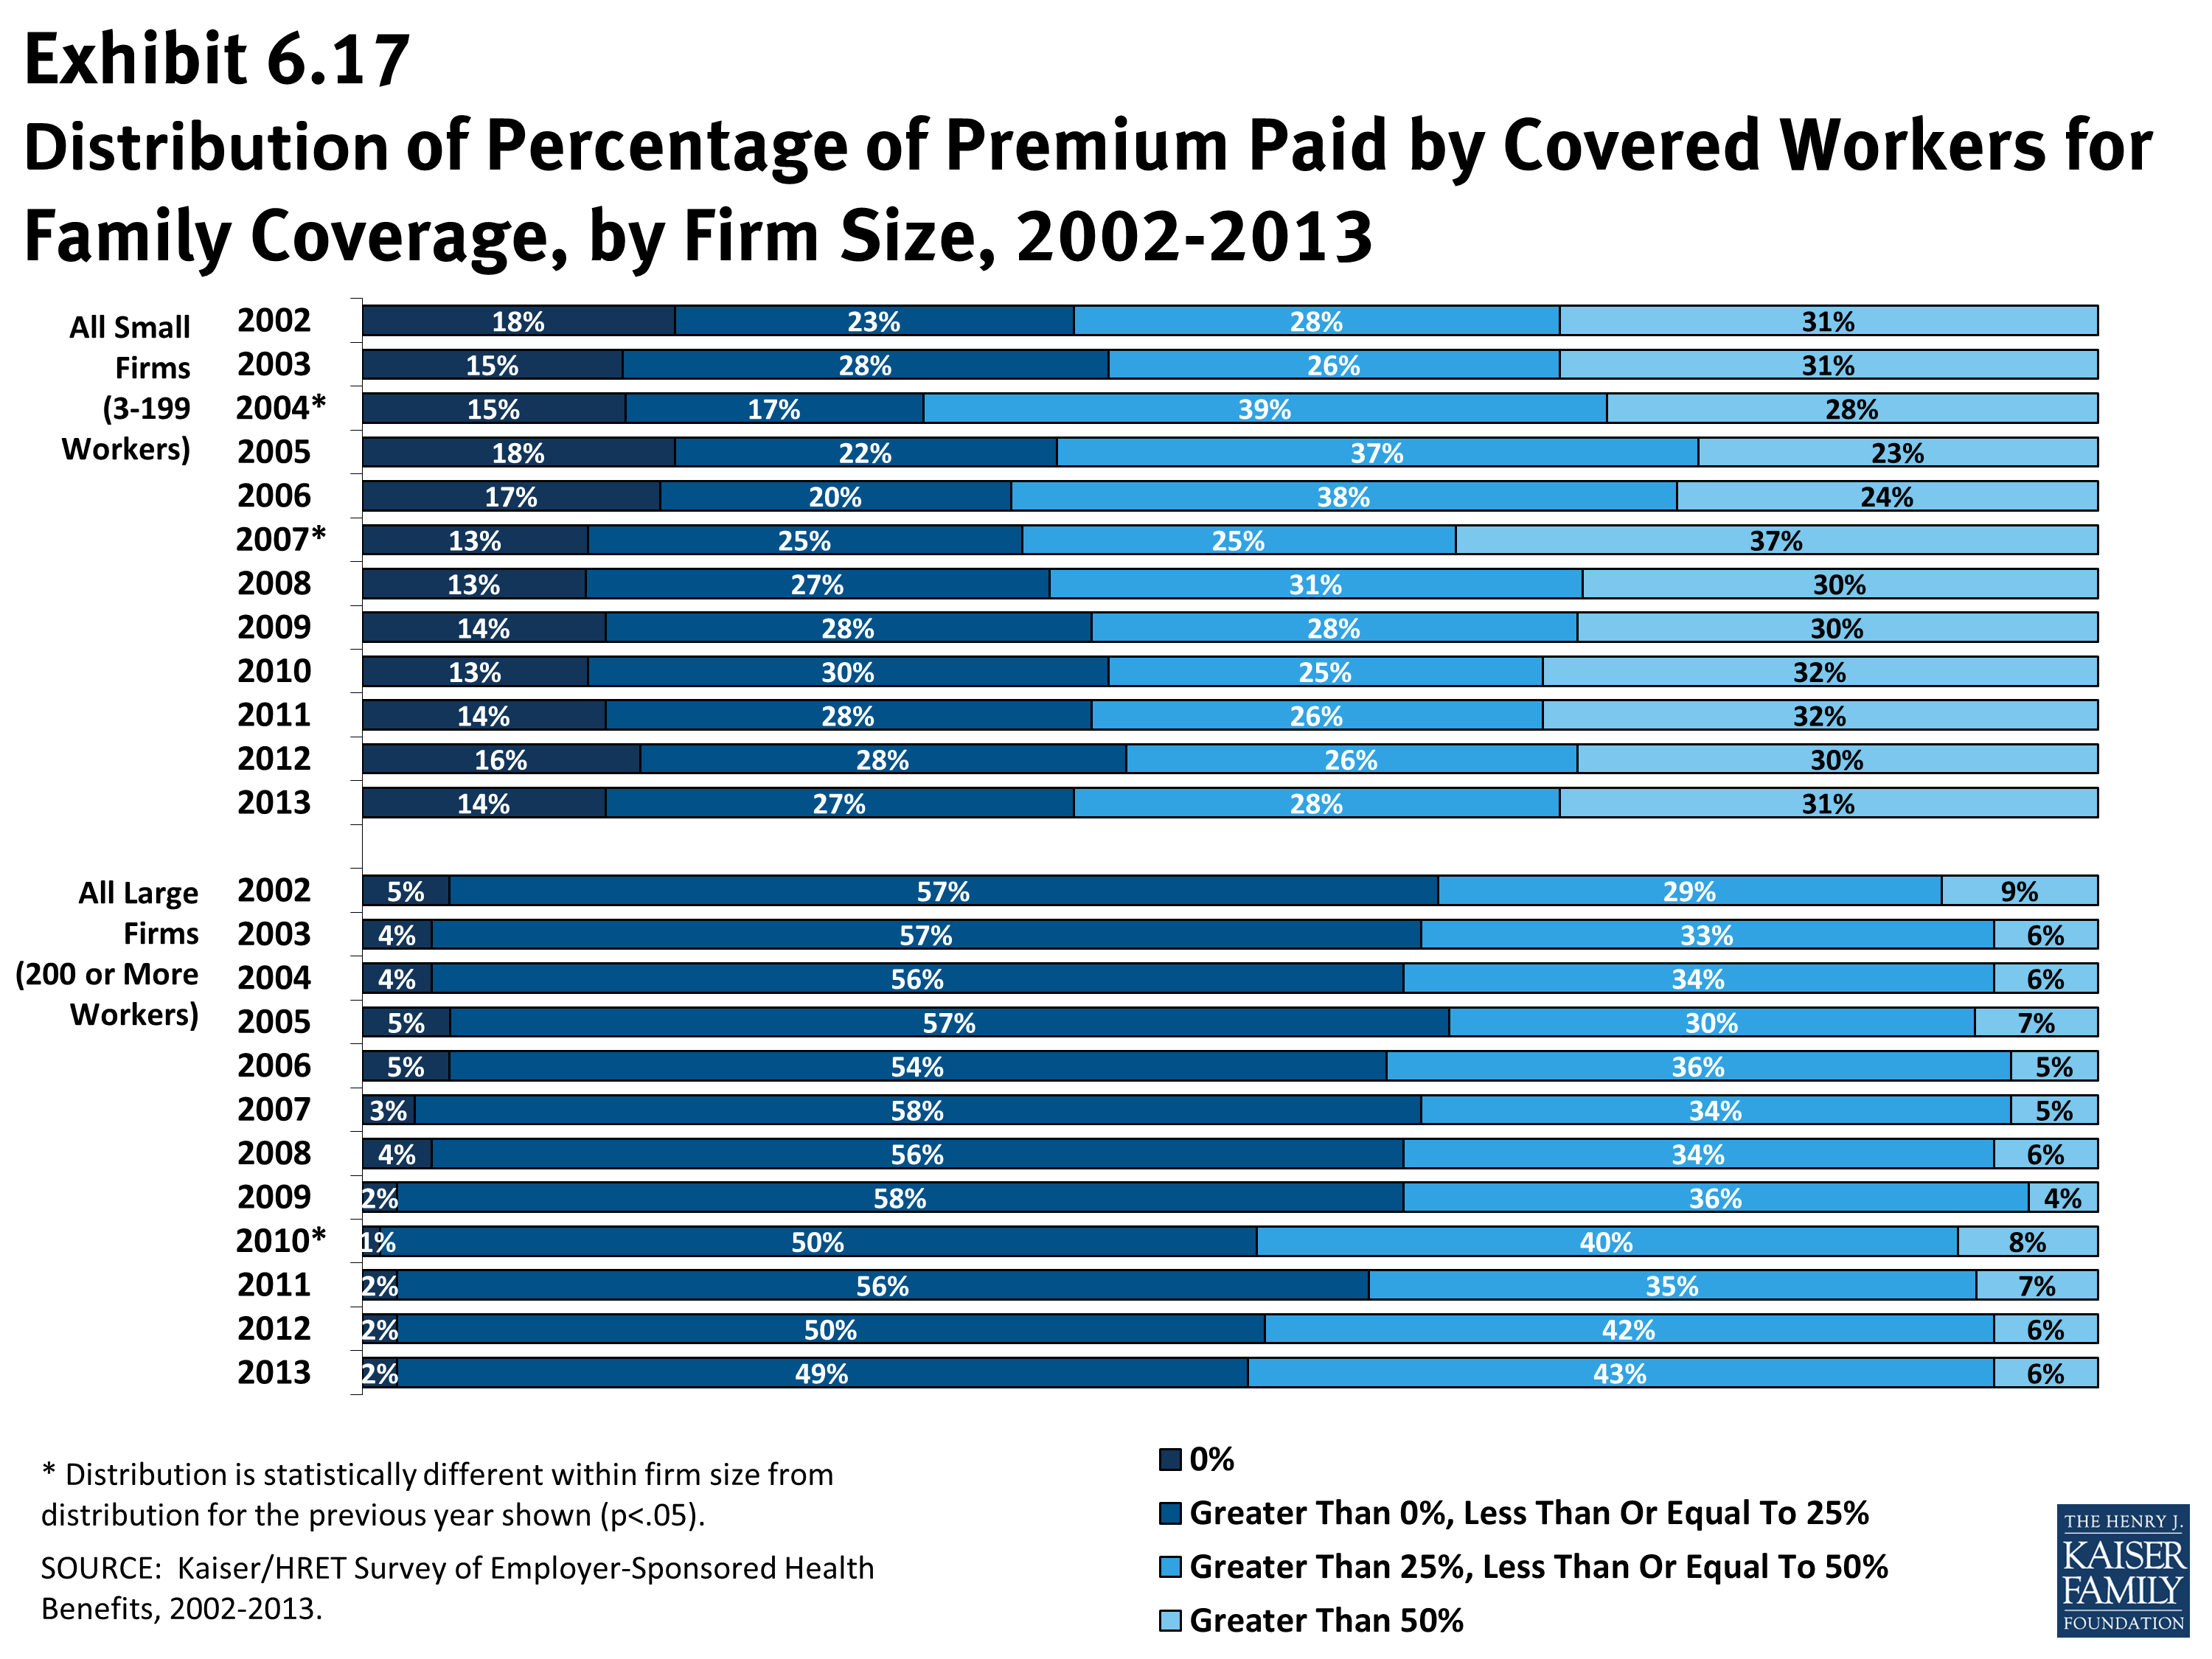
- Covered workers in small firms (3-199 workers) are more likely to work for a firm that pays 100% of the premium for single coverage than workers in large firms (200 or more workers). Thirty-two percent of covered workers in small firms have an employer that pays the full premium for single coverage, compared to 6% of covered workers in large firms (Exhibit 6.16). For family coverage, 14% percent of covered workers in small firms have an employer that pays the full premium, compared to 2% of covered workers in large firms (Exhibit 6.17).
- Four percent of covered workers in small firms (3-199 workers) contribute more than 50% of the premium for single coverage, compared to less than one percent of covered workers in large firms (200 or more workers) (Exhibit 6.16). For family coverage, 31% of covered workers in small firms work in a firm where they must contribute more than 50% of the premium, compared to 6% of covered workers in large firms (Exhibit 6.17).
- The percentage of the premium paid by covered workers varies by several firm characteristics.
- For family coverage, covered workers in firms with many lower-wage workers (35% or more earn $23,000 or less annually) contribute a greater percentage of the premium than those in firms with fewer lower-wage workers (39% vs. 29%).
- Covered workers with family coverage in firms that have at least some union workers contribute a significantly lower percentage of the premium than those in firms without any unionized workers (23% vs. 33%) (Exhibit 6.20).
- For workers with family coverage in large firms (200 or more workers), the average percentage contribution for workers in firms that are partially or completely self-funded is lower than the average percentage contributions for workers in firms that are fully insured (25% vs. 32%)2 (Exhibit 6.20).
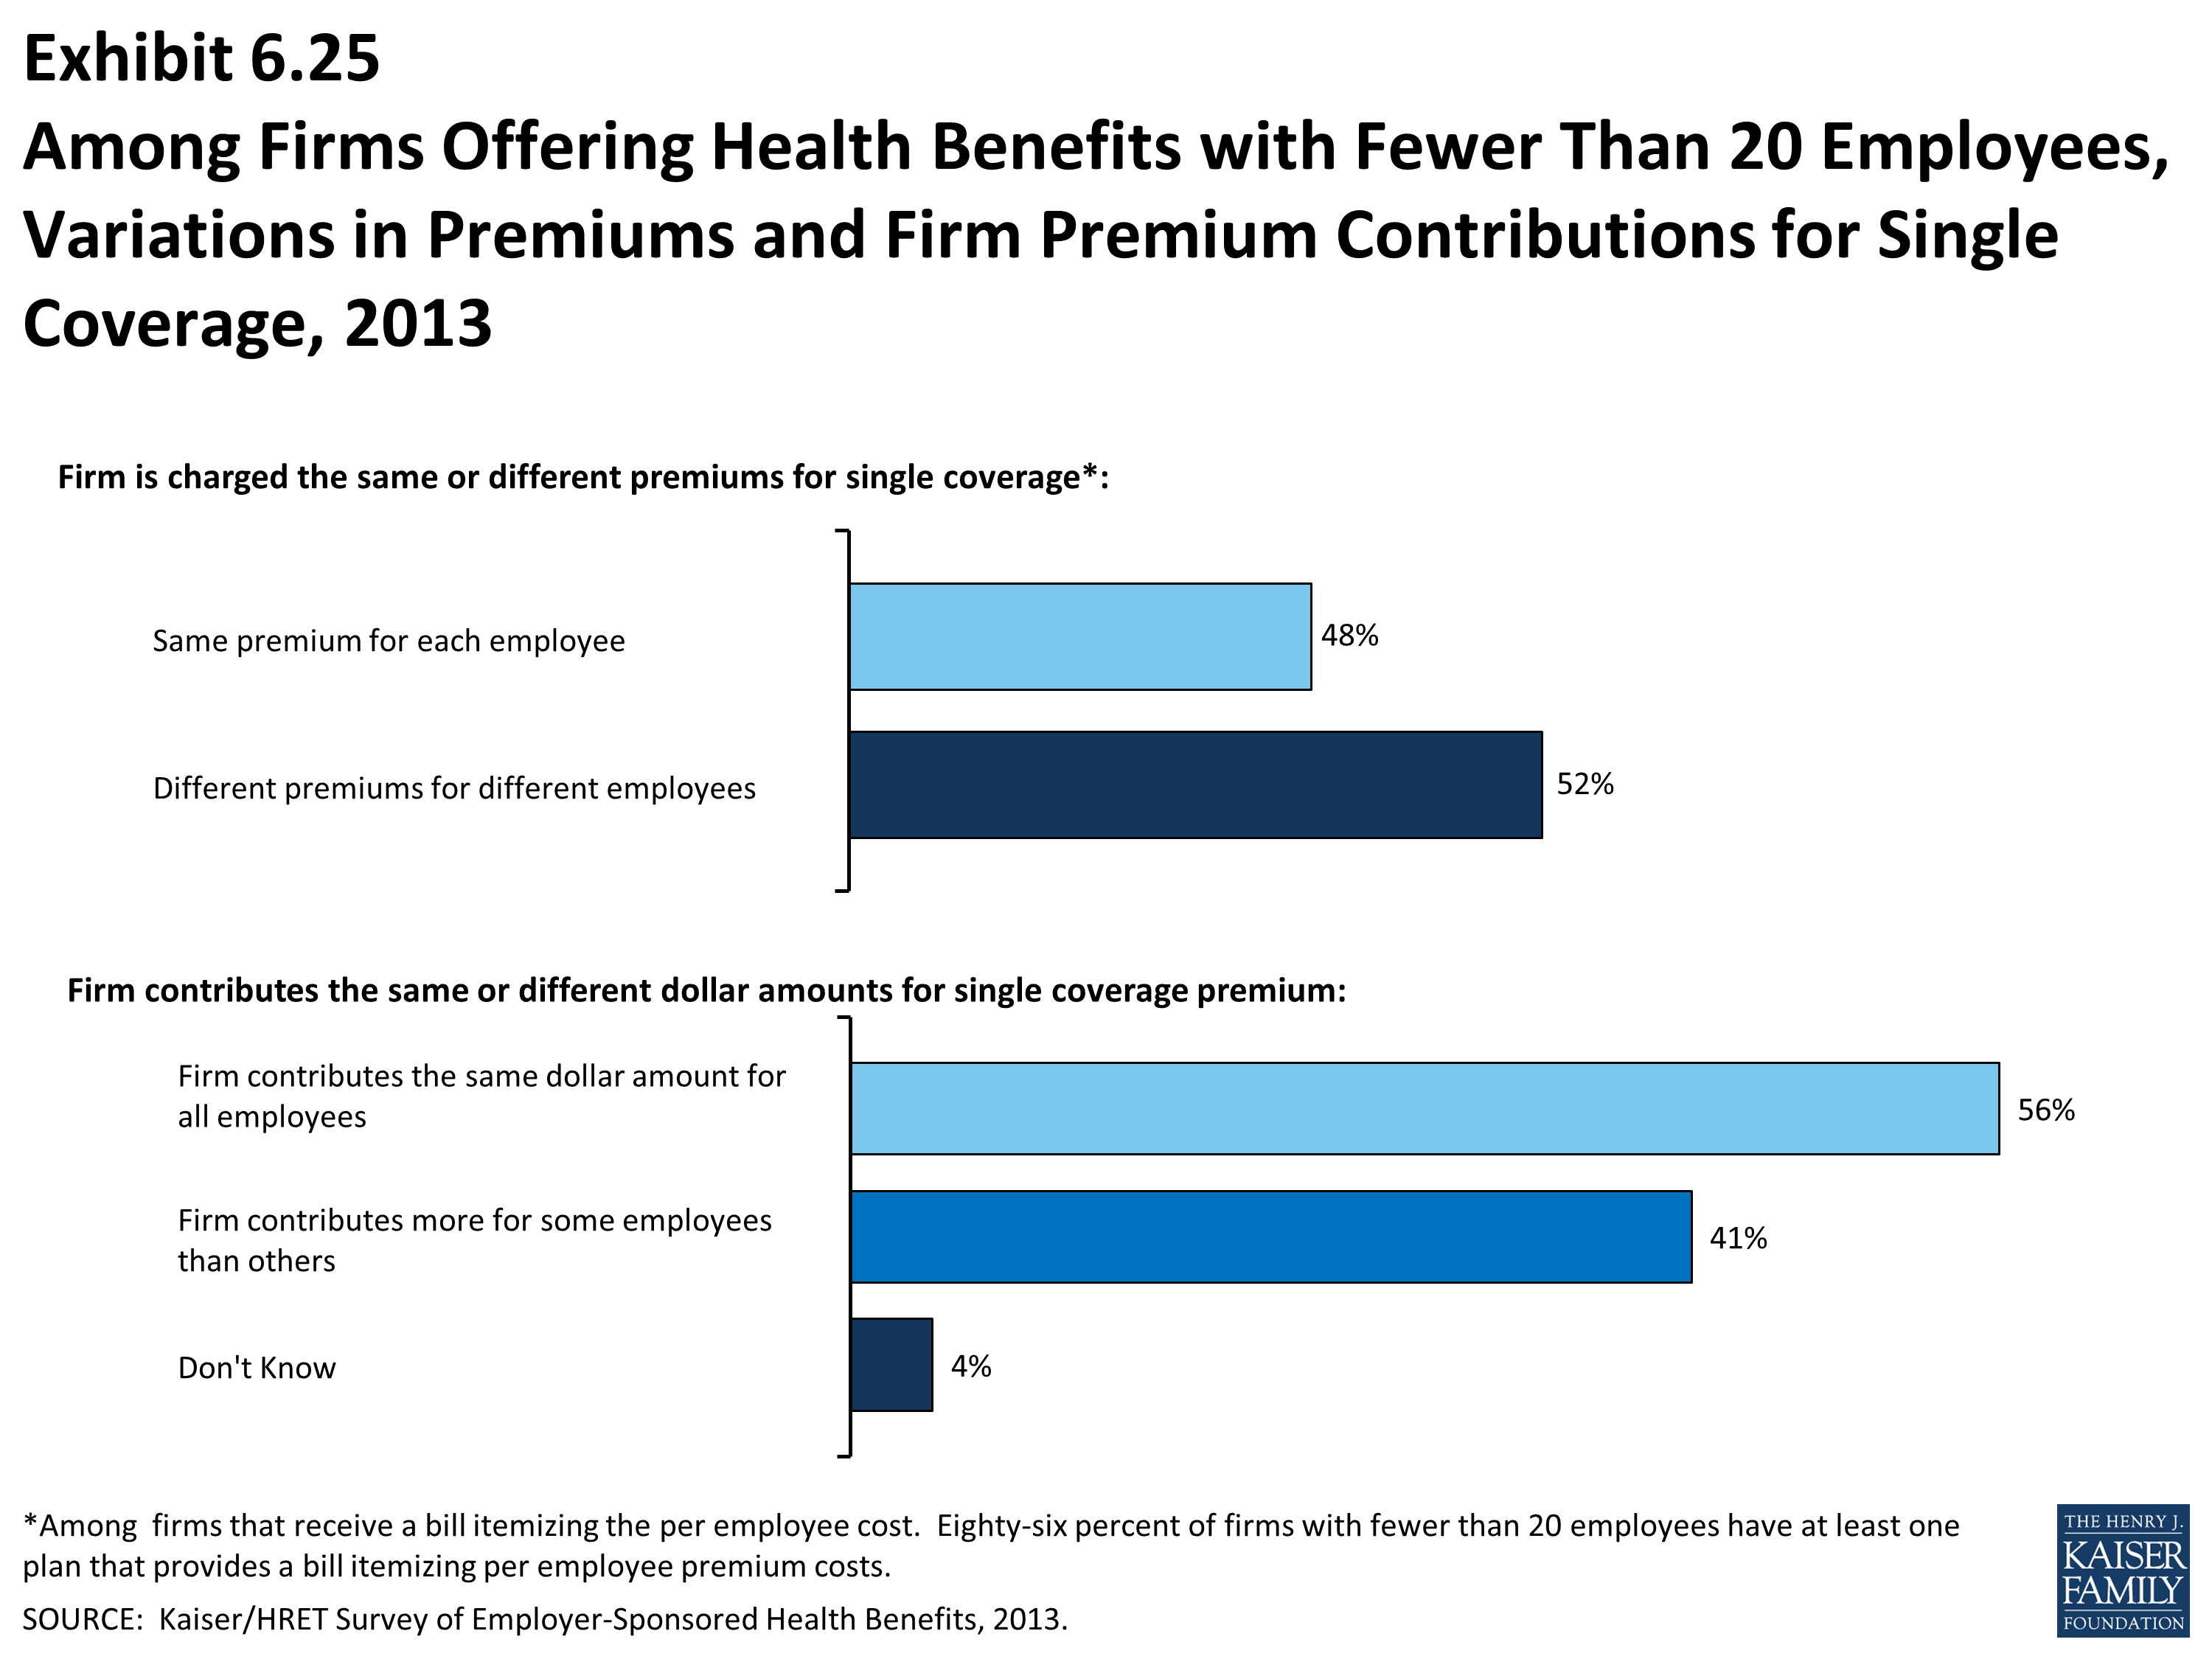
- Among firms offering health benefits with fewer than 20 employees, 41% contribute different dollar amounts toward premiums for different employees (Exhibit 6.25). Employer may contribute different amounts to different employees based for a variety of reasons, including workers’ age, smoking status, seniority, job title or location.
Changes over Time
- The amount which workers contribute to single coverage premiums has increased 97 percent since 2003 and 39% since 2008. Covered workers’ contributions to family coverage have increased 89% since 2003 and 36% since 2008.
Average Percentage of Premium Paid by Covered Workers for Single and Family Coverage, 1999-2013
Average Monthly Worker Premium Contributions Paid by Covered Workers for Single and Family Coverage, 1999-2013
Average Annual Worker and Employer Contributions to Premiums and Total Premiums for Single Coverage, 1999-2013
Average Annual Worker and Employer Contributions to Premiums and Total Premiums for Family Coverage, 1999-2013
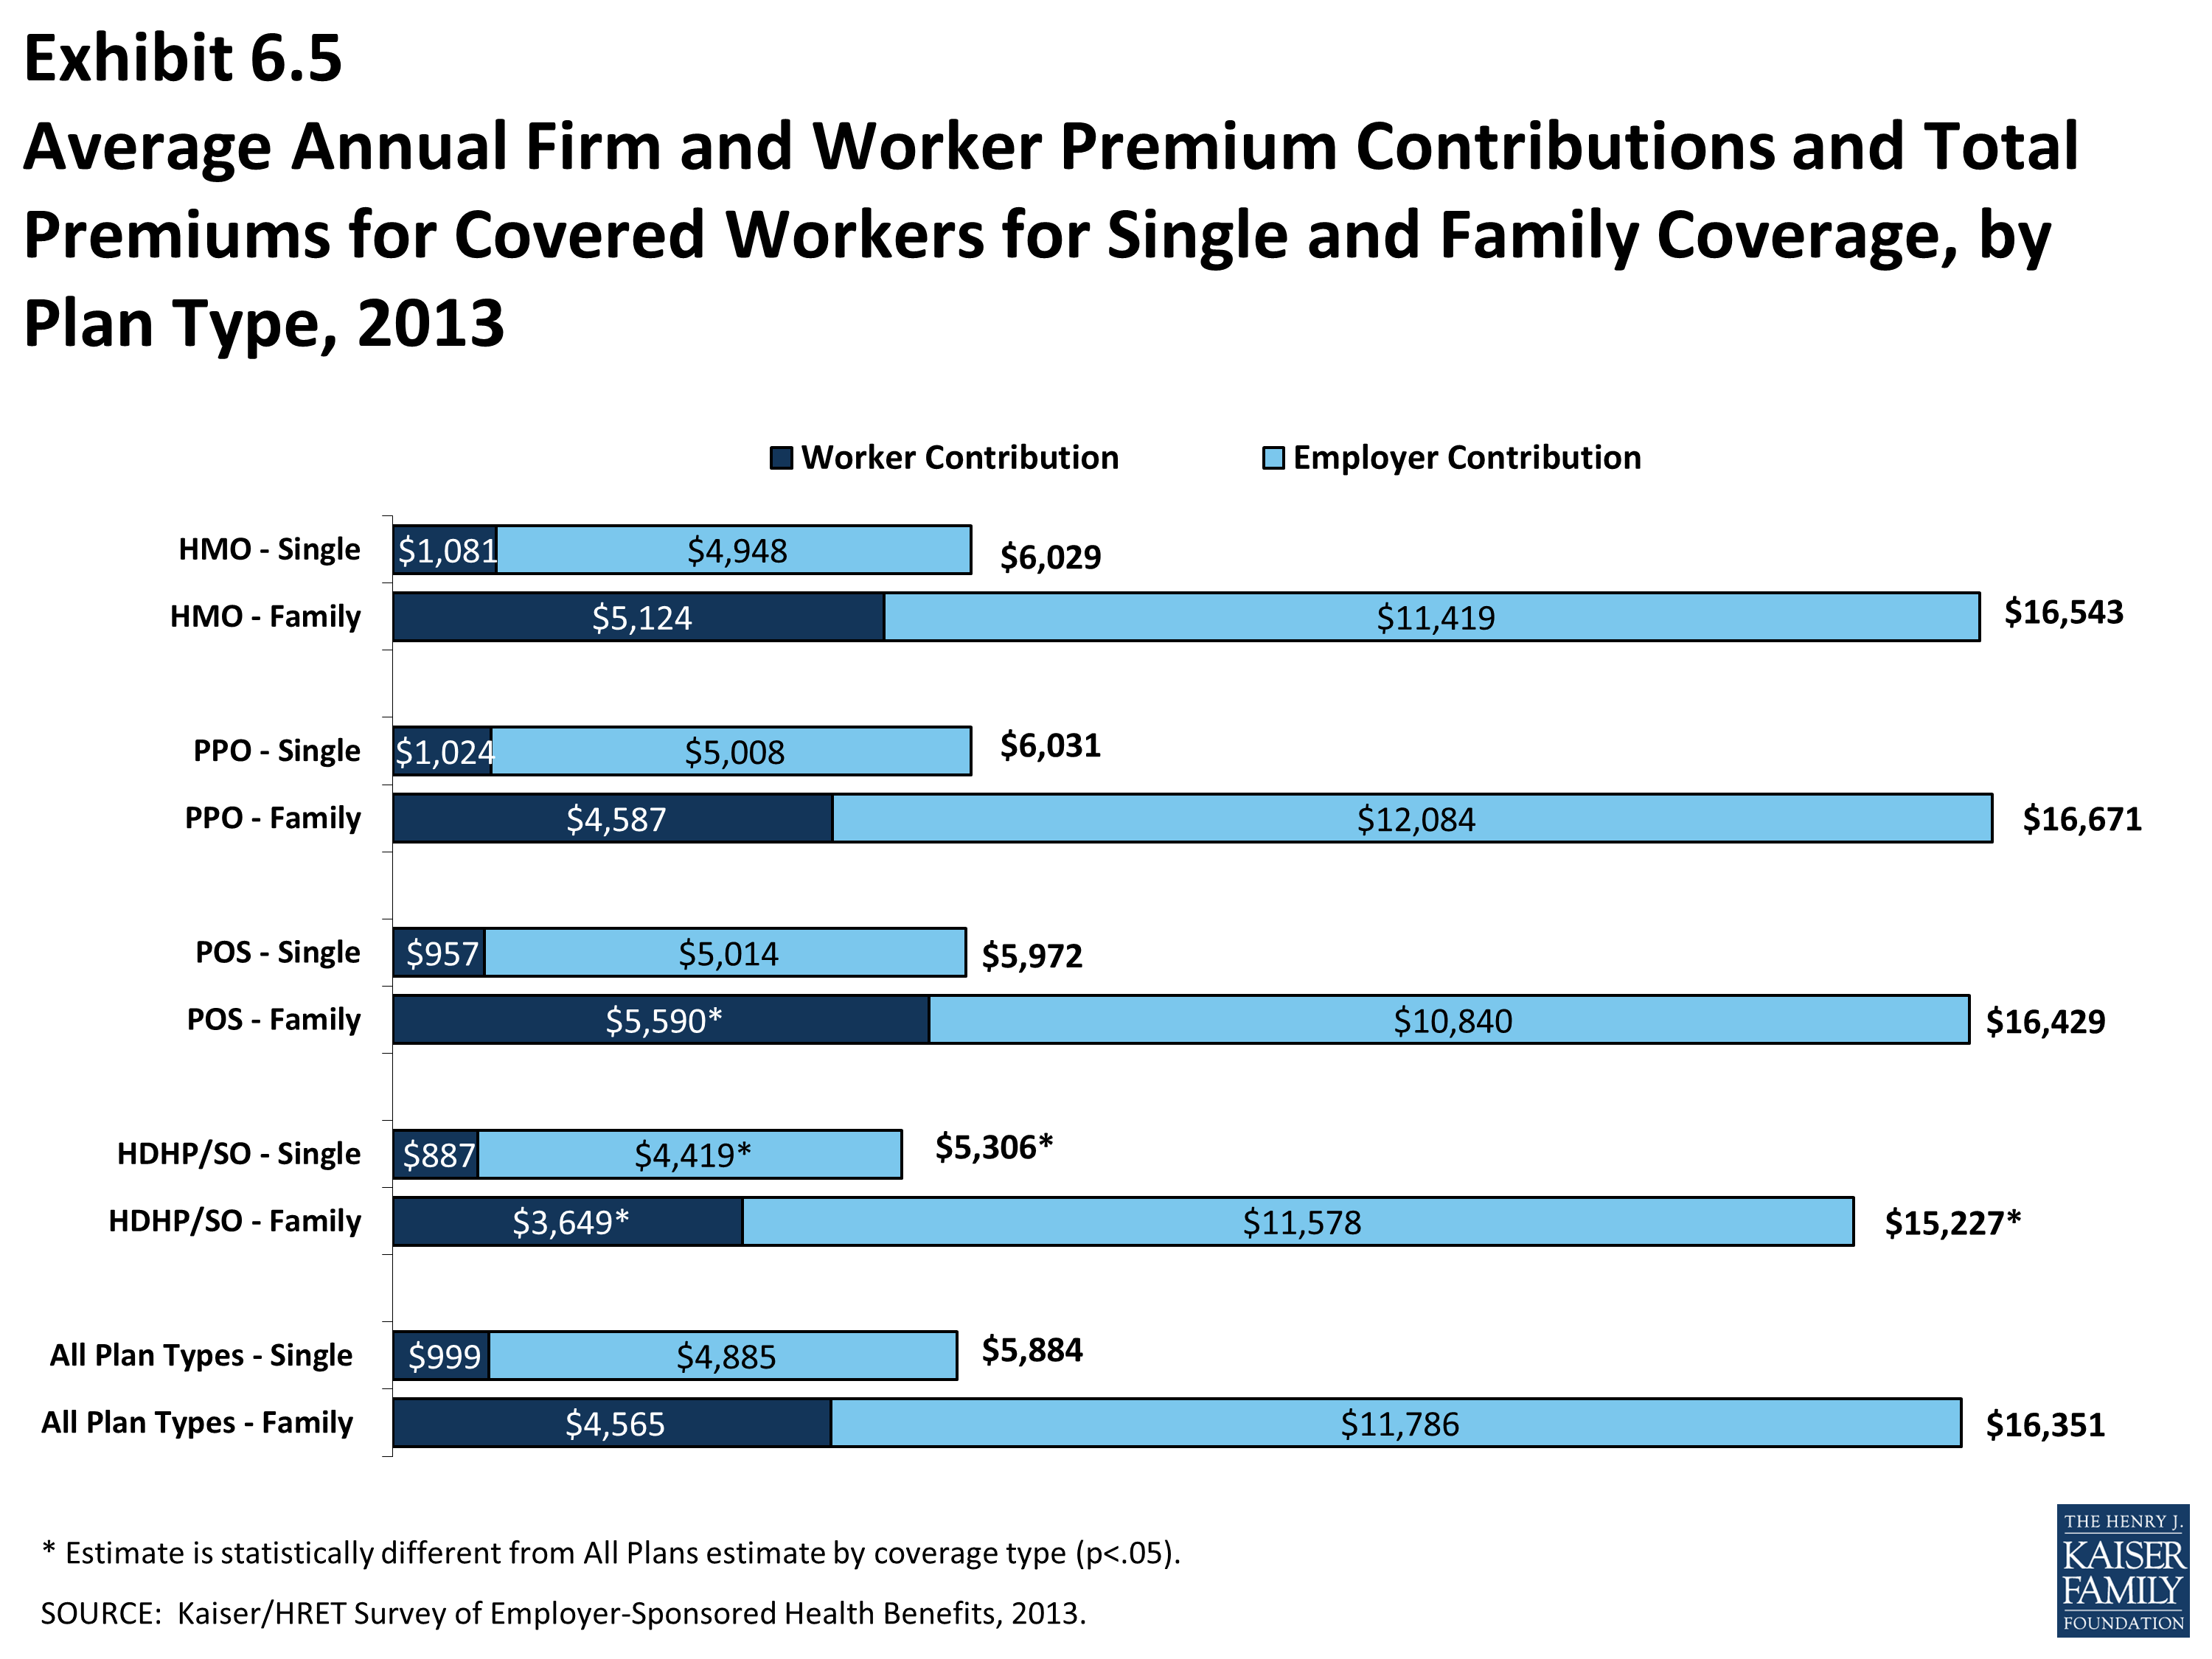
Average Annual Firm and Worker Premium Contributions and Total Premiums for Covered Workers for Single and Family Coverage, by Plan Type, 2013
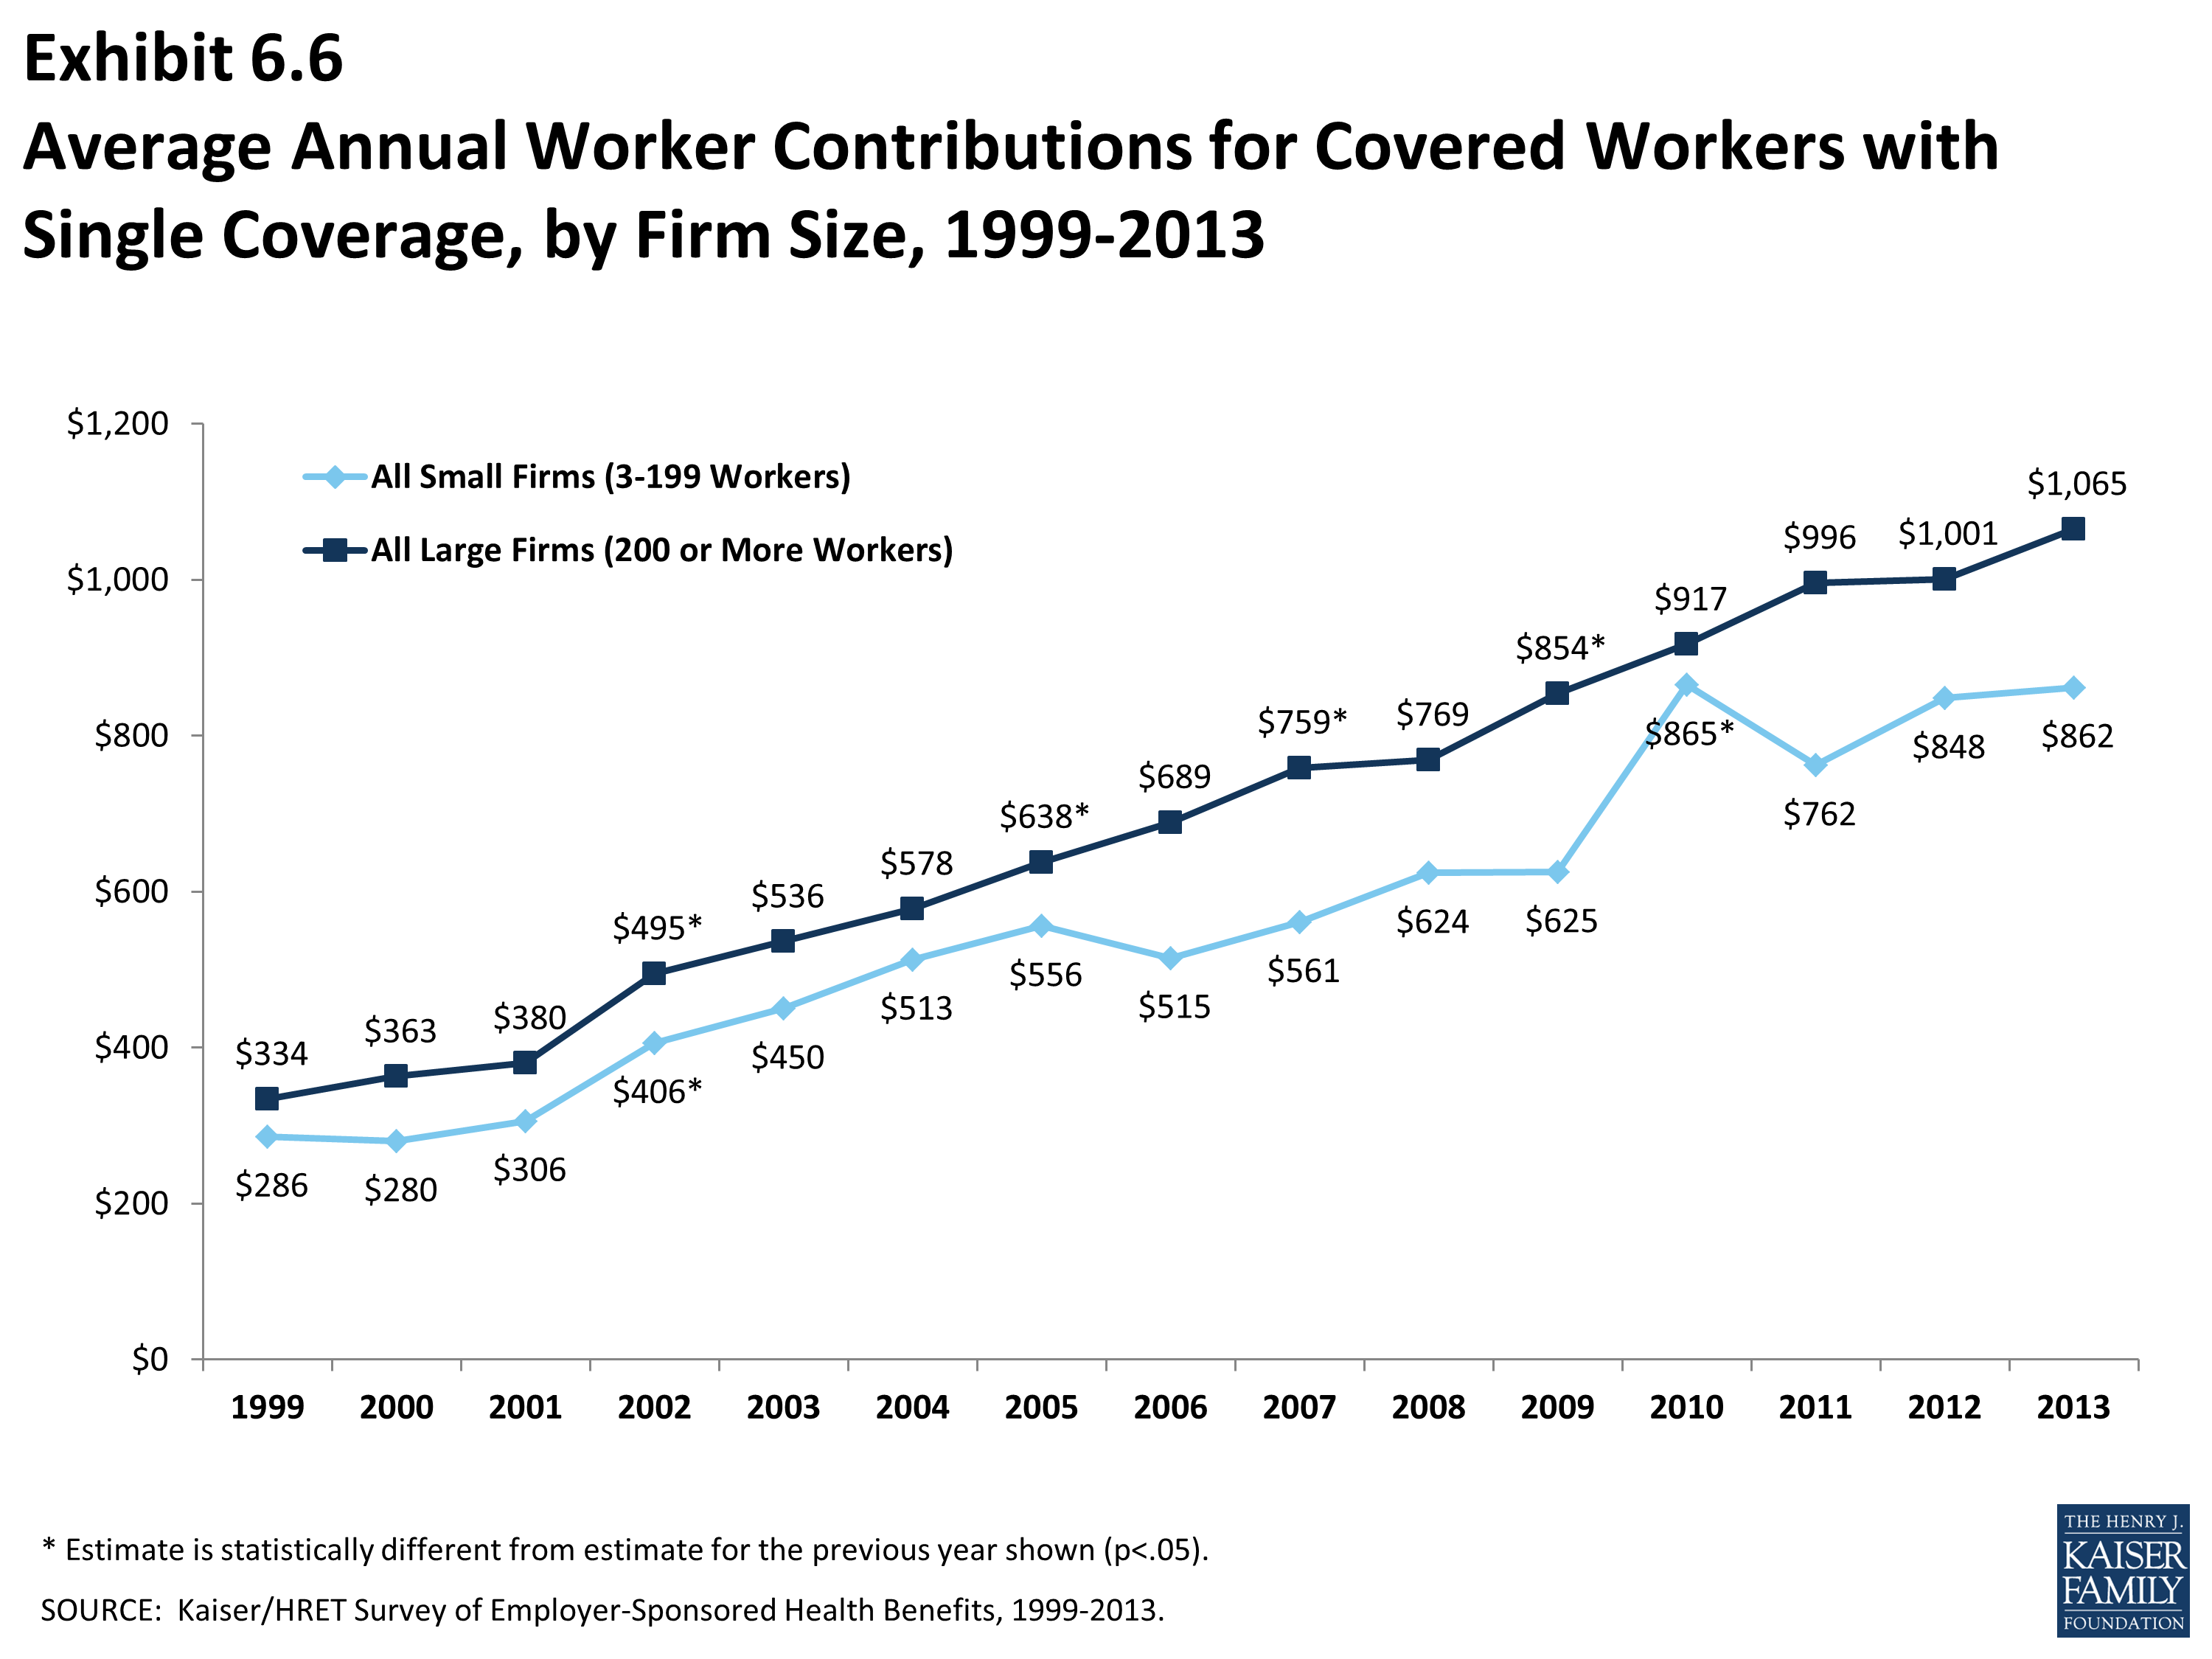
Average Annual Worker Contributions for Covered Workers with Single Coverage, by Firm Size, 1999-2013
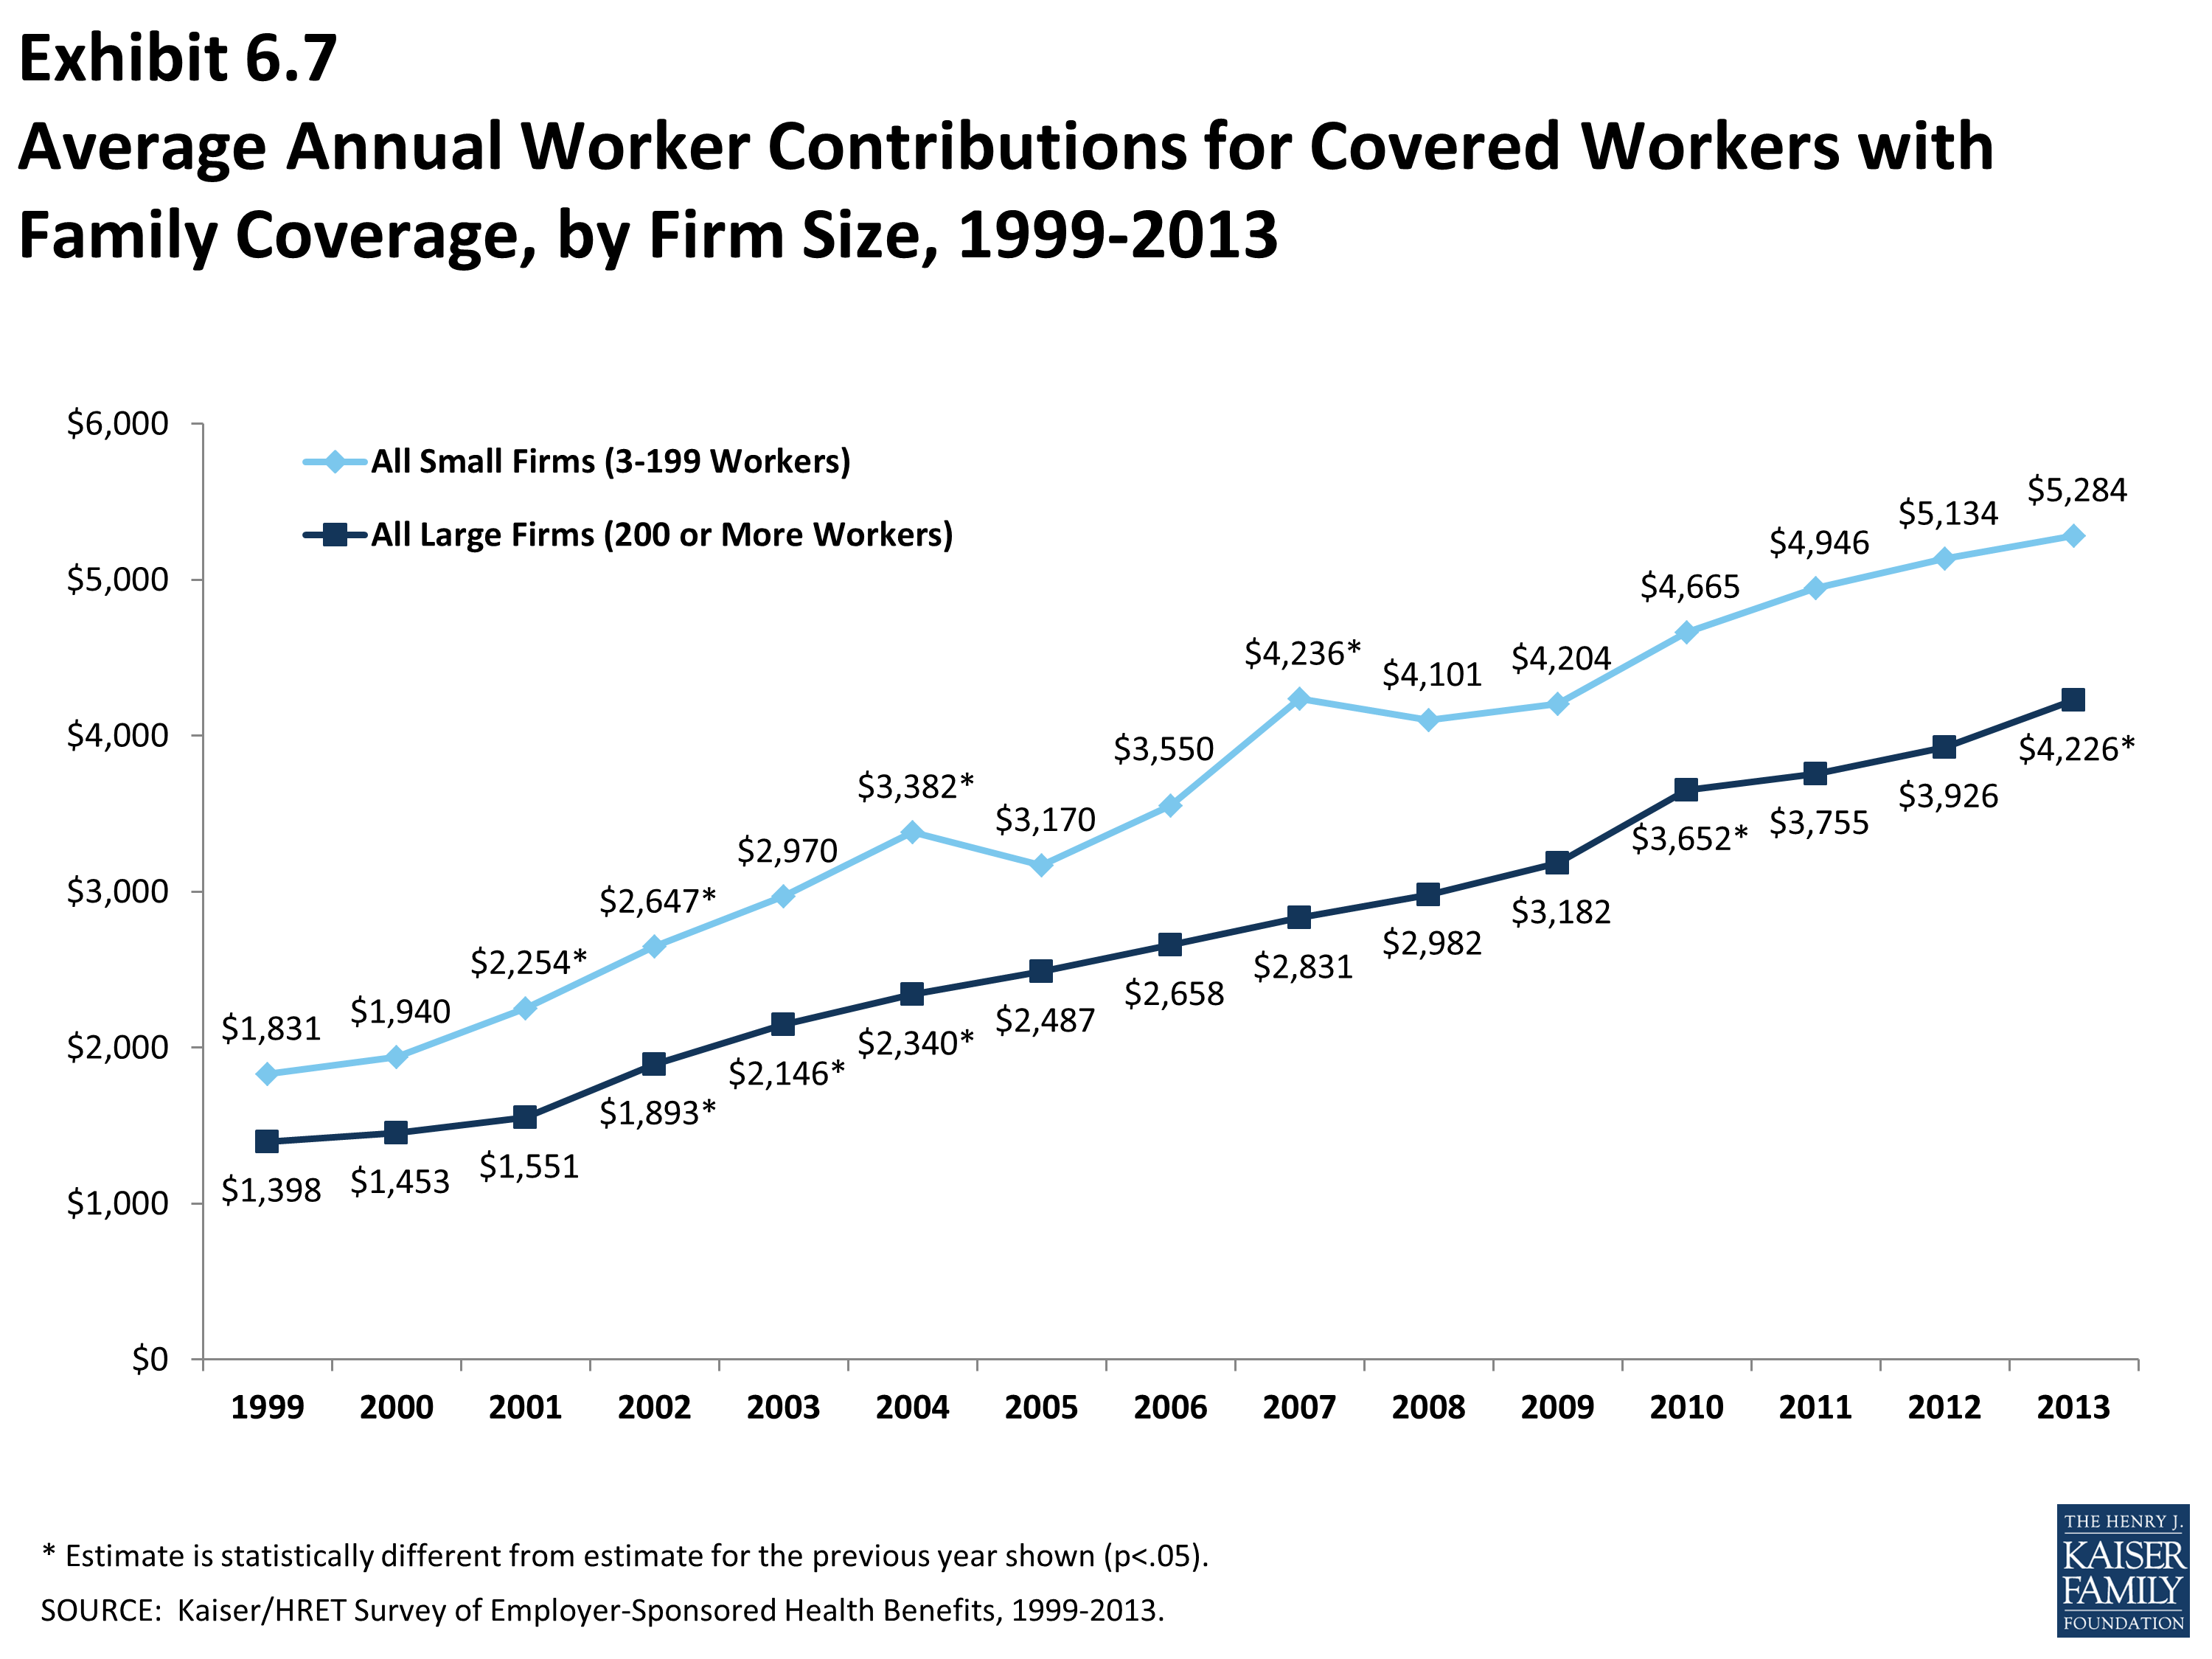
Average Annual Worker Contributions for Covered Workers with Family Coverage, by Firm Size, 1999-2013
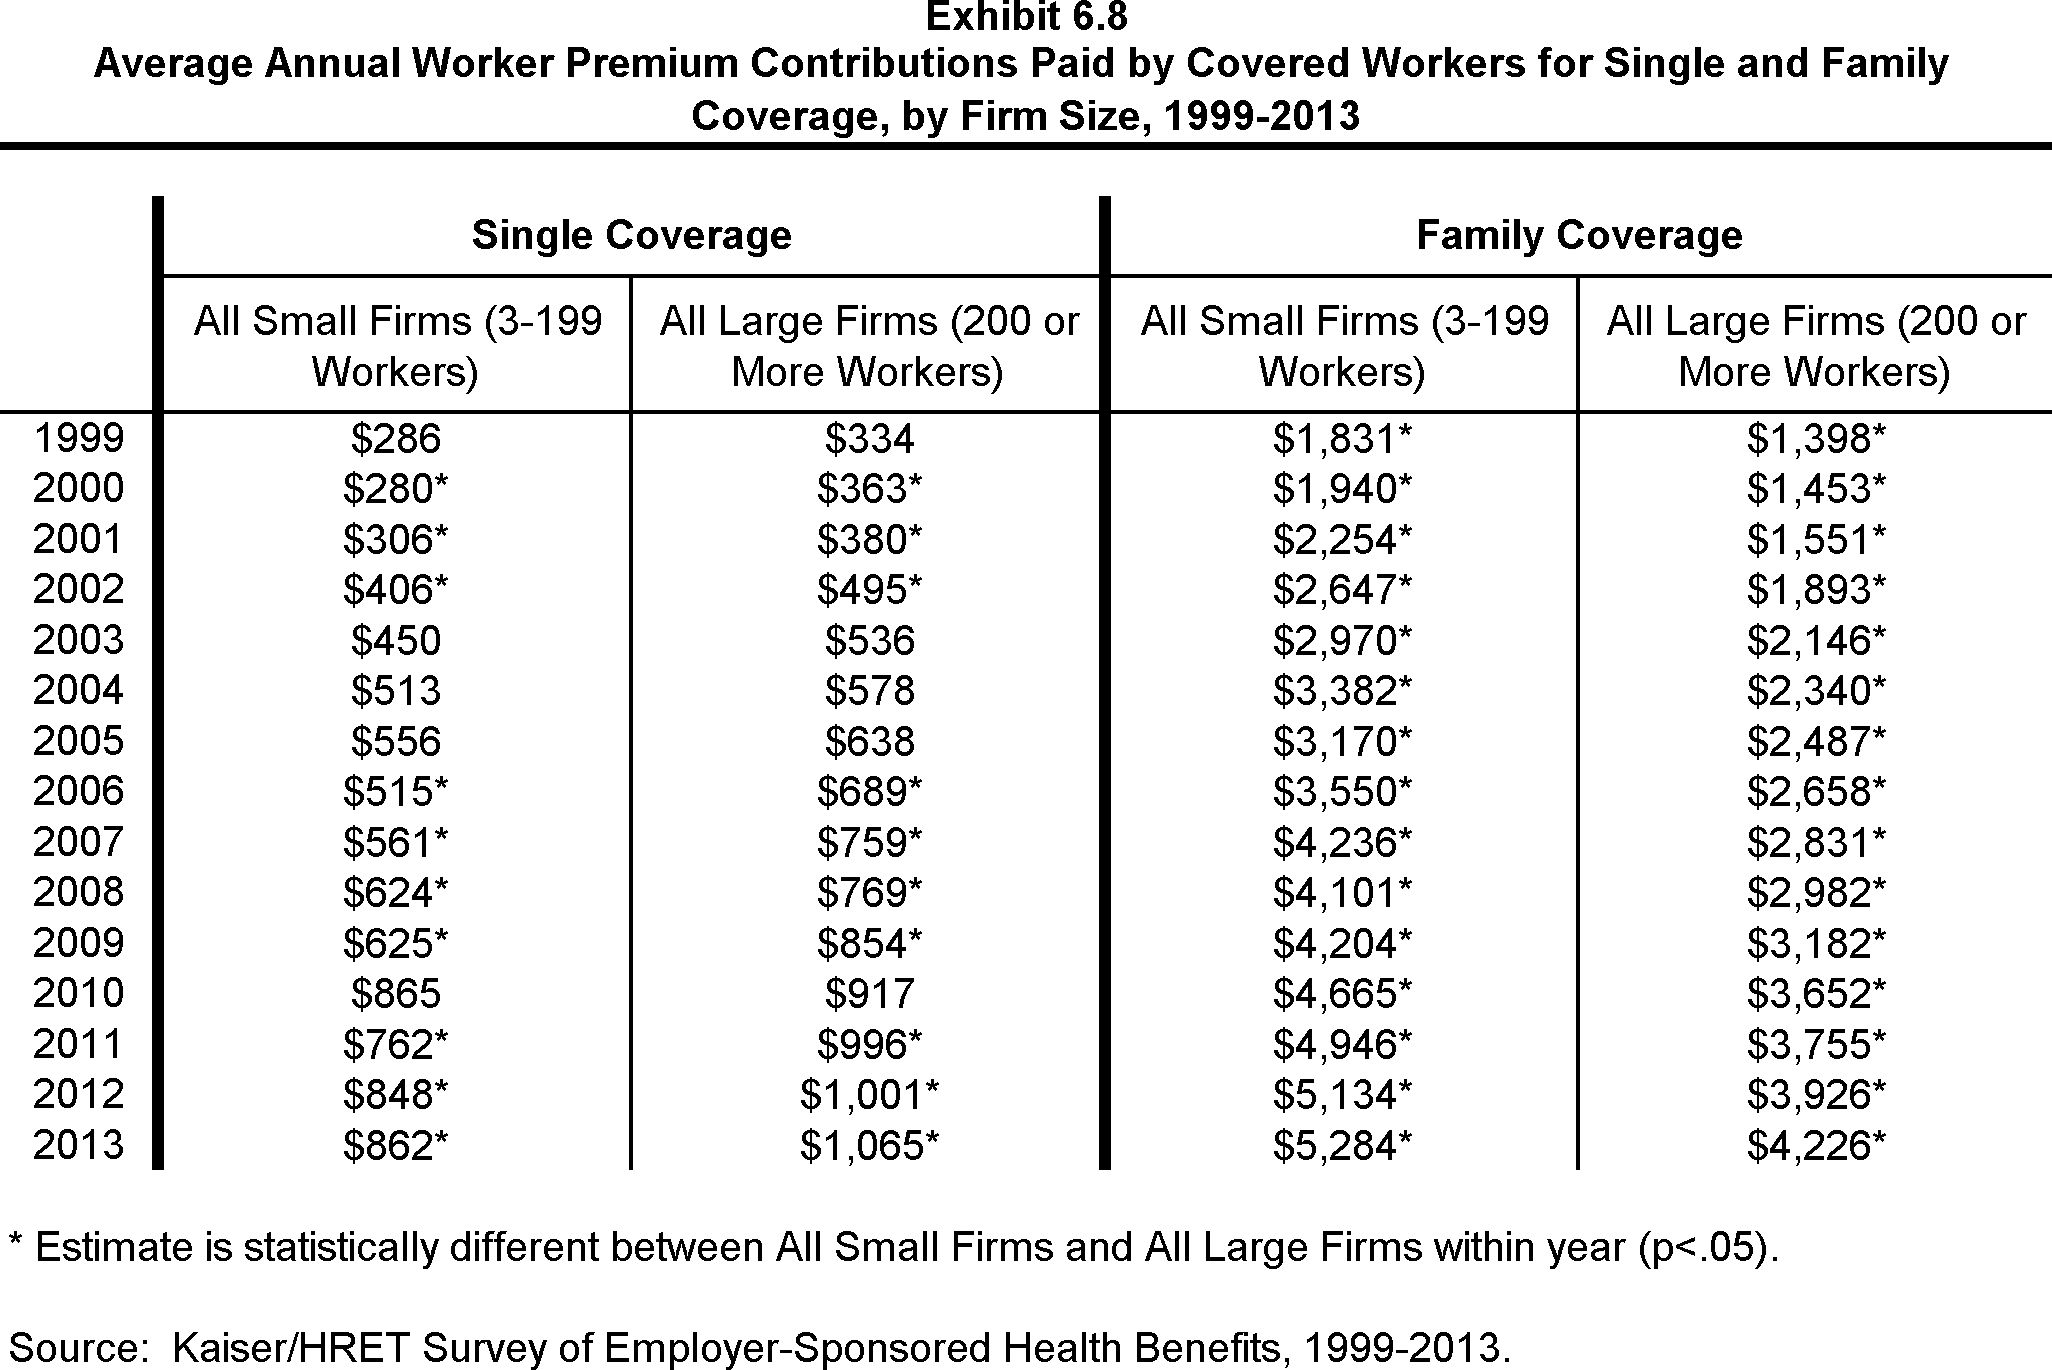
Average Annual Worker Premium Contributions Paid by Covered Workers for Single and Family Coverage, by Firm Size, 1999-2013
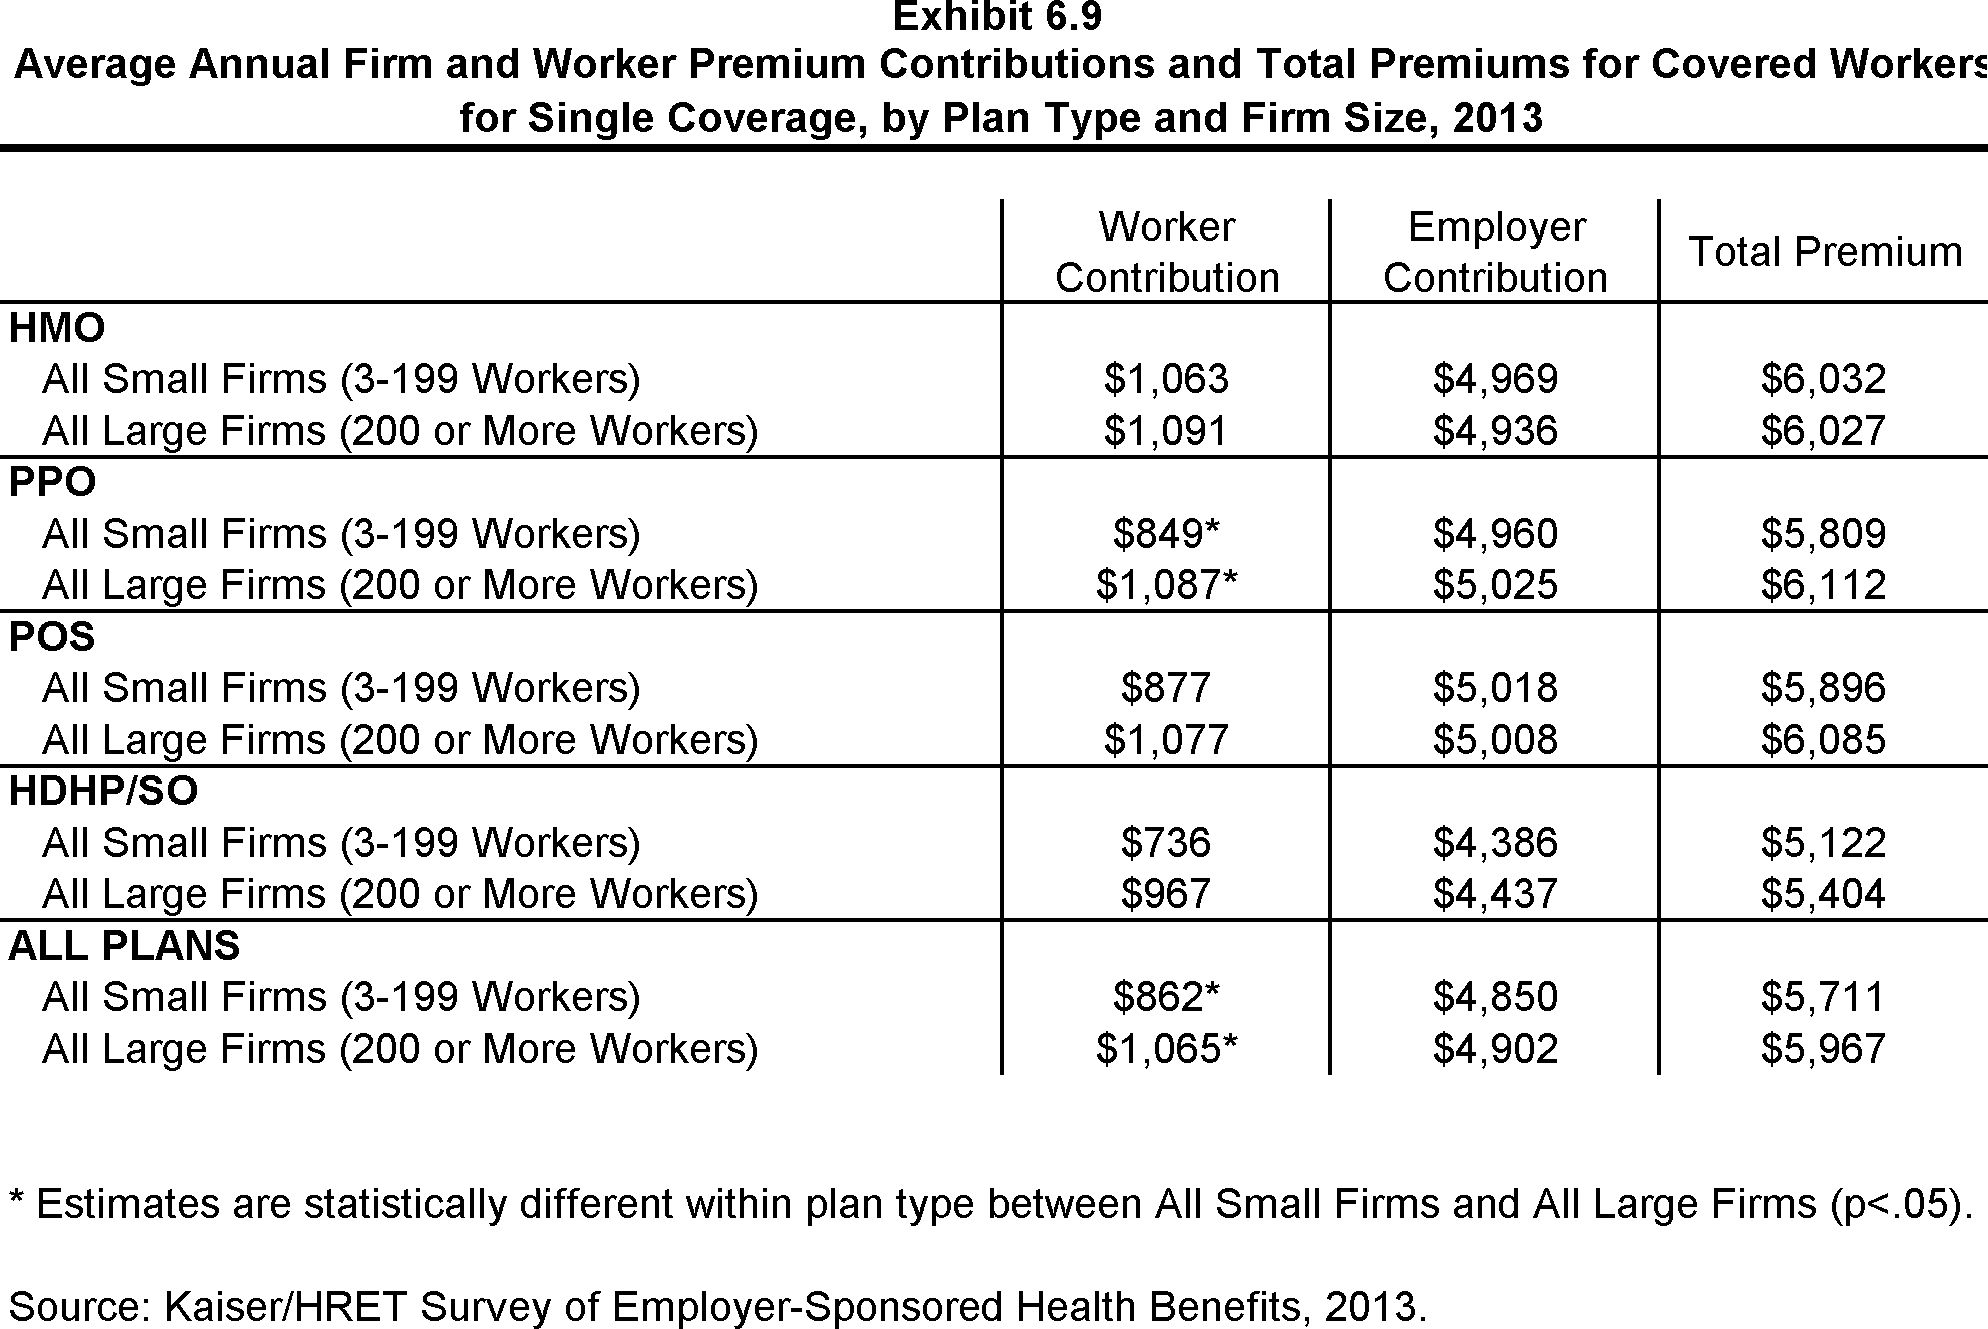
Average Annual Firm and Worker Premium Contributions and Total Premiums for Covered Workers for Single Coverage, by Plan Type and Firm Size, 2013
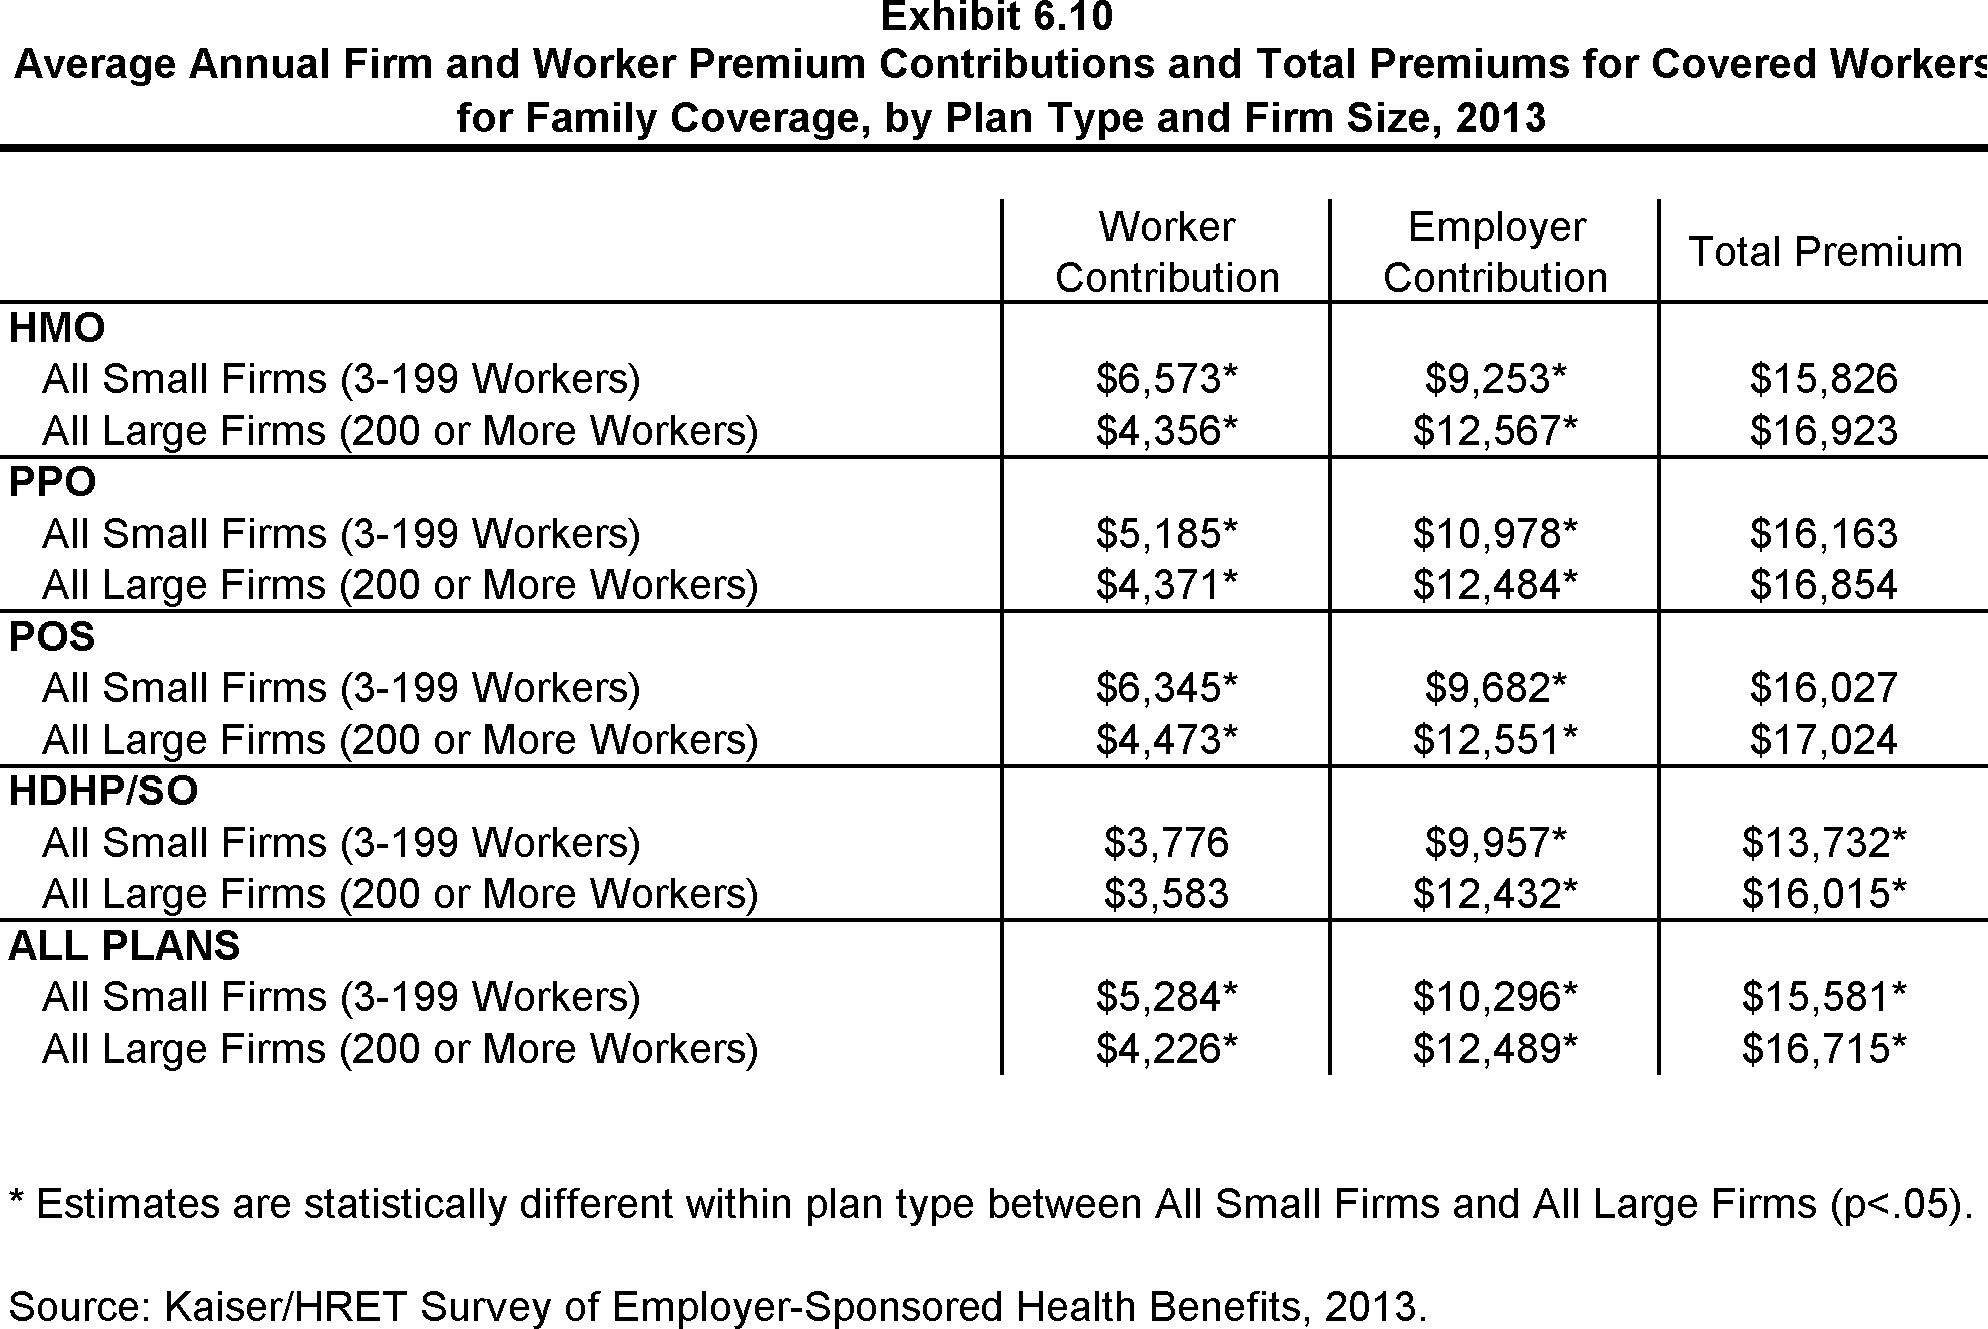
Average Annual Firm and Worker Premium Contributions and Total Premiums for Covered Workers for Family Coverage, by Plan Type and Firm Size, 2013
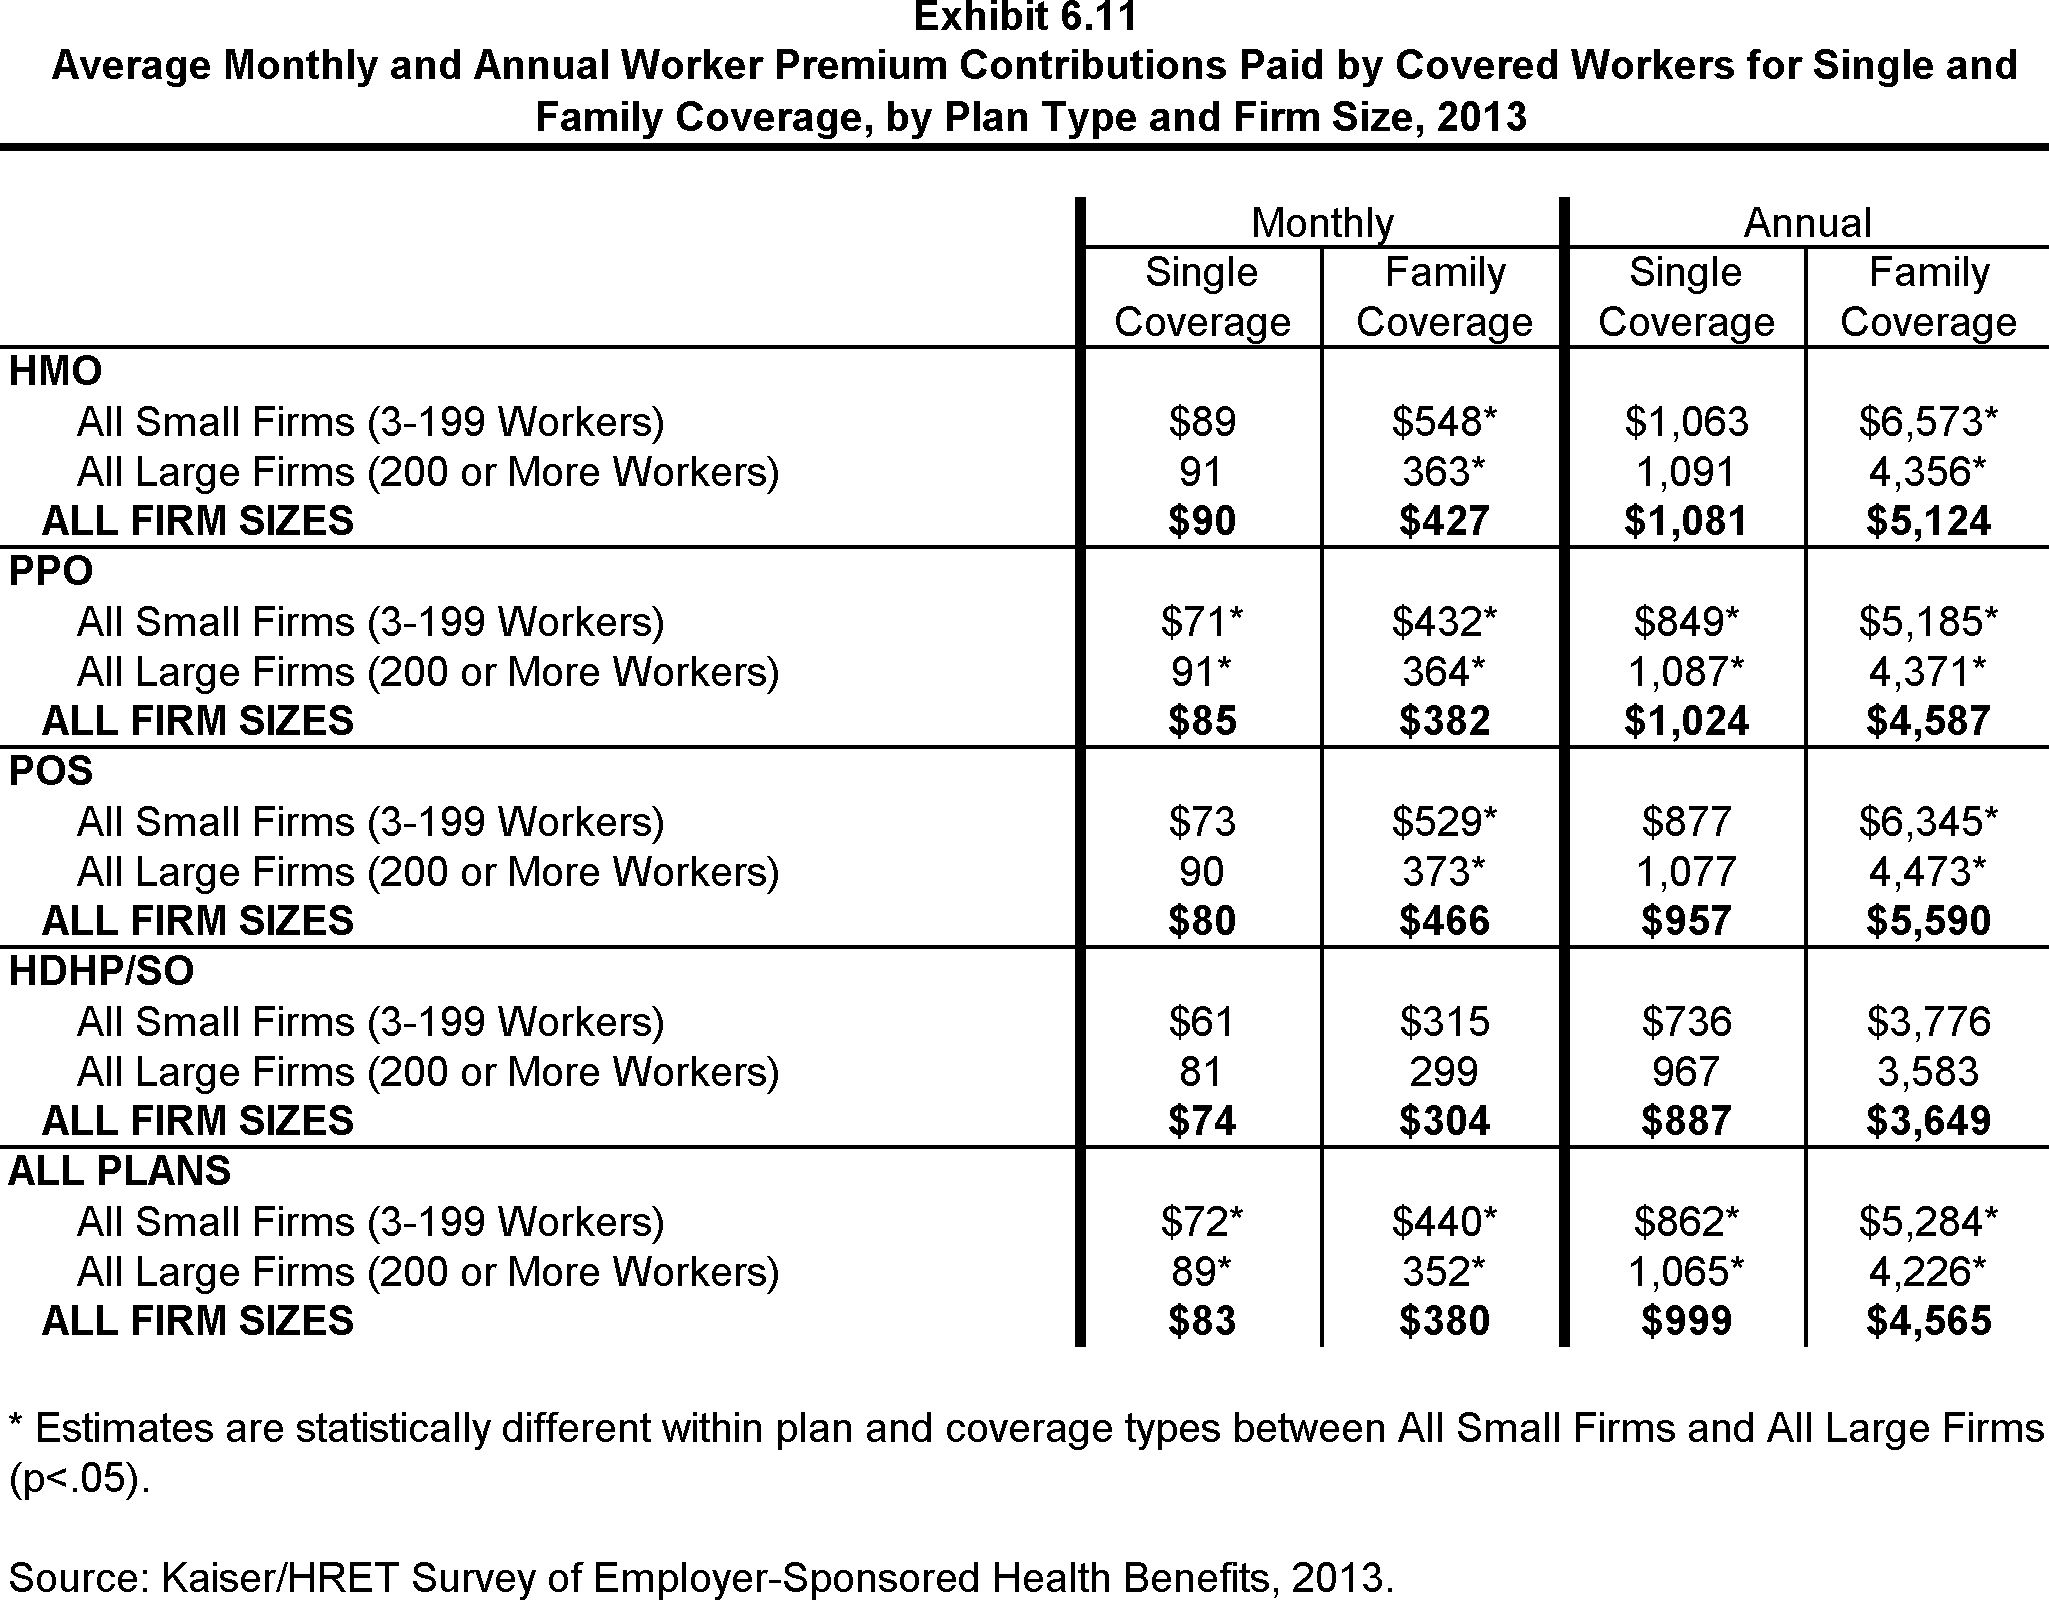
Average Monthly and Annual Worker Premium Contributions Paid by Covered Workers for Single and Family Coverage, by Plan Type and Firm Size, 2013

Average Monthly and Annual Worker Premium Contributions Paid by Covered Workers for Single and Family Coverage, by Plan Type and Region, 2013
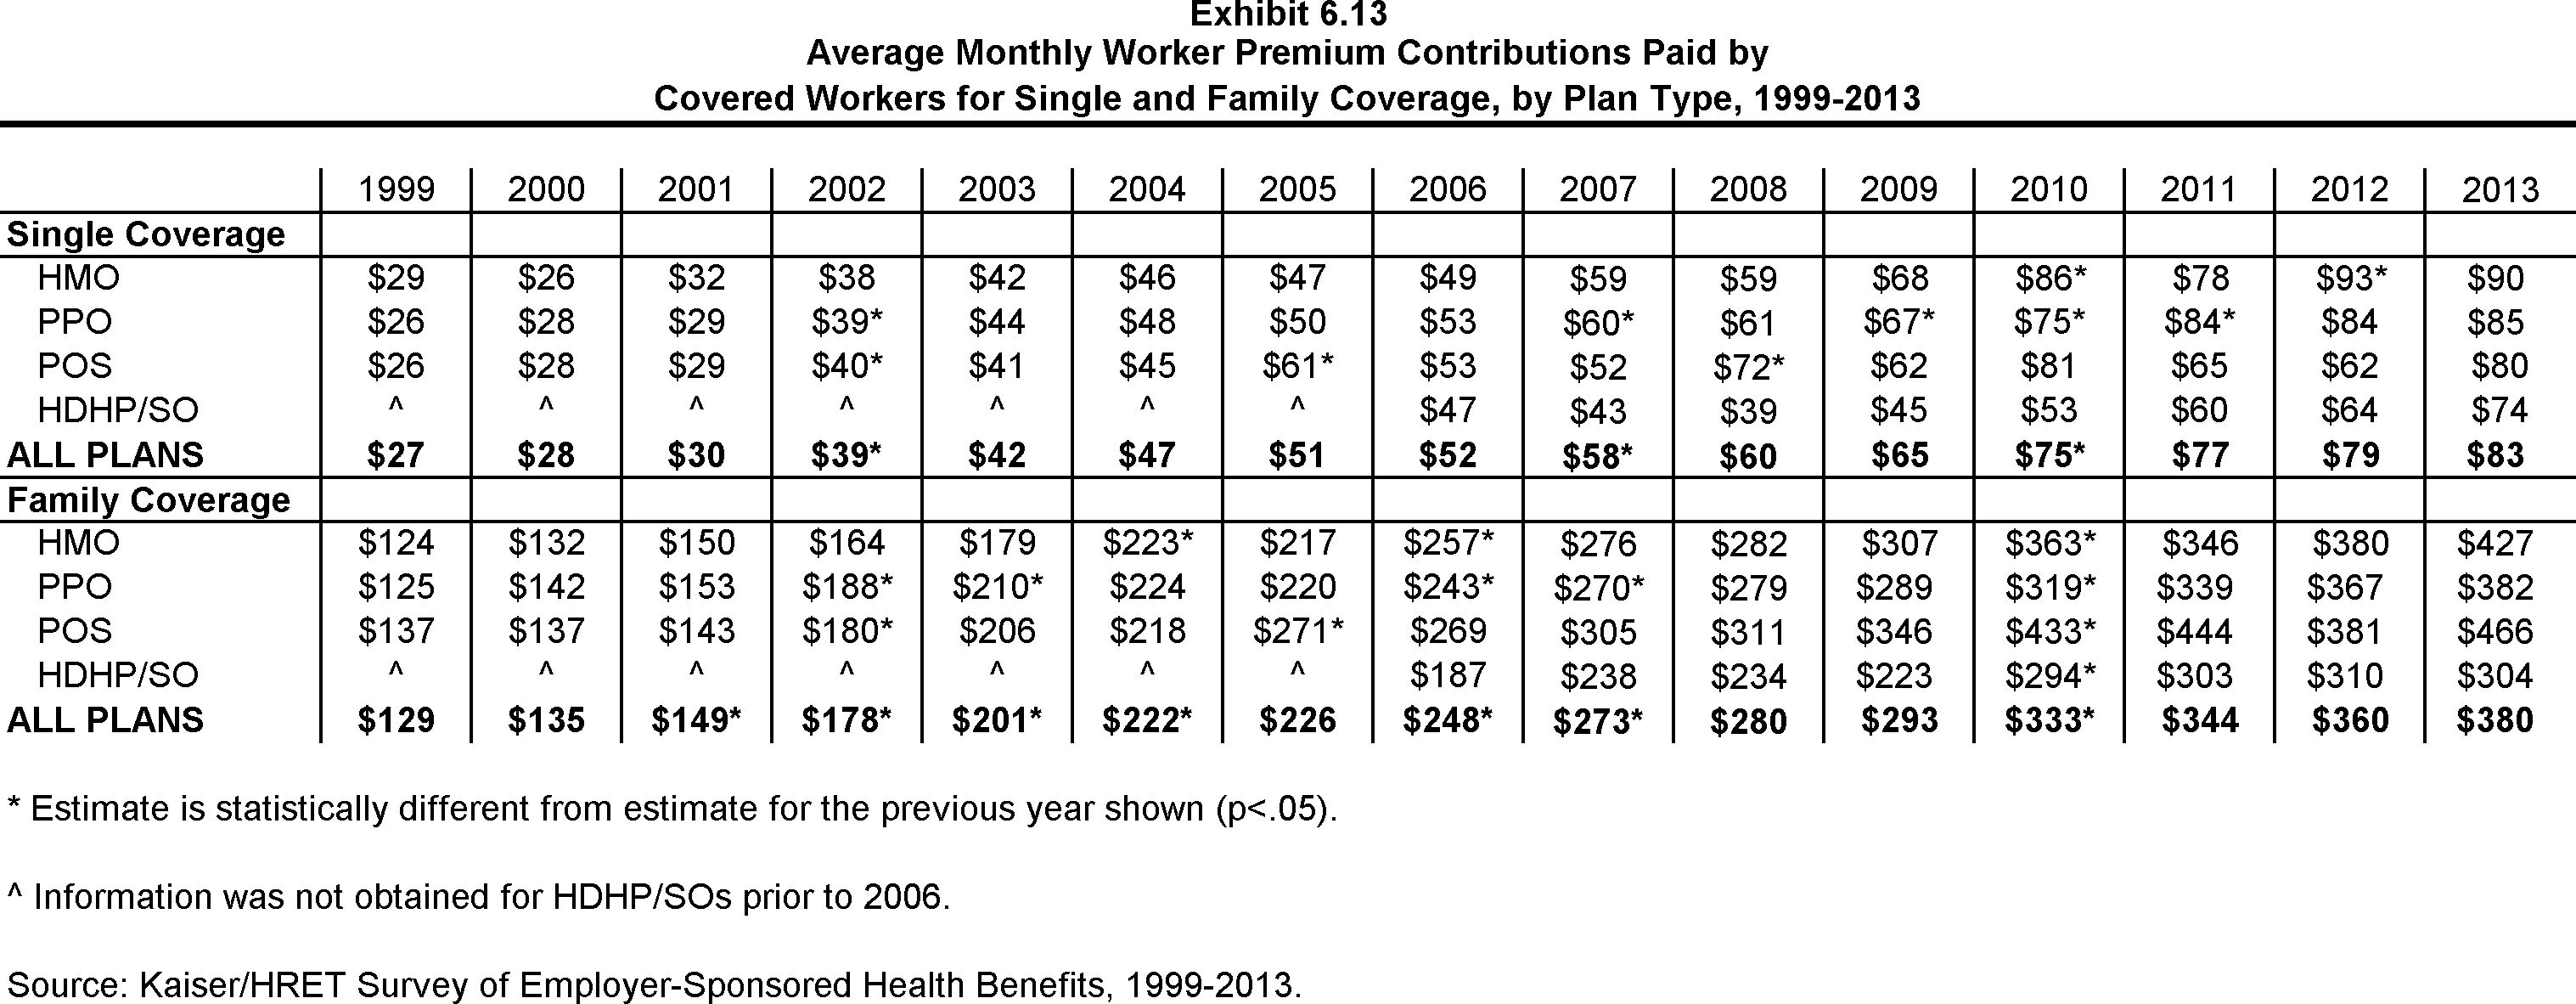
Average Monthly Worker Premium Contributions Paid by Covered Workers for Single and Family Coverage, by Plan Type, 1999-2013

Distribution of Worker Premium Contributions for Single and Family Coverage Relative to the Average Annual Worker Premium Contribution, 2013
Distribution of Percentage of Premium Paid by Covered Workers for Single and Family Coverage, 2002-2013
Distribution of Percentage of Premium Paid by Covered Workers for Single Coverage, by Firm Size, 2002-2013
Distribution of Percentage of Premium Paid by Covered Workers for Family Coverage, by Firm Size, 2002-2013
Distribution of the Percentage of Total Premium Paid by Covered Workers for Single and Family Coverage, by Wage Level, 2013
Average Percentage of Premium Paid by Covered Workers for Single Coverage, by Firm Characteristics and Size, 2013

Average Percentage of Premium Paid by Covered Workers for Family Coverage, by Firm Characteristics and Size, 2013

Average Percentage of Premium Paid by Covered Workers for Single and Family Coverage, by Plan Type and Firm Size, 2013
Average Percentage of Premium Paid by Covered Workers for Single and Family Coverage, by Plan Type, 1999-2013

Average Percentage of Premium Paid by Covered Workers for Single and Family Coverage, by Plan Type and Region, 2013
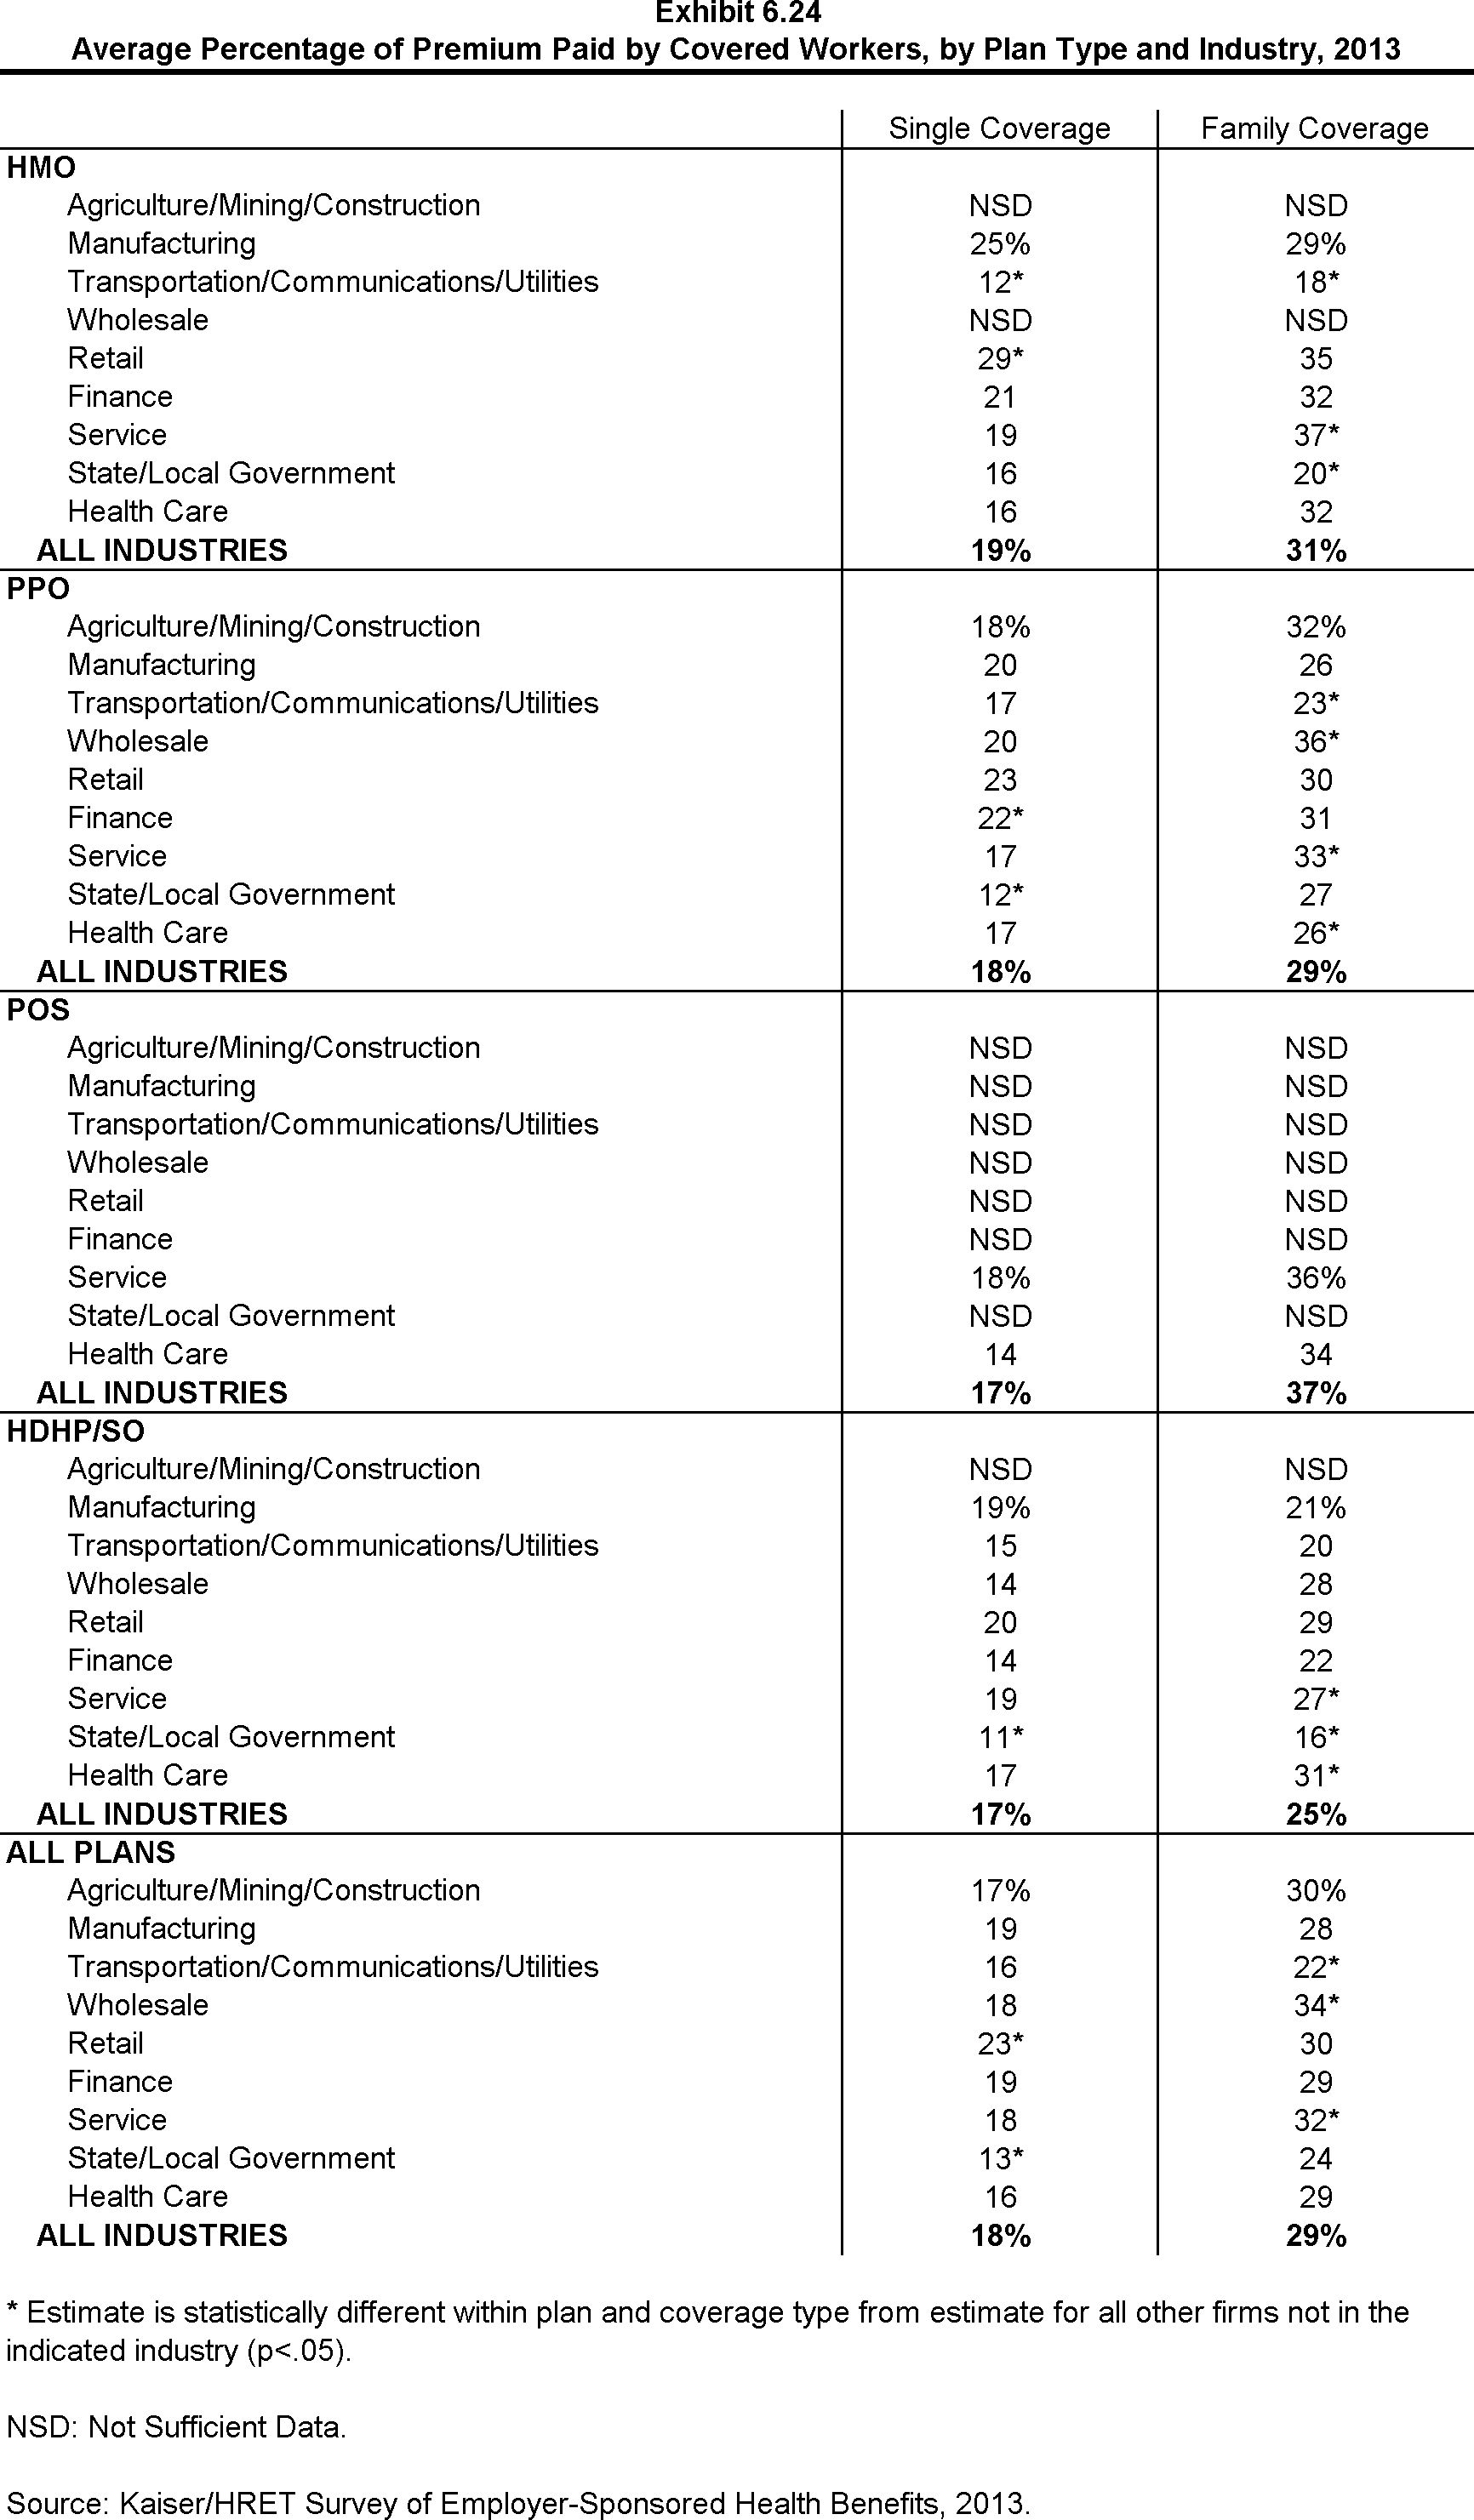
Average Percentage of Premium Paid by Covered Workers, by Plan Type and Industry, 2013
Among Firms Offering Health Benefits with Fewer Than 20 Employees, Variations in Premiums and Firm Premium Contributions for Single Coverage, 2013
Section Seven: Employee Cost Sharing
In addition to any required premium contributions, most covered workers face cost sharing for the medical services they use. Cost sharing for medical services can take a variety of forms, including deductibles (an amount that must be paid before some or all services are covered by the plan), copayments (fixed dollar amounts), and/or coinsurance (a percentage of the charge for services). The type and level of cost sharing often vary by the type of plan in which the worker is enrolled. Cost sharing may also vary by the type of service, such as office visits, hospitalizations, or prescription drugs.
The cost-sharing amounts reported here are for covered workers using services provided in-network by participating providers. Plan enrollees receiving services from providers that do not participate in plan networks often face higher cost sharing and may be responsible for charges that exceed plan allowable amounts. The framework of this survey does not allow us to capture all of the complex cost-sharing requirements in modern plans, particularly for ancillary services (such as durable medical equipment or physical therapy) or cost-sharing arrangements that vary across different settings (such as tiered networks). Therefore, we do not collect information on all plan provisions and limits that affect enrollee out-of-pocket liability.
General Annual Deductibles
- A general annual deductible is an amount that must be paid by the enrollee before most services are covered by their health plan. Some plans require enrollees to meet a service specific deductible such as on prescription drugs or hospital admissions in lieu of or in addition to a general deductible. Federal law requires that some services such as preventative care are covered by some plans without cost sharing.
- Seventy-eight percent of covered workers are enrolled in a plan with a general annual deductible for single coverage. More covered workers are enrolled in a plan with a general annual deductible in 2013 than in 2012 (78% vs. 72%) (Exhibit 7.2). Since 2006, the percent of covered workers with a general annual deductible has increased from 55% to 78%.
- The percent of covered workers enrolled in a plan with a general annual deductible is similar for small (3-199 workers) and larger firms (77% and 78%) (Exhibit 7.2).
- The likelihood of having a deductible varies by plan type. Workers in HMOs are less likely to have a general annual deductible for single coverage compared to workers in other plan types. Fifty-nine percent of workers in HMOs do not have a general annual deductible, compared to 34% of workers in POS plans and 19% of workers in PPOs (Exhibit 7.1).
- Workers without a general annual plan deductible often have other forms of cost sharing for medical services. For workers without a general annual deductible for single coverage, 81% in HMOs, 83% in PPOs, and 73% in POS plans are in plans that require cost sharing for hospital admissions. The percentages are similar for family coverage (Exhibit 7.4).
- The dollars amounts of general annual deductibles vary greatly by plan type and firm size.
- The average annual deductible is $1,135. There are differences in the average general annual deductible by plan type. The average annual deductibles among those covered workers with a deductible for single coverage are $729 for HMOs, $799 for PPOs, $1,314 for POS plans, and $2,003 for HDHP/SOs (Exhibit 7.5). Overall, the average general annual deductible for all covered workers is $1,135.
- There is no statistically significant change in deductible amounts from 2012 to 2013 for any plan type (Exhibit 7.7).
- Deductibles are generally higher for covered workers in small firms (3-199 workers) than for covered workers in large firms (200 or more workers) across plan types (Exhibit 7.5). For covered workers in PPOs, deductibles in small firms are more than twice as large as deductibles in large firms ($1,488 vs. $563). On average, covered workers at small firms face higher general annual deductibles than covered workers at large firms ($1,715 vs. $884) (Exhibit 7.5).
- For family coverage, the majority of workers with general annual deductibles have an aggregate deductible, meaning all family members’ out-of-pocket expenses count toward meeting the deductible amount. Among those with a general annual deductible for family coverage, the percentage of covered workers with an average aggregate general annual deductible is 56% for workers in HMOs, 58% for workers in PPOs, 77% for workers in POS plans and 84% for workers in HDHP/SOs (Exhibit 7.13).
- The average amounts for workers with an aggregate deductible for family coverage are $1,743 for HMOs, $1,854 for PPOs, $2,821 for POS plans, and $4,079 for HDHP/SOs (Exhibit 7.14).
- The average aggregate deductible amounts for family coverage are similar to last year for each plan type (Exhibit 7.15).
- The other type of family deductible, a separate per-person deductible, requires each family member to meet a separate per-person deductible amount before the plan covers expenses for that member. Most plans with separate per-person family deductibles consider the deductible met for all family members if a prescribed number of family members each reach their separate deductible amounts. Plans may also require each family member to meet a separate per-person deductible until the family’s combined spending reaches a specified dollar amount.
- For covered workers in health plans that have separate per-person general annual deductible amounts for family coverage, the average plan deductible amounts are $609 for HMOs, $782 for PPOs, $1,080 for POS plans, and $2,033 for HDHP/SOs (Exhibit 7.14).
- Most covered workers in plans with a separate per-person general annual deductible for family coverage have a limit to the number of family members required to meet the separate deductible amounts (Exhibit 7.18).1 Among those workers in plans with a limit on the number of family members, the most frequent number of family members required to meet the separate deductible amounts is three for HMO and PPO plans, and two for POS plans (Exhibit 7.19).
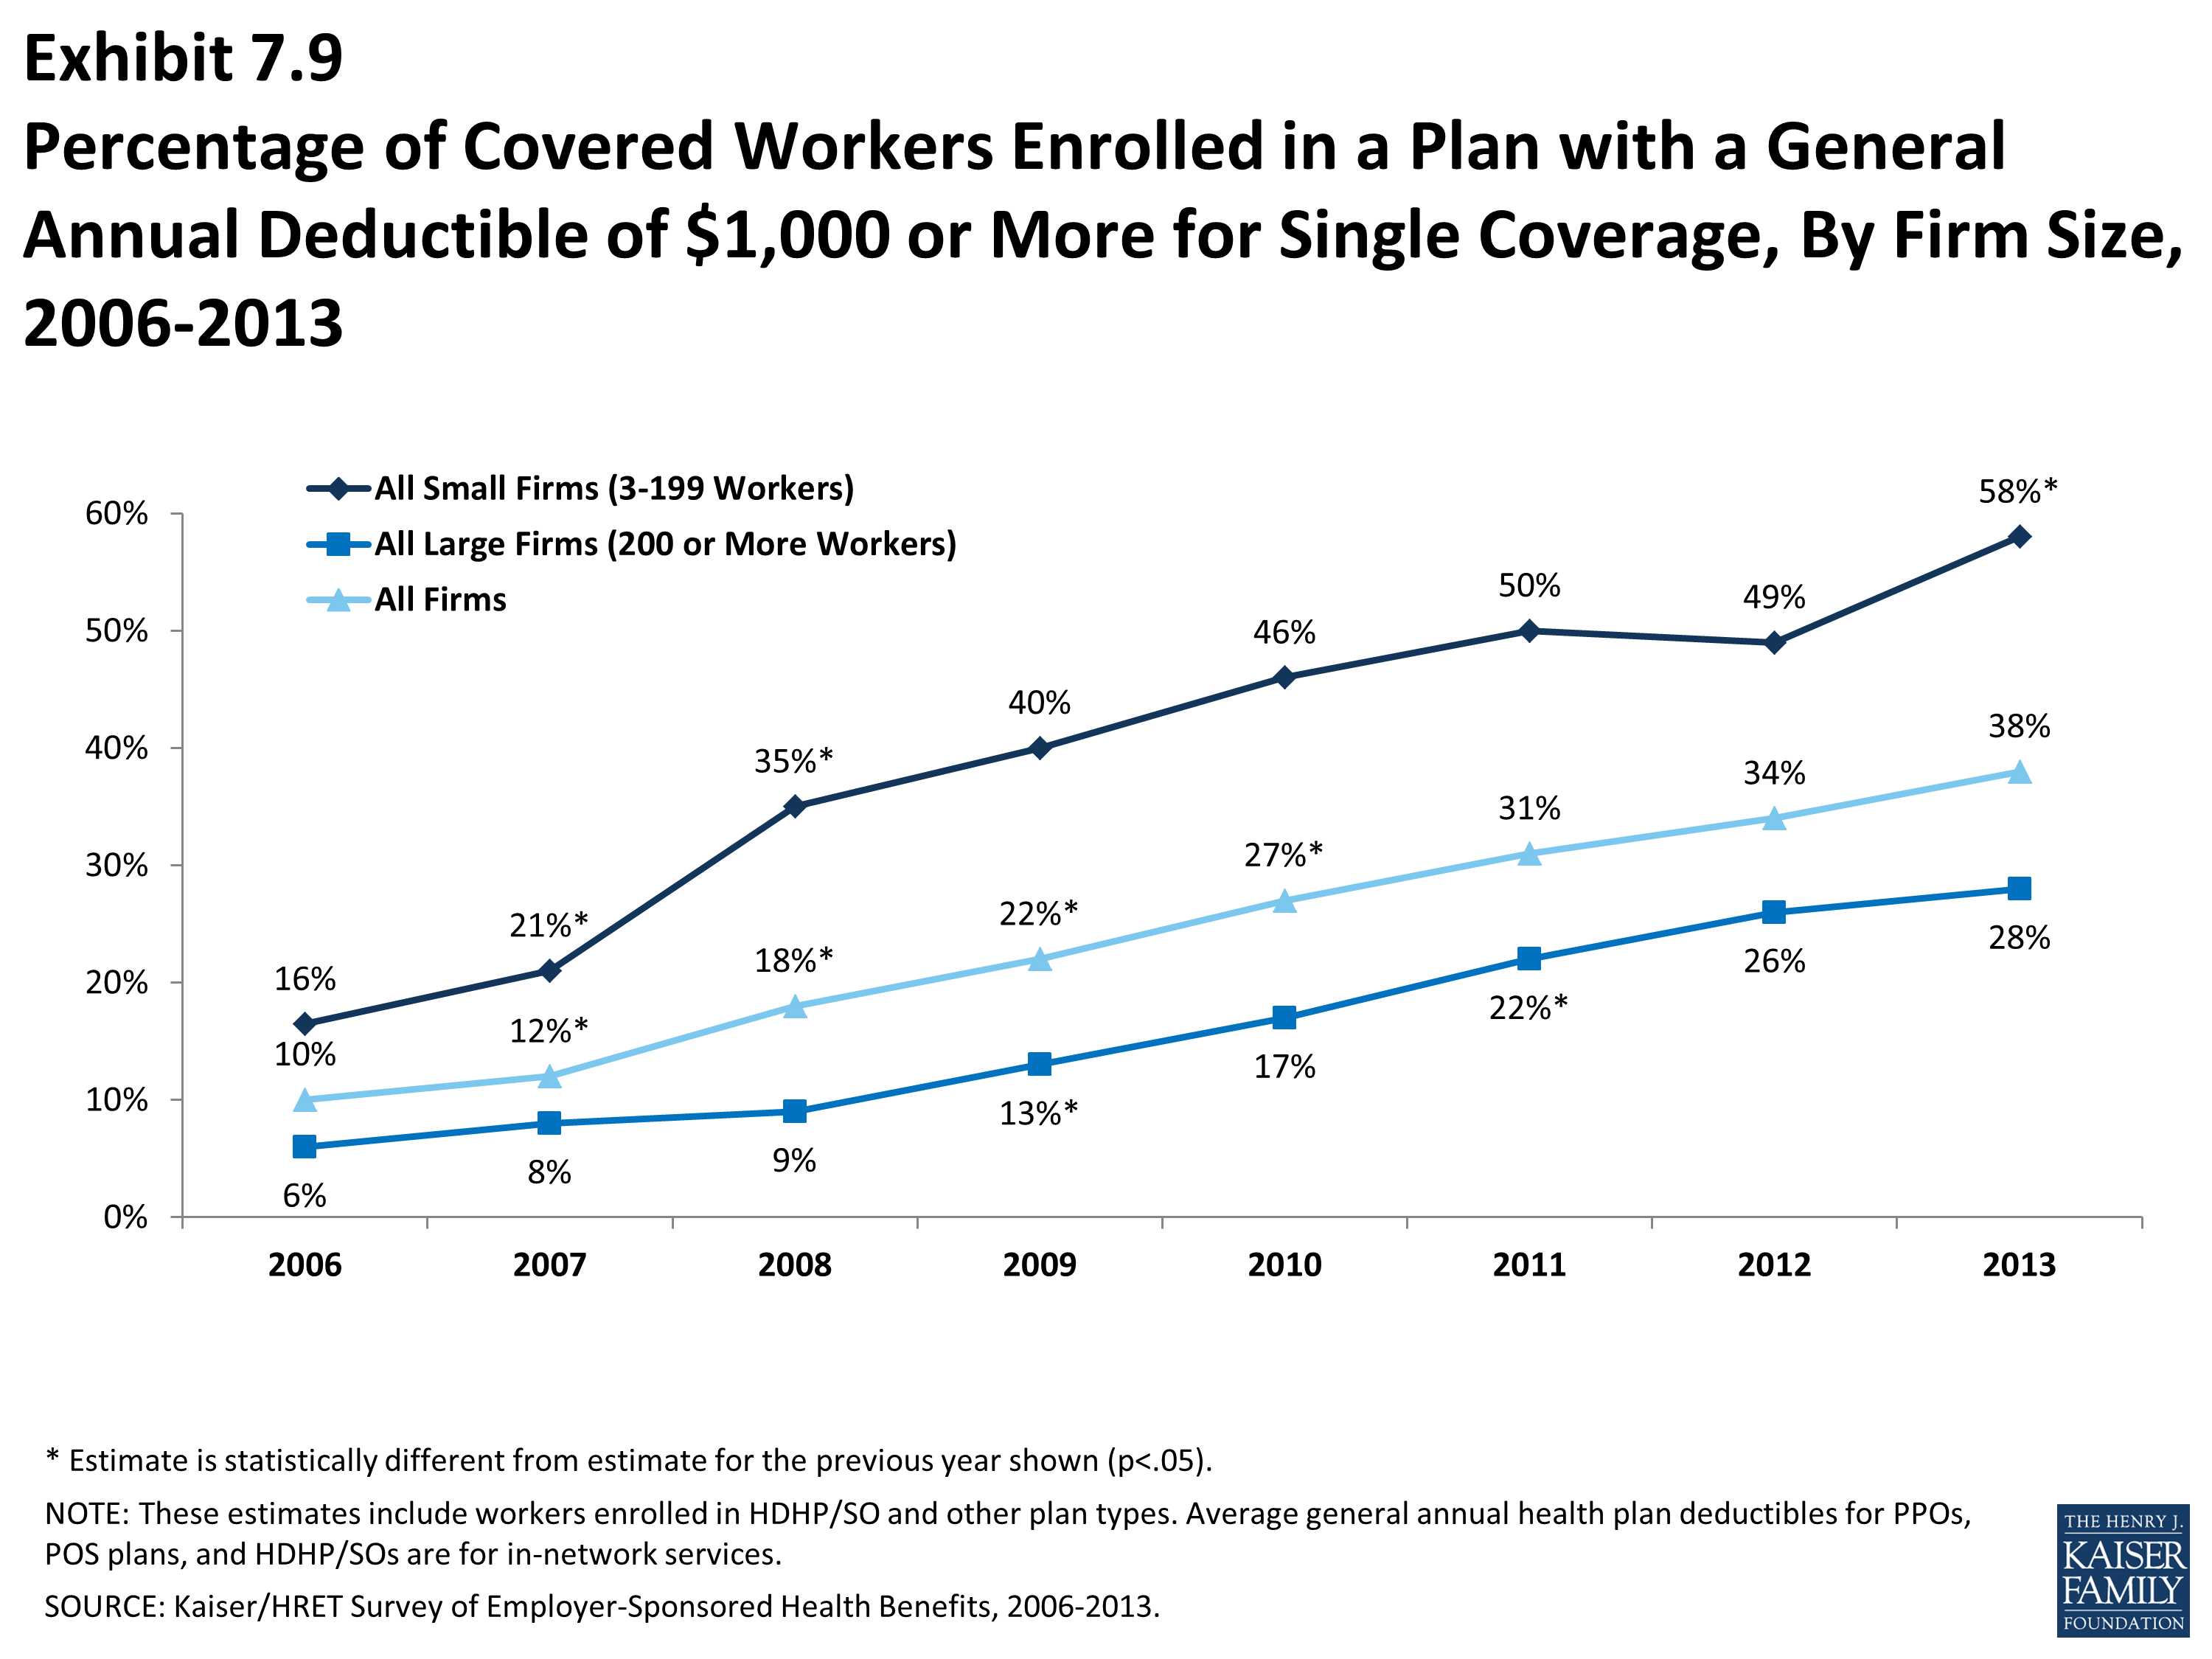
- Thirty-eight percent of covered workers are in plans with a deductible of $1000 or more for single coverage, similar to the percentage (34%) in 2012 (Exhibit 7.9).
- Over the last five years, the percentage of covered workers with a deductible of $1,000 or more for single coverage has increased from 18% to 38% (Exhibit 7.9). Workers in small firms (3-199 workers) are more likely to have a general annual deductible of $1,000 or more for single coverage than workers in large firms (200 or more workers) (58% vs. 28%) (Exhibit 7.8). The percent of covered workers at small firms (3-199 workers) who have a deductible of a $1,000 or more increased from 49% in 2012 to 58% in 2013 (Exhibit 7.9).
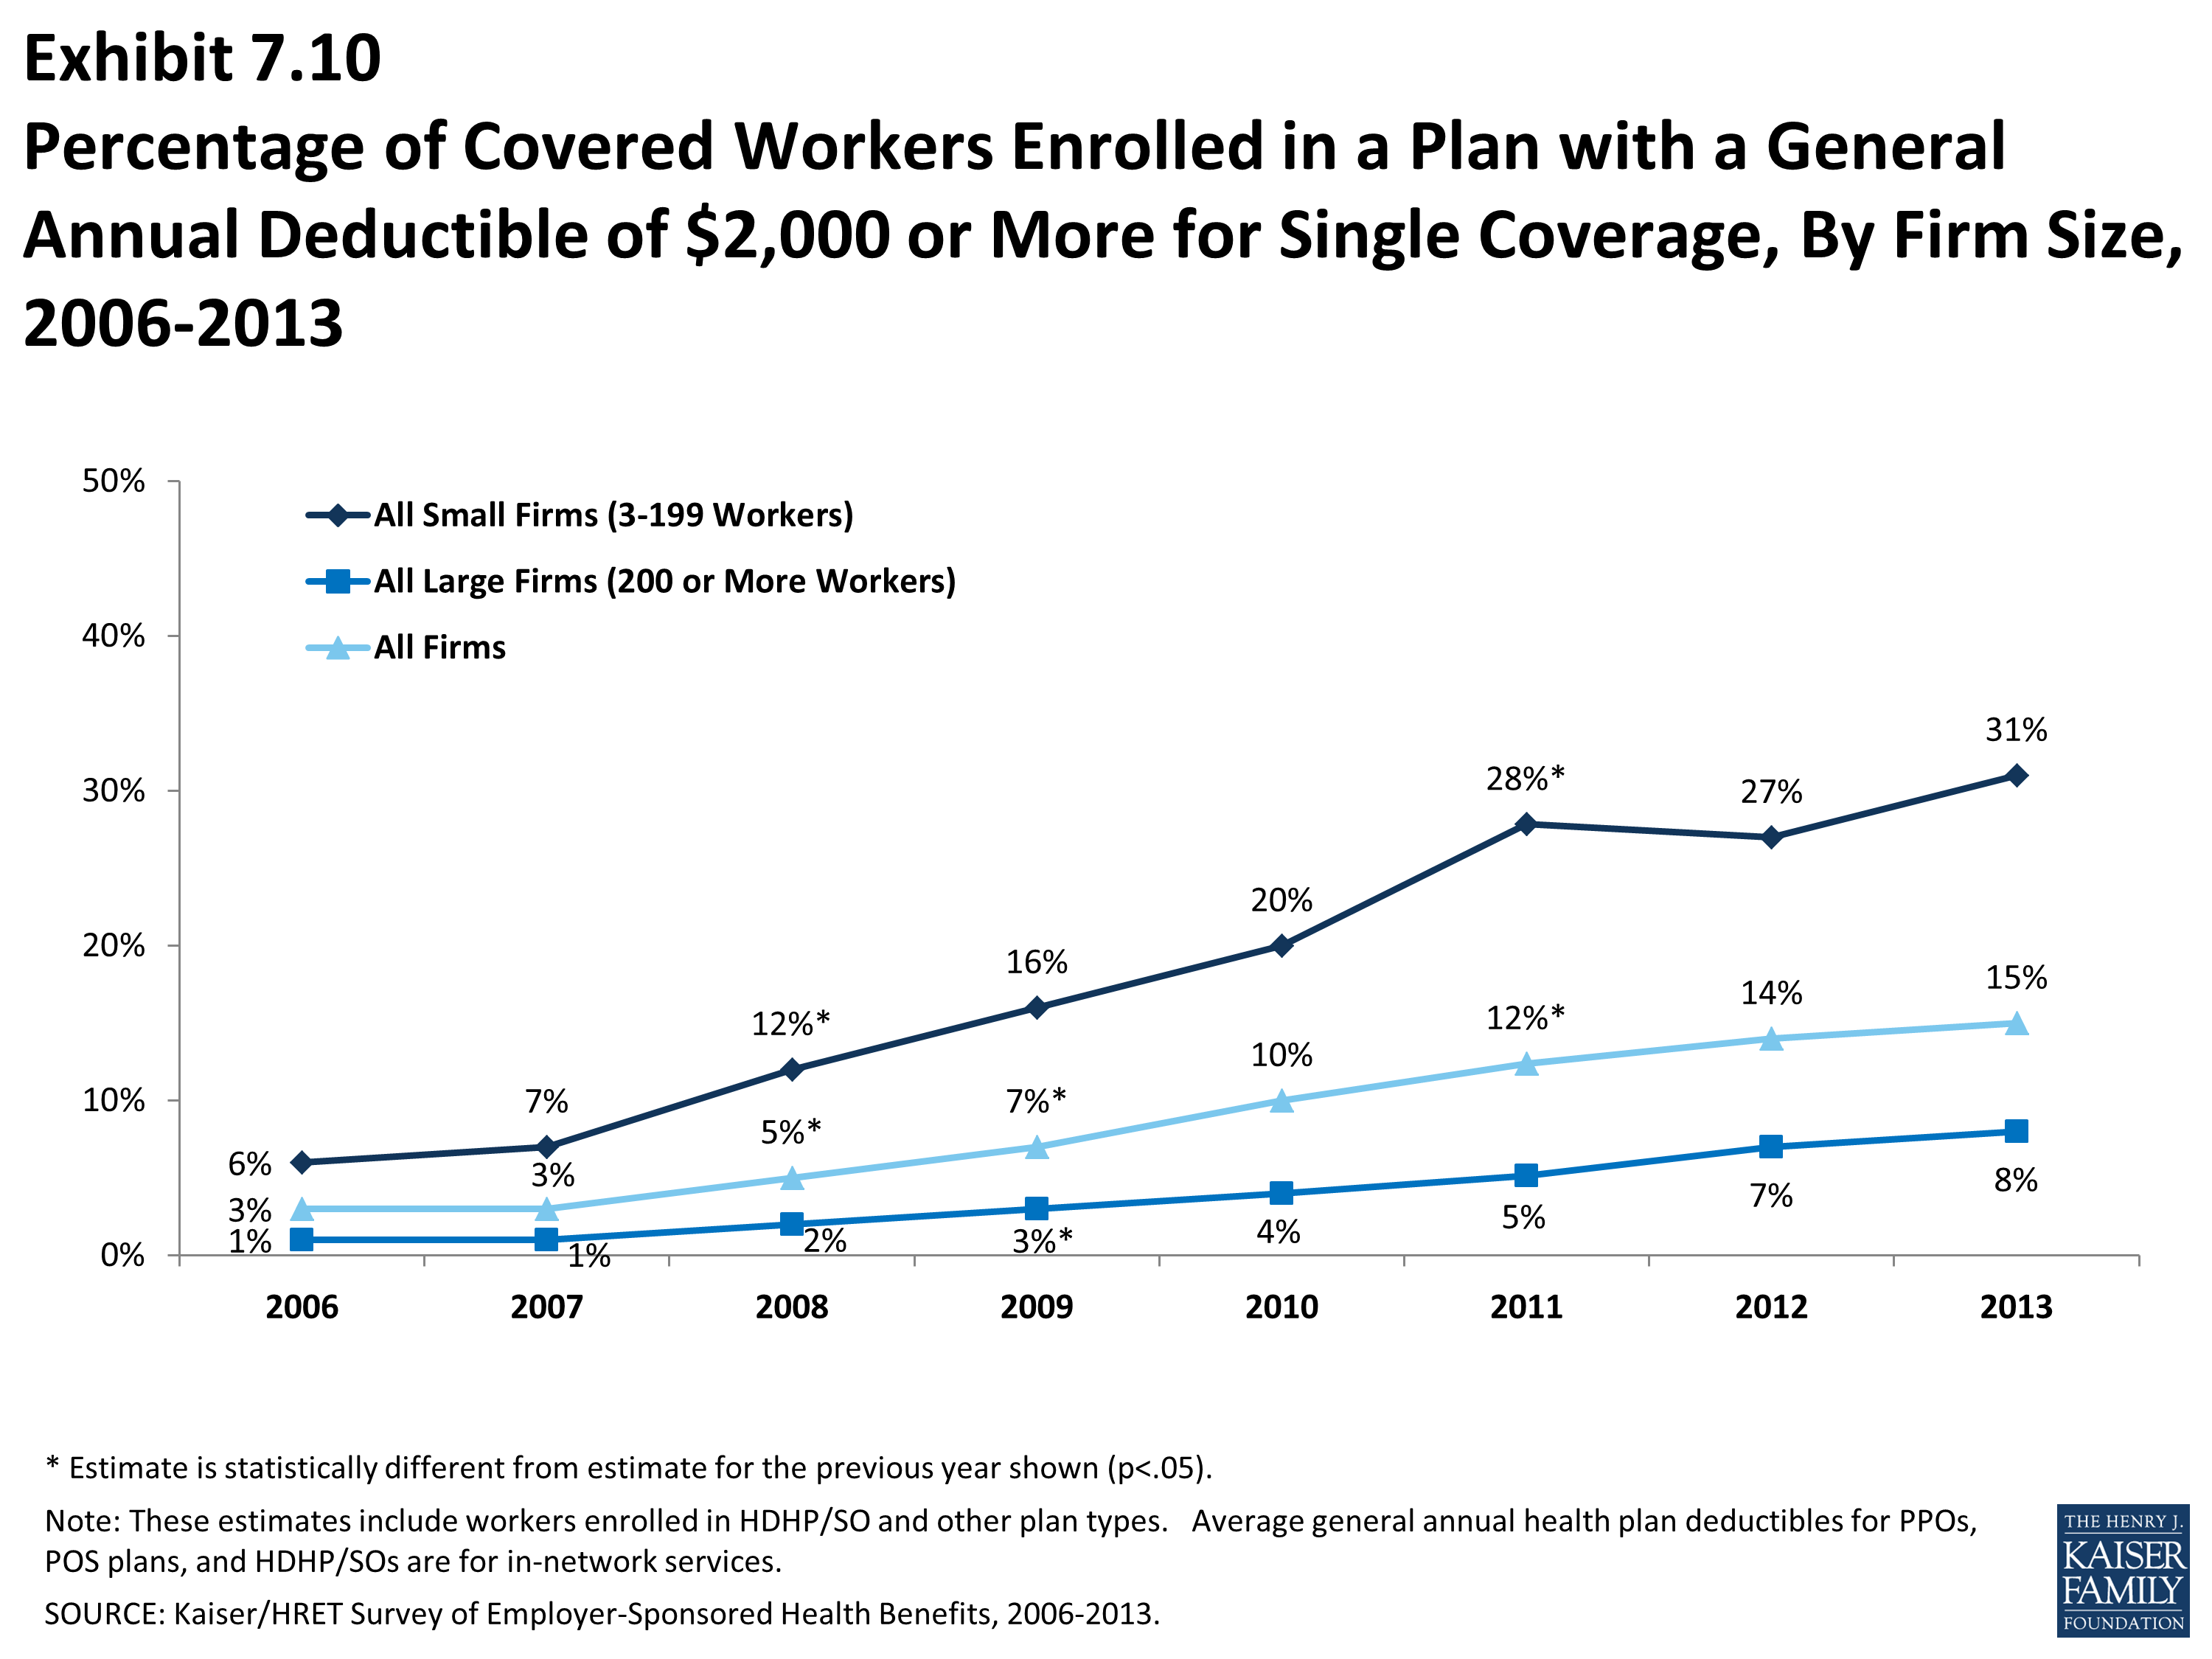
- Fifteen percent of covered workers are enrolled in a plan with a deductible of $2,000 or more. Thirty-one percent of covered workers at small firms (3-199 workers) have a general annual deductible of $2,000 or more (Exhibit 7.8).
- The majority of covered workers with a deductible are in plans where the deductible does not have to be met before certain services, such as physician office visits or prescription drugs, are covered.
- Large majorities of covered workers (77% in HMOs, 78% in PPOs, and 72% in POS plans) with general plan deductibles are enrolled in plans where the deductible does not have to be met before physician office visits for primary care are covered (Exhibit 7.21).
- Similarly, among workers with a general annual deductible, large shares of covered workers in HMOs (95%), PPOs (91%), and POS plans (87%) are enrolled in plans where the general annual deductible does not have to be met before prescription drugs are covered (Exhibit 7.21).
Hospital and Outpatient Surgery Cost Sharing
- In order to better capture the prevalence of combinations of cost sharing for inpatient hospital stays and outpatient surgery, the survey was changed to ask a series of yes or no questions beginning in 2009. The new format allowed respondents to indicate more than one type of cost sharing for these services, if applicable. Previously, the questions asked respondents to select just one response from a list of types of cost sharing, such as separate deductibles, copayments, coinsurance, and per diem payments (for hospitalization only). Due to the change in question format, the distribution of workers with types of cost sharing does not equal 100% as workers may face a combination of types of cost sharing. In addition, the average copayment and coinsurance rates for hospital admissions include workers who may have a combination of these types of cost sharing.
- Whether or not a worker has a general annual deductible, most workers face additional types of cost sharing when admitted to a hospital or having outpatient surgery (such as a copayment, coinsurance, or a per diem charge).
- For hospital admissions, 61% of covered workers have coinsurance and 16% have copayments. Lower percentages of workers have per day (per diem) payments (7%), a separate hospital deductible (3%), or both copayments and coinsurance (8%), while 17% have no additional cost sharing for hospital admissions after any general annual deductible has been met (Exhibit 7.22). For covered workers in HMO plans, copayments are more common (37%) and coinsurance (26%) is less common than in other plan types.
- The percent of covered workers in a plan which requires coinsurance for hospital admission has increased from 53% in 2010 to 61% in 2013.
- The average coinsurance rate is 18%; the average copayment is $278 per hospital admission; the average per diem charge is $264; and the average separate annual hospital deductible is $436 (Exhibit 7.24).
- The cost-sharing provisions for outpatient surgery are similar to those for hospital admissions, as most workers have coinsurance or copayments. Sixty-two percent of covered workers have coinsurance and 18% have copayments for an outpatient surgery episode. In addition, 2% have a separate annual deductible for outpatient surgery, and 5% have both copayments and coinsurance, while 19% have no additional cost sharing after any general annual deductible has been met (Exhibit 7.23).
- For covered workers with cost sharing, the average coinsurance is 18%, the average copayment is $140, and the average separate annual outpatient surgery deductible is $726 (Exhibit 7.24).
Cost Sharing for Physician Office Visits
- The majority of covered workers are enrolled in health plans that require cost sharing for an in-network physician office visit, in addition to any general annual deductible.2
- The most common form of physician office visit cost sharing for in-network services is copayments. Seventy-four percent of covered workers have a copayment for a primary care physician office visit and 20% have coinsurance. For office visits with a specialty physician, 72% of covered workers have copayments and 20% have coinsurance. Workers in HMOs, PPOs, and POS plans are much more likely to have copayments than workers in HDHP/SOs for both primary care and specialty care physician office visits. For example, the majority of workers in HDHP/SOs have coinsurance (55%) or no cost sharing after the general annual plan deductible is met (22%) for primary care physician office visits (Exhibit 7.25).
- Among covered workers with a copayment for in-network physician office visits, the average copayment is $23 for primary care and $35 for specialty physicians (Exhibit 7.26), similar to $23 and $33 reported in 2012.
- Among workers with coinsurance for in-network physician office visits, the average coinsurance rates are 18% for a visit with a primary care physician and 19% for a visit with a specialist (Exhibit 7.26).
Out-Of-Pocket Maximum Amounts
- Most covered workers are in a plan that partially or totally limits the cost sharing that a plan enrollee must pay in a year. These limits are generally referred to as out-of-pocket maximum amounts. Enrollee cost sharing, such as deductibles, office visit cost sharing, or spending on prescription drugs, may or may not apply to the out-of-pocket maximum. Therefore, the survey asks what types of out-of-pocket expenses count when determining whether a covered worker has met the plan out-of-pocket maximum. When a plan does not count certain types of spending, it effectively increases the amount a worker may pay out-of-pocket.
- Twelve percent of covered workers are in a plan that does not limit the amount of cost sharing enrollees have to pay for either single or family coverage (Exhibit 7.31).
- Covered workers with single or family coverage in HMOs (25%) are more likely to be enrolled in a plan that does not limit the amount of cost sharing than workers in PPOs (11%) (Exhibit 7.31).
- Covered workers without an out-of-pocket maximum, however, may not have large cost-sharing responsibilities. For example, 76% of covered workers in HMOs with no out-of-pocket maximum for single coverage have no general annual deductible, only 2% have coinsurance for a hospital admission and less than 1% have coinsurance for outpatient surgery episodes.
- HSA-qualified HDHPs are required by law to have an out-of-pocket maximum of no more than $6,250 for single coverage and $12,500 for family coverage in 2013. HDHP/HRAs have no such requirement, and among workers enrolled in these plans, 9% have no out-of-pocket maximum for single or family coverage.
- For covered workers with out-of-pocket maximums, there is wide variation in spending limits.
- Twenty-nine percent of covered workers with an out-of-pocket maximum for single coverage have an out-of-pocket maximum of less than $2,000, while 12% have an out-of-pocket maximum of $5,000 or more (Exhibit 7.33). Covered workers with an out-of-pocket maximum in small firms (3 to 199 workers) are more likely than such workers in larger firms to be covered by a plan with an out-of-pocket maximum of $3,000 or more (52% vs. 39%).
- Like deductibles, some plans have an aggregate out-of-pocket maximum amount for family coverage that applies to cost sharing for all family members, while others have a per-person out-of-pocket maximum that limits the amount of cost sharing that the family must pay on behalf of each family member. Sixty-three percent of covered workers in a plan with an out-of-pocket maximum are in a plan with an aggregate limit (Exhibit 7.34).
- For covered workers with an aggregate out-of-pocket maximum for family coverage, 29% have an out-of-pocket maximum of less than $4,000 and 24% have an out-of-pocket maximum of $8,000 or more (Exhibit 7.35). Among workers with separate per-person out-of-pocket limits for family coverage, 85% have out-of-pocket maximums of less than $4,000 (Exhibit 7.36).
- As noted above, covered workers with an out-of-pocket maximum may be enrolled in a plan where not all spending counts toward the out-of-pocket maximum, potentially exposing workers to higher out-of-pocket spending.
- Among workers enrolled in PPO plans with an out-of-pocket maximum for single or family coverage, 34% are in plans that do not count spending for the general annual plan deductible toward the out-of-pocket limit (Exhibit 7.32).
- It is more common for covered workers to be in plans that do not count prescription drug cost sharing toward the out-of-pocket limit. Eighty-four percent of workers enrolled in PPO plans and 71% enrolled in HMO plans with an out-of-pocket maximum for single or family coverage are in plans that do not count prescription drug spending towards the out-of-pocket maximum (Exhibit 7.32). The ACA will require that all non-grandfathered plans have an out-of-pocket maximum that counts all cost sharing towards the limit.
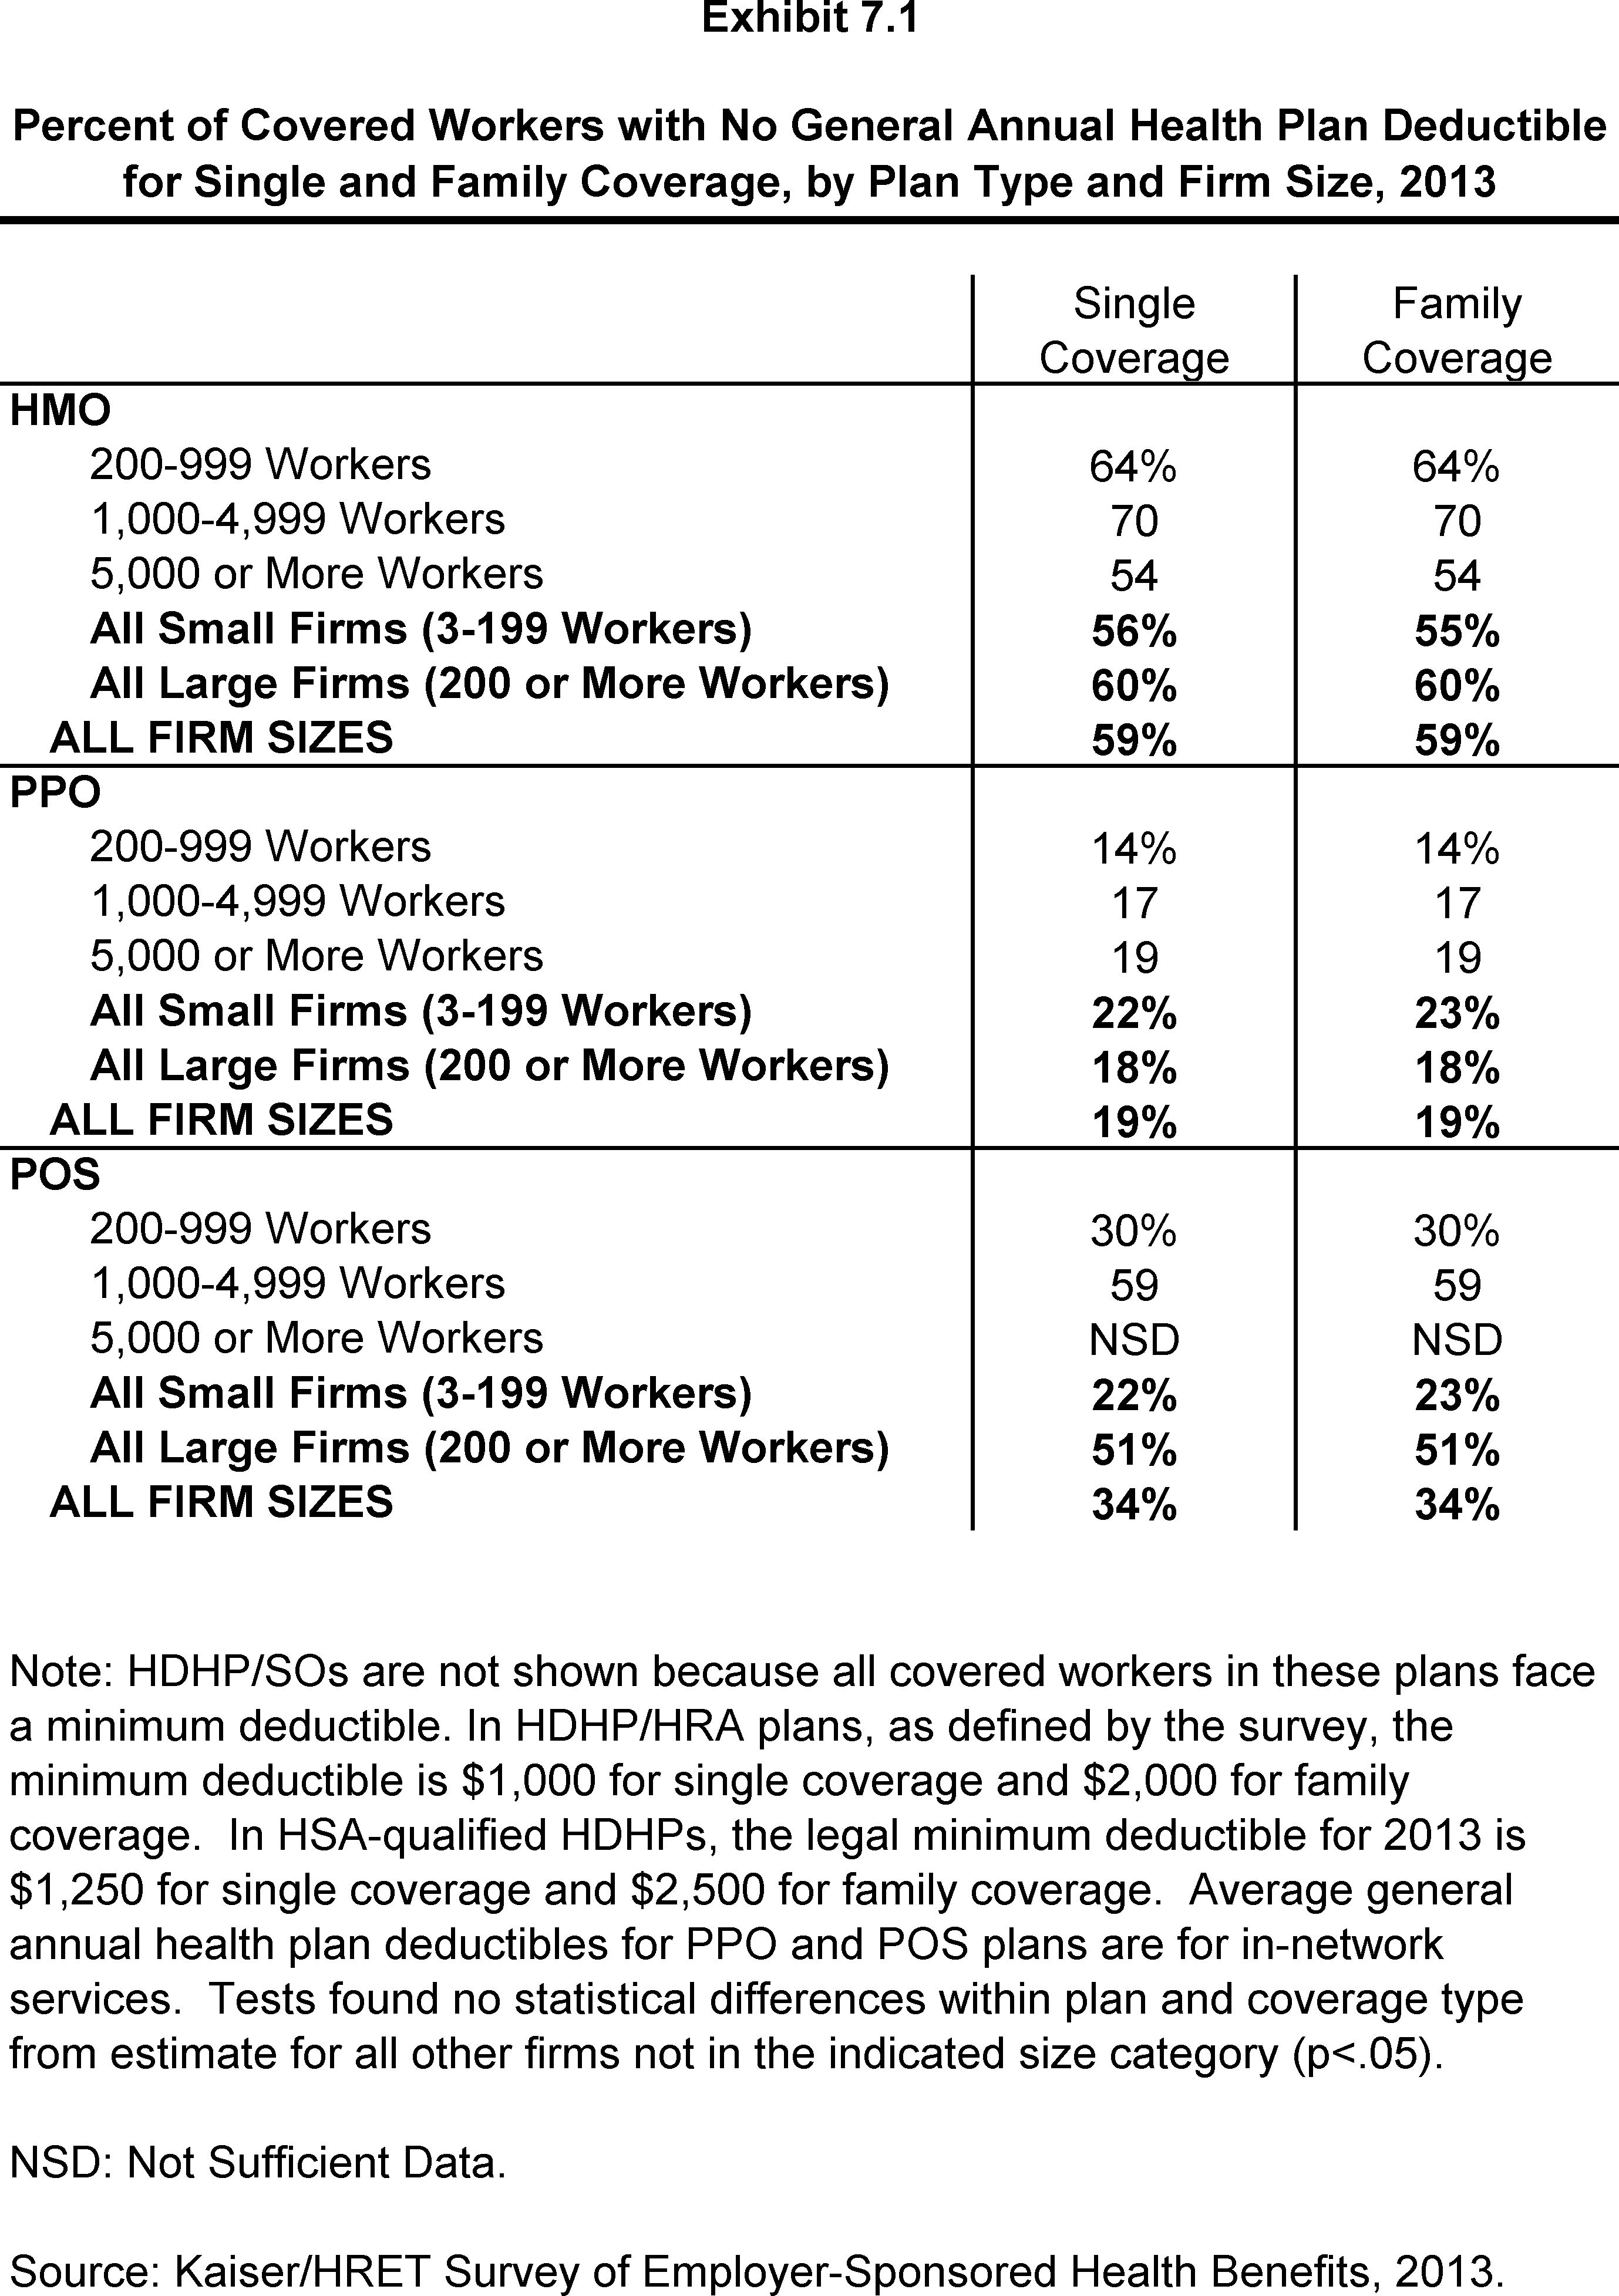
Percent of Covered Workers with No General Annual Health Plan Deductible for Single and Family Coverage, by Plan Type and Firm Size, 2013
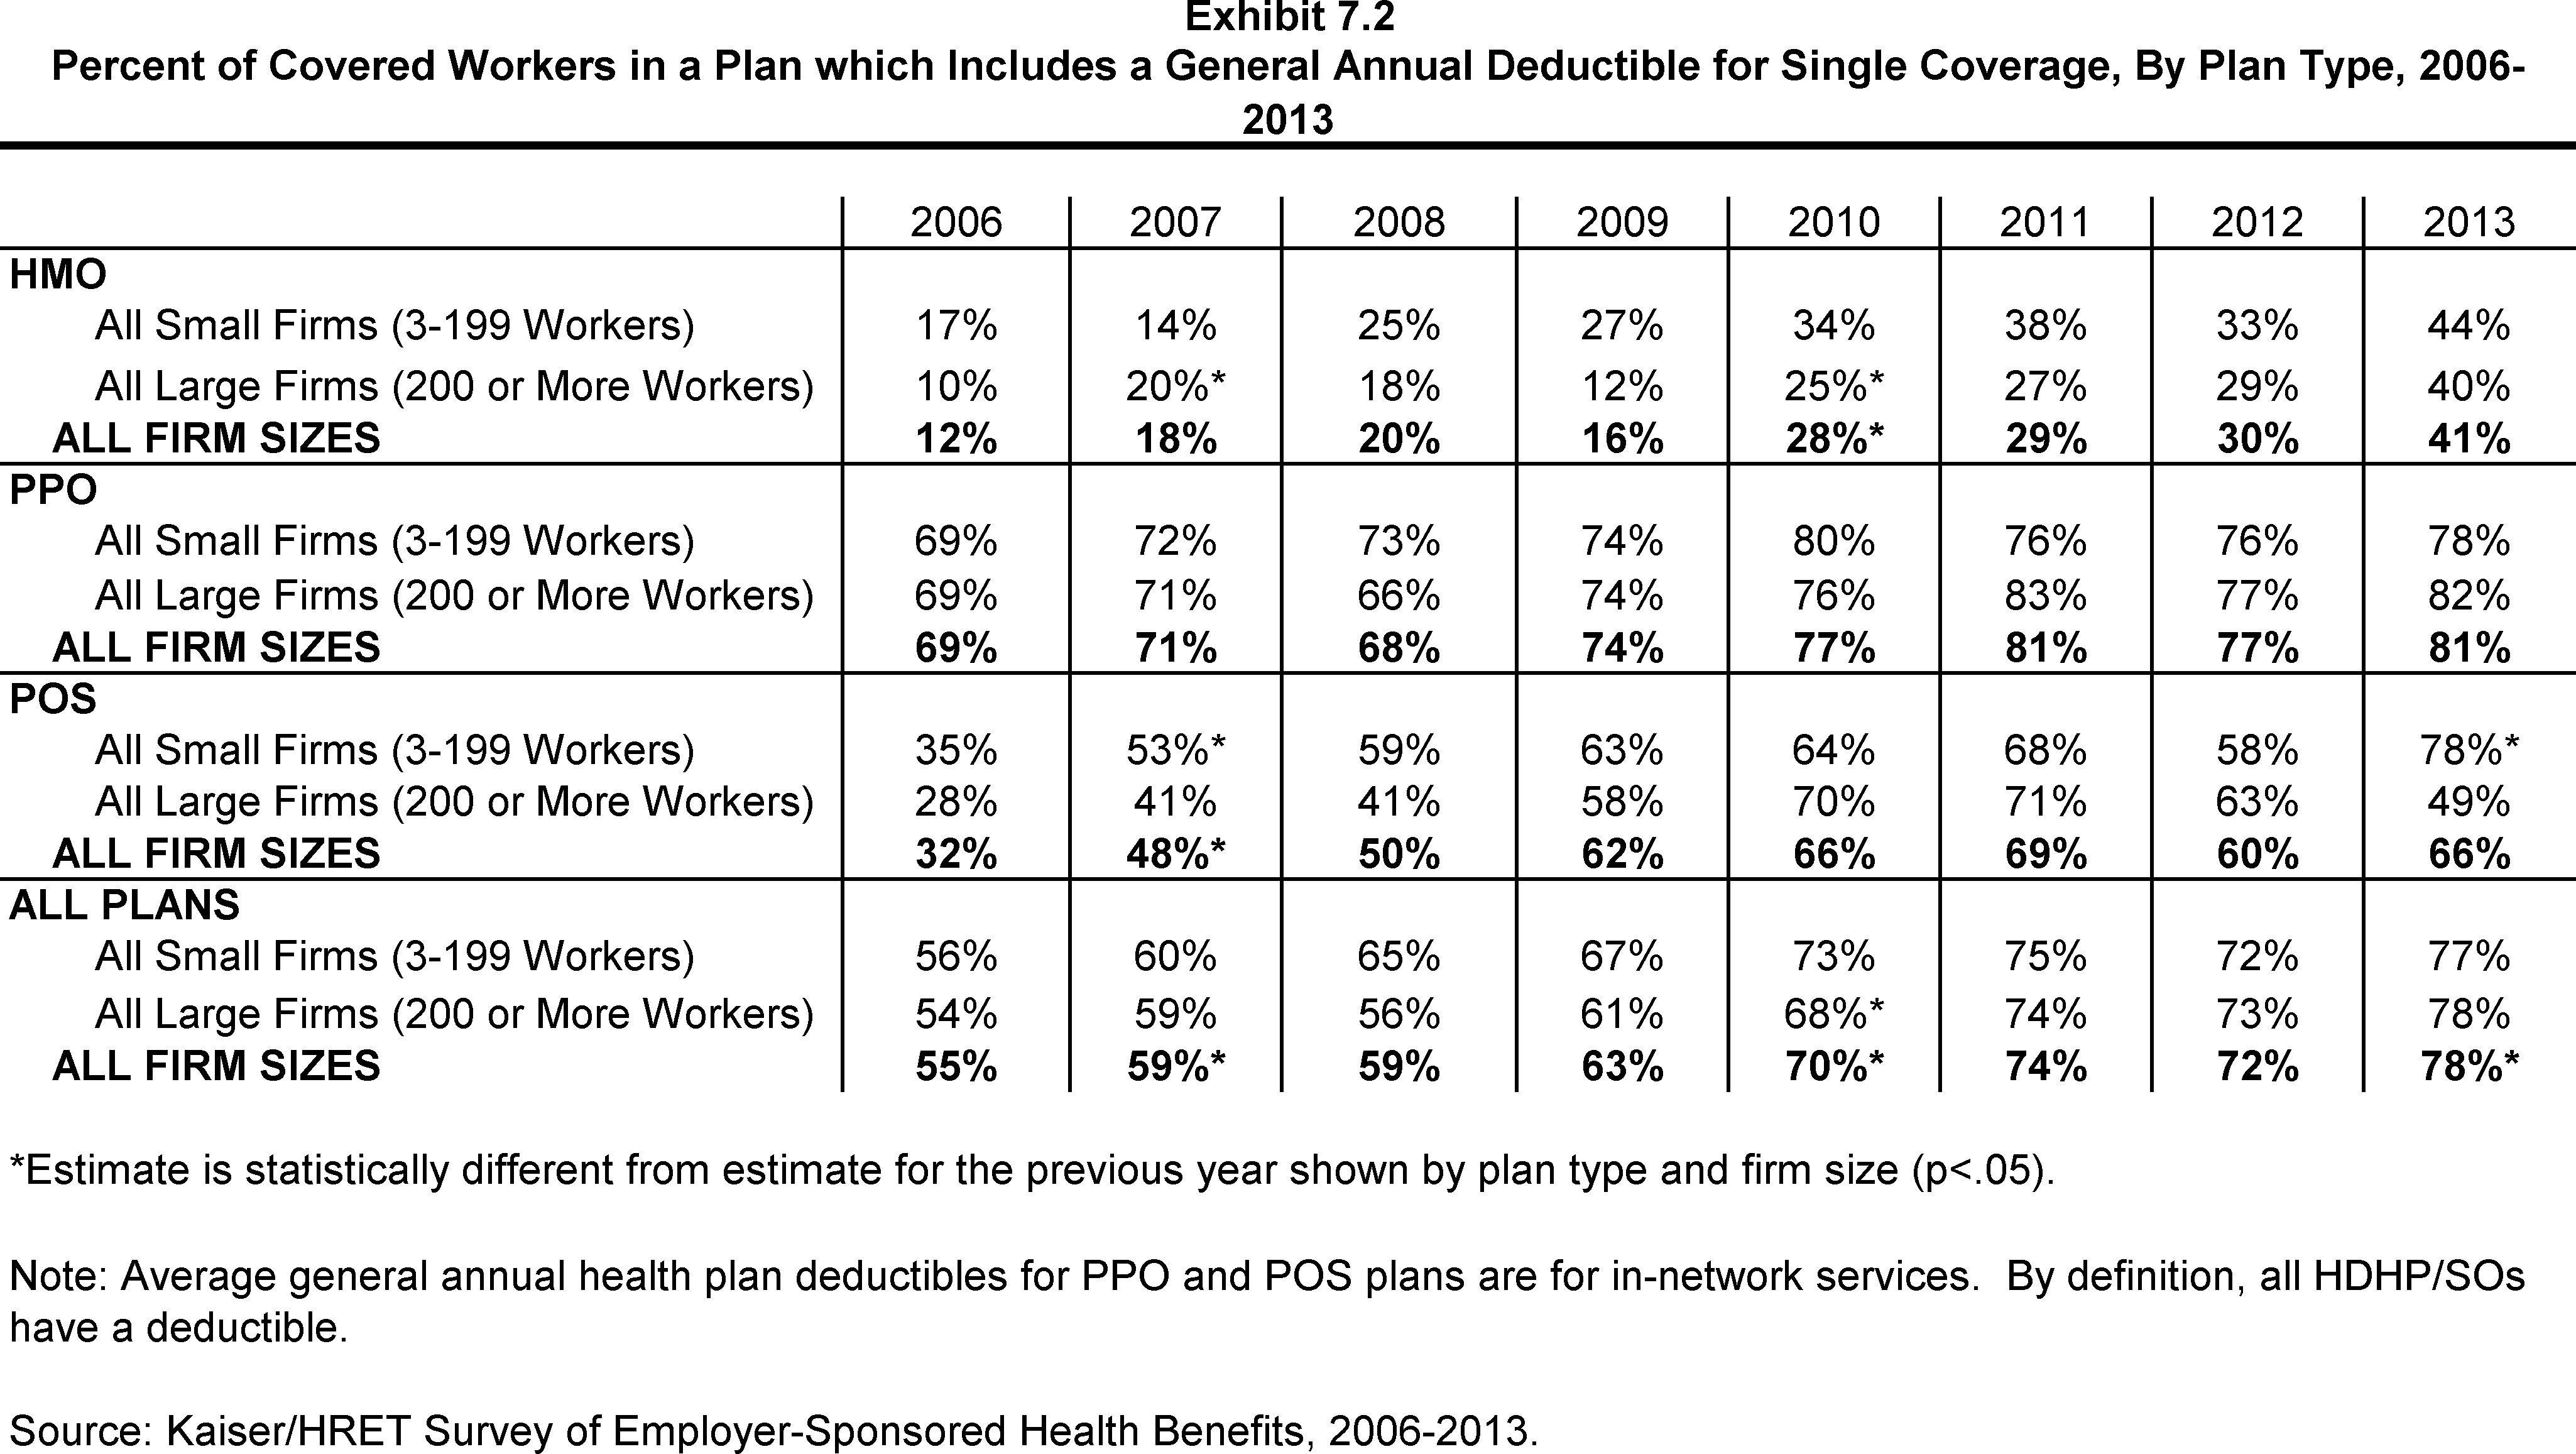
Percent of Covered Workers in a Plan which Includes a General Annual Deductible for Single Coverage, By Plan Type, 2006-2013
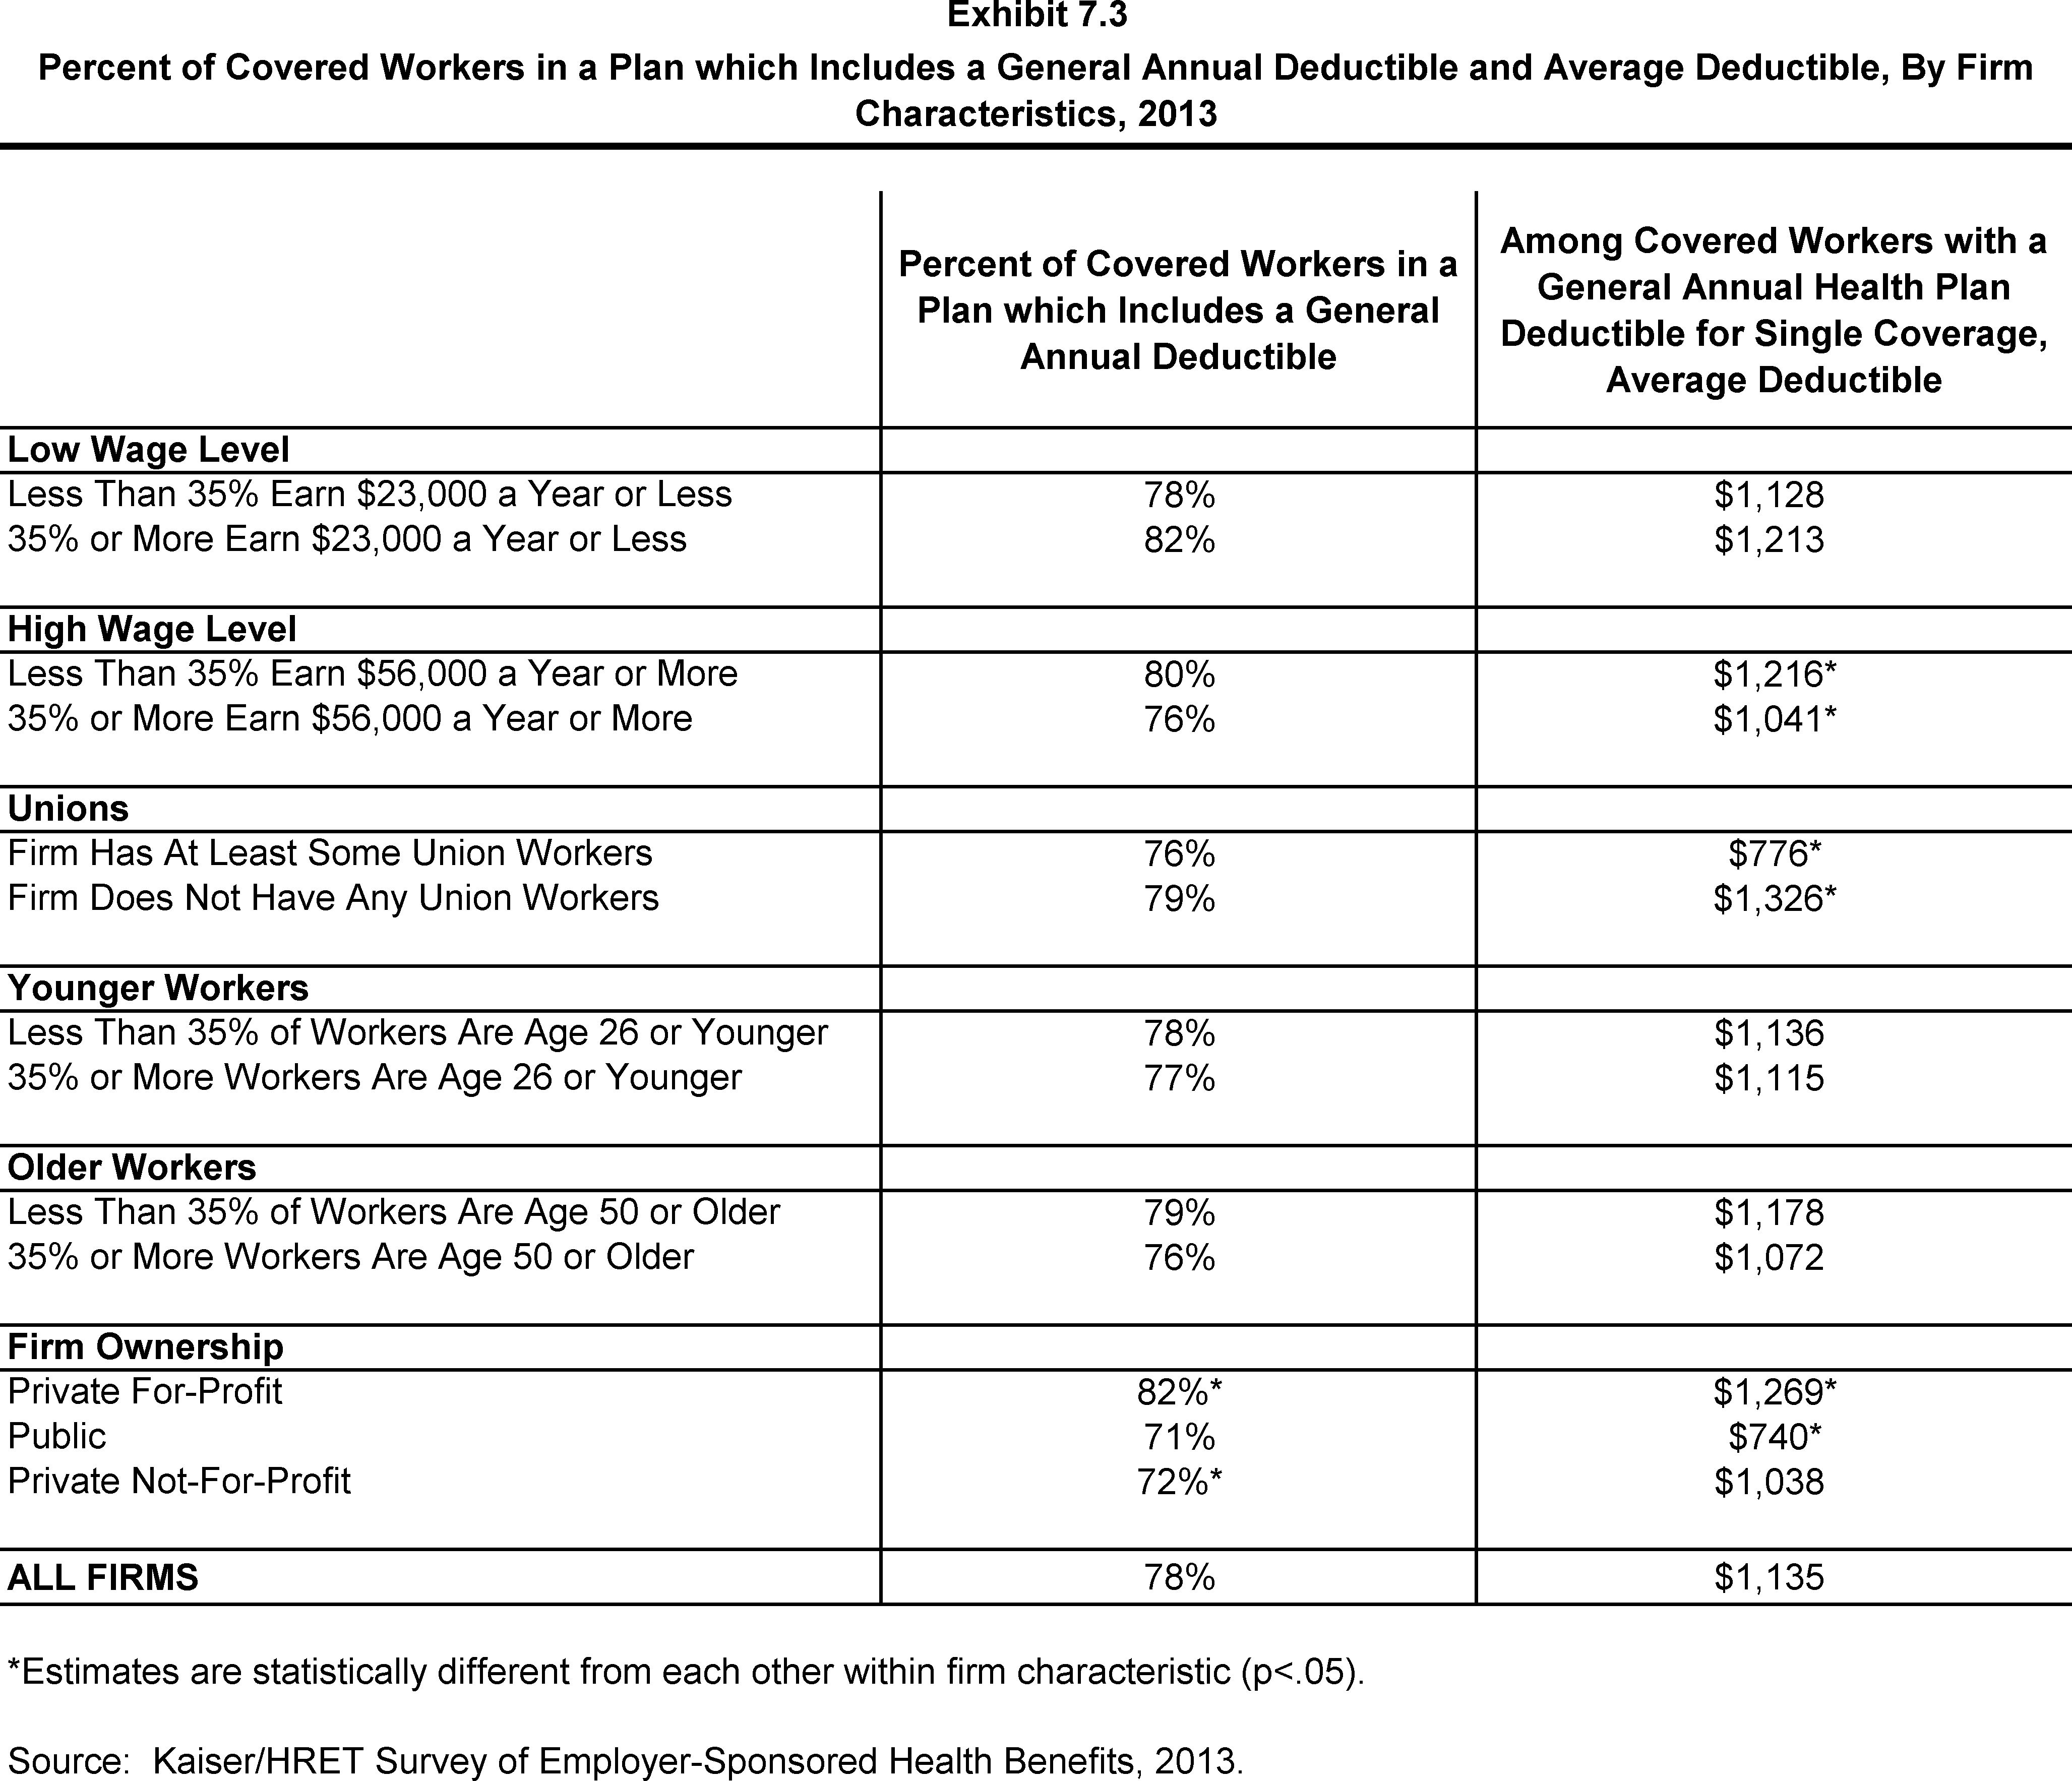
Percent of Covered Workers in a Plan which Includes a General Annual Deductible and Average Deductible, By Firm Characteristics, 2013
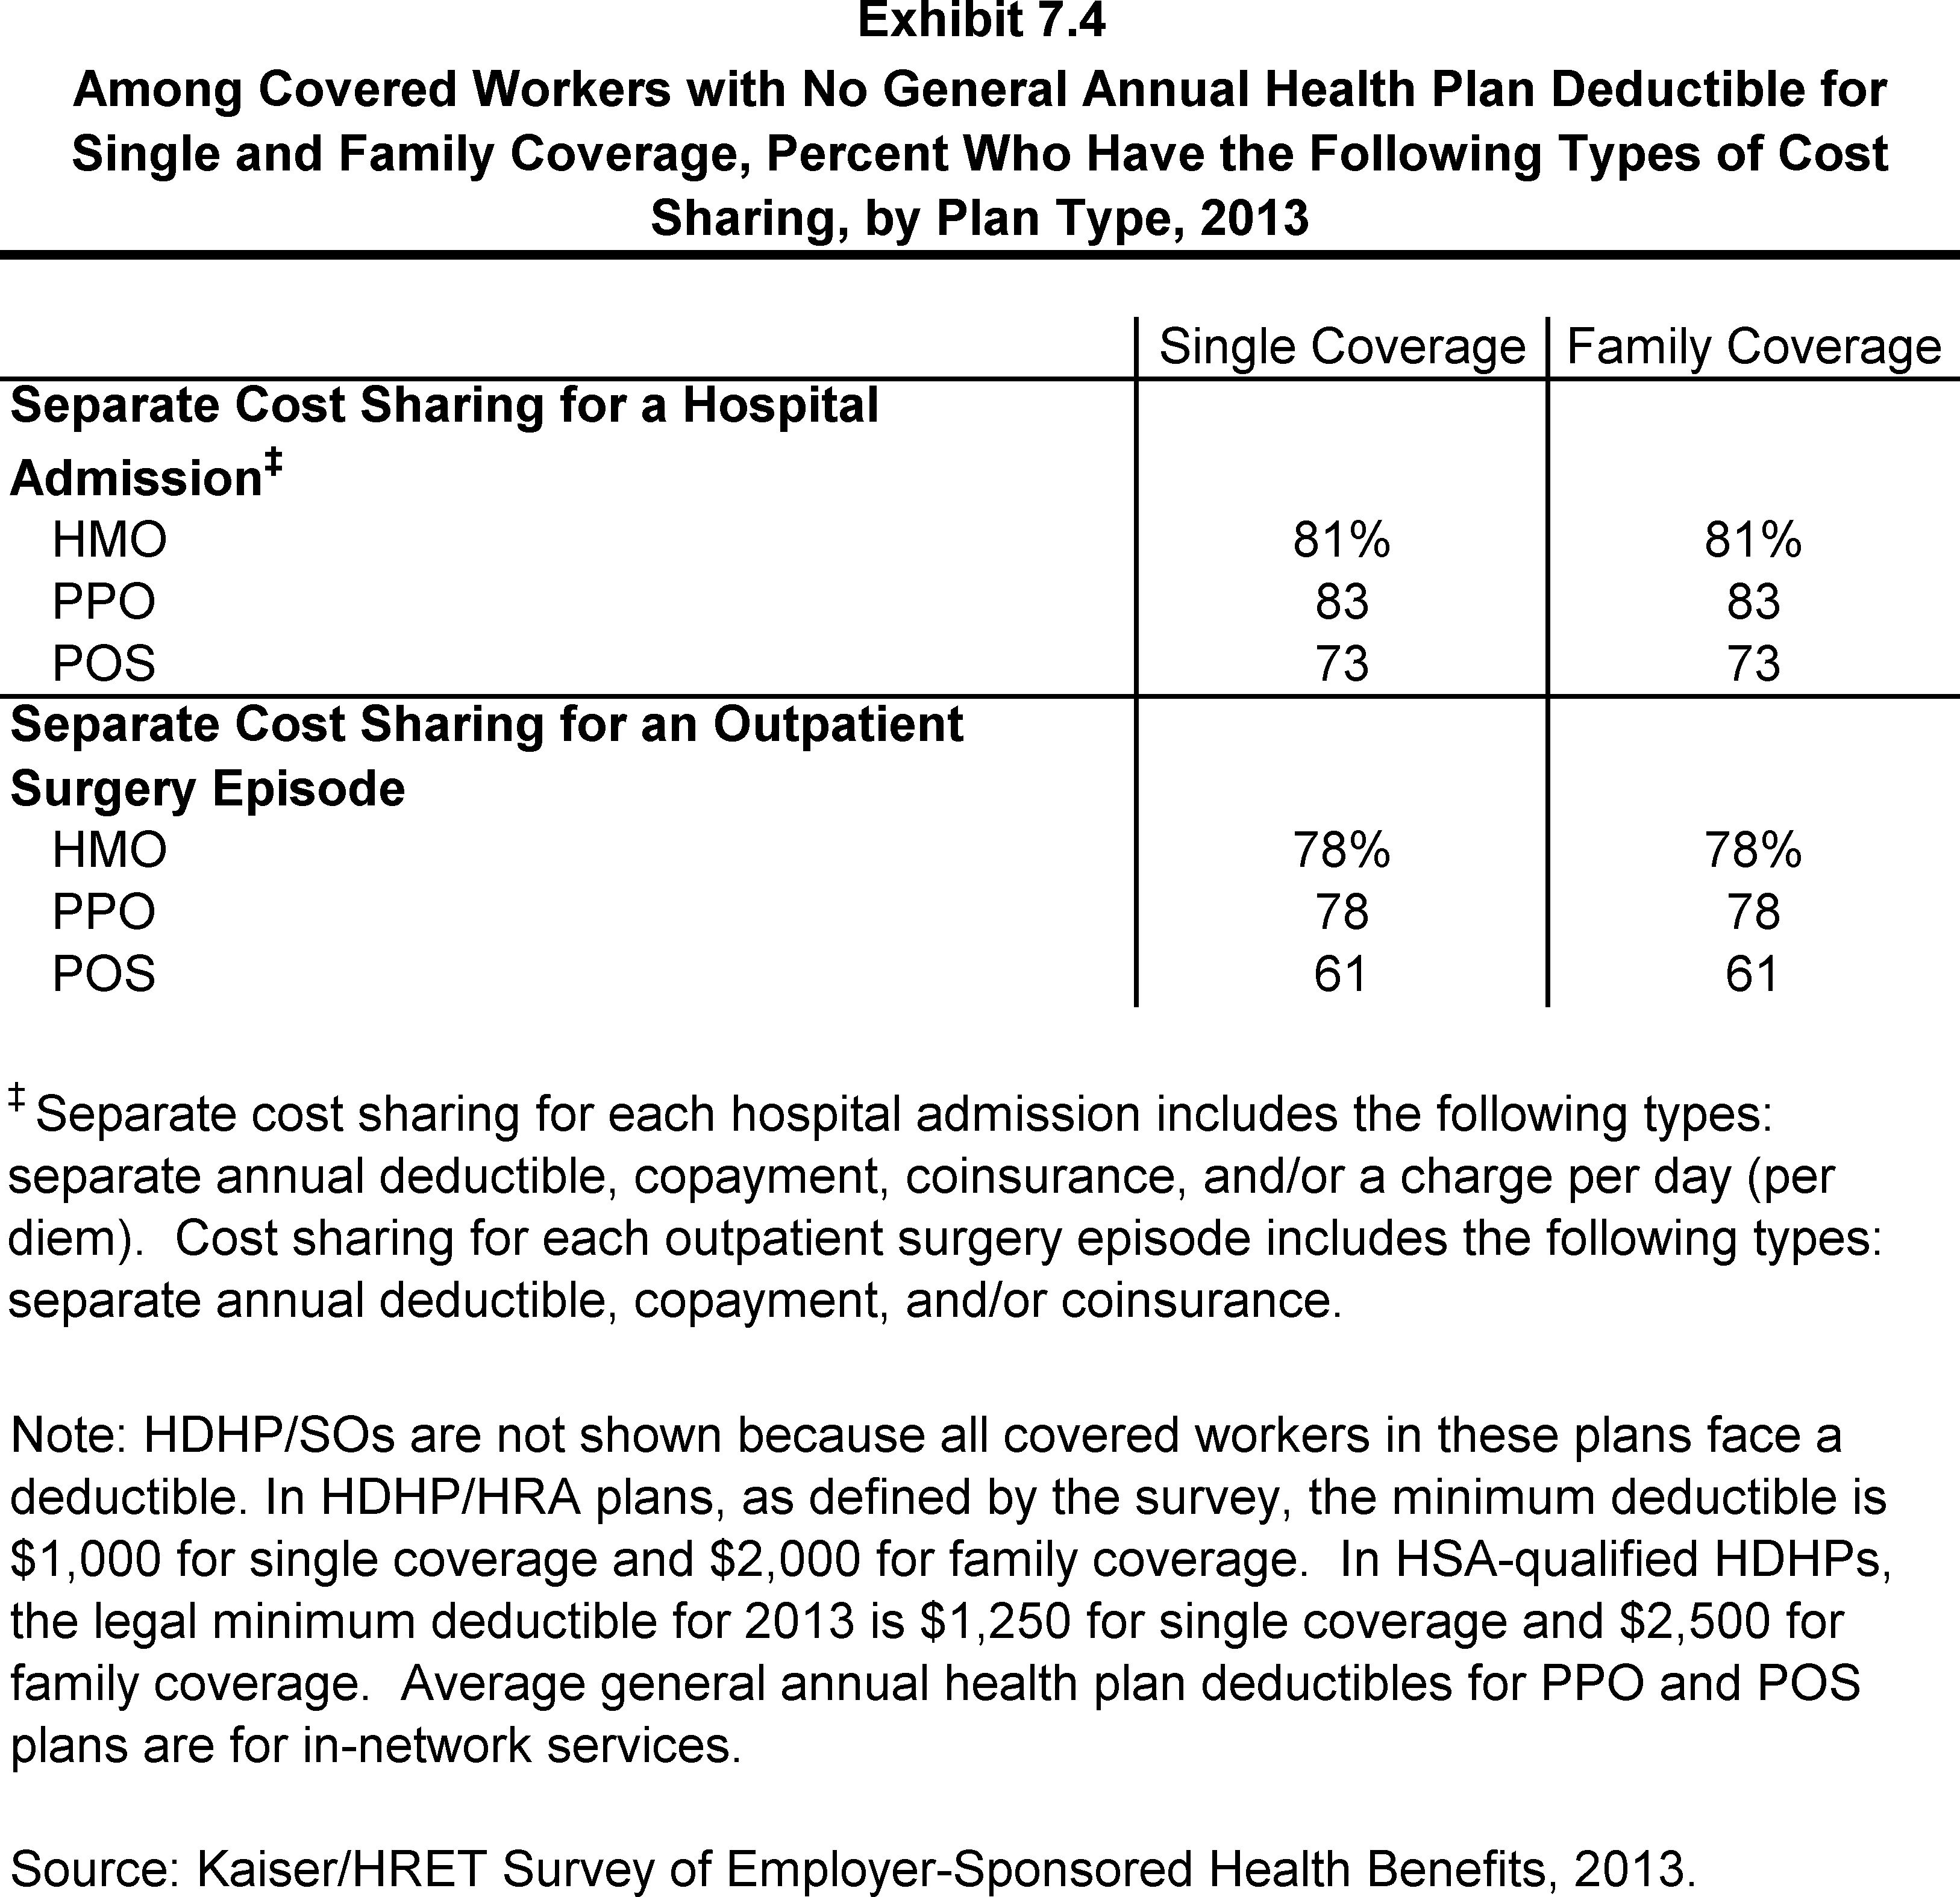
Among Covered Workers with No General Annual Health Plan Deductible for Single and Family Coverage, Percent Who Have the Following Types of Cost Sharing, by Plan Type, 2013
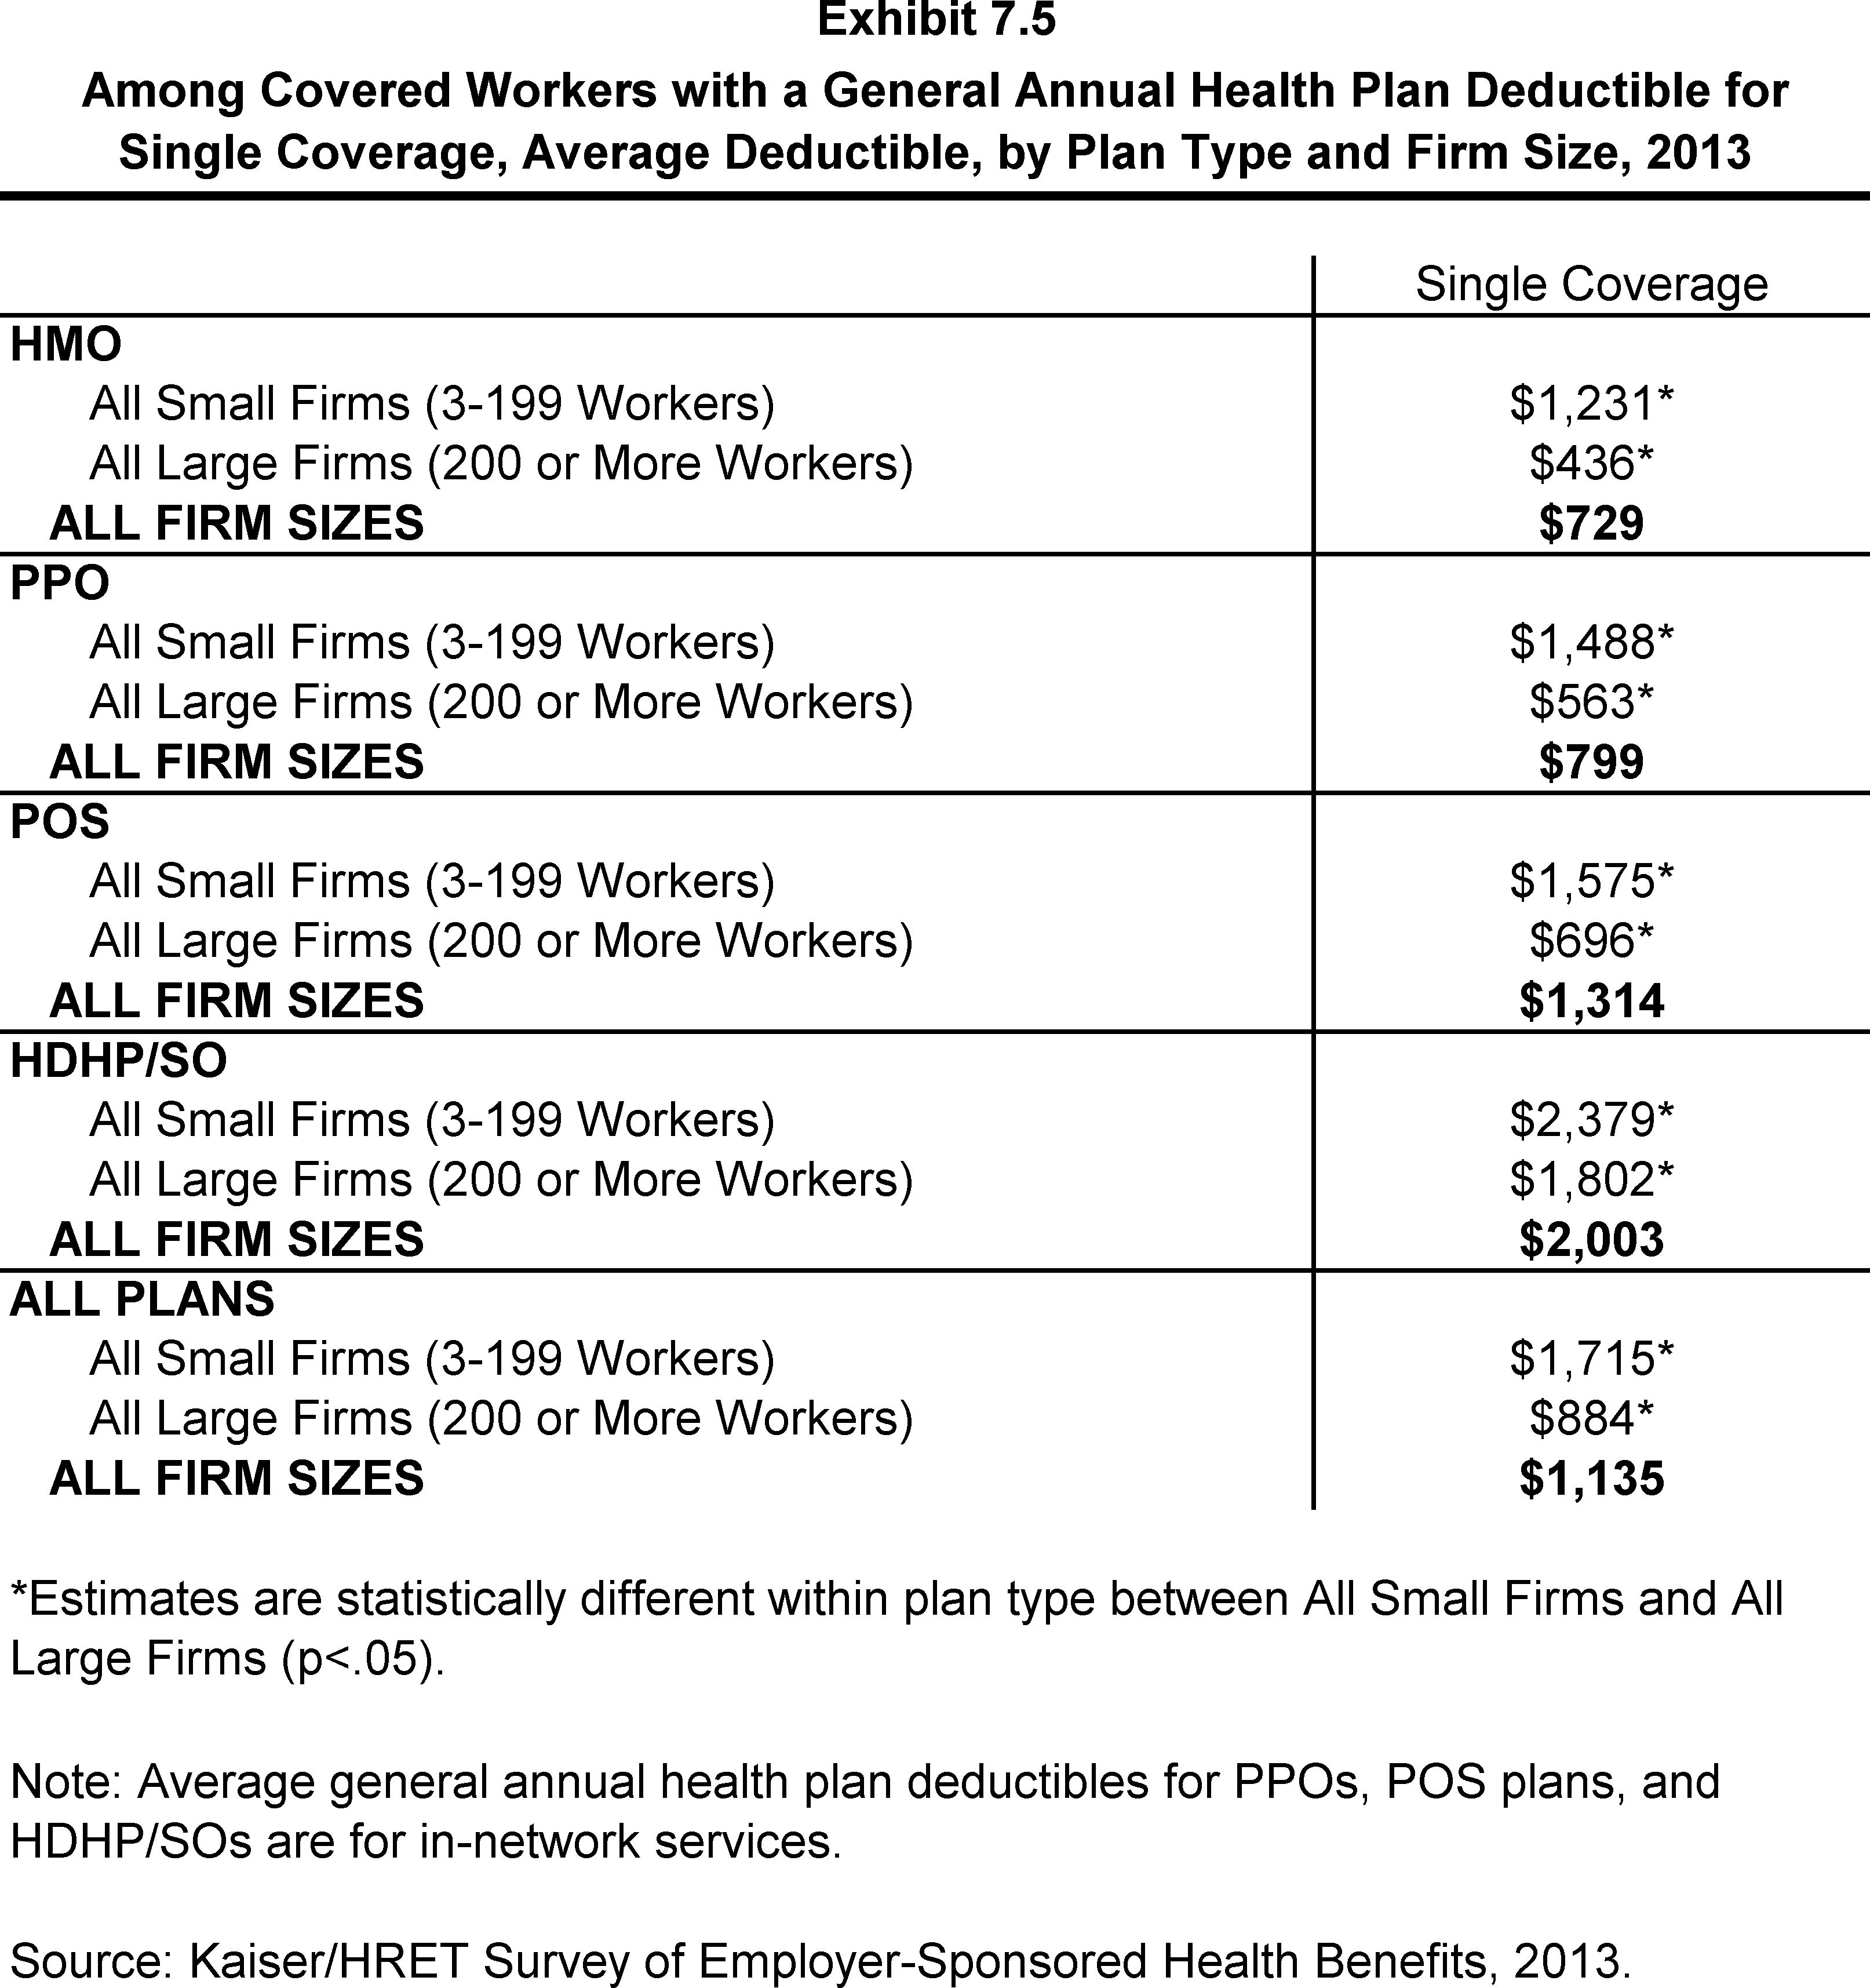
Among Covered Workers with a General Annual Health Plan Deductible for Single Coverage, Average Deductible, by Plan Type and Firm Size, 2013
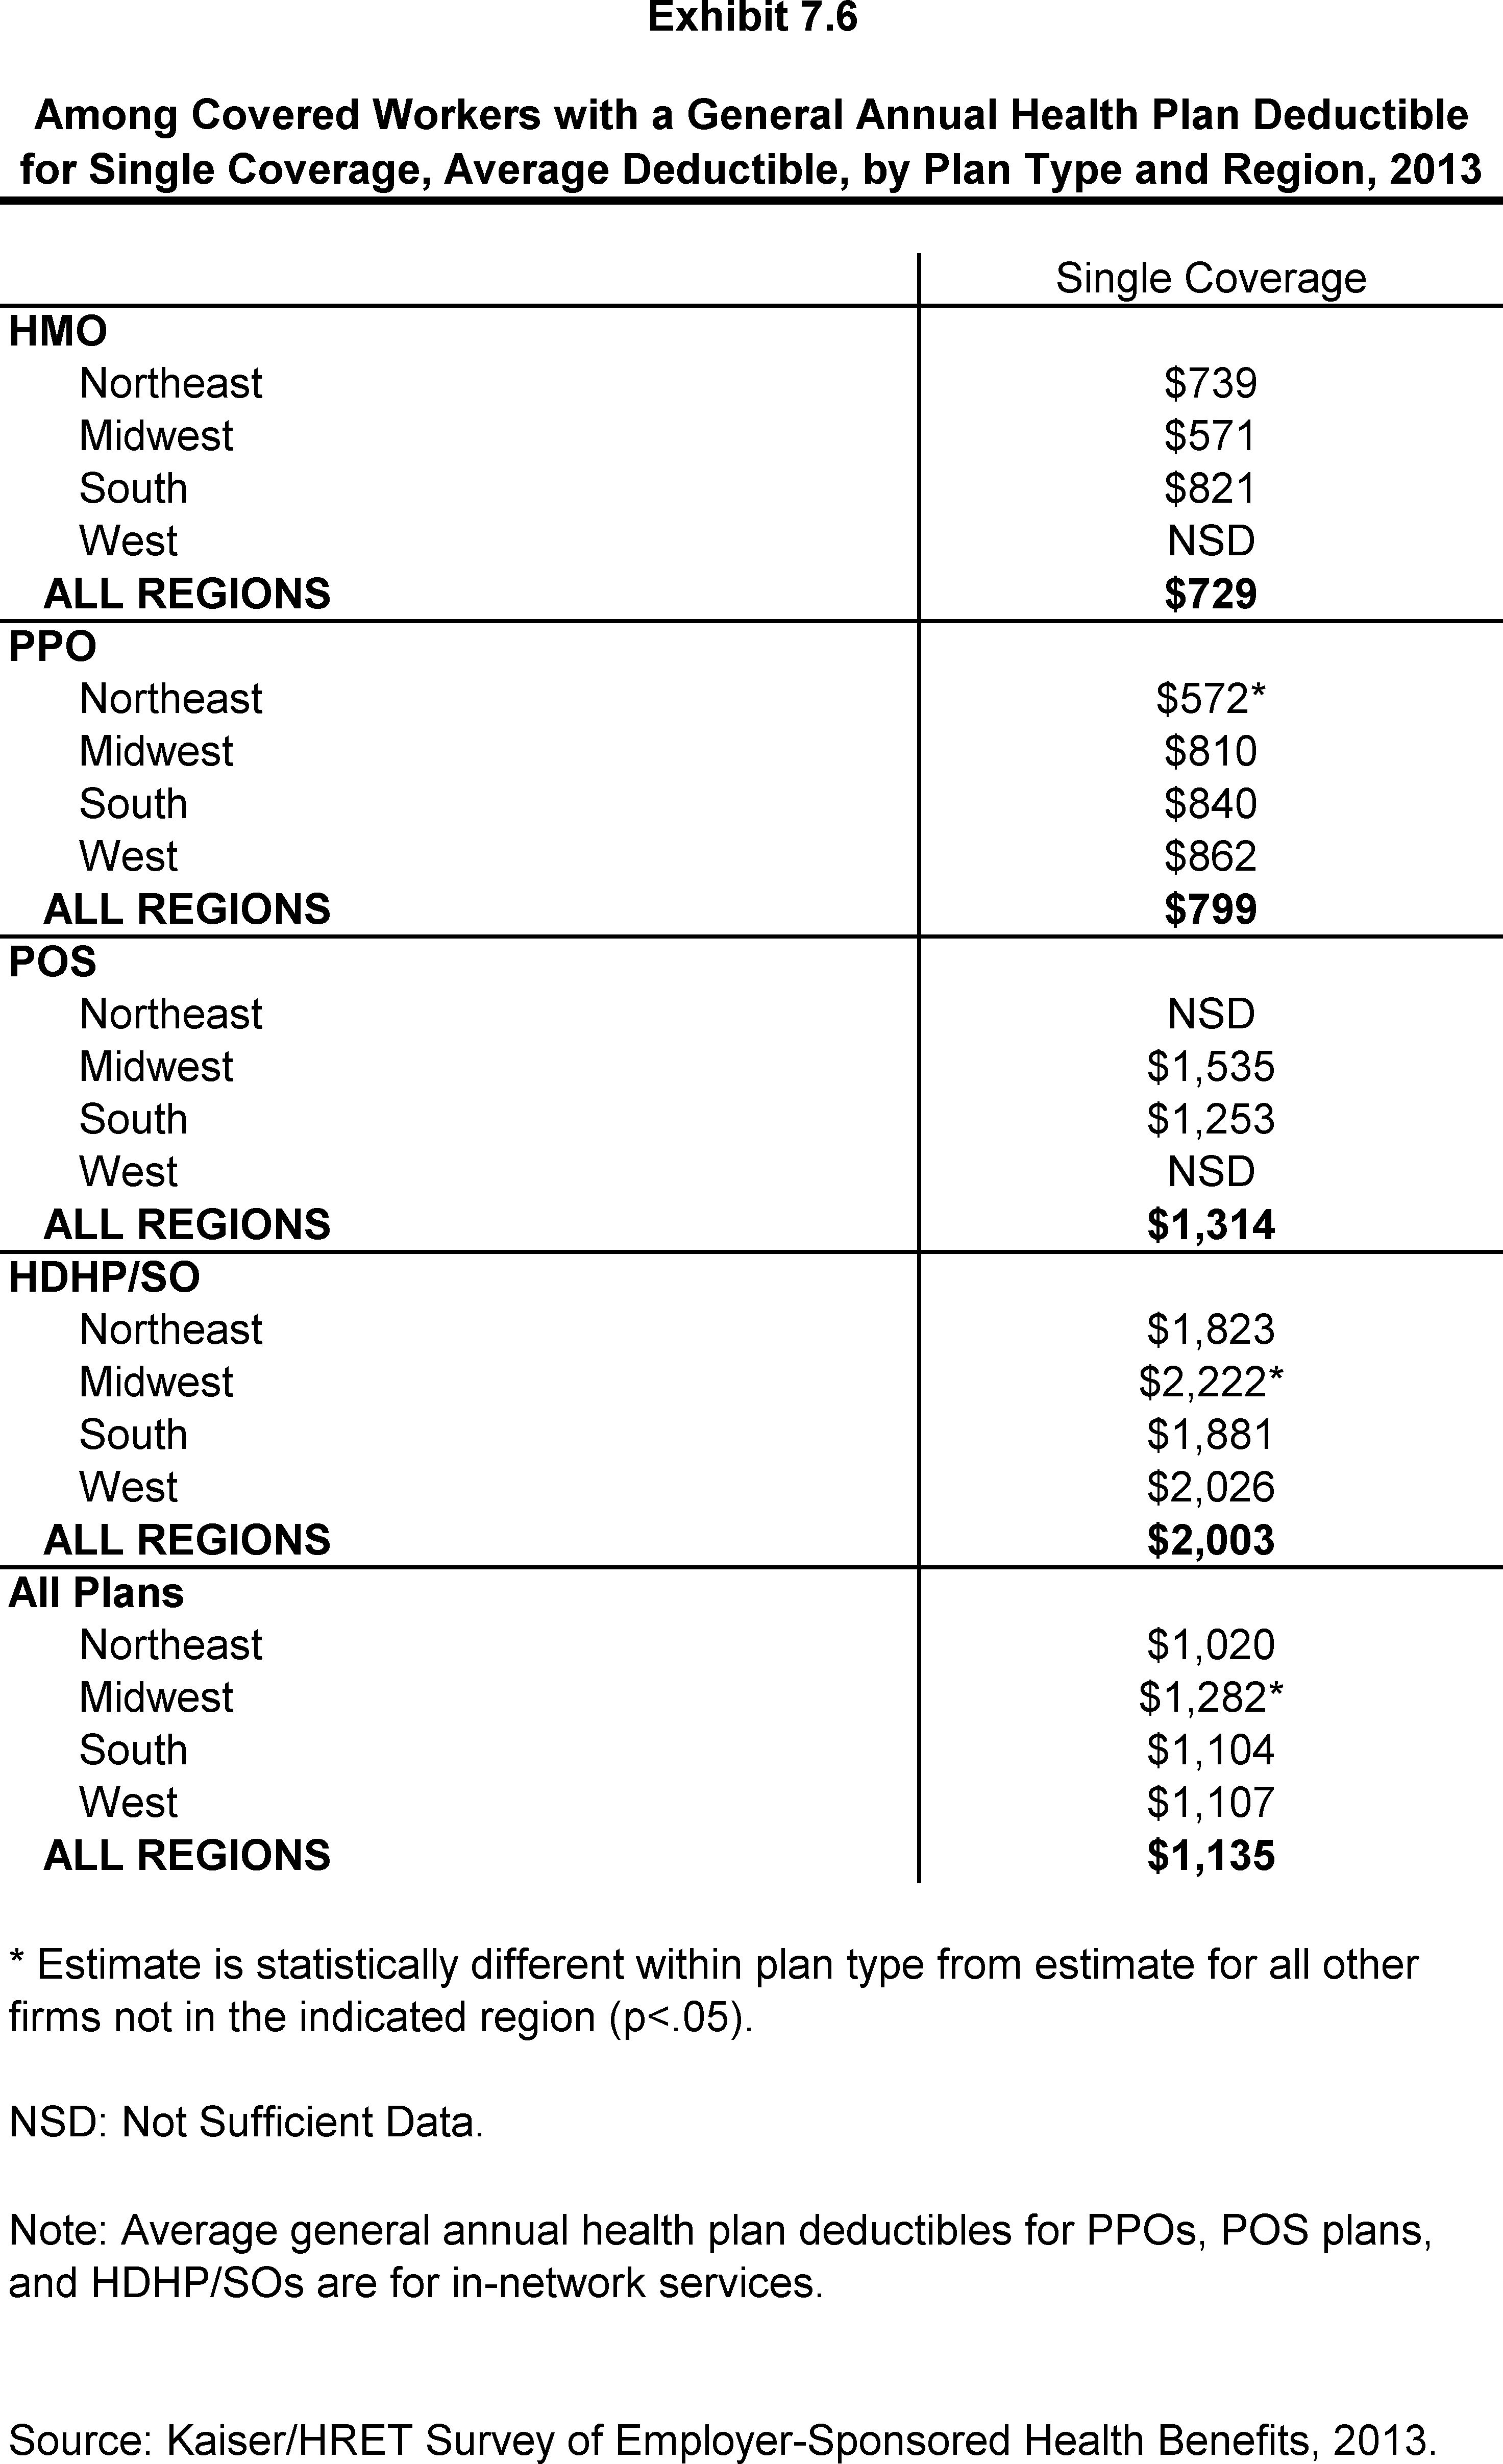
Among Covered Workers with a General Annual Health Plan Deductible for Single Coverage, Average Deductible, by Plan Type and Region, 2013
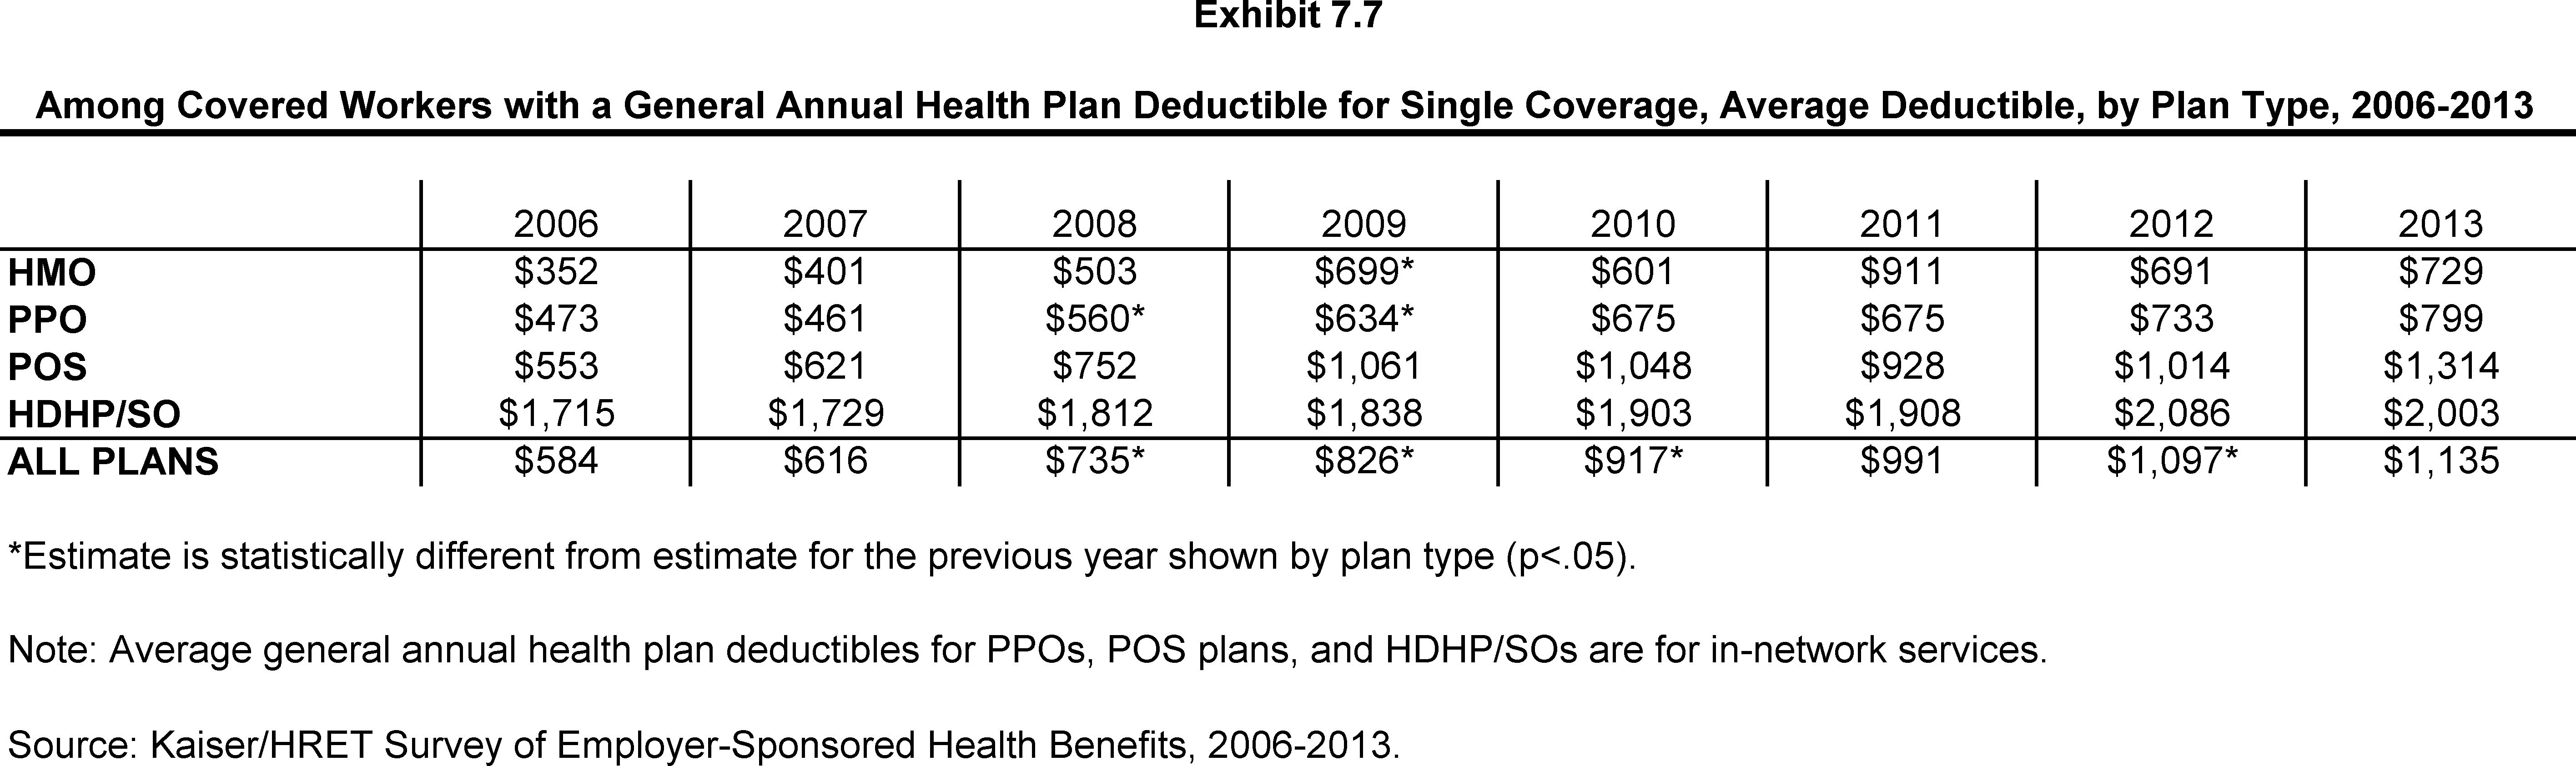
Among Covered Workers with a General Annual Health Plan Deductible for Single Coverage, Average Deductible, by Plan Type, 2006-2013
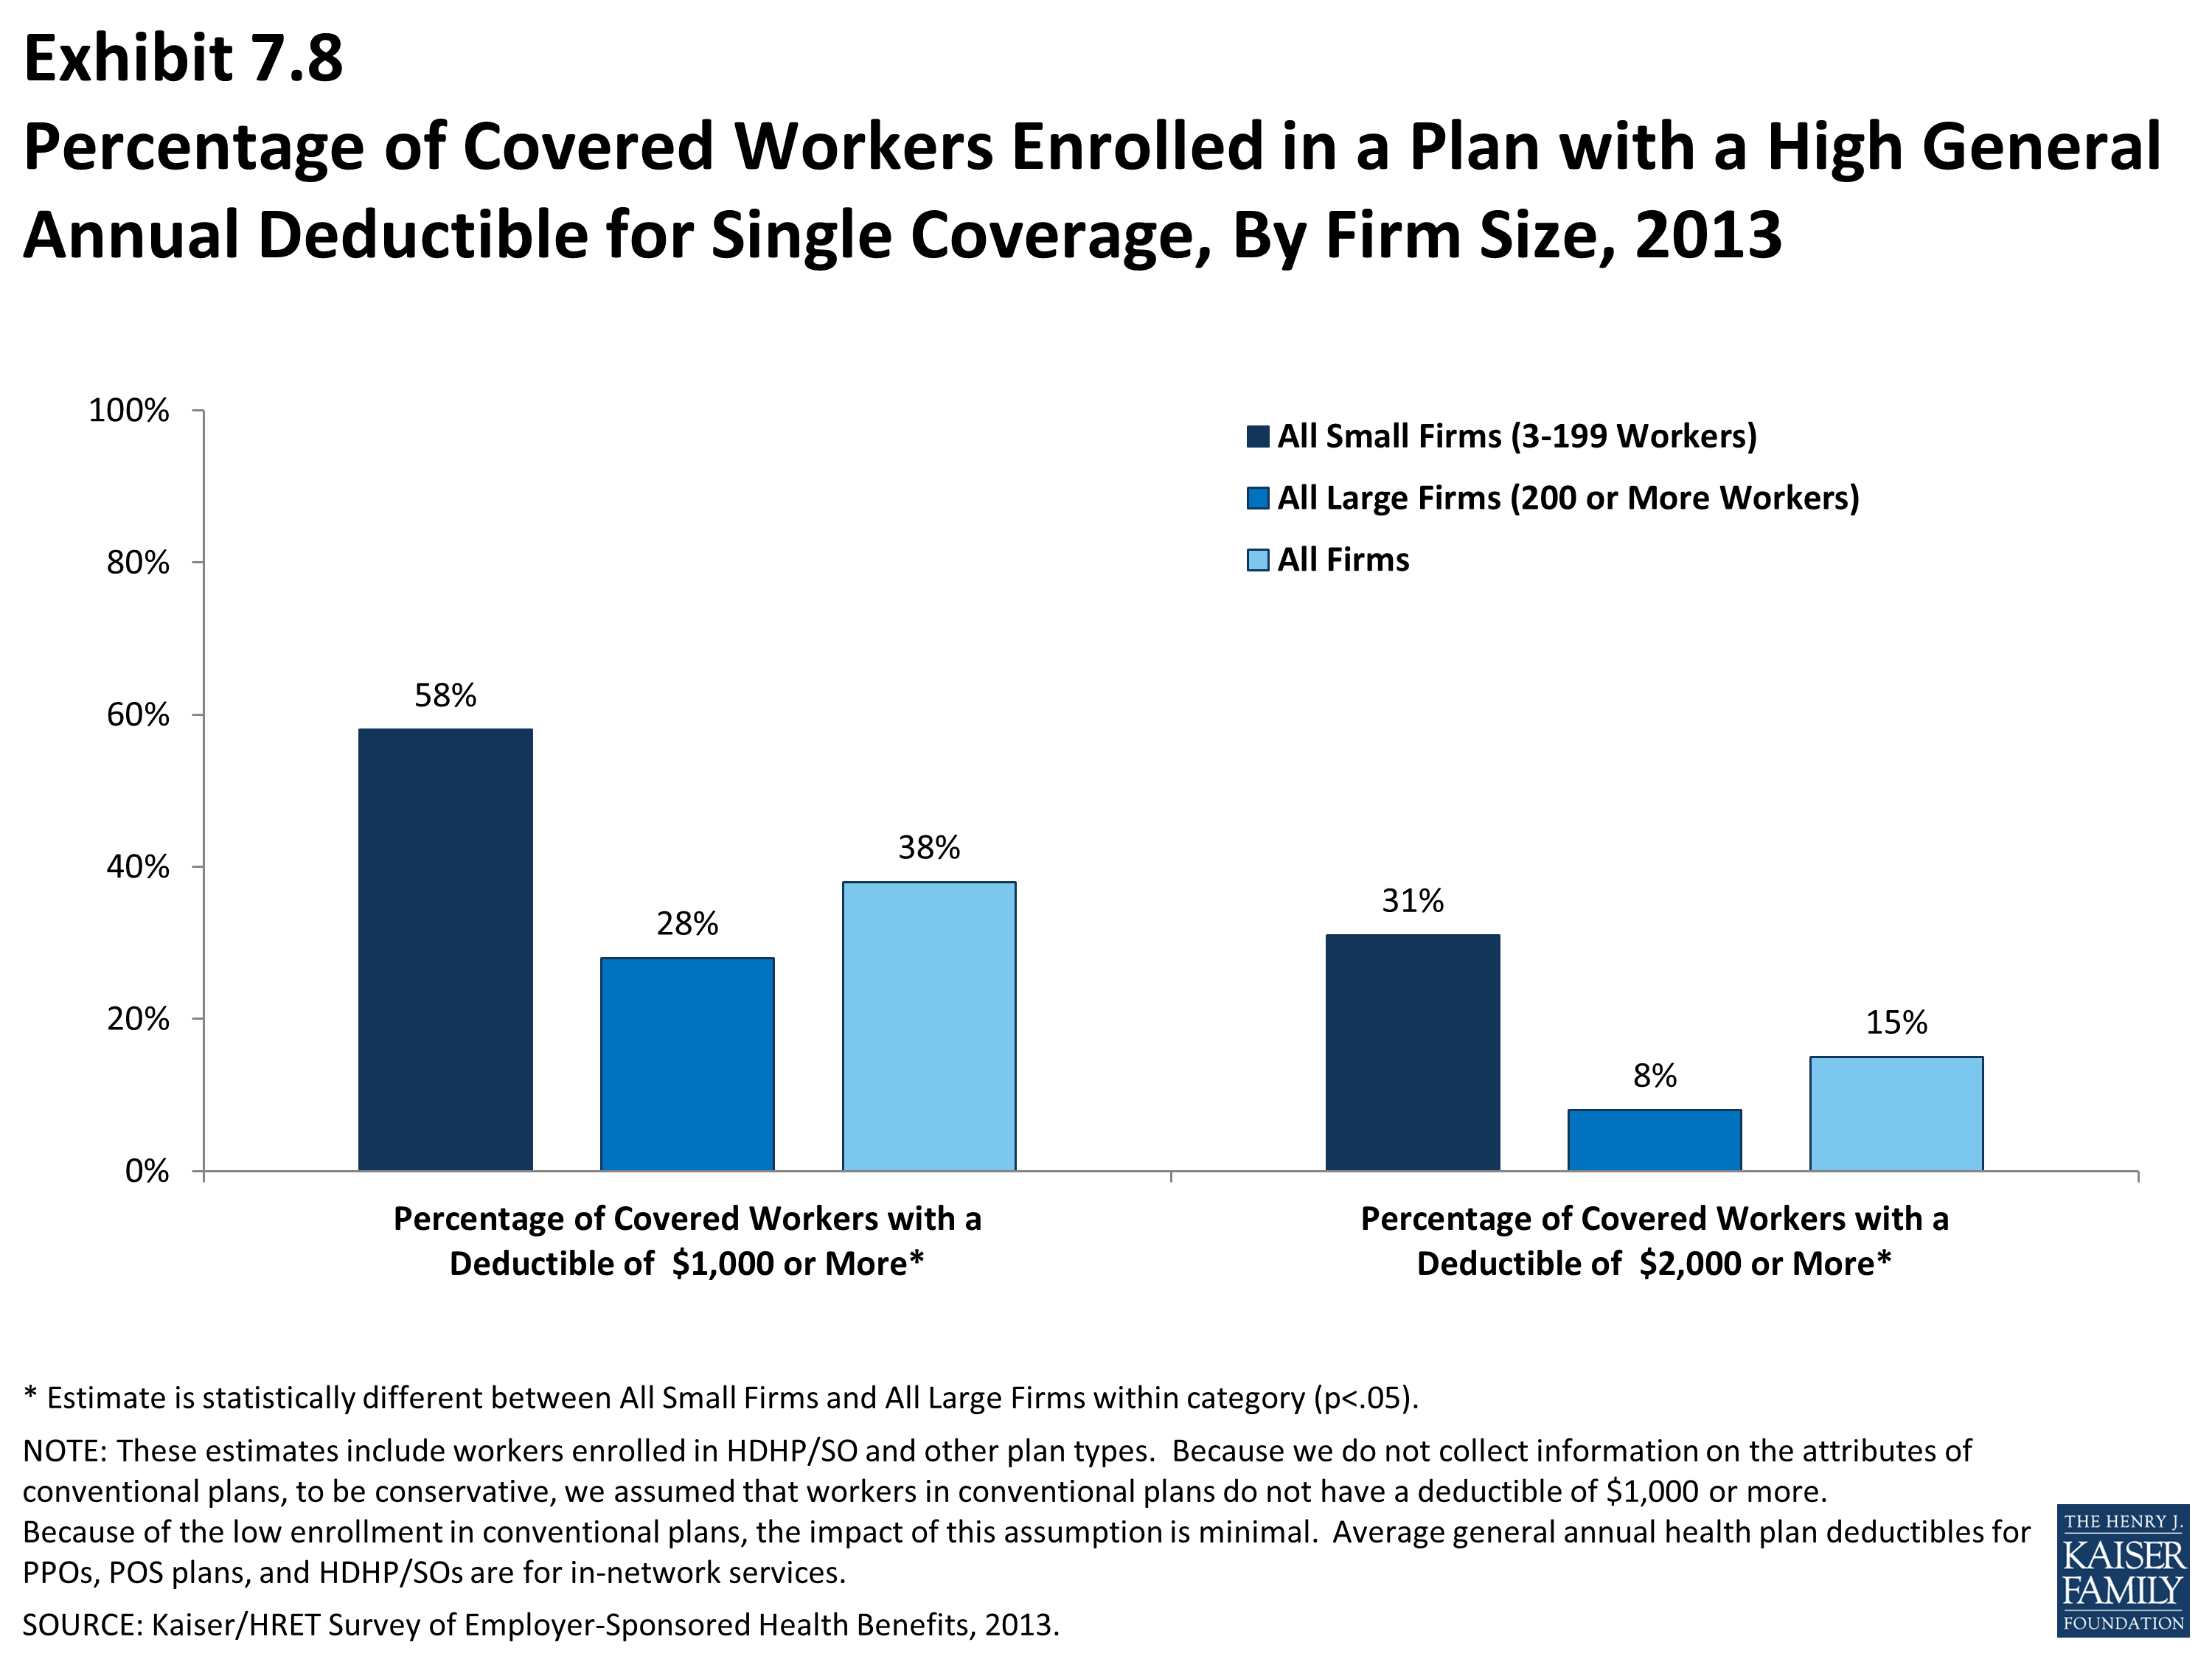
Percentage of Covered Workers Enrolled in a Plan with a High General Annual Deductible for Single Coverage, By Firm Size, 2013
Percentage of Covered Workers Enrolled in a Plan with a General Annual Deductible of $1,000 or More for Single Coverage, By Firm Size, 2006-2013
Percentage of Covered Workers Enrolled in a Plan with a General Annual Deductible of $2,000 or More for Single Coverage, By Firm Size, 2006-2013
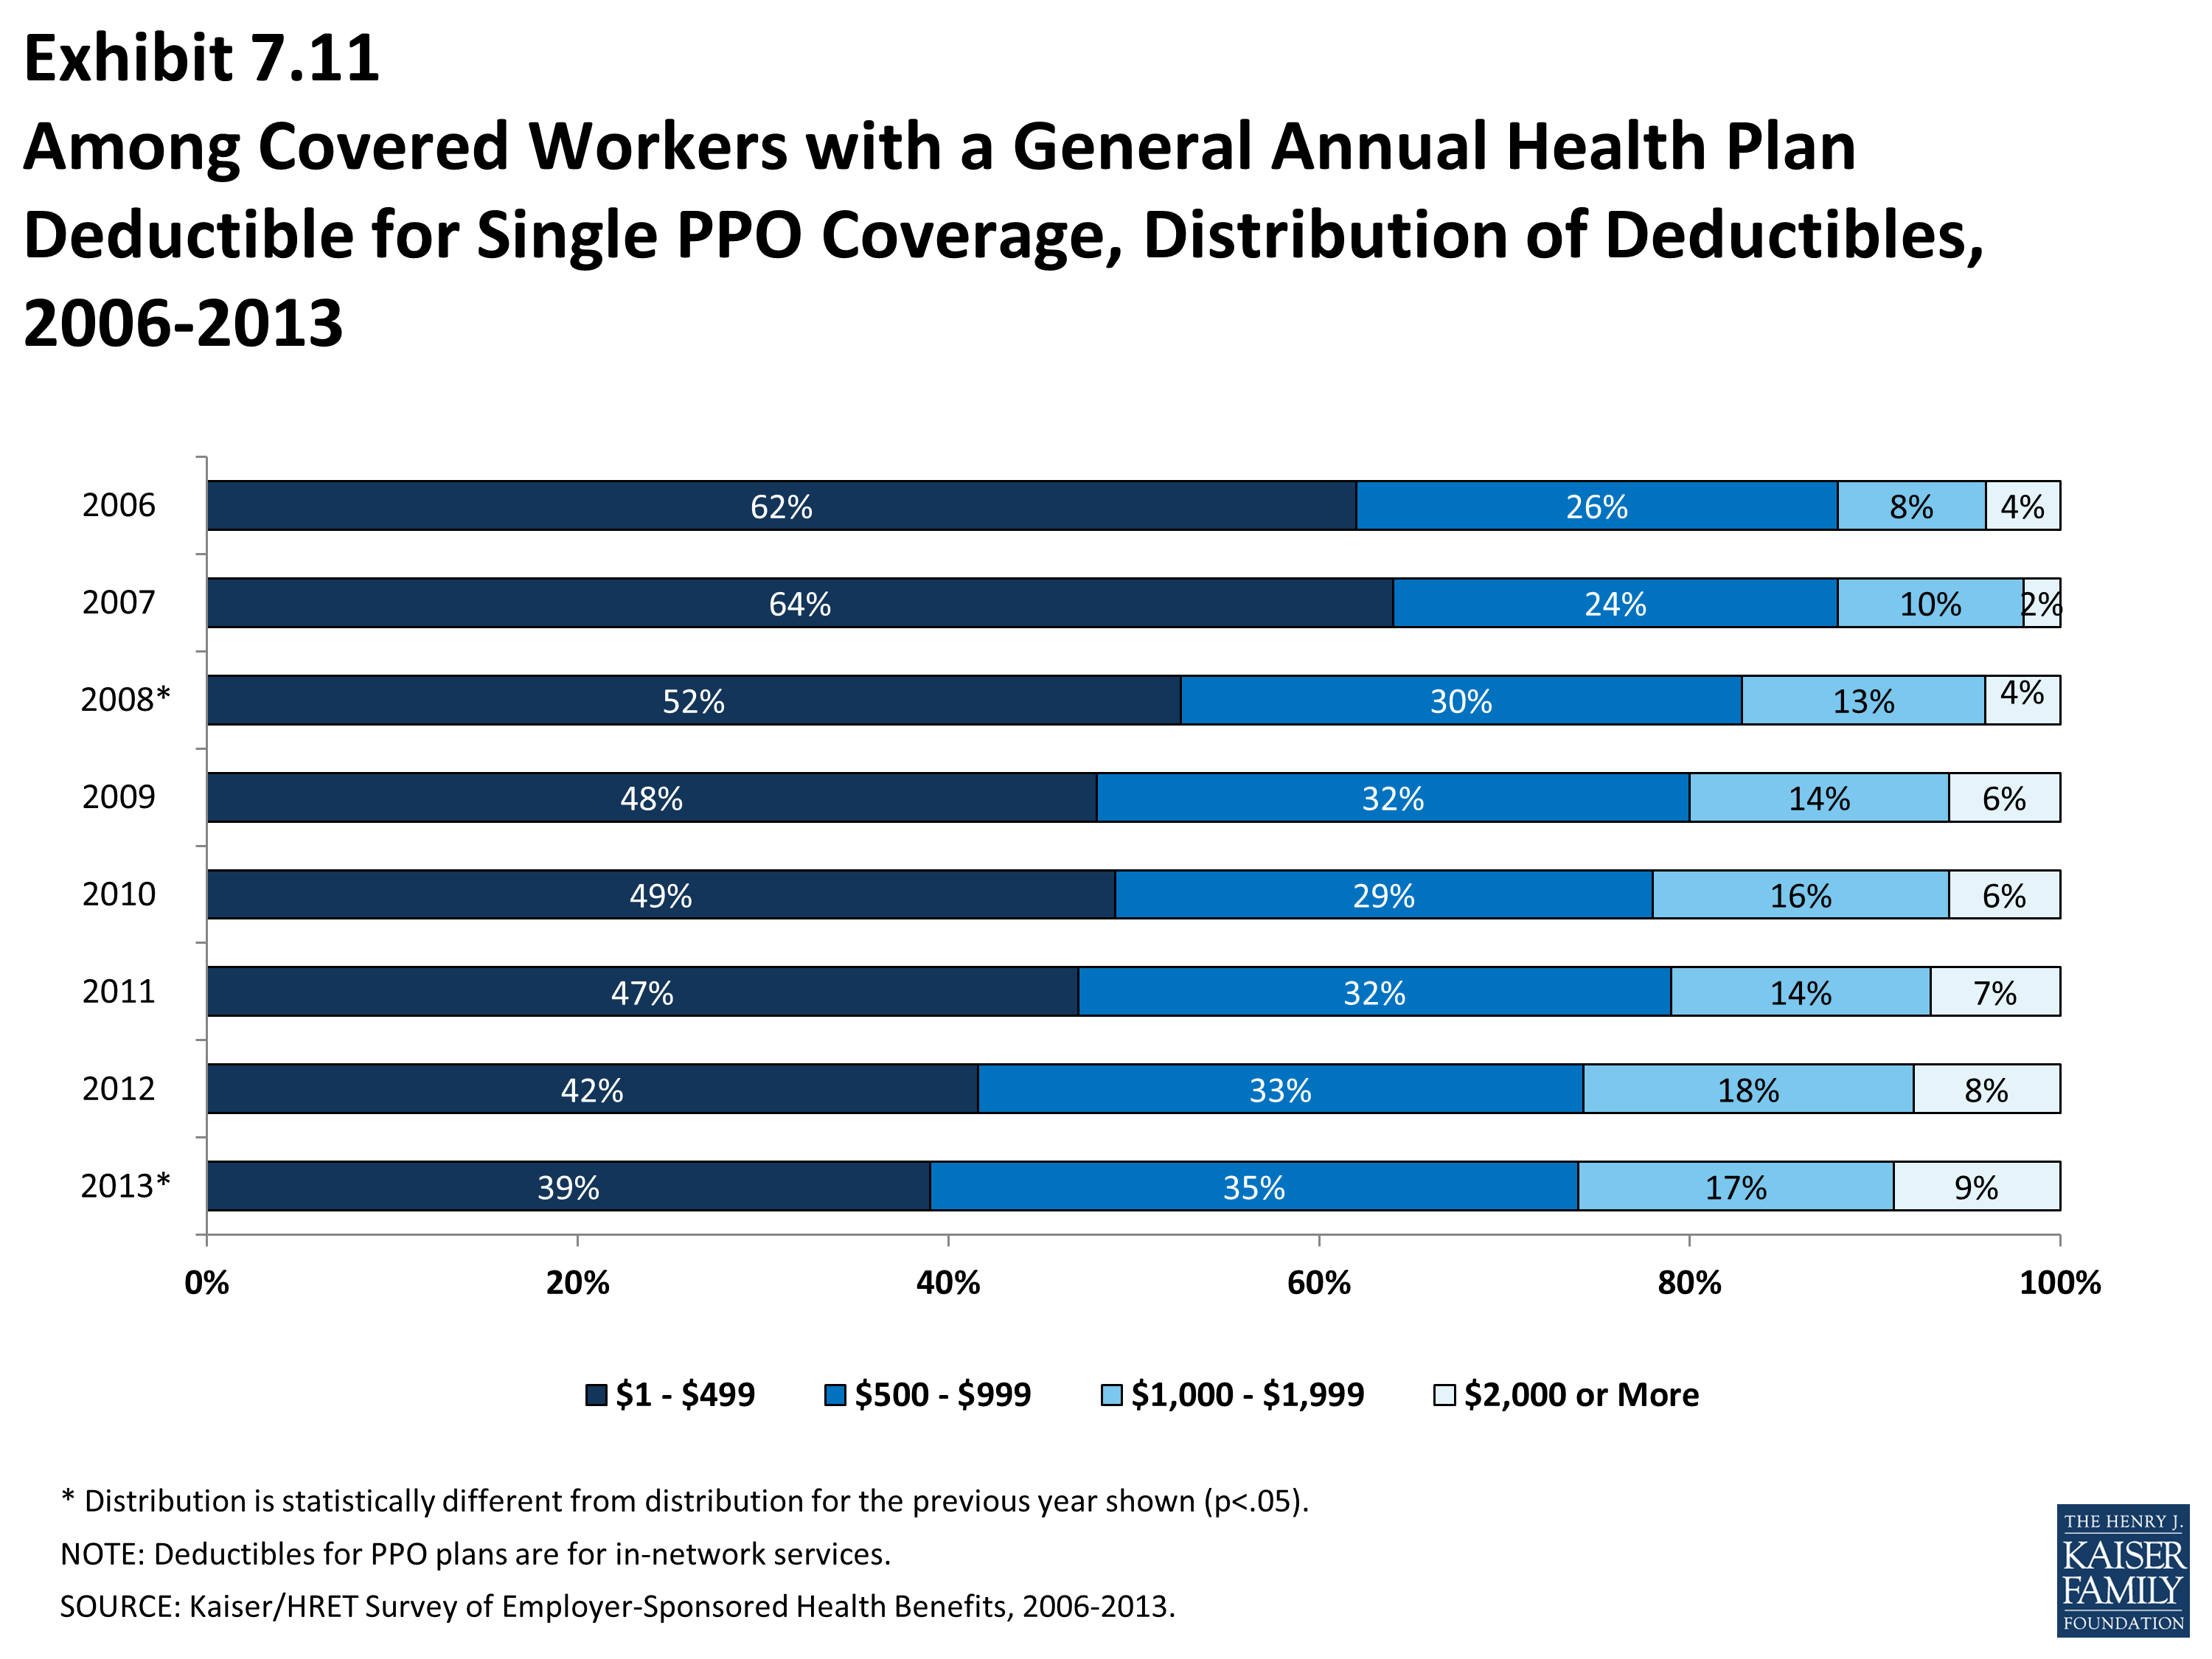
Among Covered Workers with a General Annual Health Plan Deductible for Single PPO Coverage, Distribution of Deductibles, 2006-2013
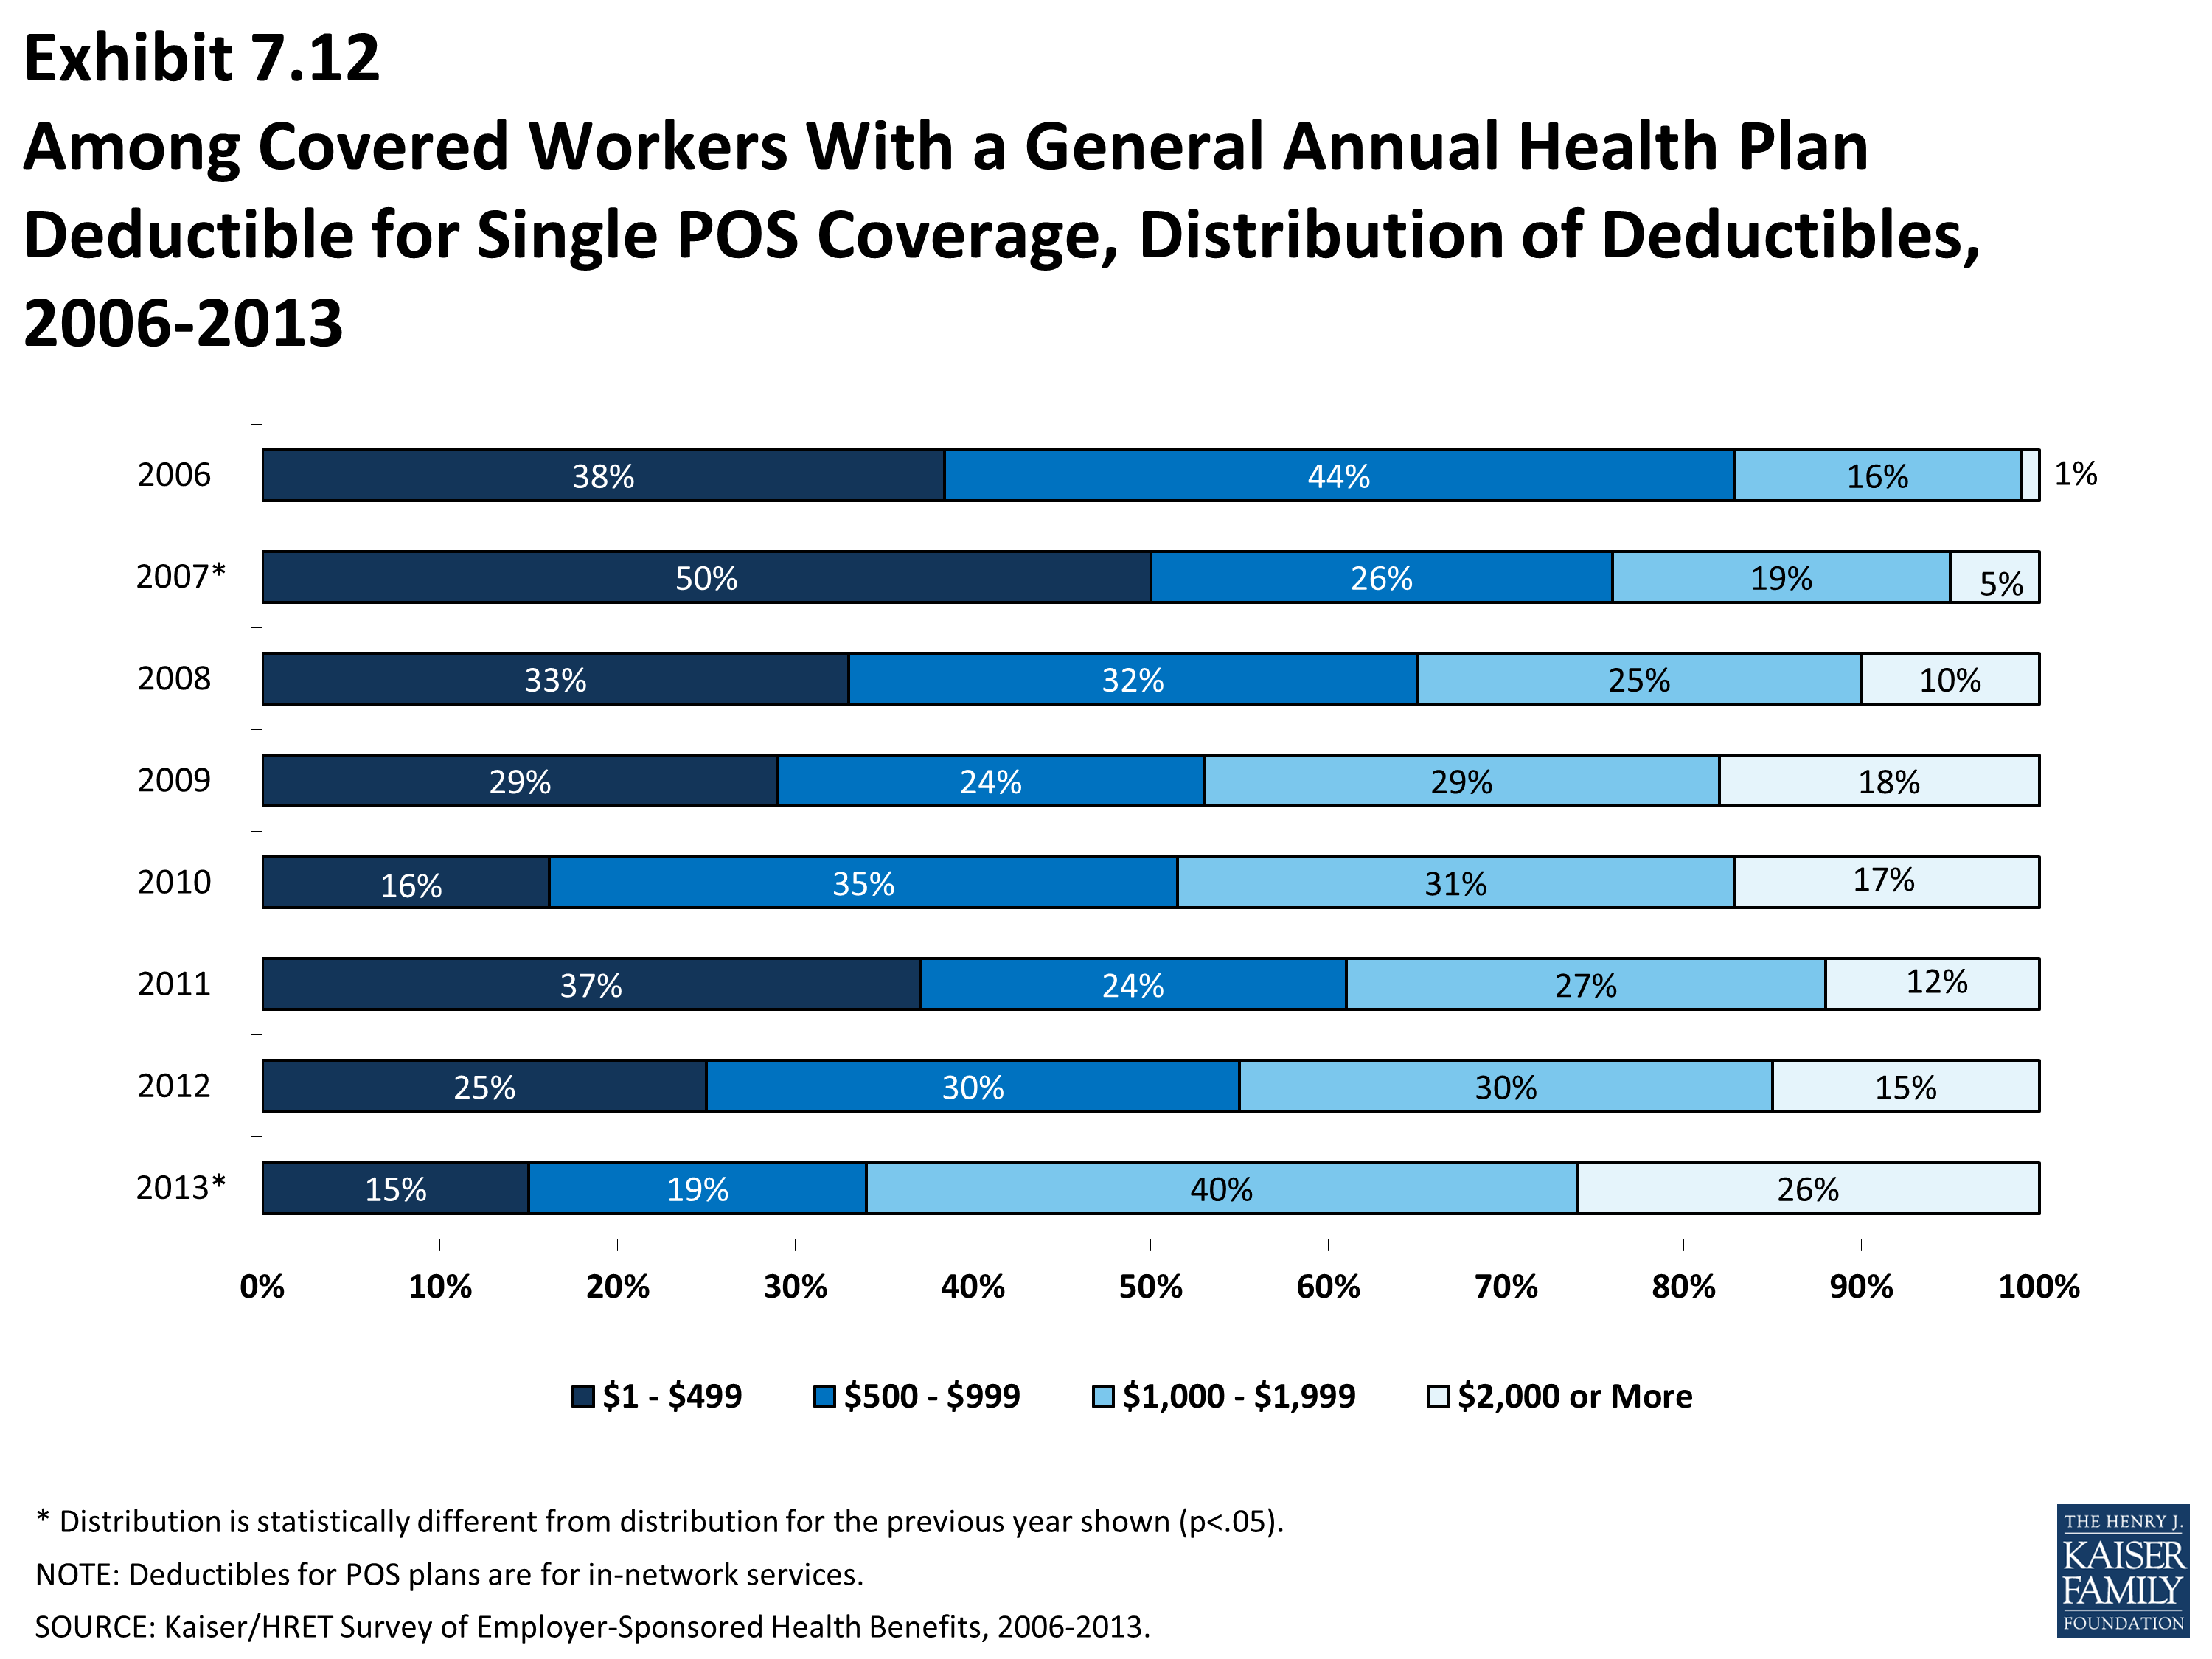
Among Covered Workers With a General Annual Health Plan Deductible for Single POS Coverage, Distribution of Deductibles, 2006-2013
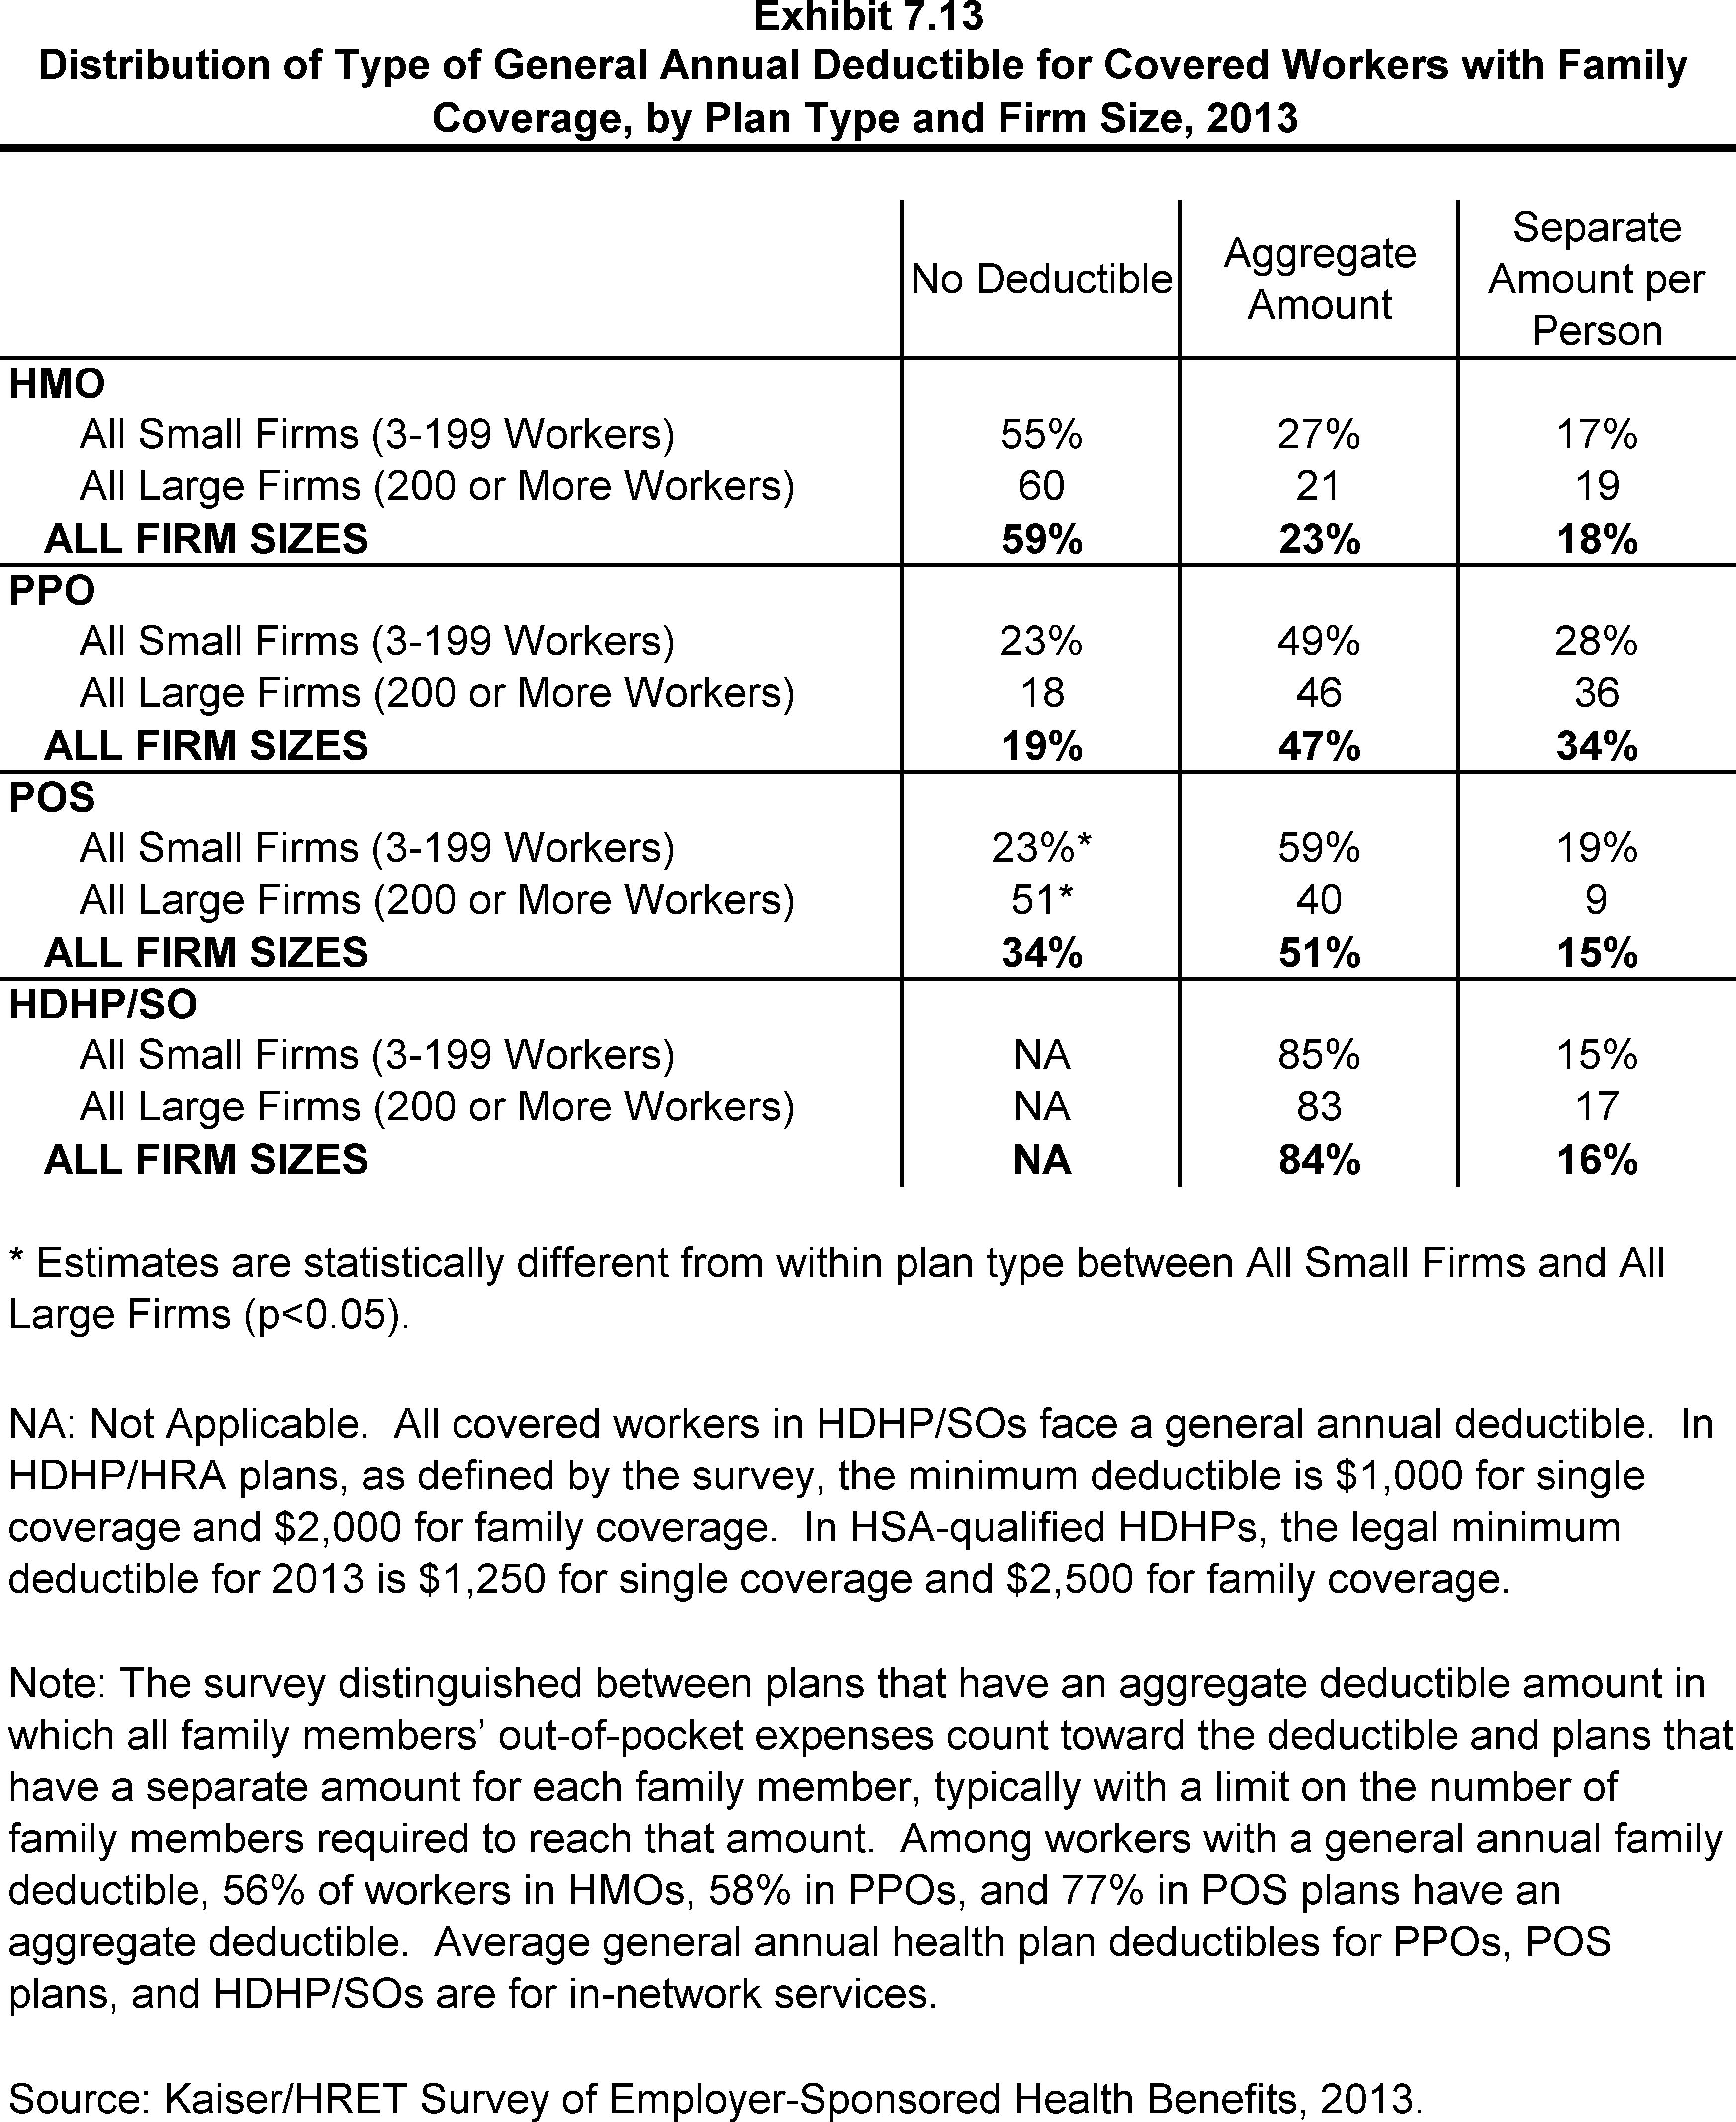
Distribution of Type of General Annual Deductible for Covered Workers with Family Coverage, by Plan Type and Firm Size, 2013
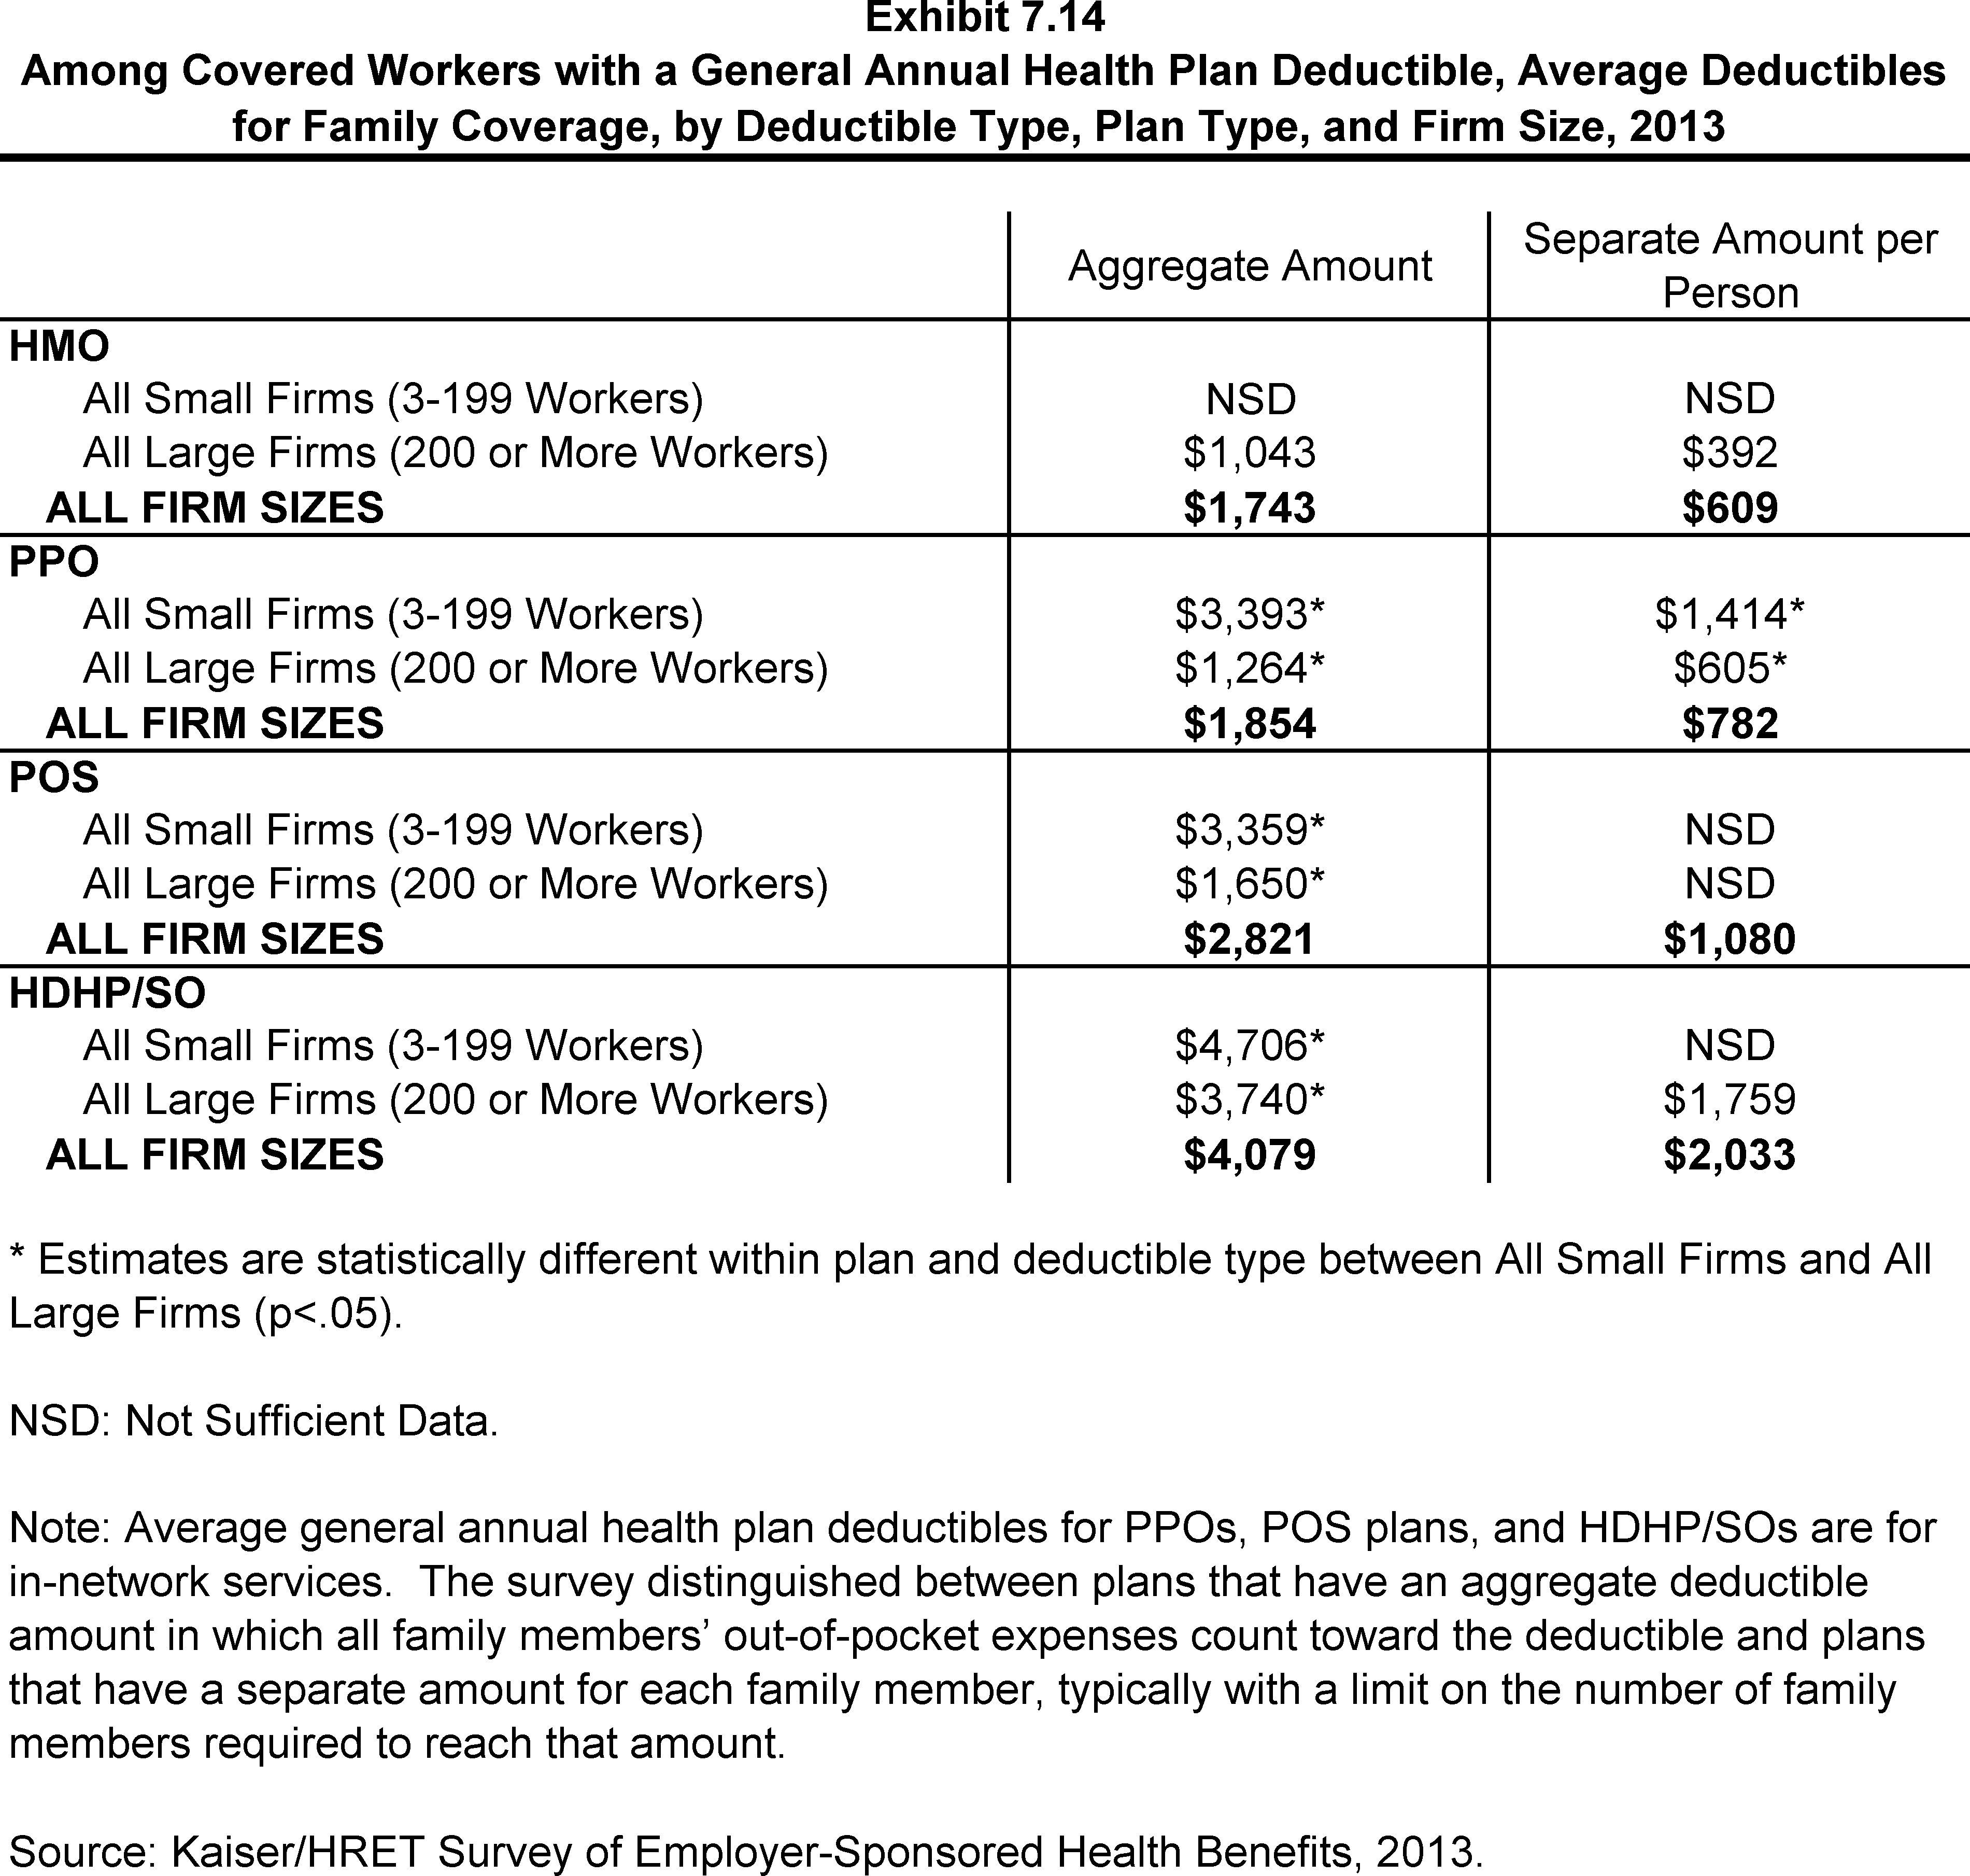
Among Covered Workers with a General Annual Health Plan Deductible, Average Deductibles for Family Coverage, by Deductible Type, Plan Type, and Firm Size, 2013
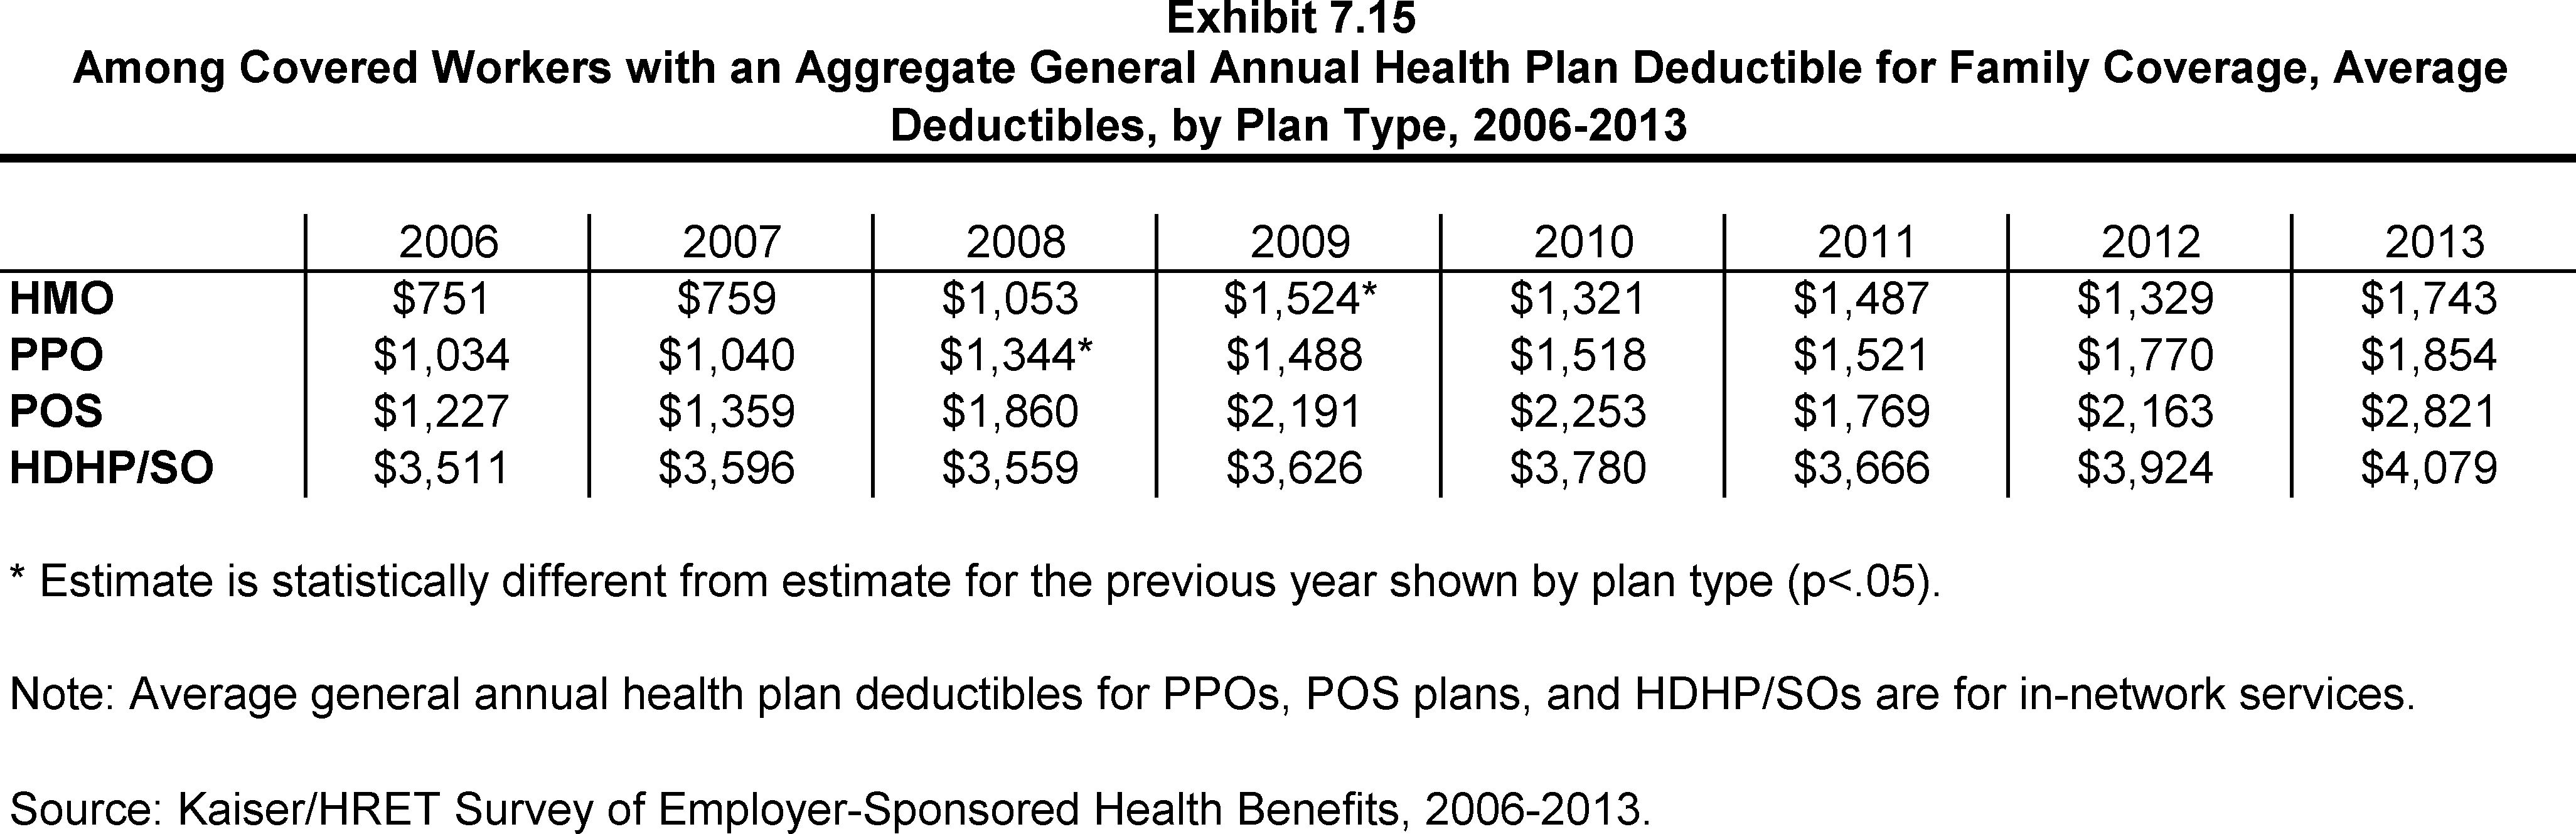
Among Covered Workers with an Aggregate General Annual Health Plan Deductible for Family Coverage, Average Deductibles, by Plan Type, 2006-2013
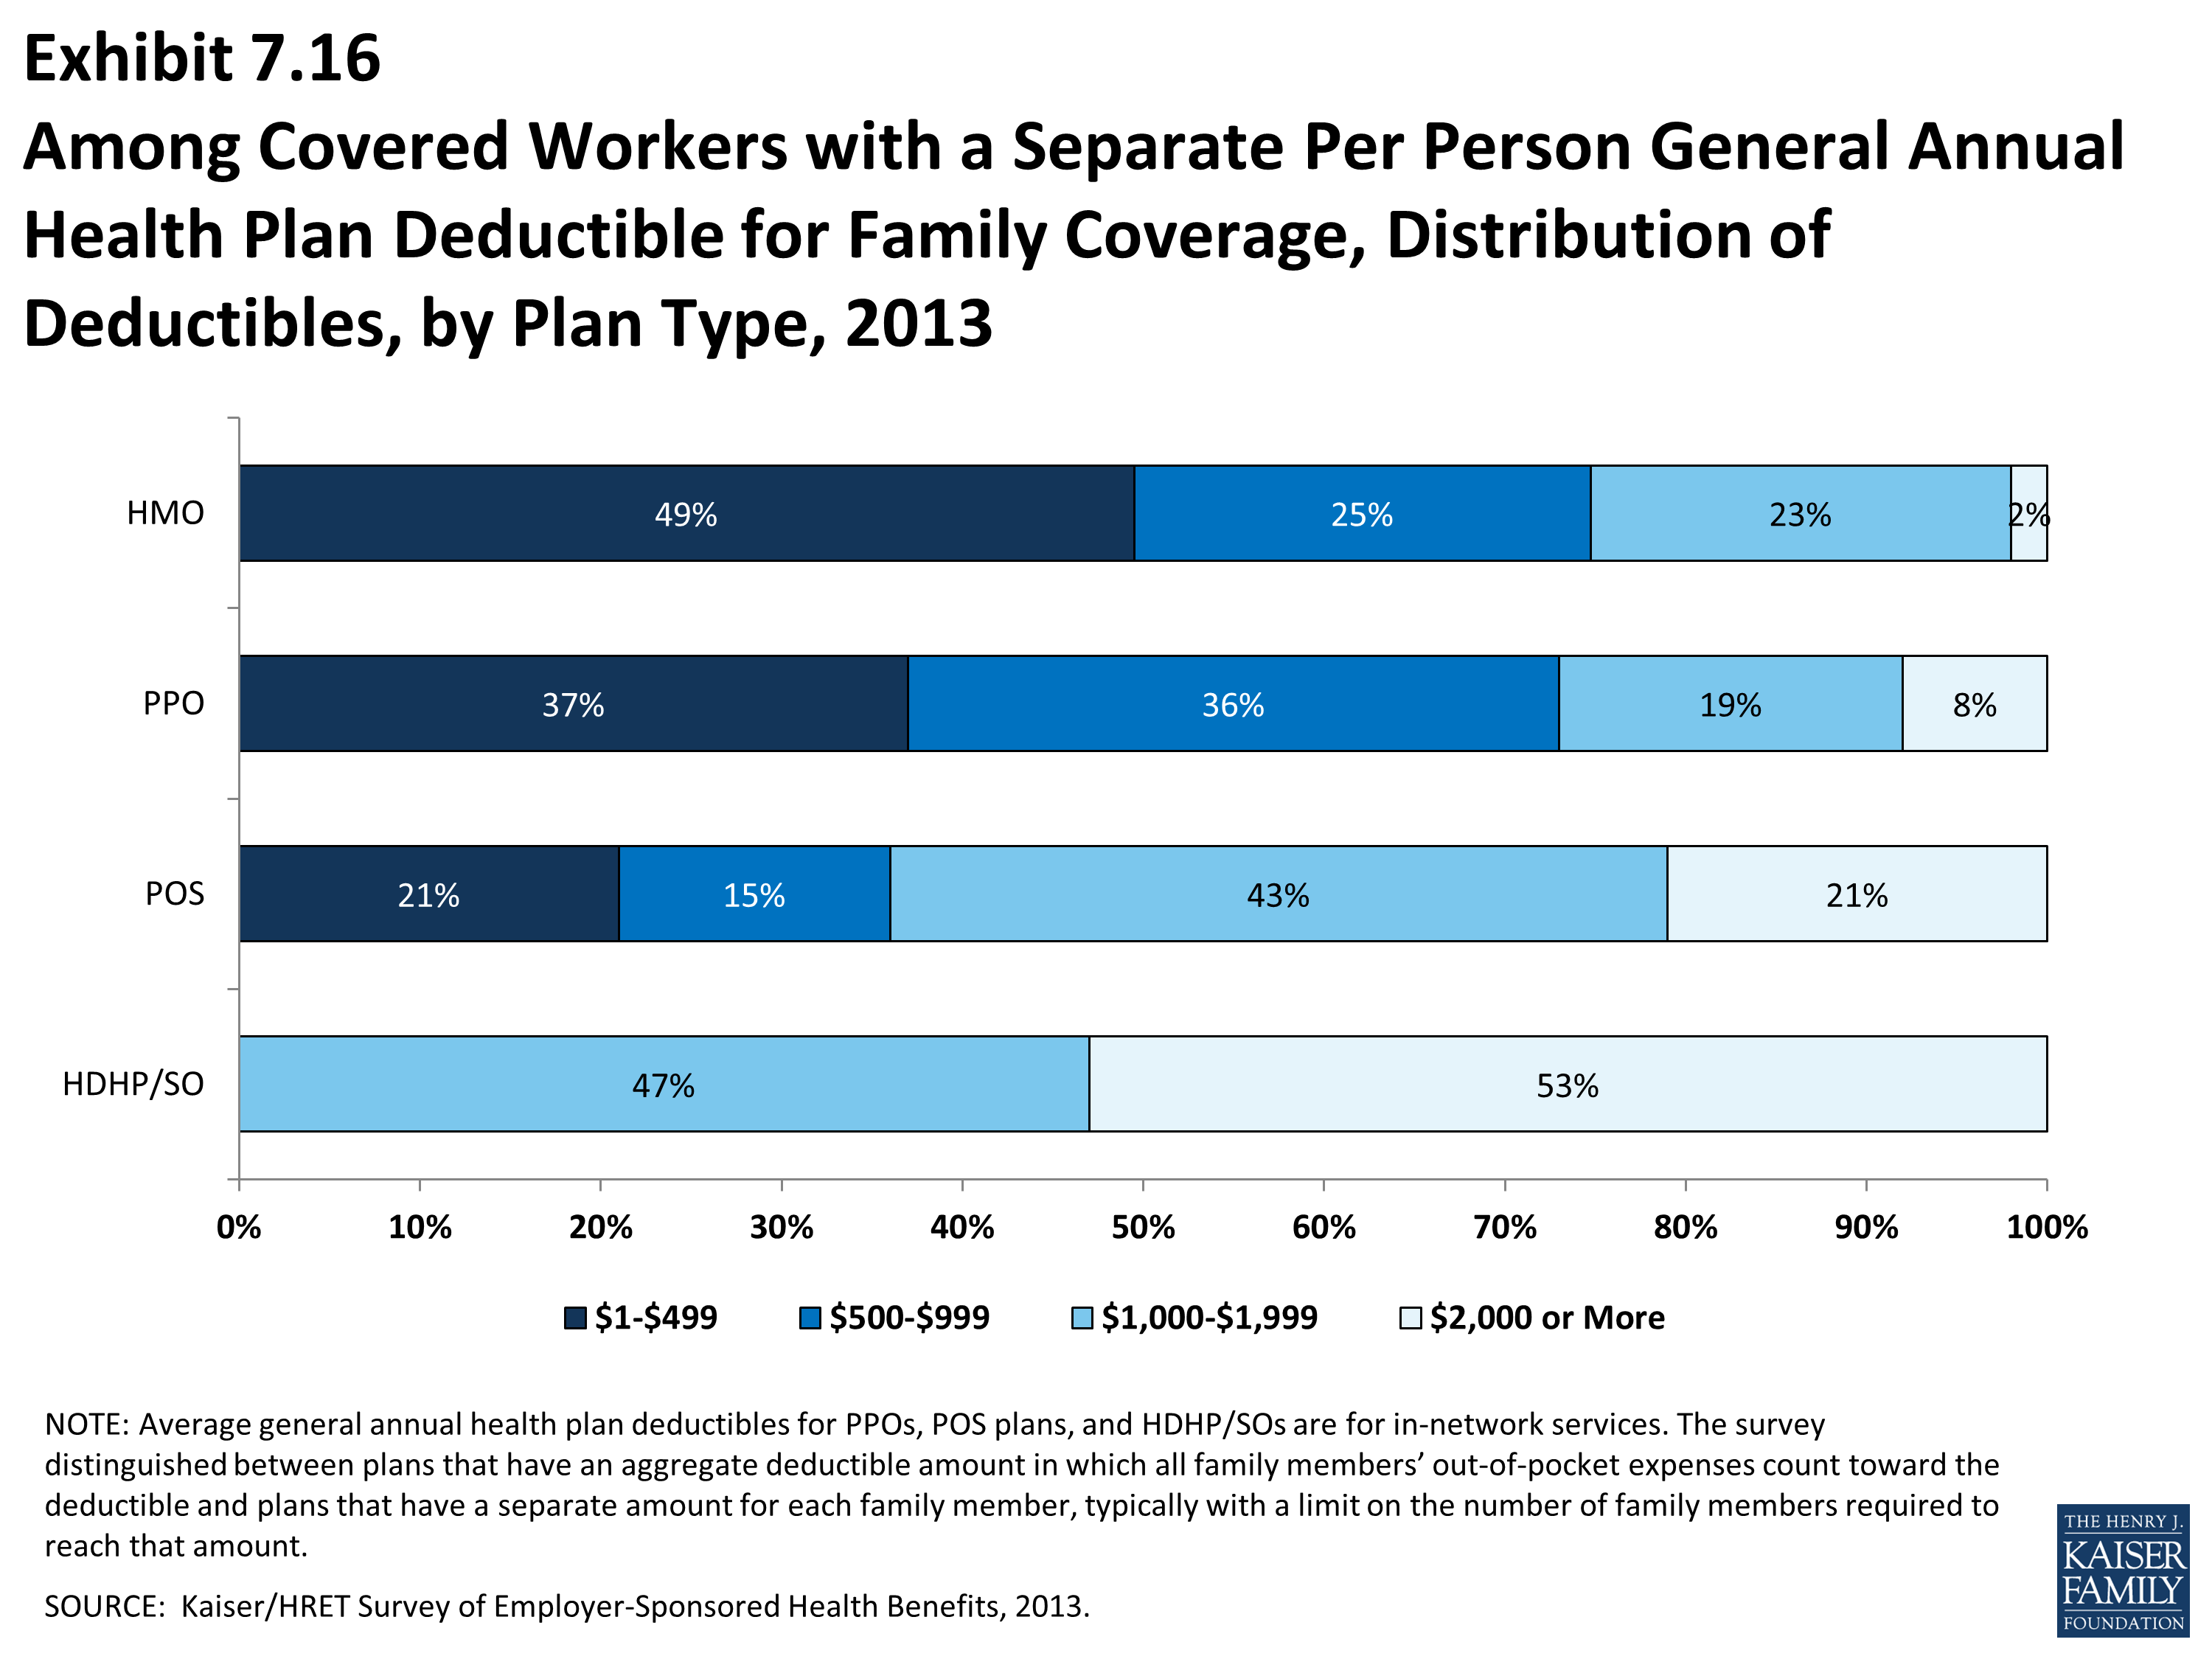
Among Covered Workers with a Separate Per Person General Annual Health Plan Deductible for Family Coverage, Distribution of Deductibles, by Plan Type, 2013
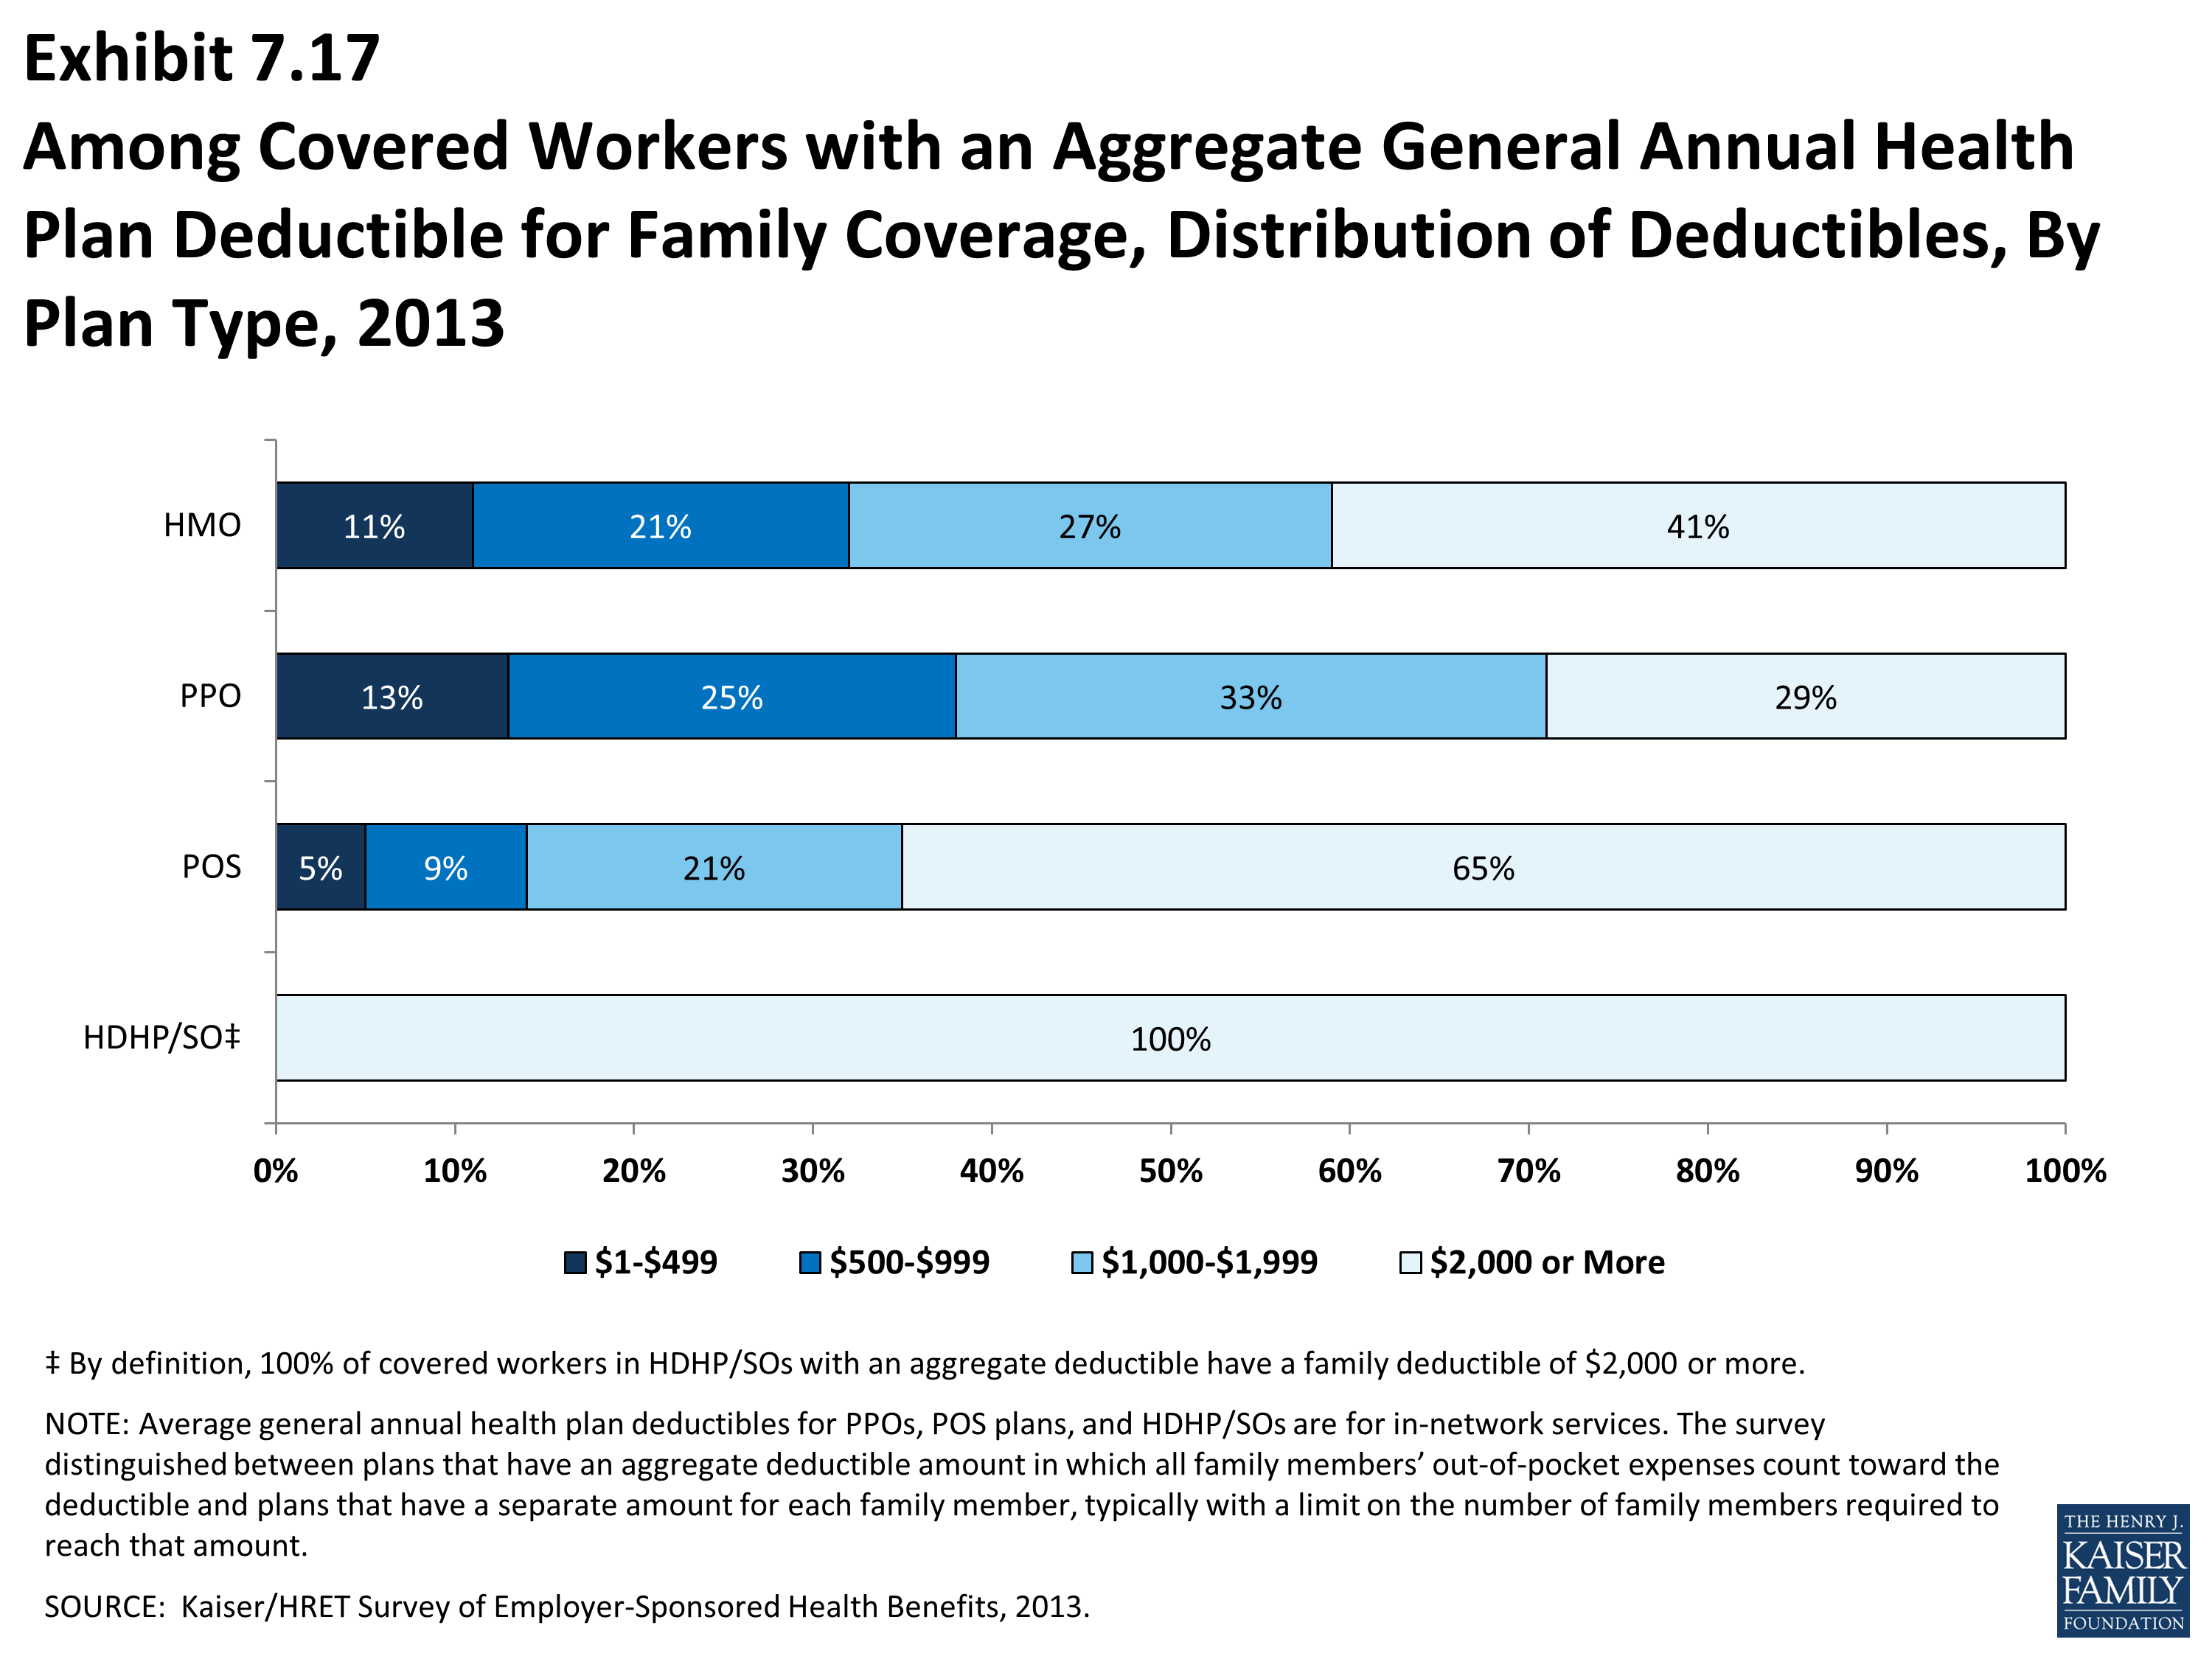
Among Covered Workers with an Aggregate General Annual Health Plan Deductible for Family Coverage, Distribution of Deductibles, By Plan Type, 2013
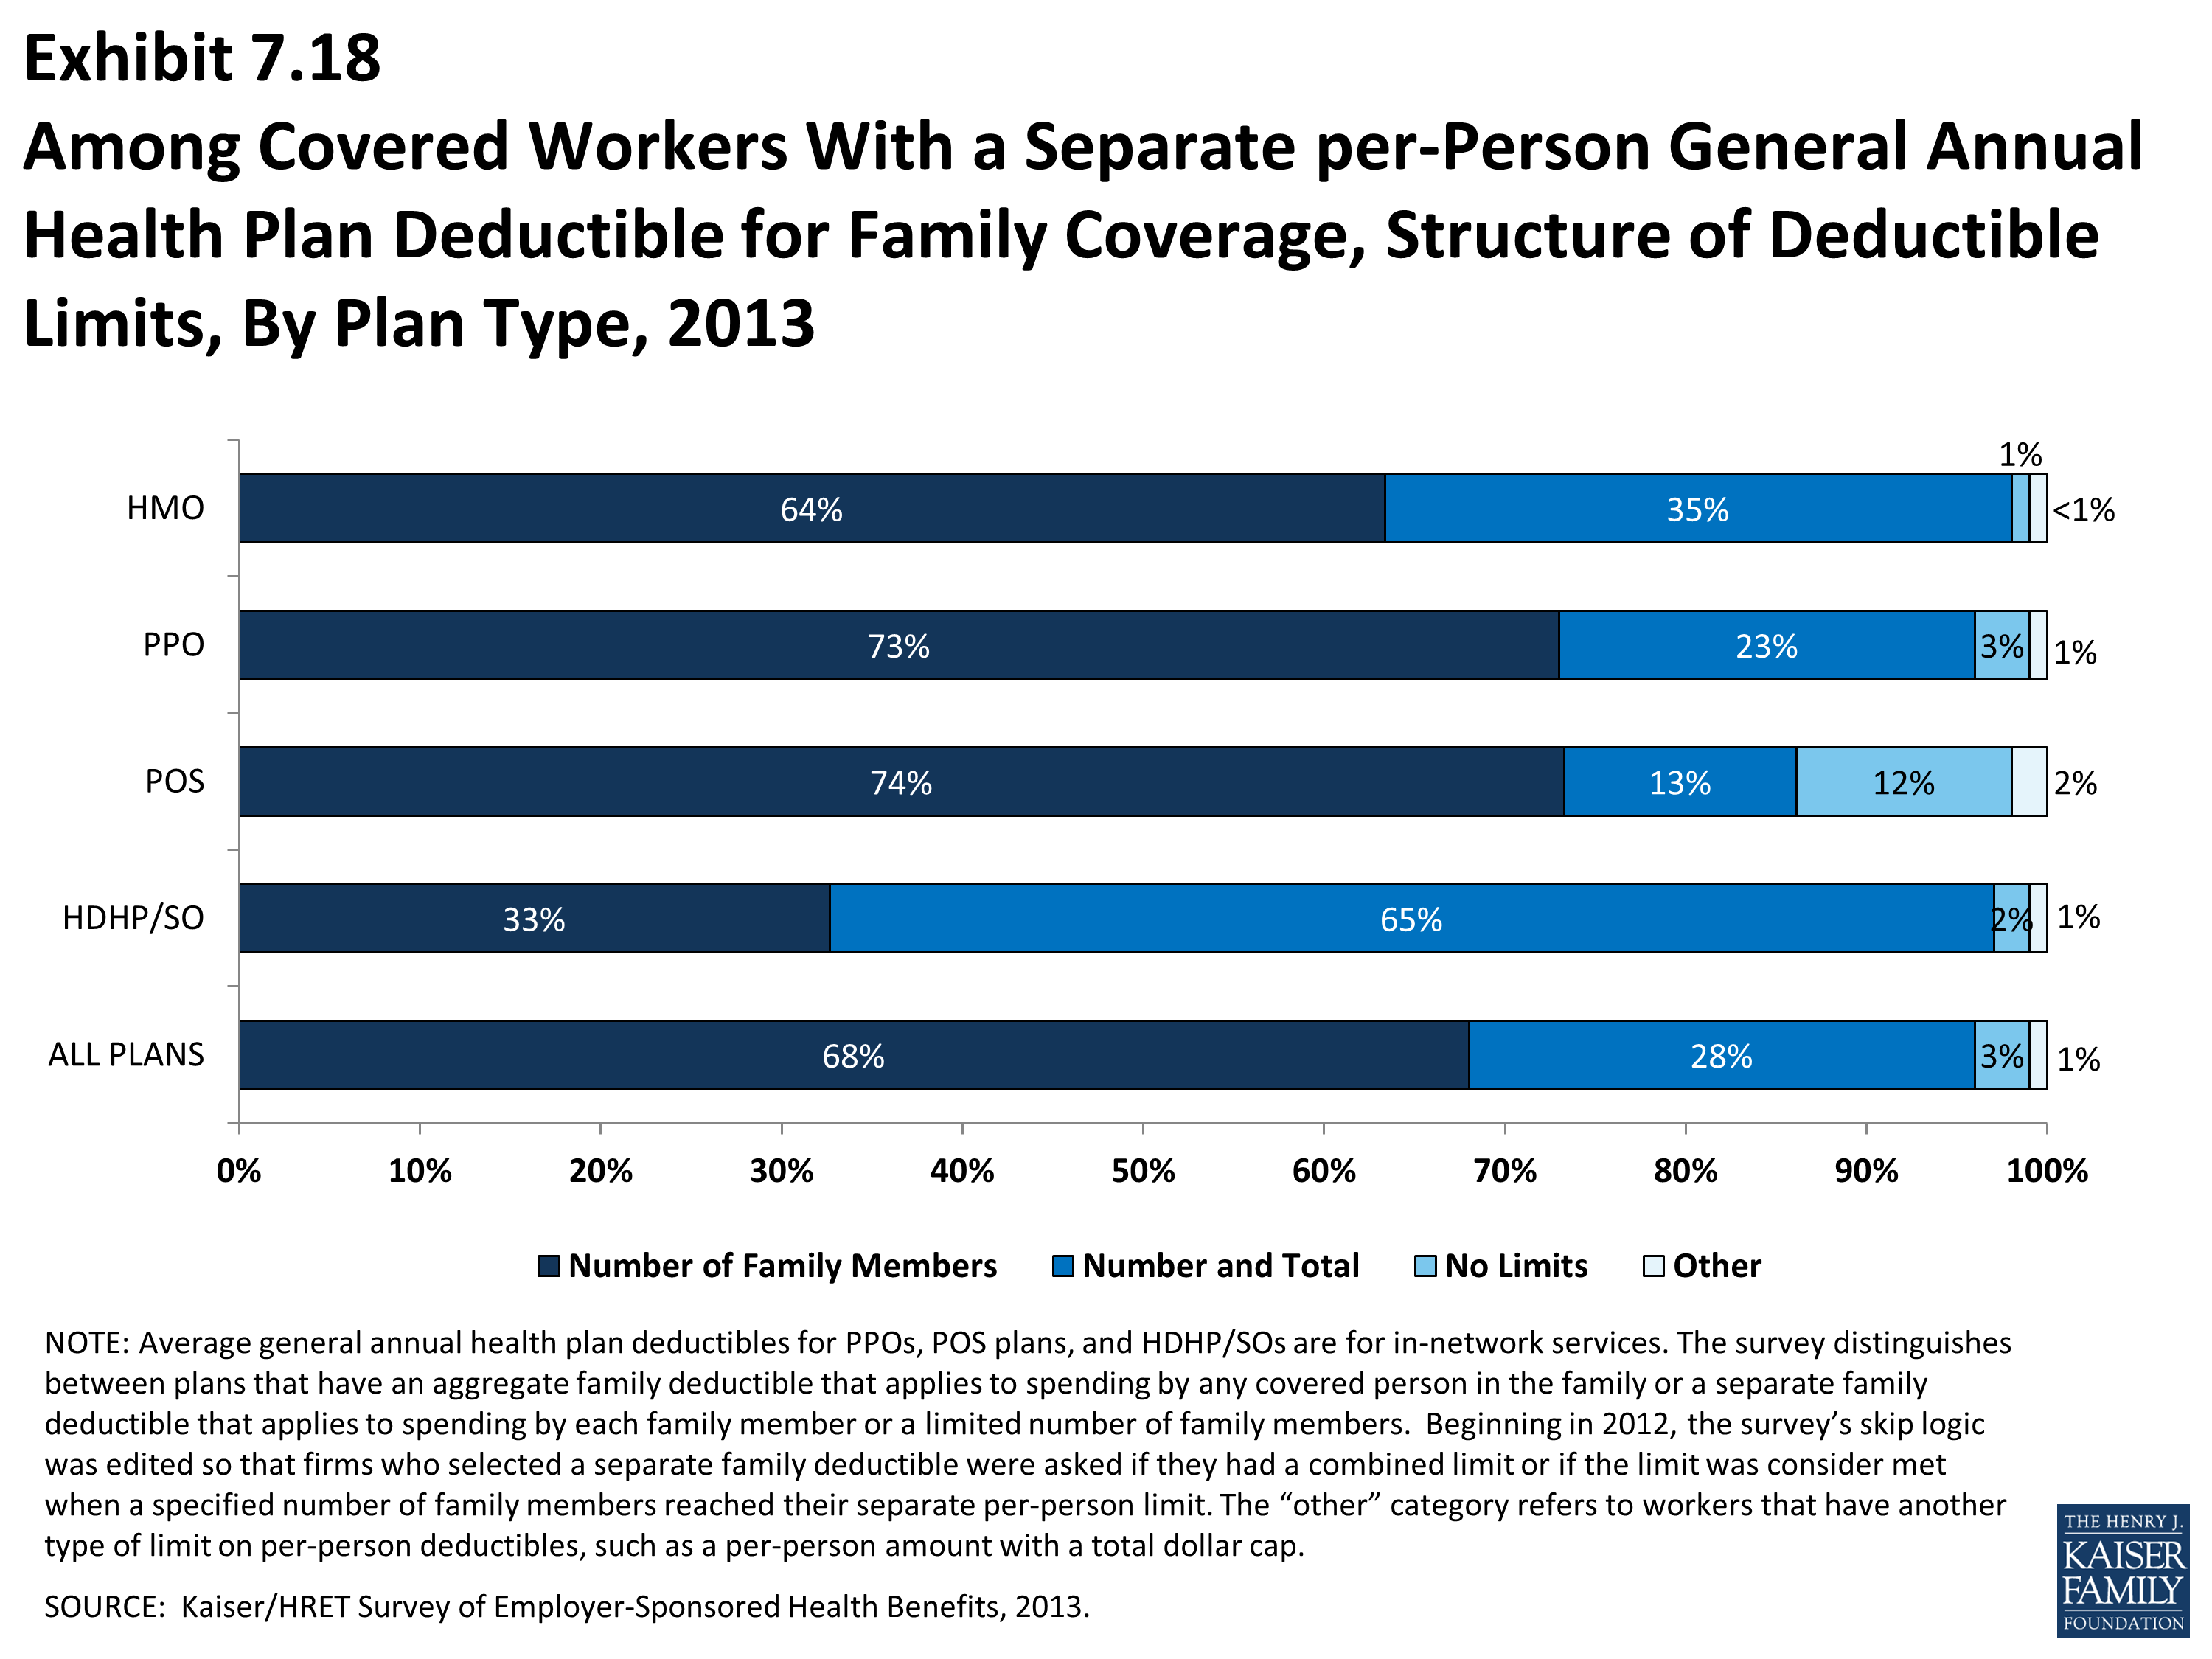
Among Covered Workers With a Separate Per Person General Annual Health Plan Deductible for Family Coverage, Structure of Deductible Limits, By Plan Type, 2013
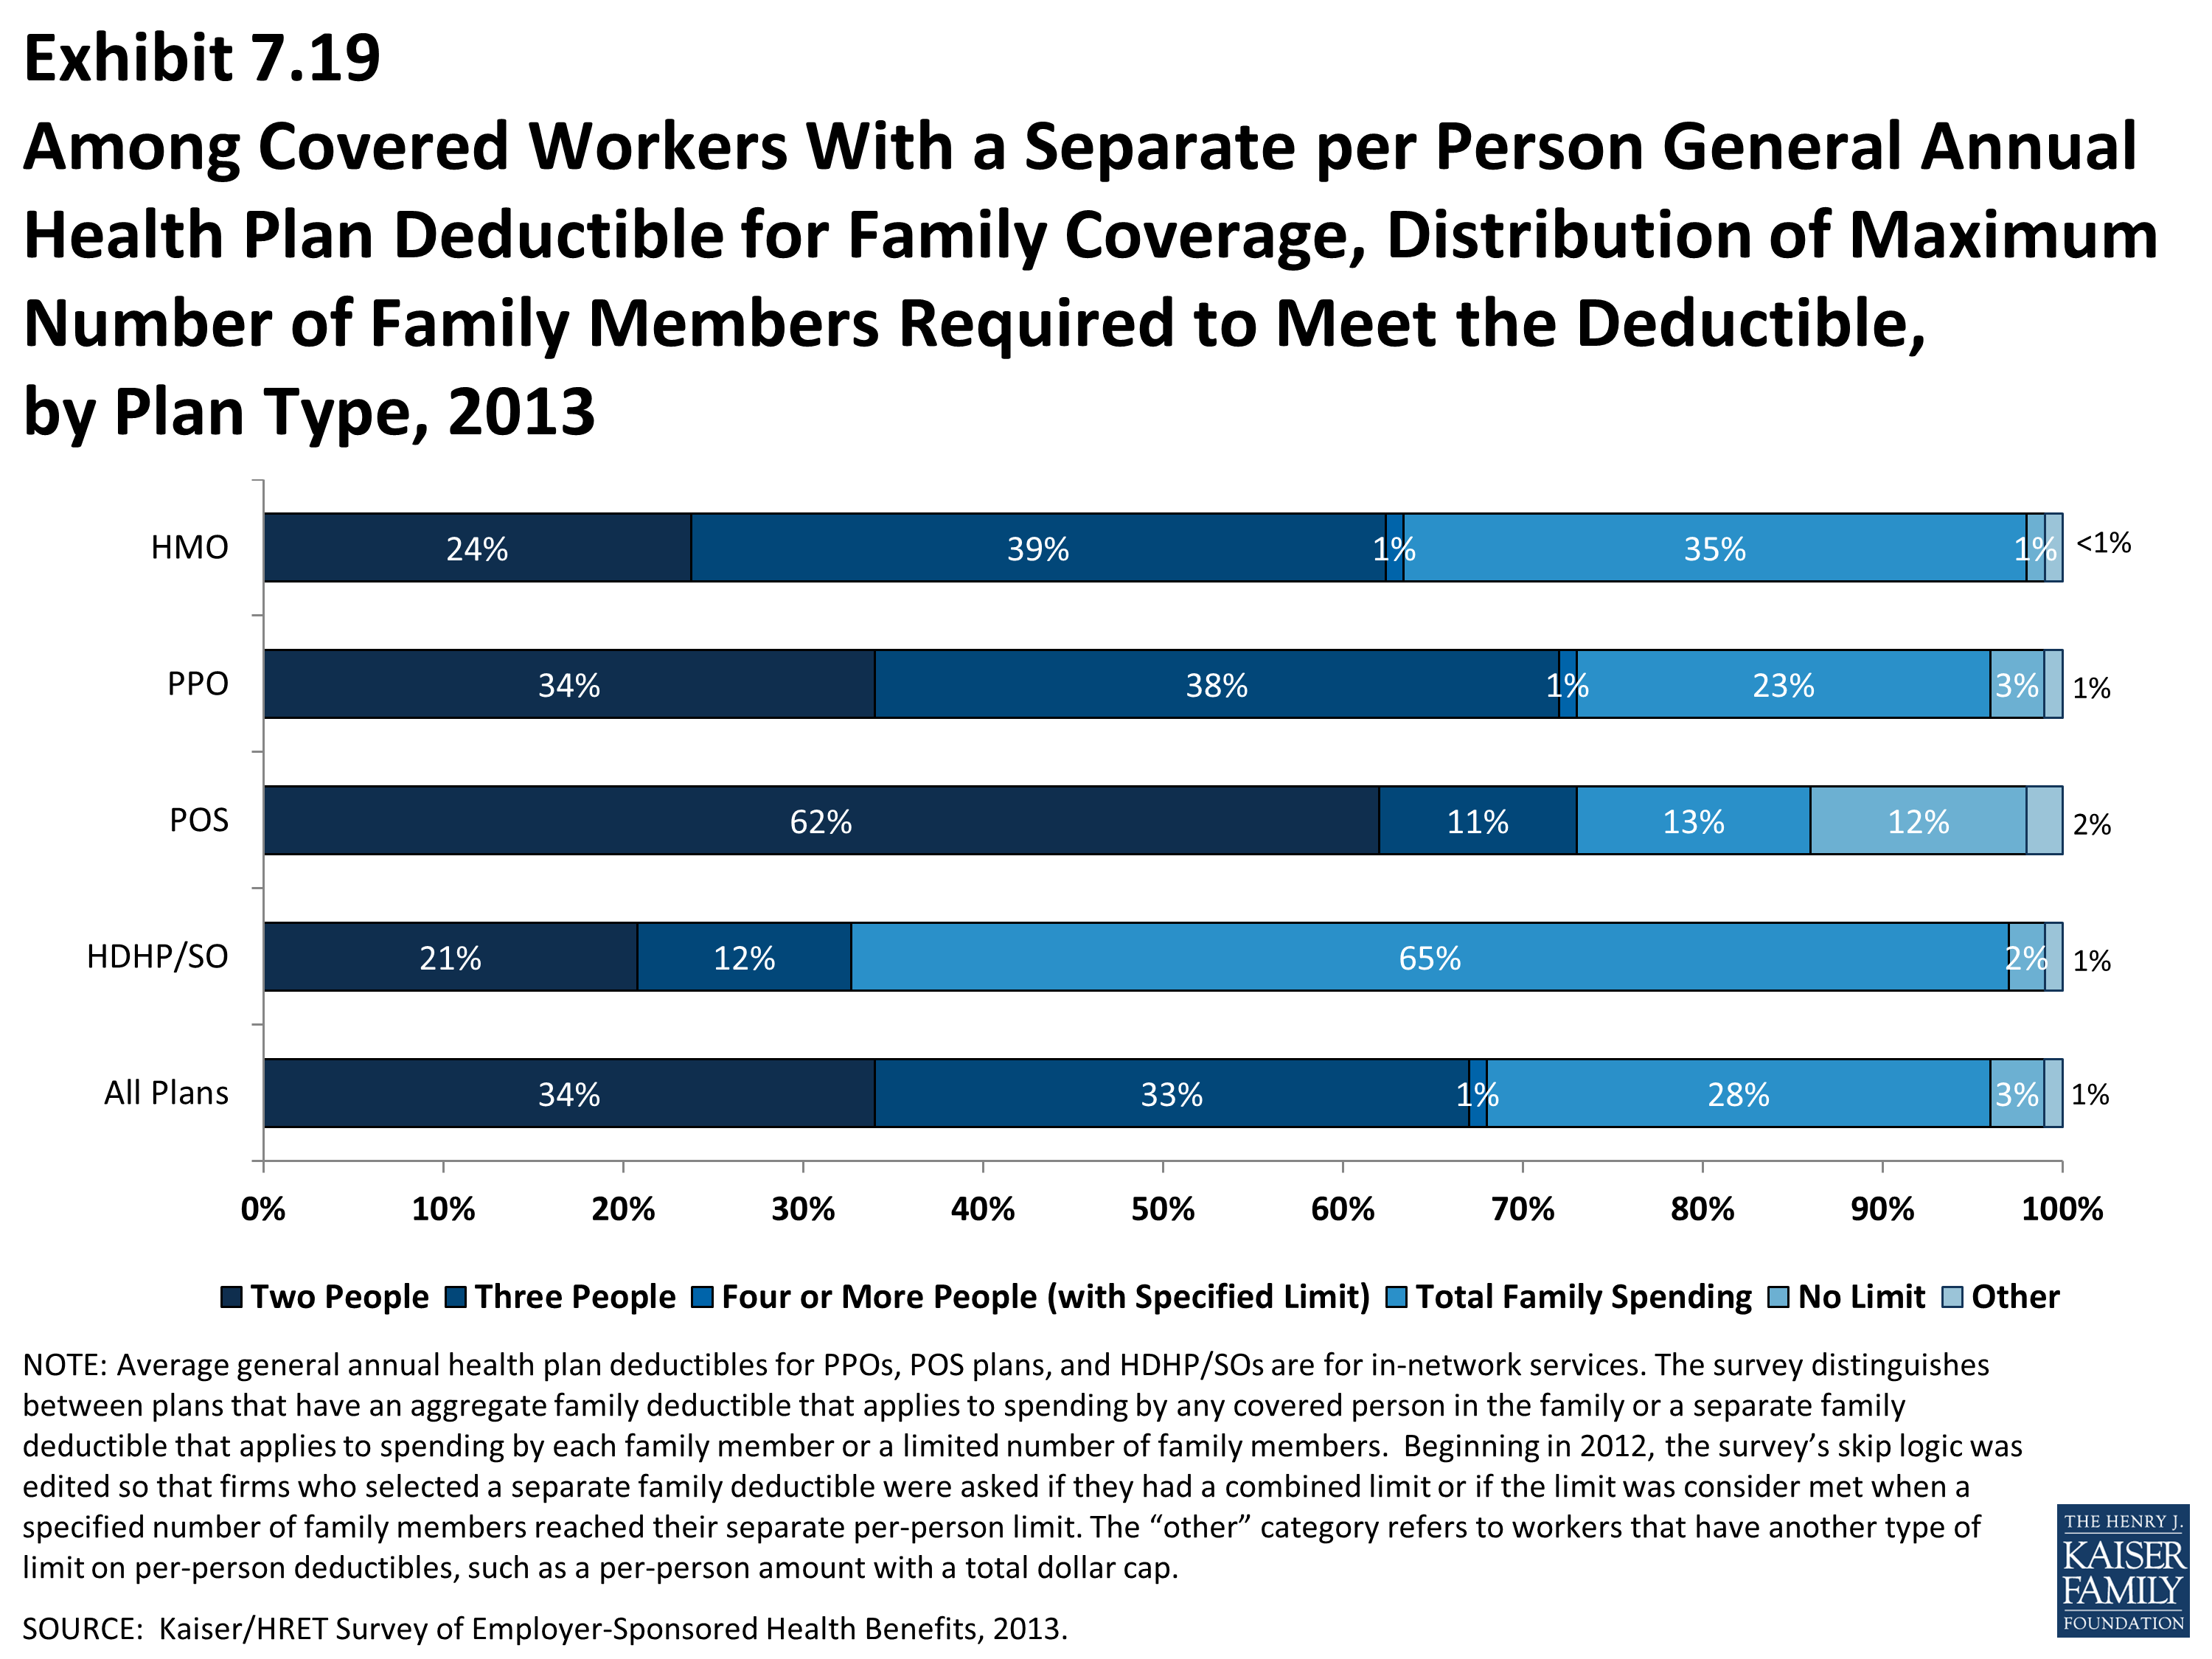
Among Covered Workers With a Separate Per Person General Annual Health Plan Deductible for Family Coverage, Distribution of Maximum Number of Family Members Required to Meet the Deductible, by Plan Type, 2013
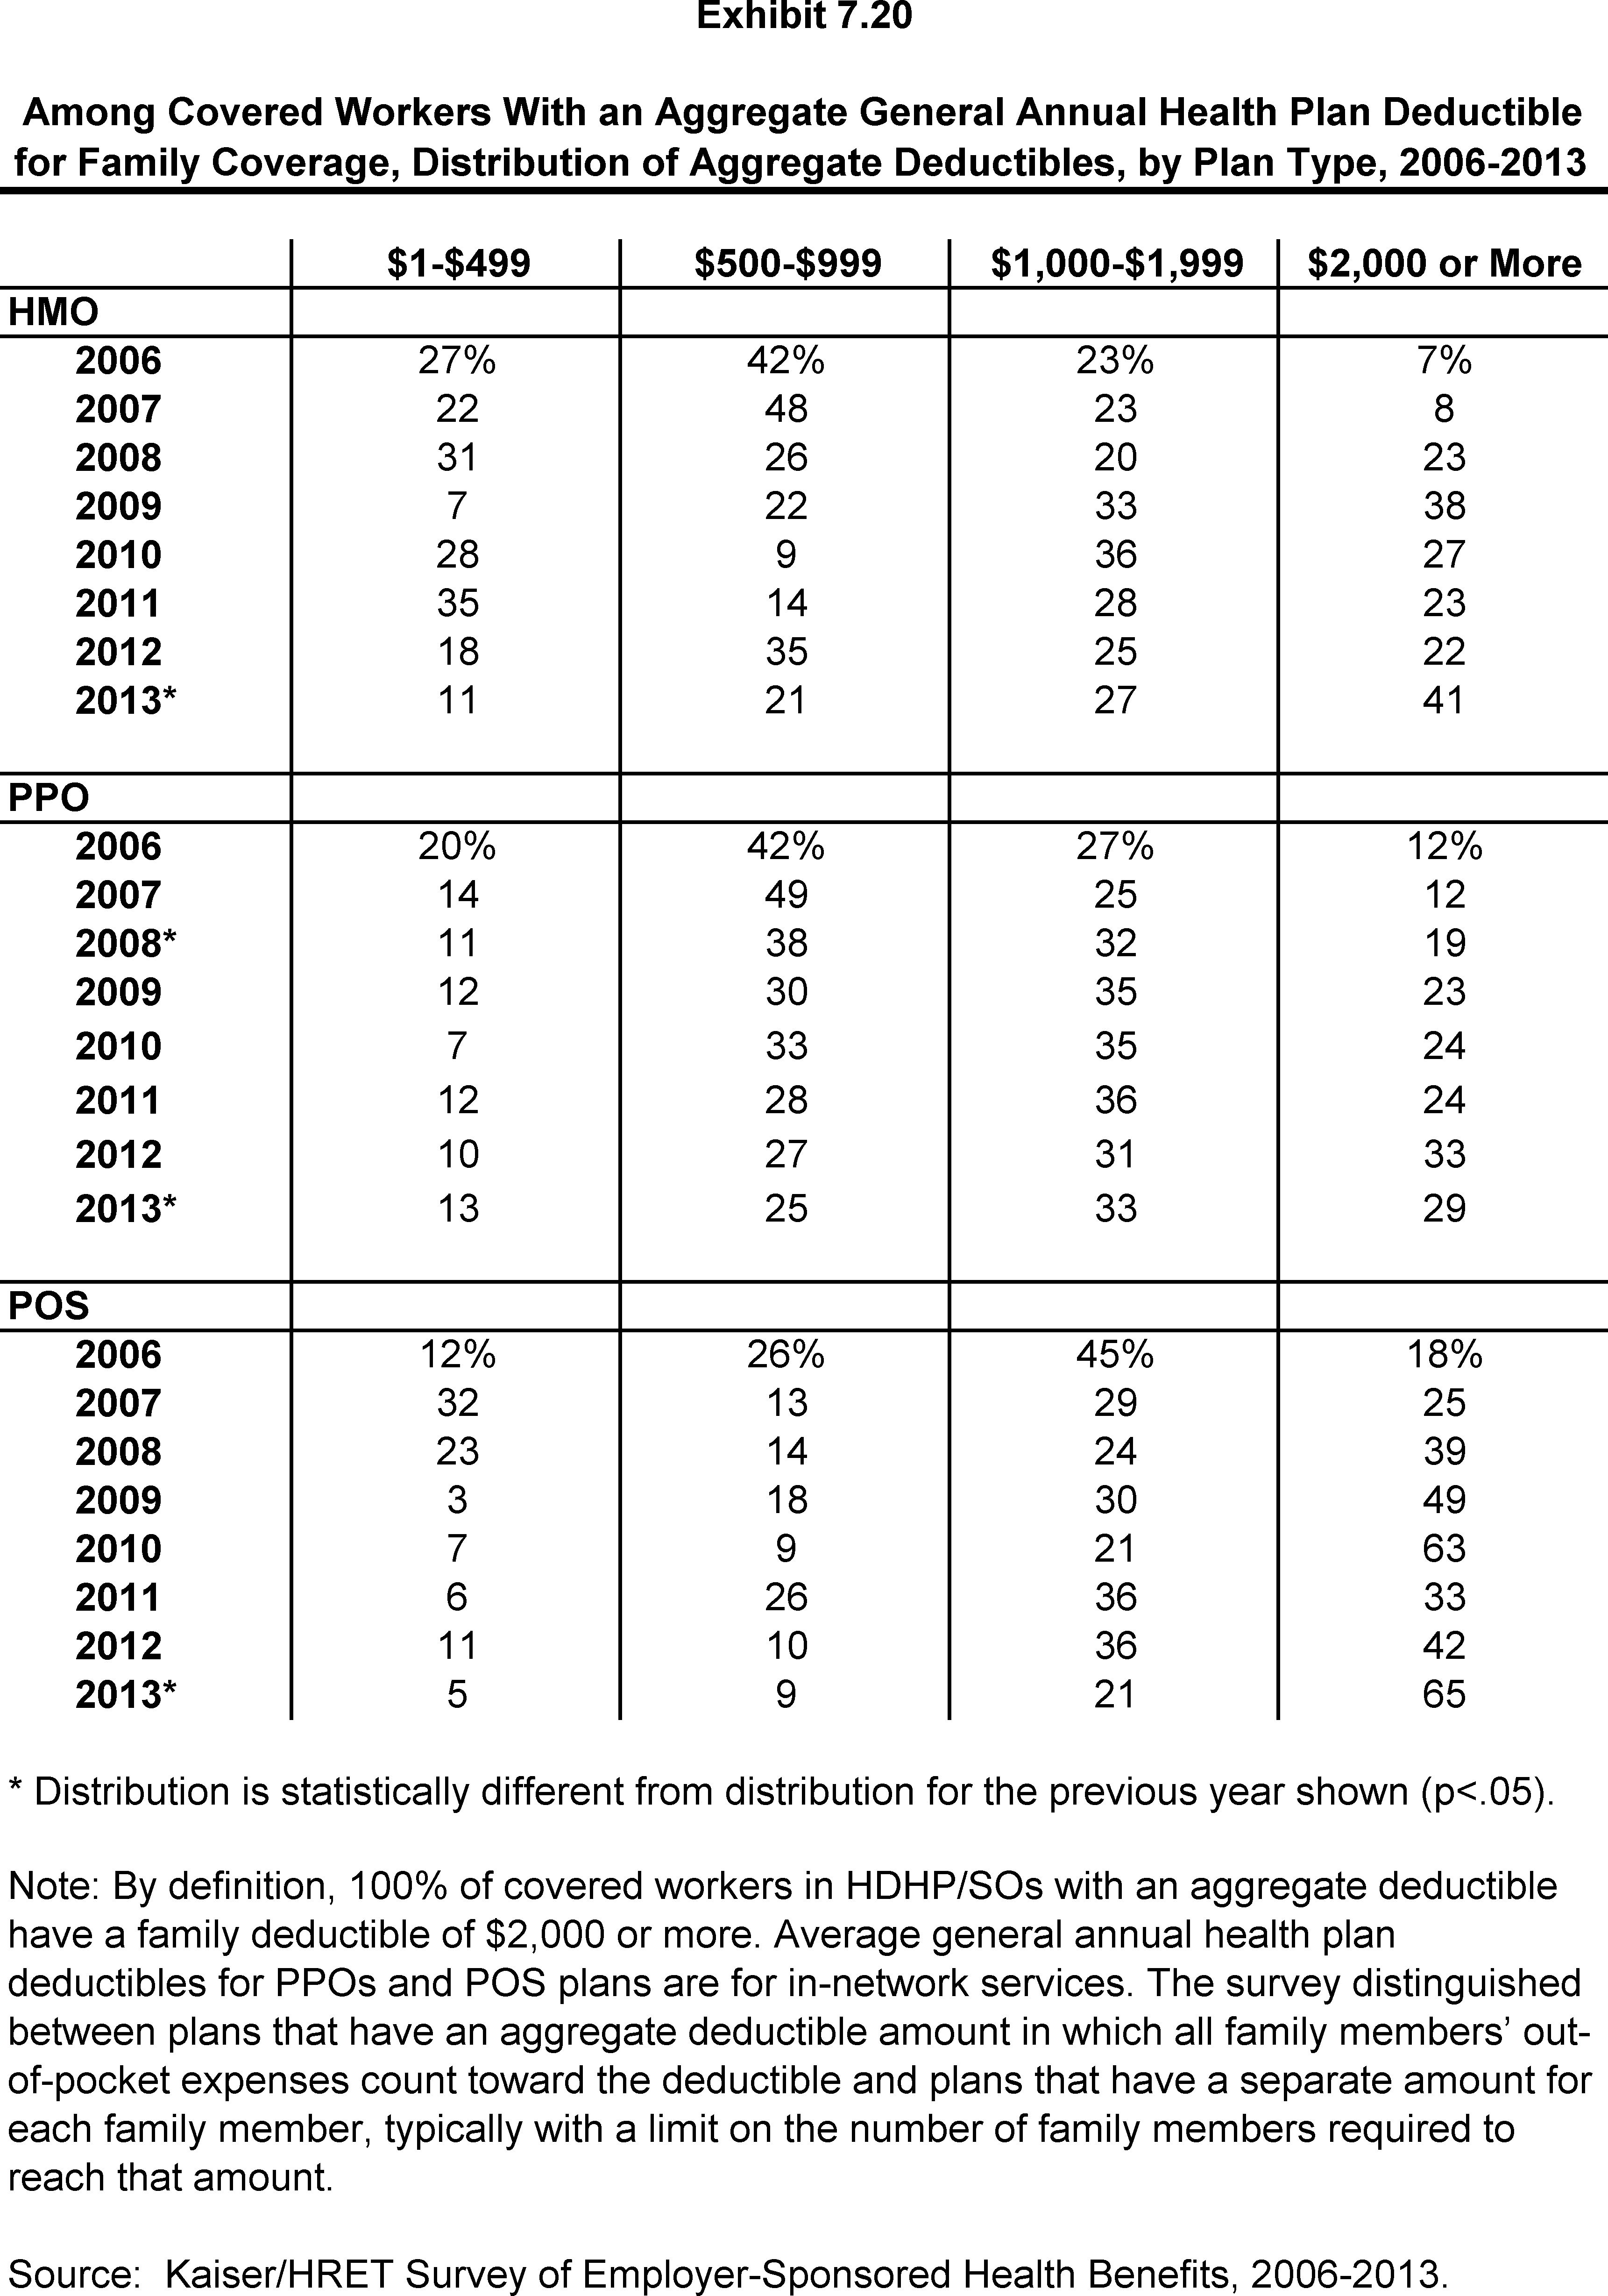
Among Covered Workers With an Aggregate General Annual Health Plan Deductible for Family Coverage, Distribution of Aggregate Deductibles, by Plan Type, 2006-2013

Among Covered Workers with a General Annual Health Plan Deductible, Percentage with Coverage for the Following Services Without Having to First Meet the Deductible, by Plan Type, 2013
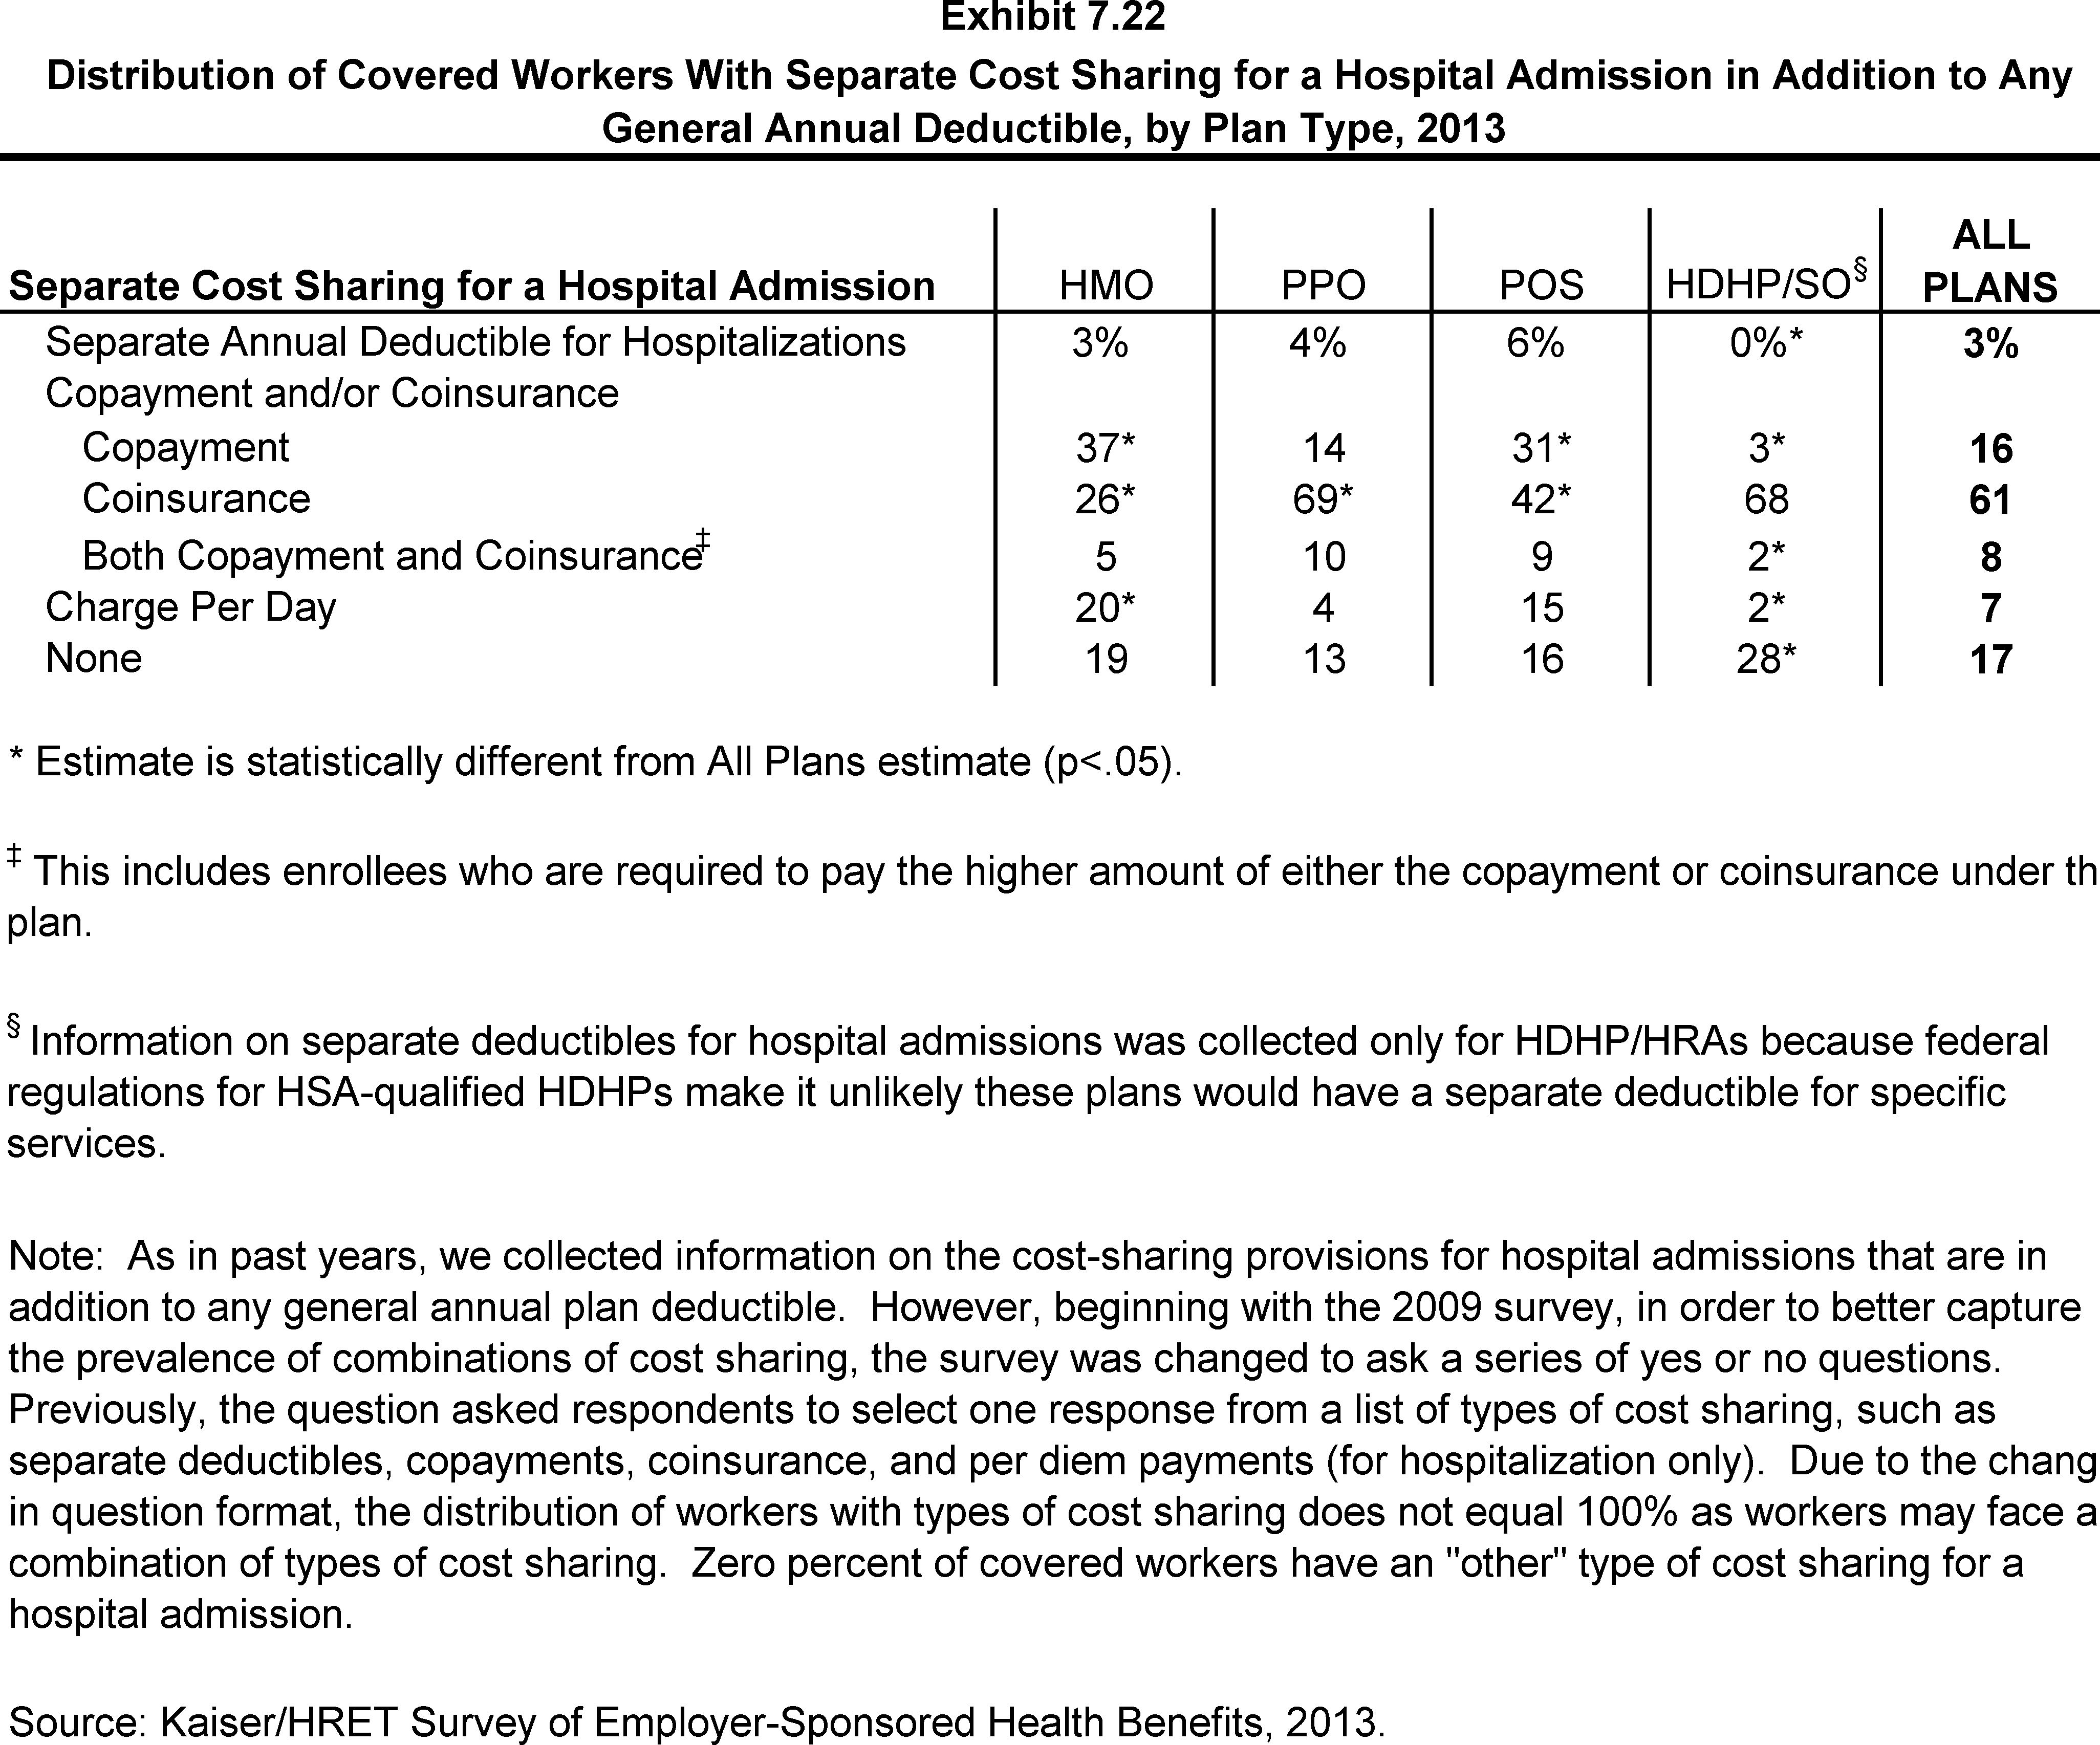
Distribution of Covered Workers With Separate Cost Sharing for a Hospital Admission in Addition to Any General Annual Deductible, by Plan Type, 2013
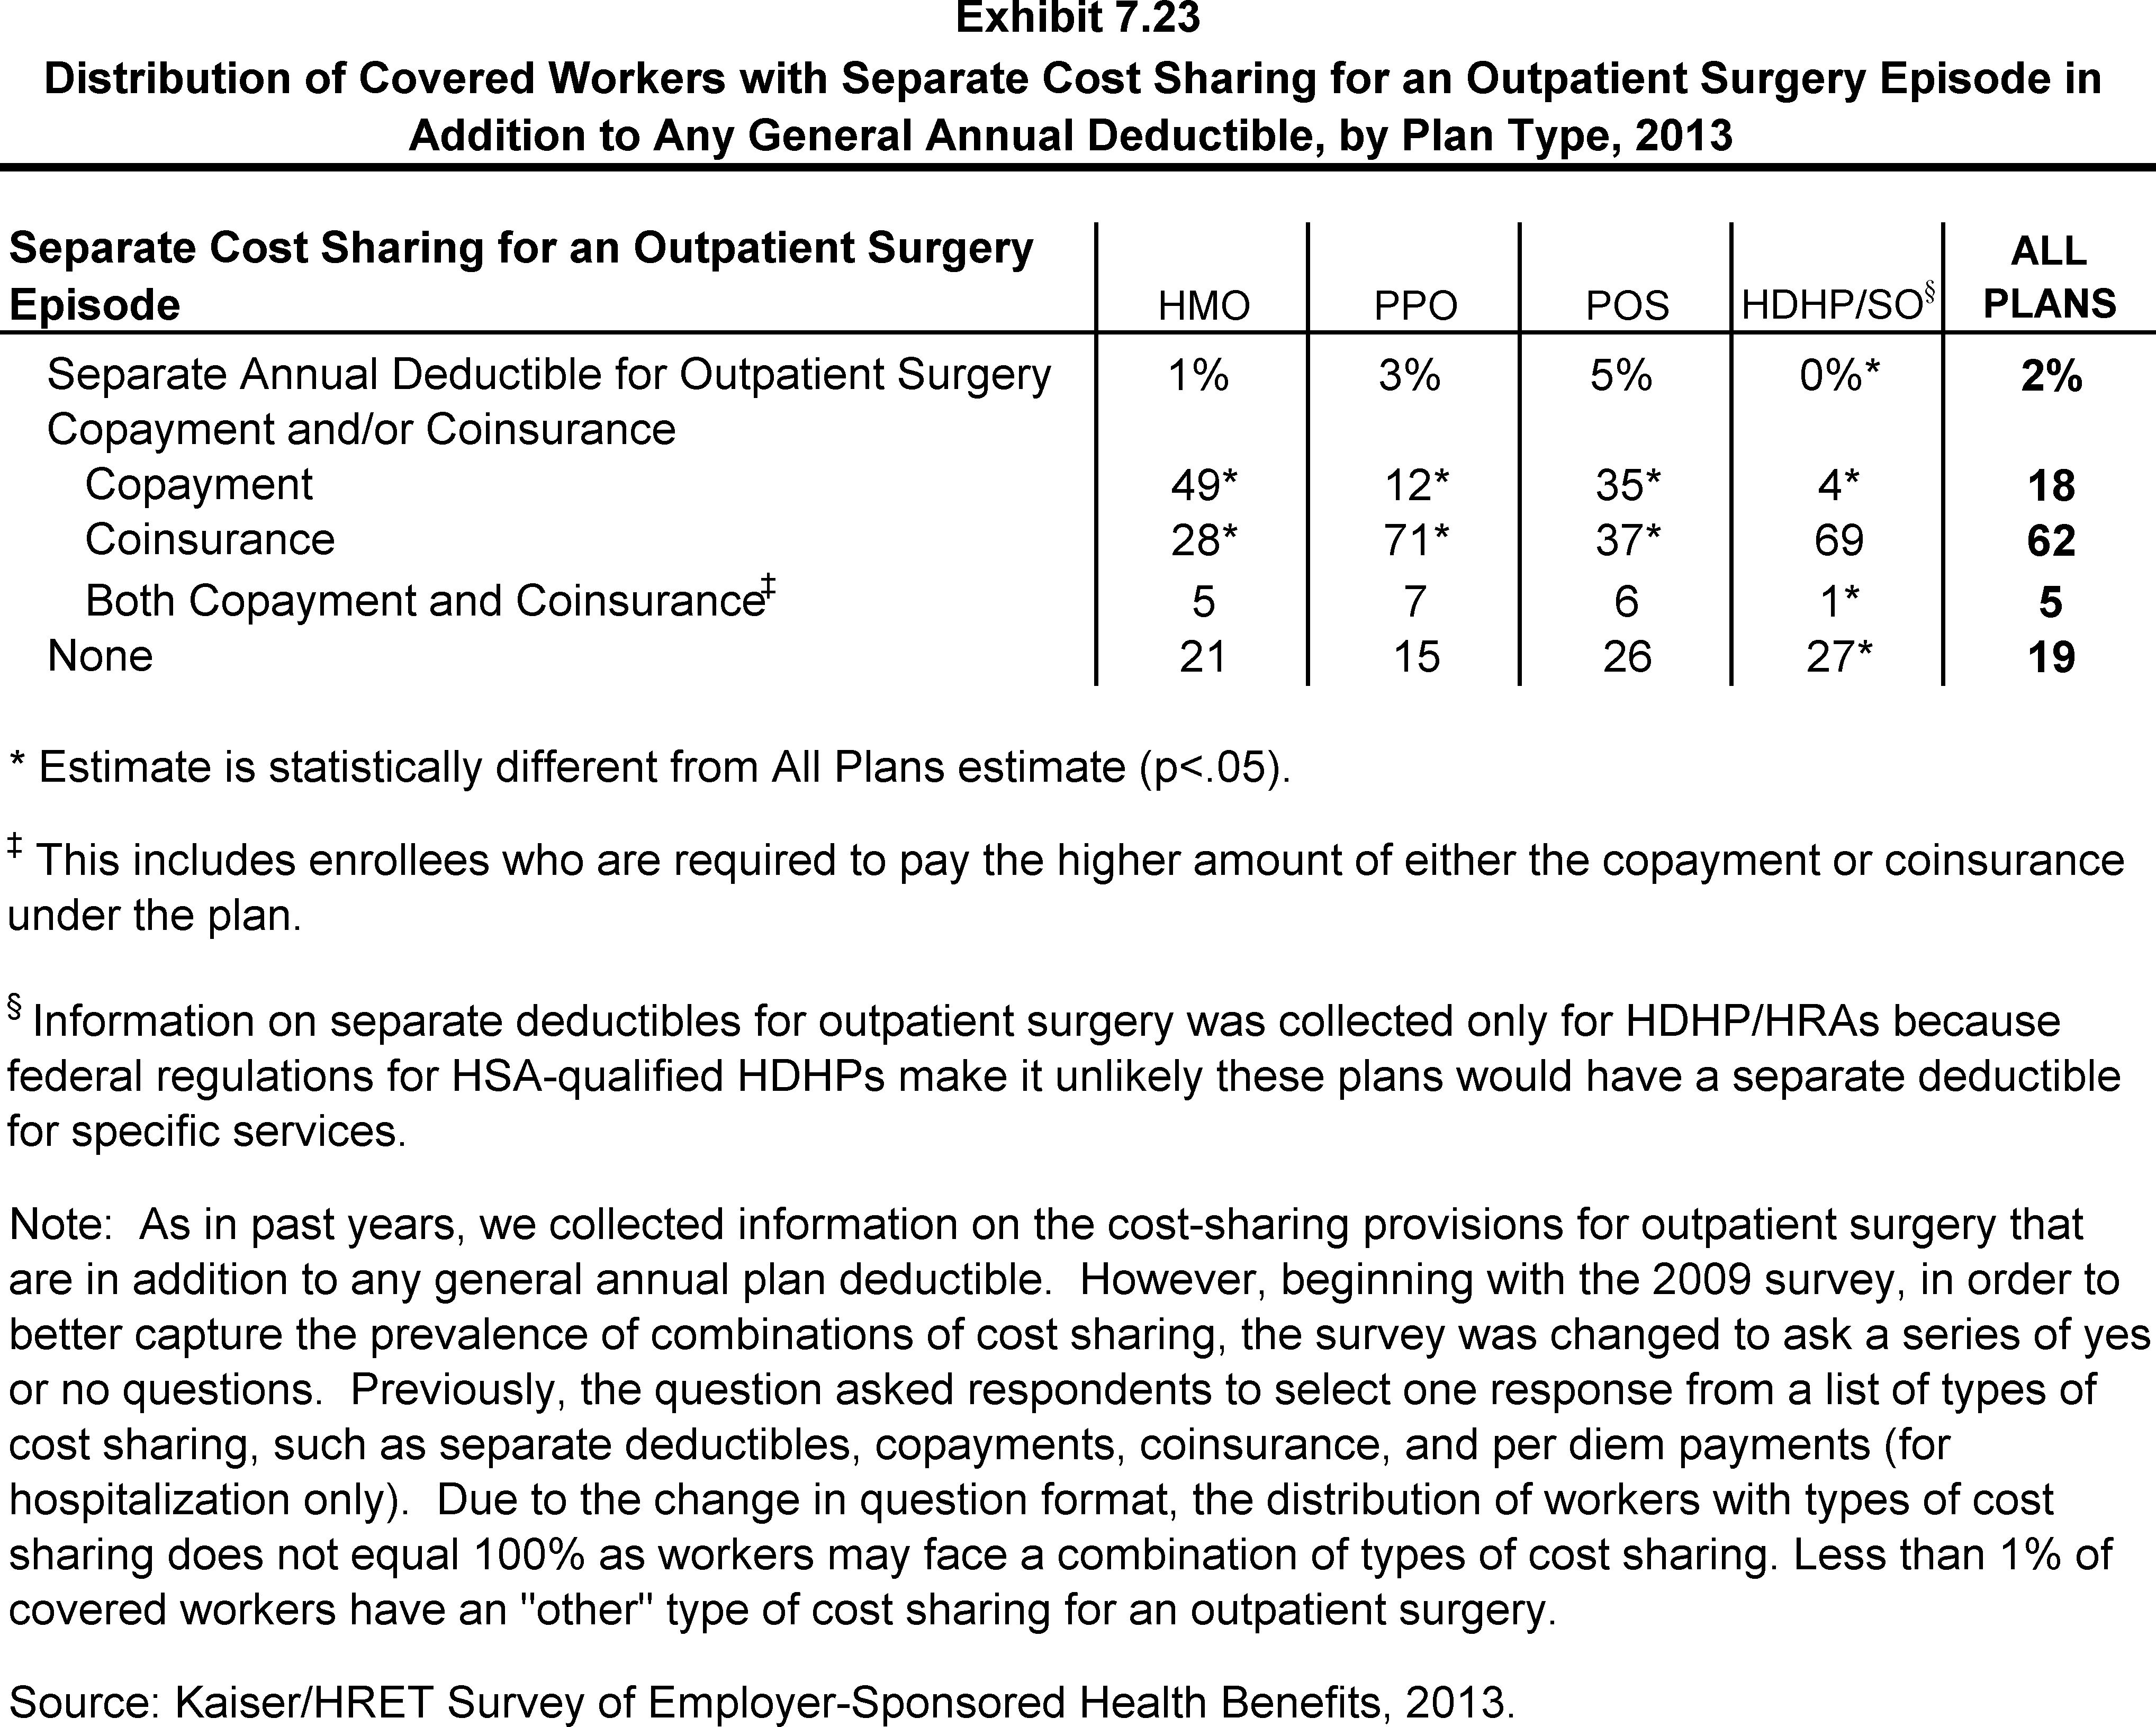
Distribution of Covered Workers with Separate Cost Sharing for an Outpatient Surgery Episode in Addition to Any General Annual Deductible, by Plan Type, 2013
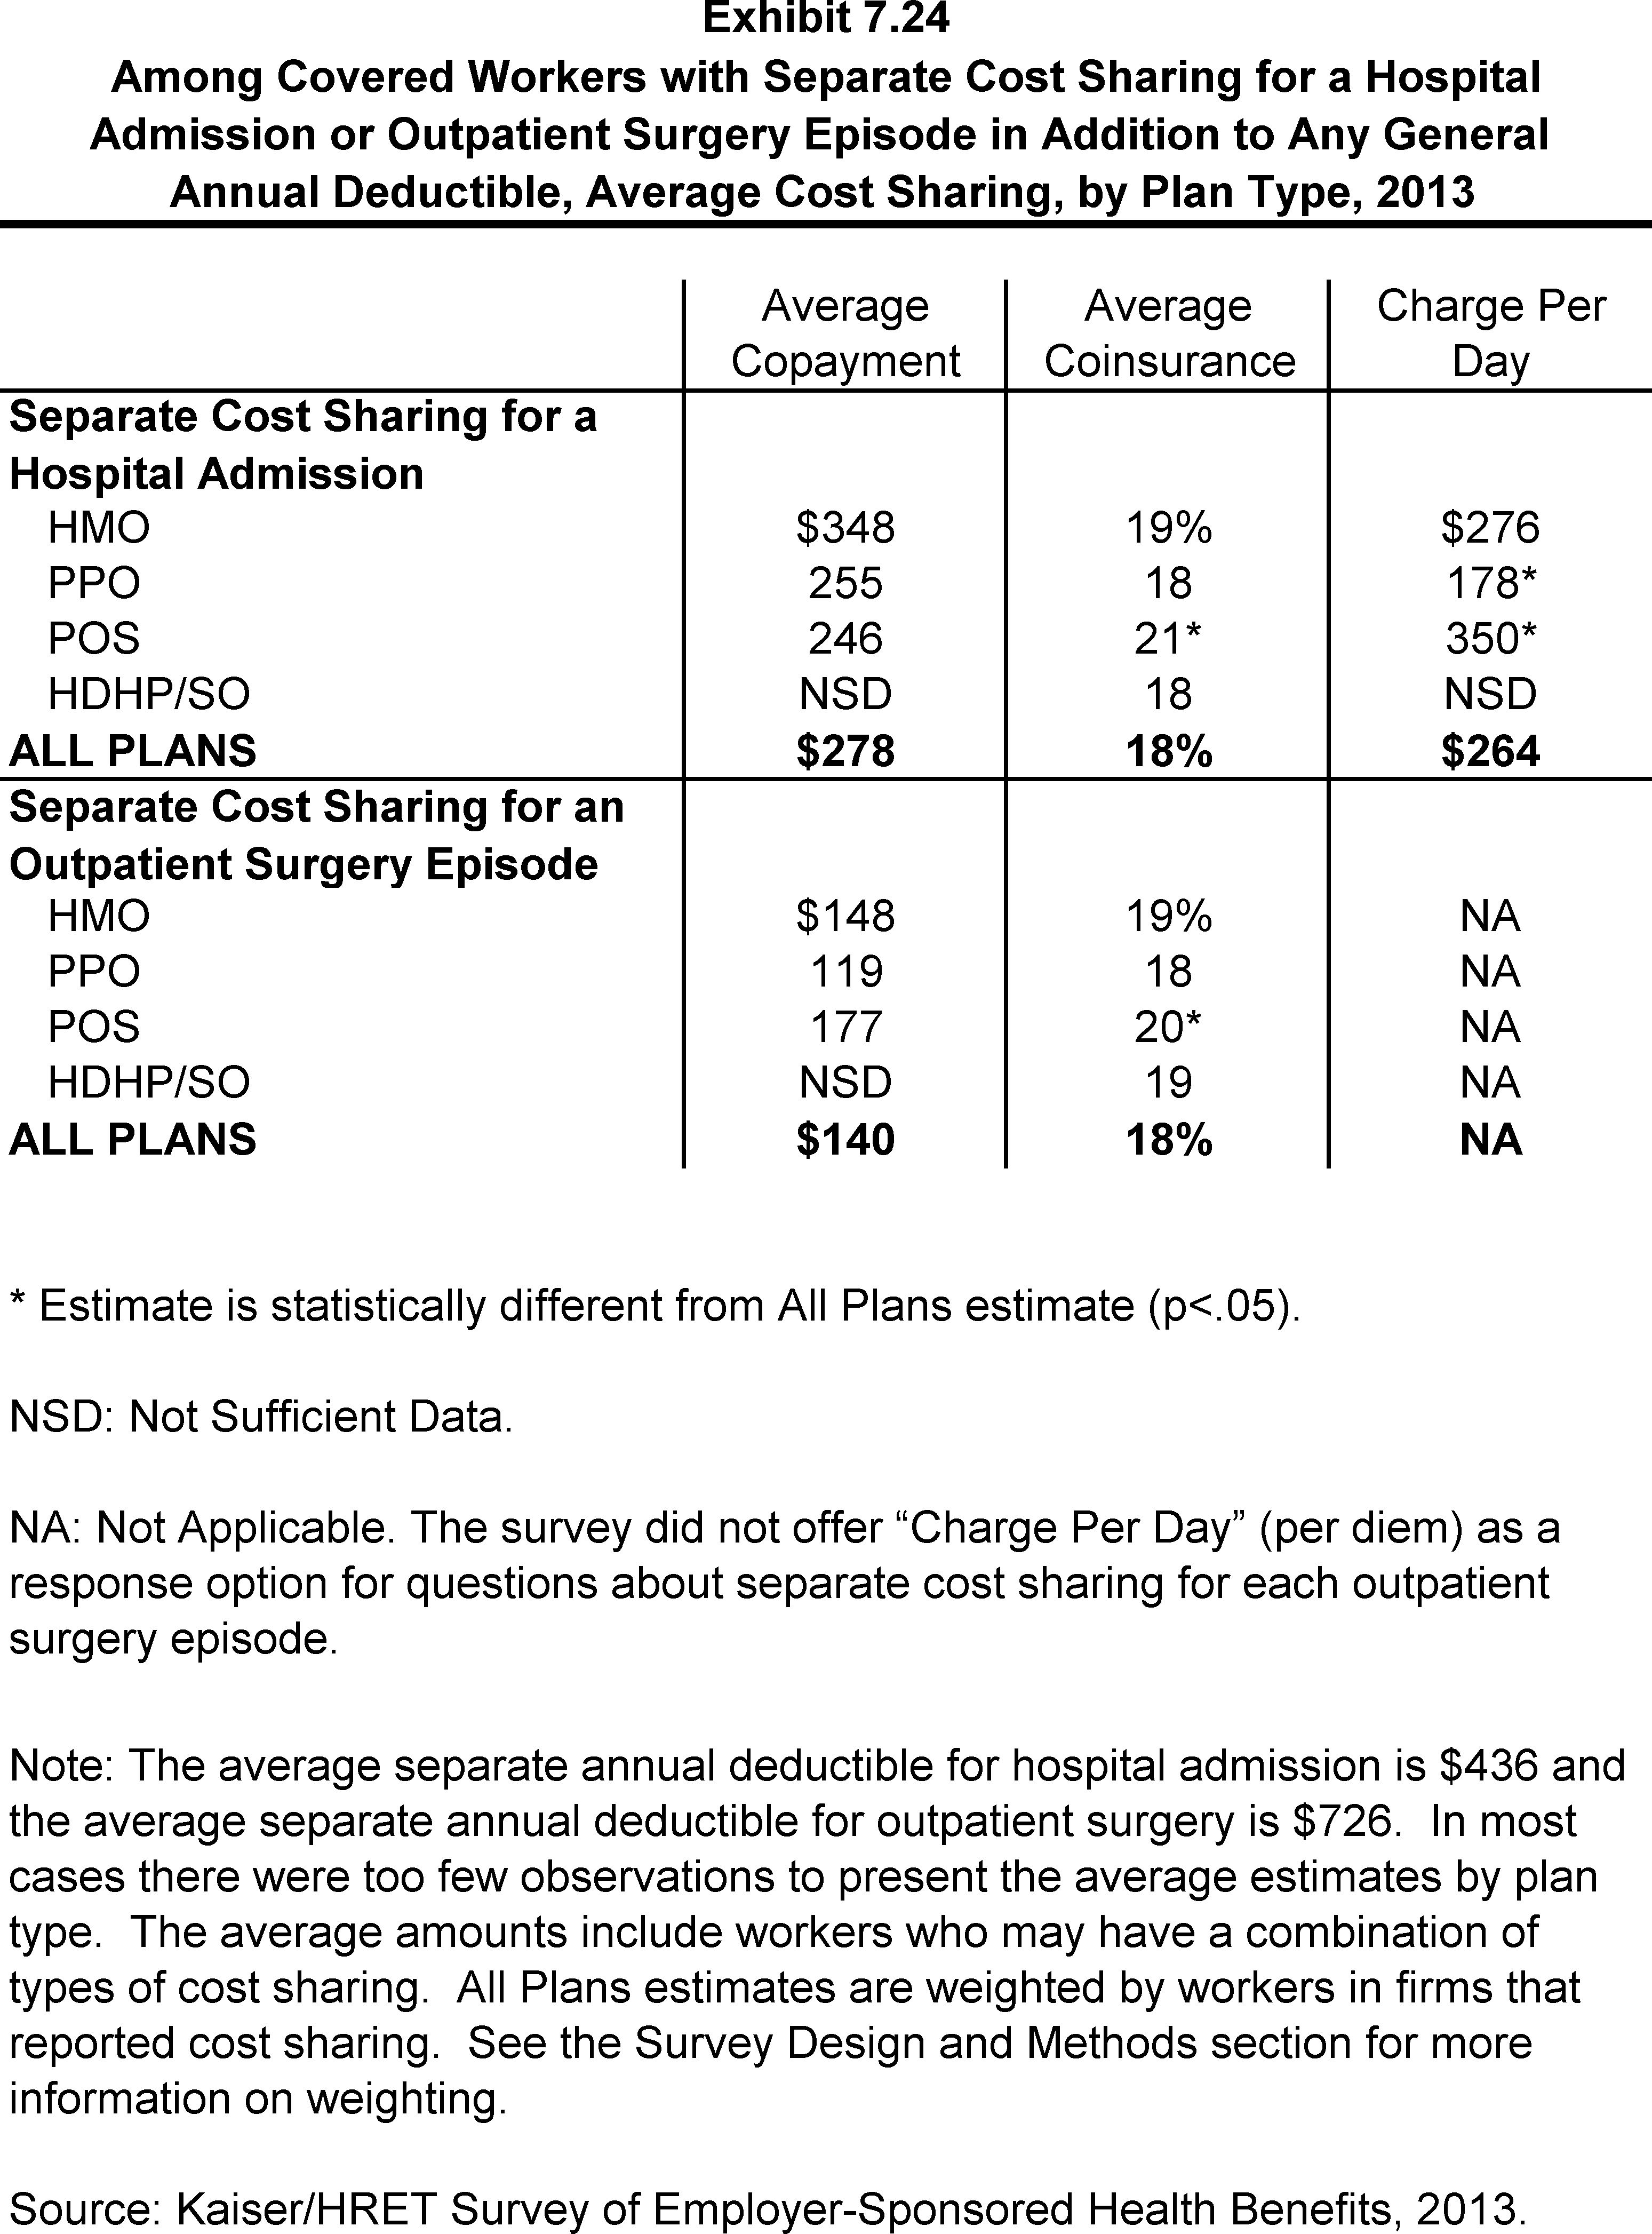
Among Covered Workers with Separate Cost Sharing for a Hospital Admission or Outpatient Surgery Episode in Addition to Any General Annual Deductible, Average Cost Sharing, by Plan Type, 2013
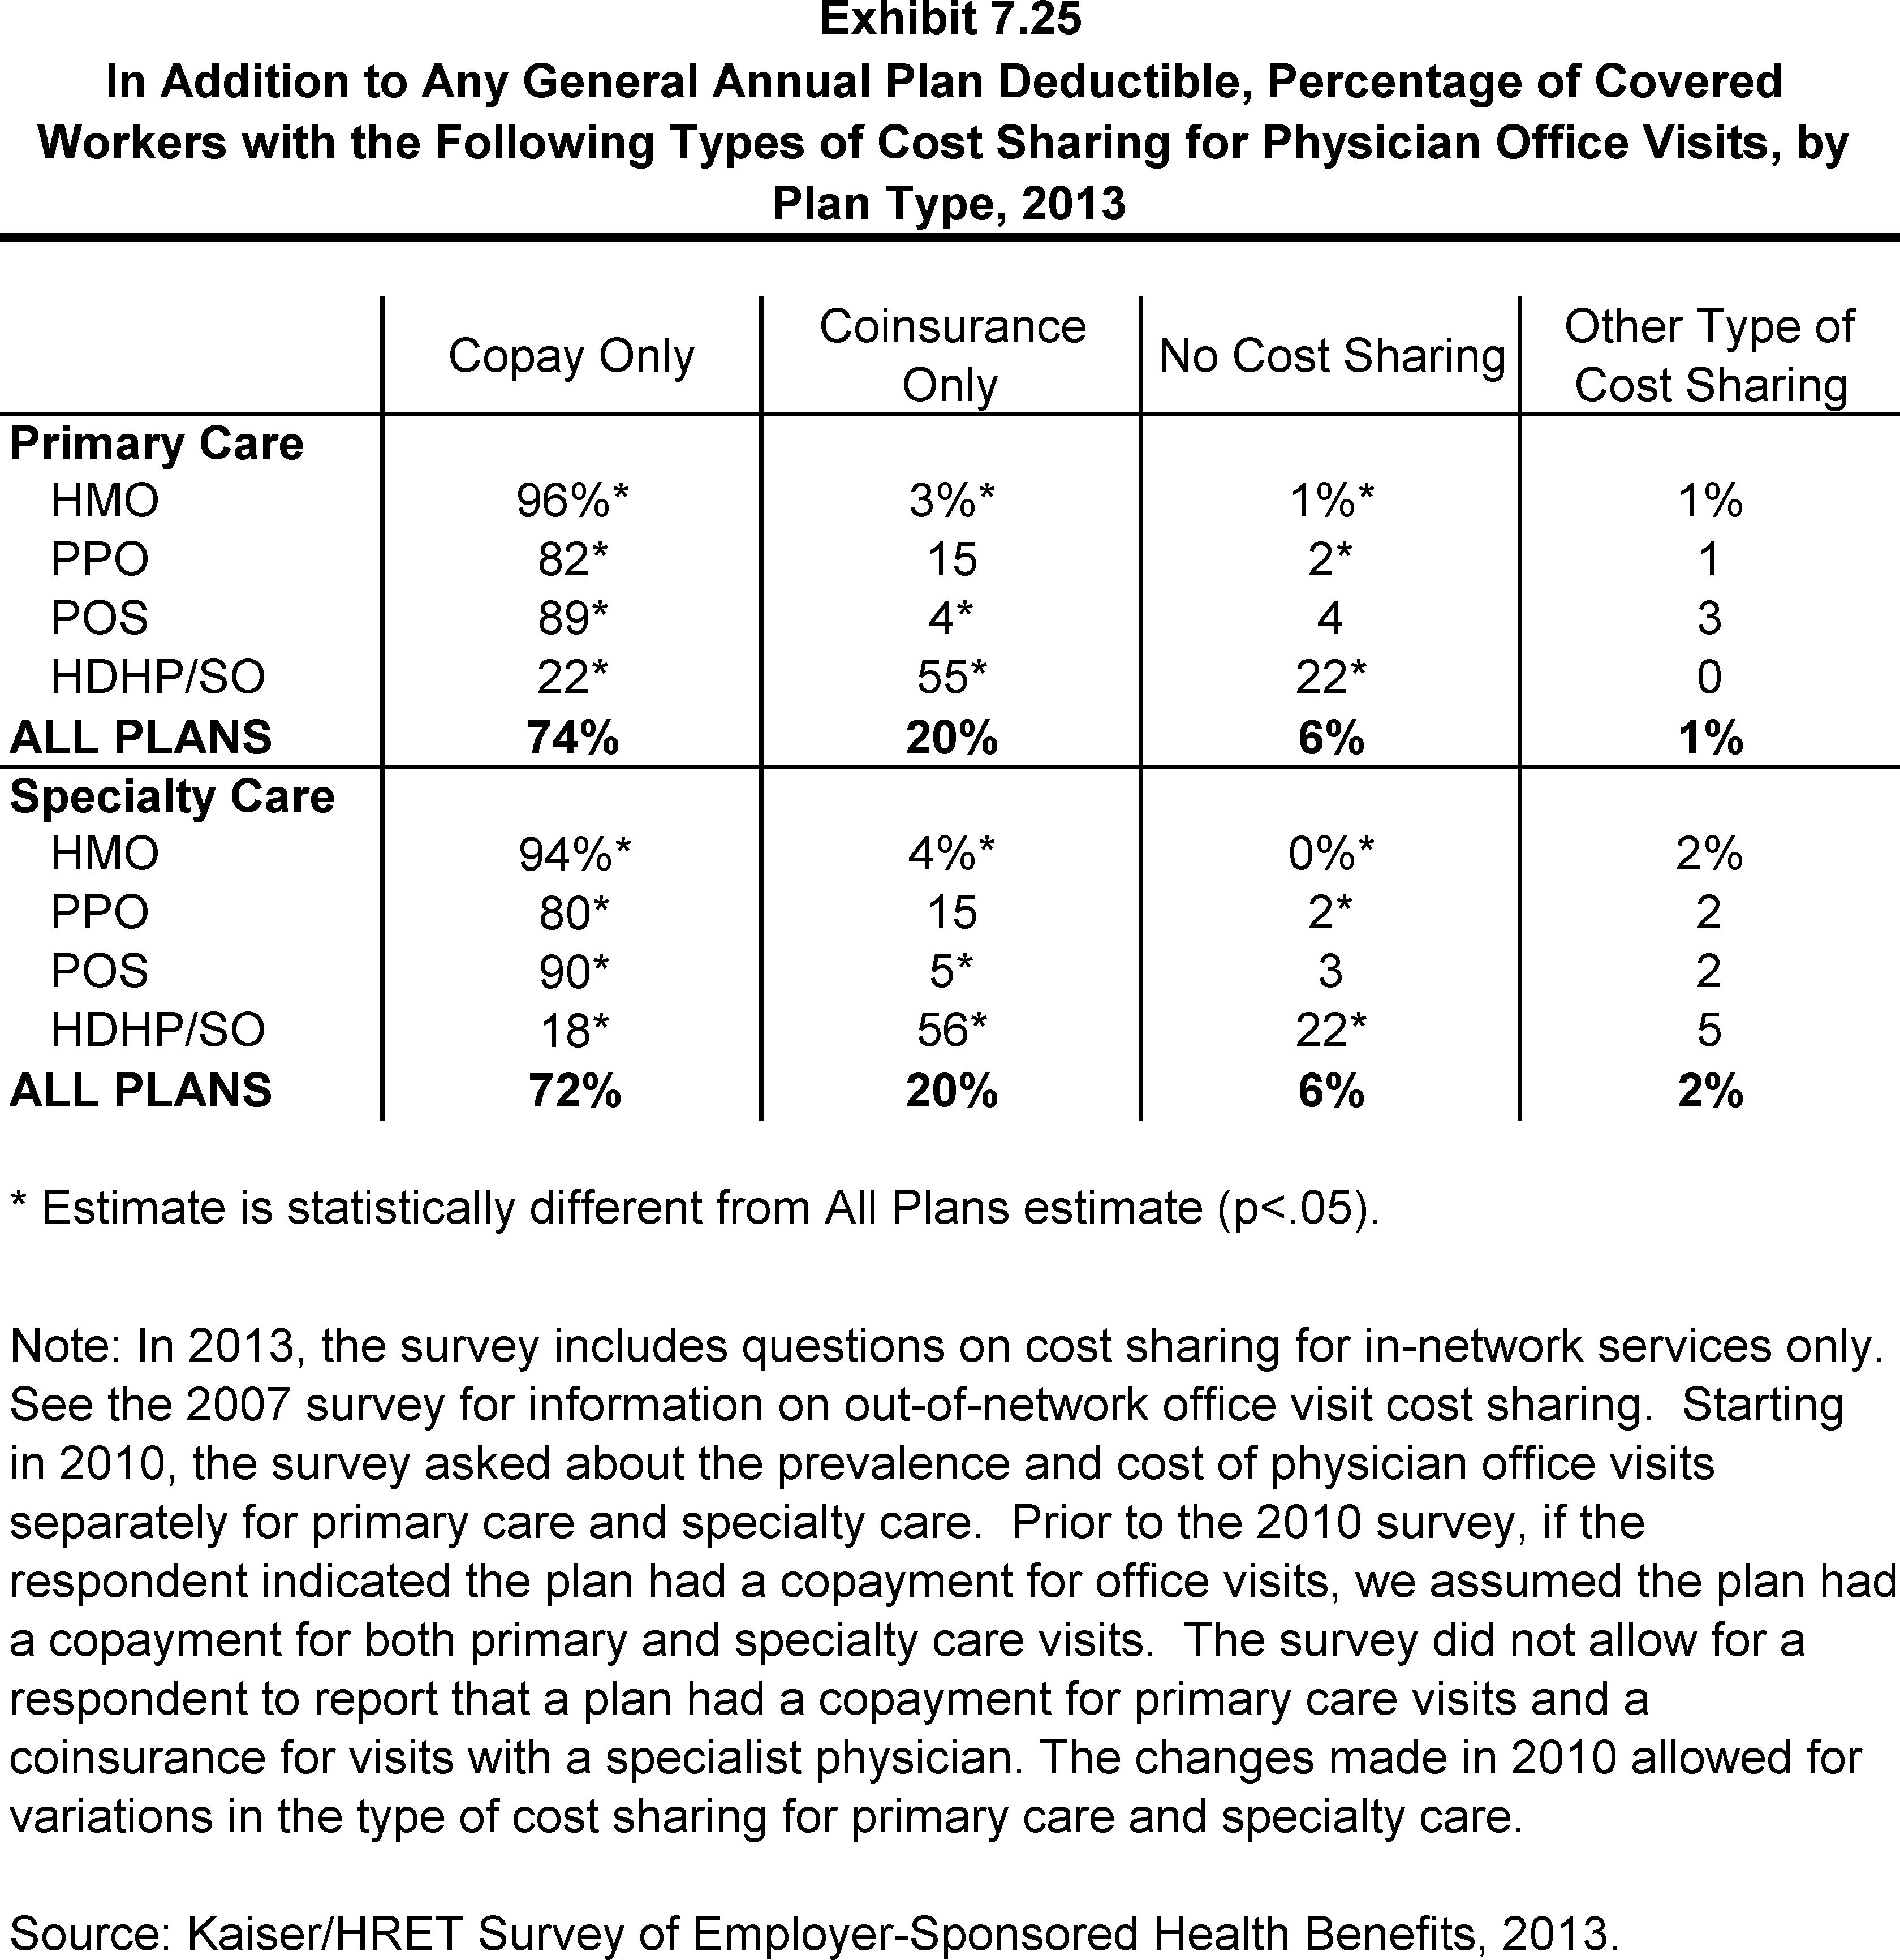
In Addition to Any General Annual Plan Deductible, Percentage of Covered Workers with the Following Types of Cost Sharing for Physician Office Visits, by Plan Type, 2013
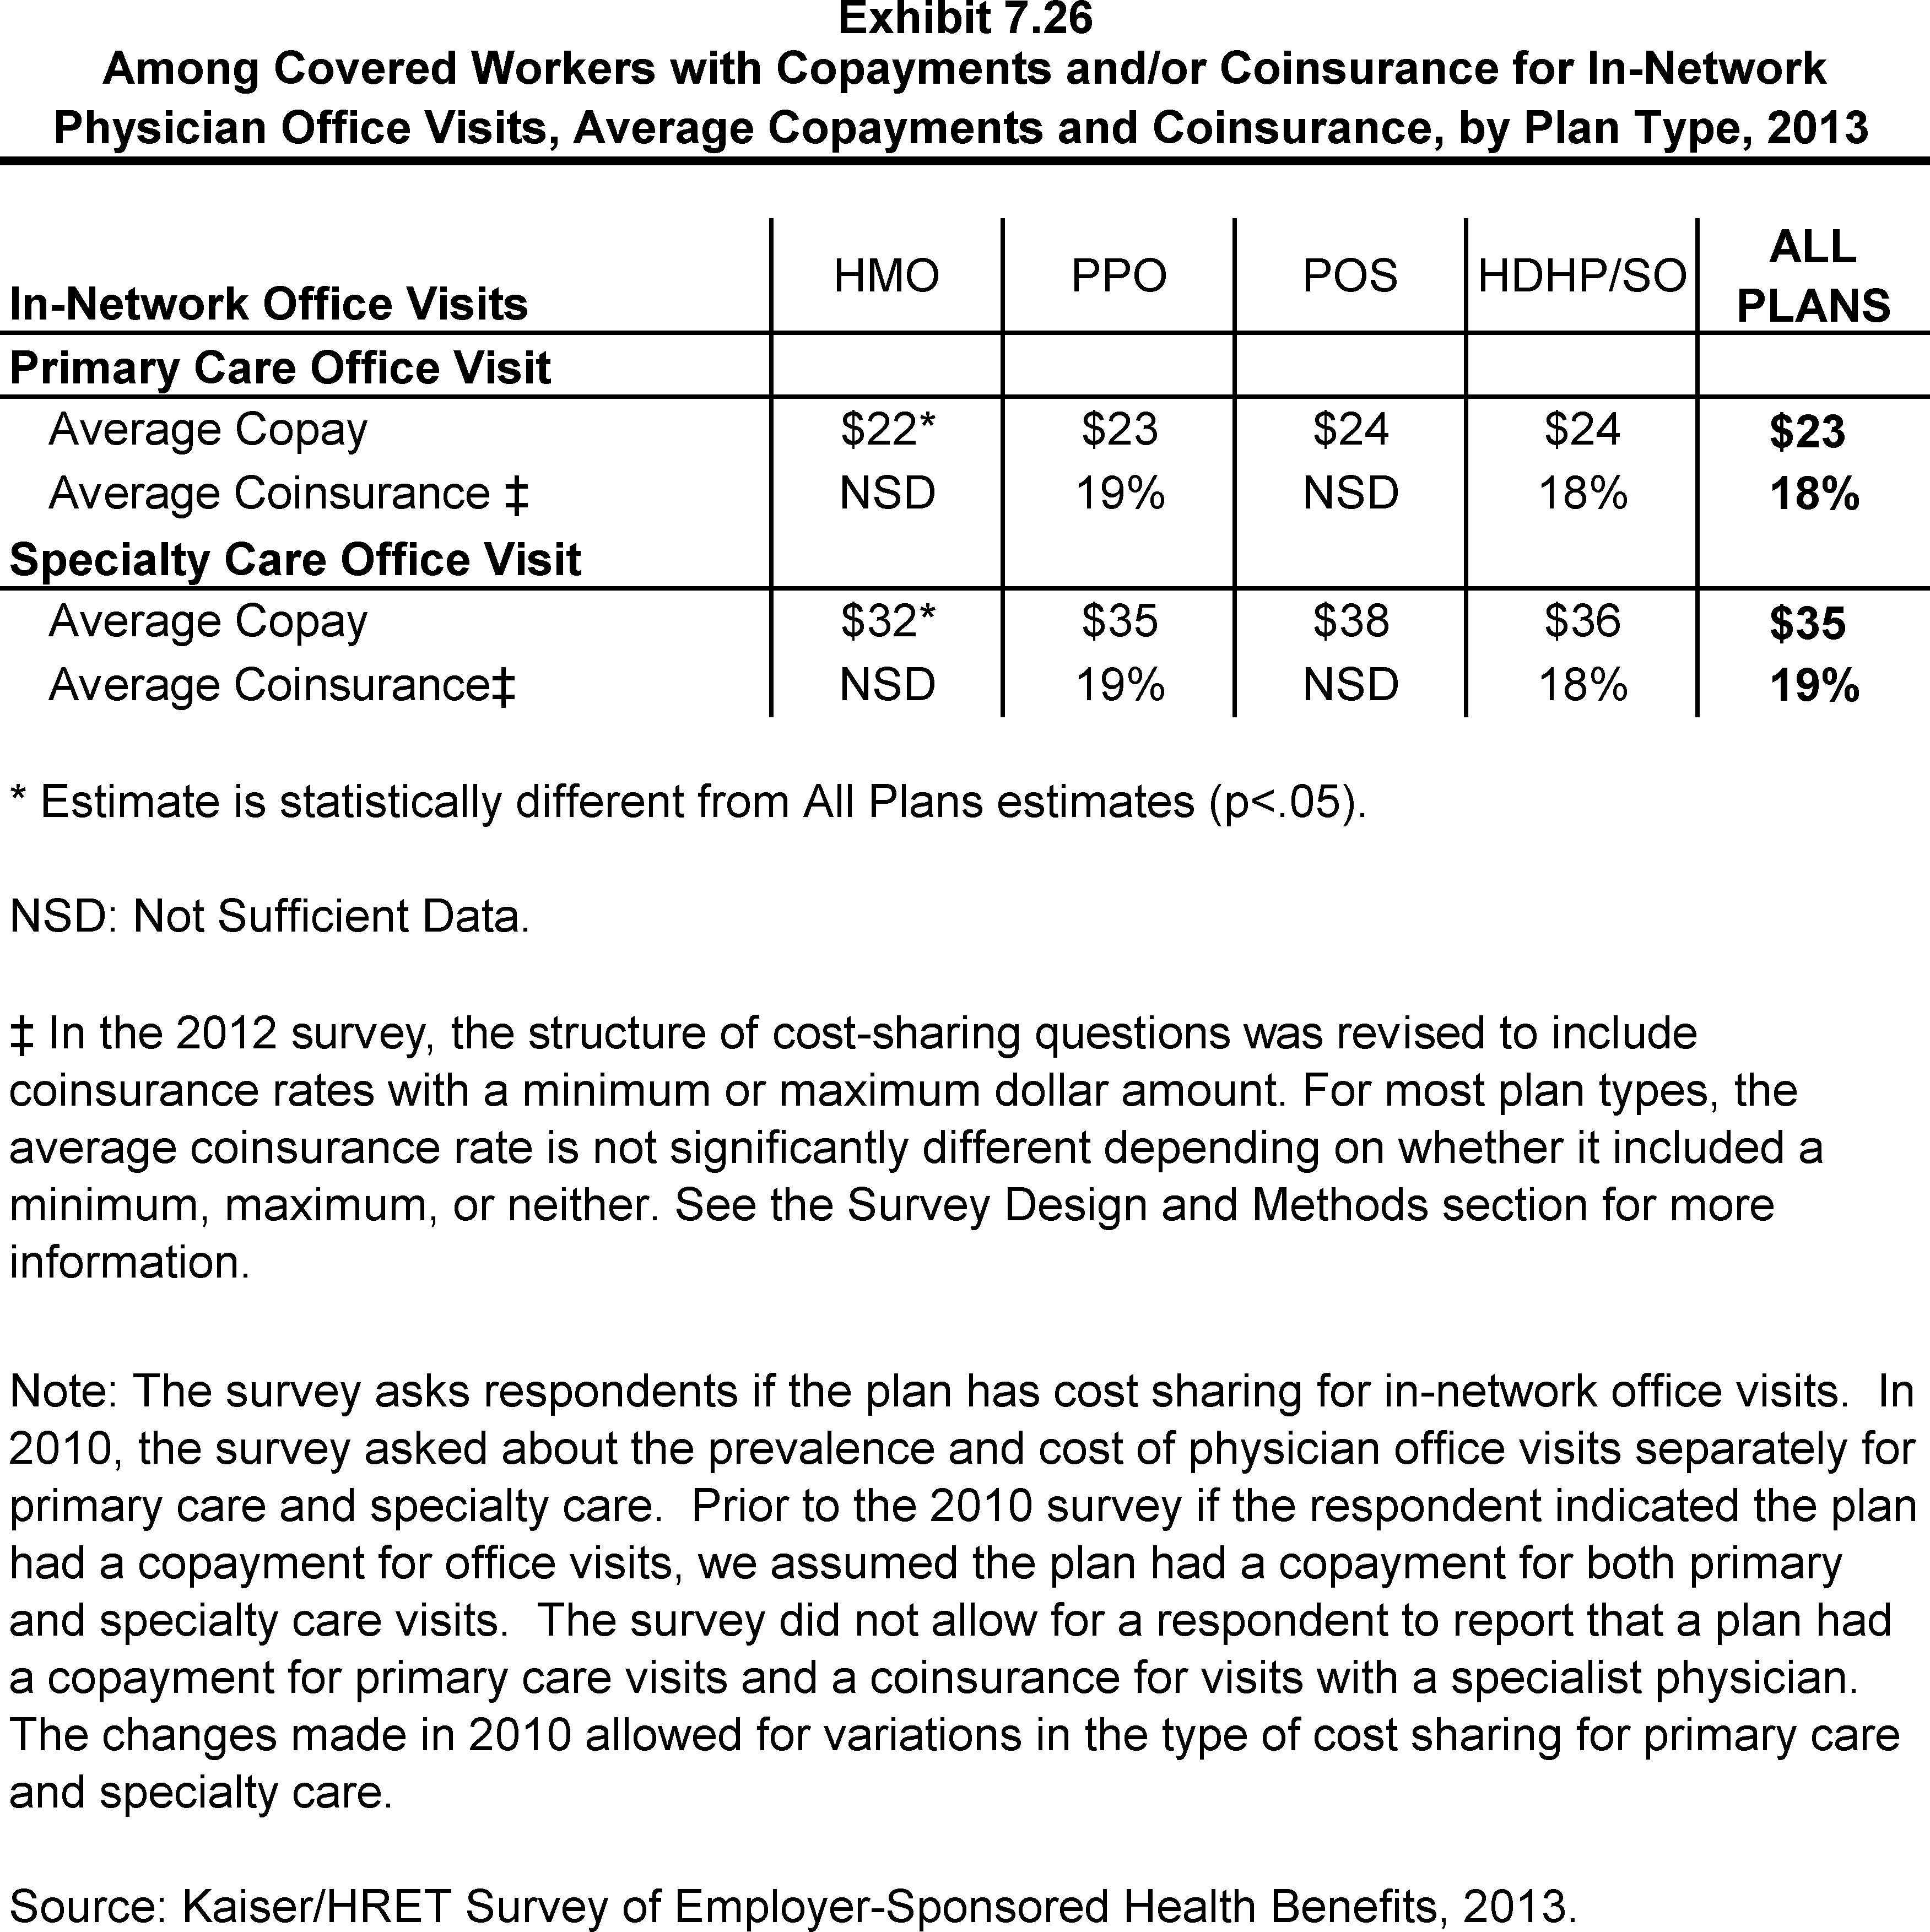
Among Covered Workers with Copayments and/or Coinsurance for In-Network Physician Office Visits, Average Copayments and Coinsurance, by Plan Type, 2013
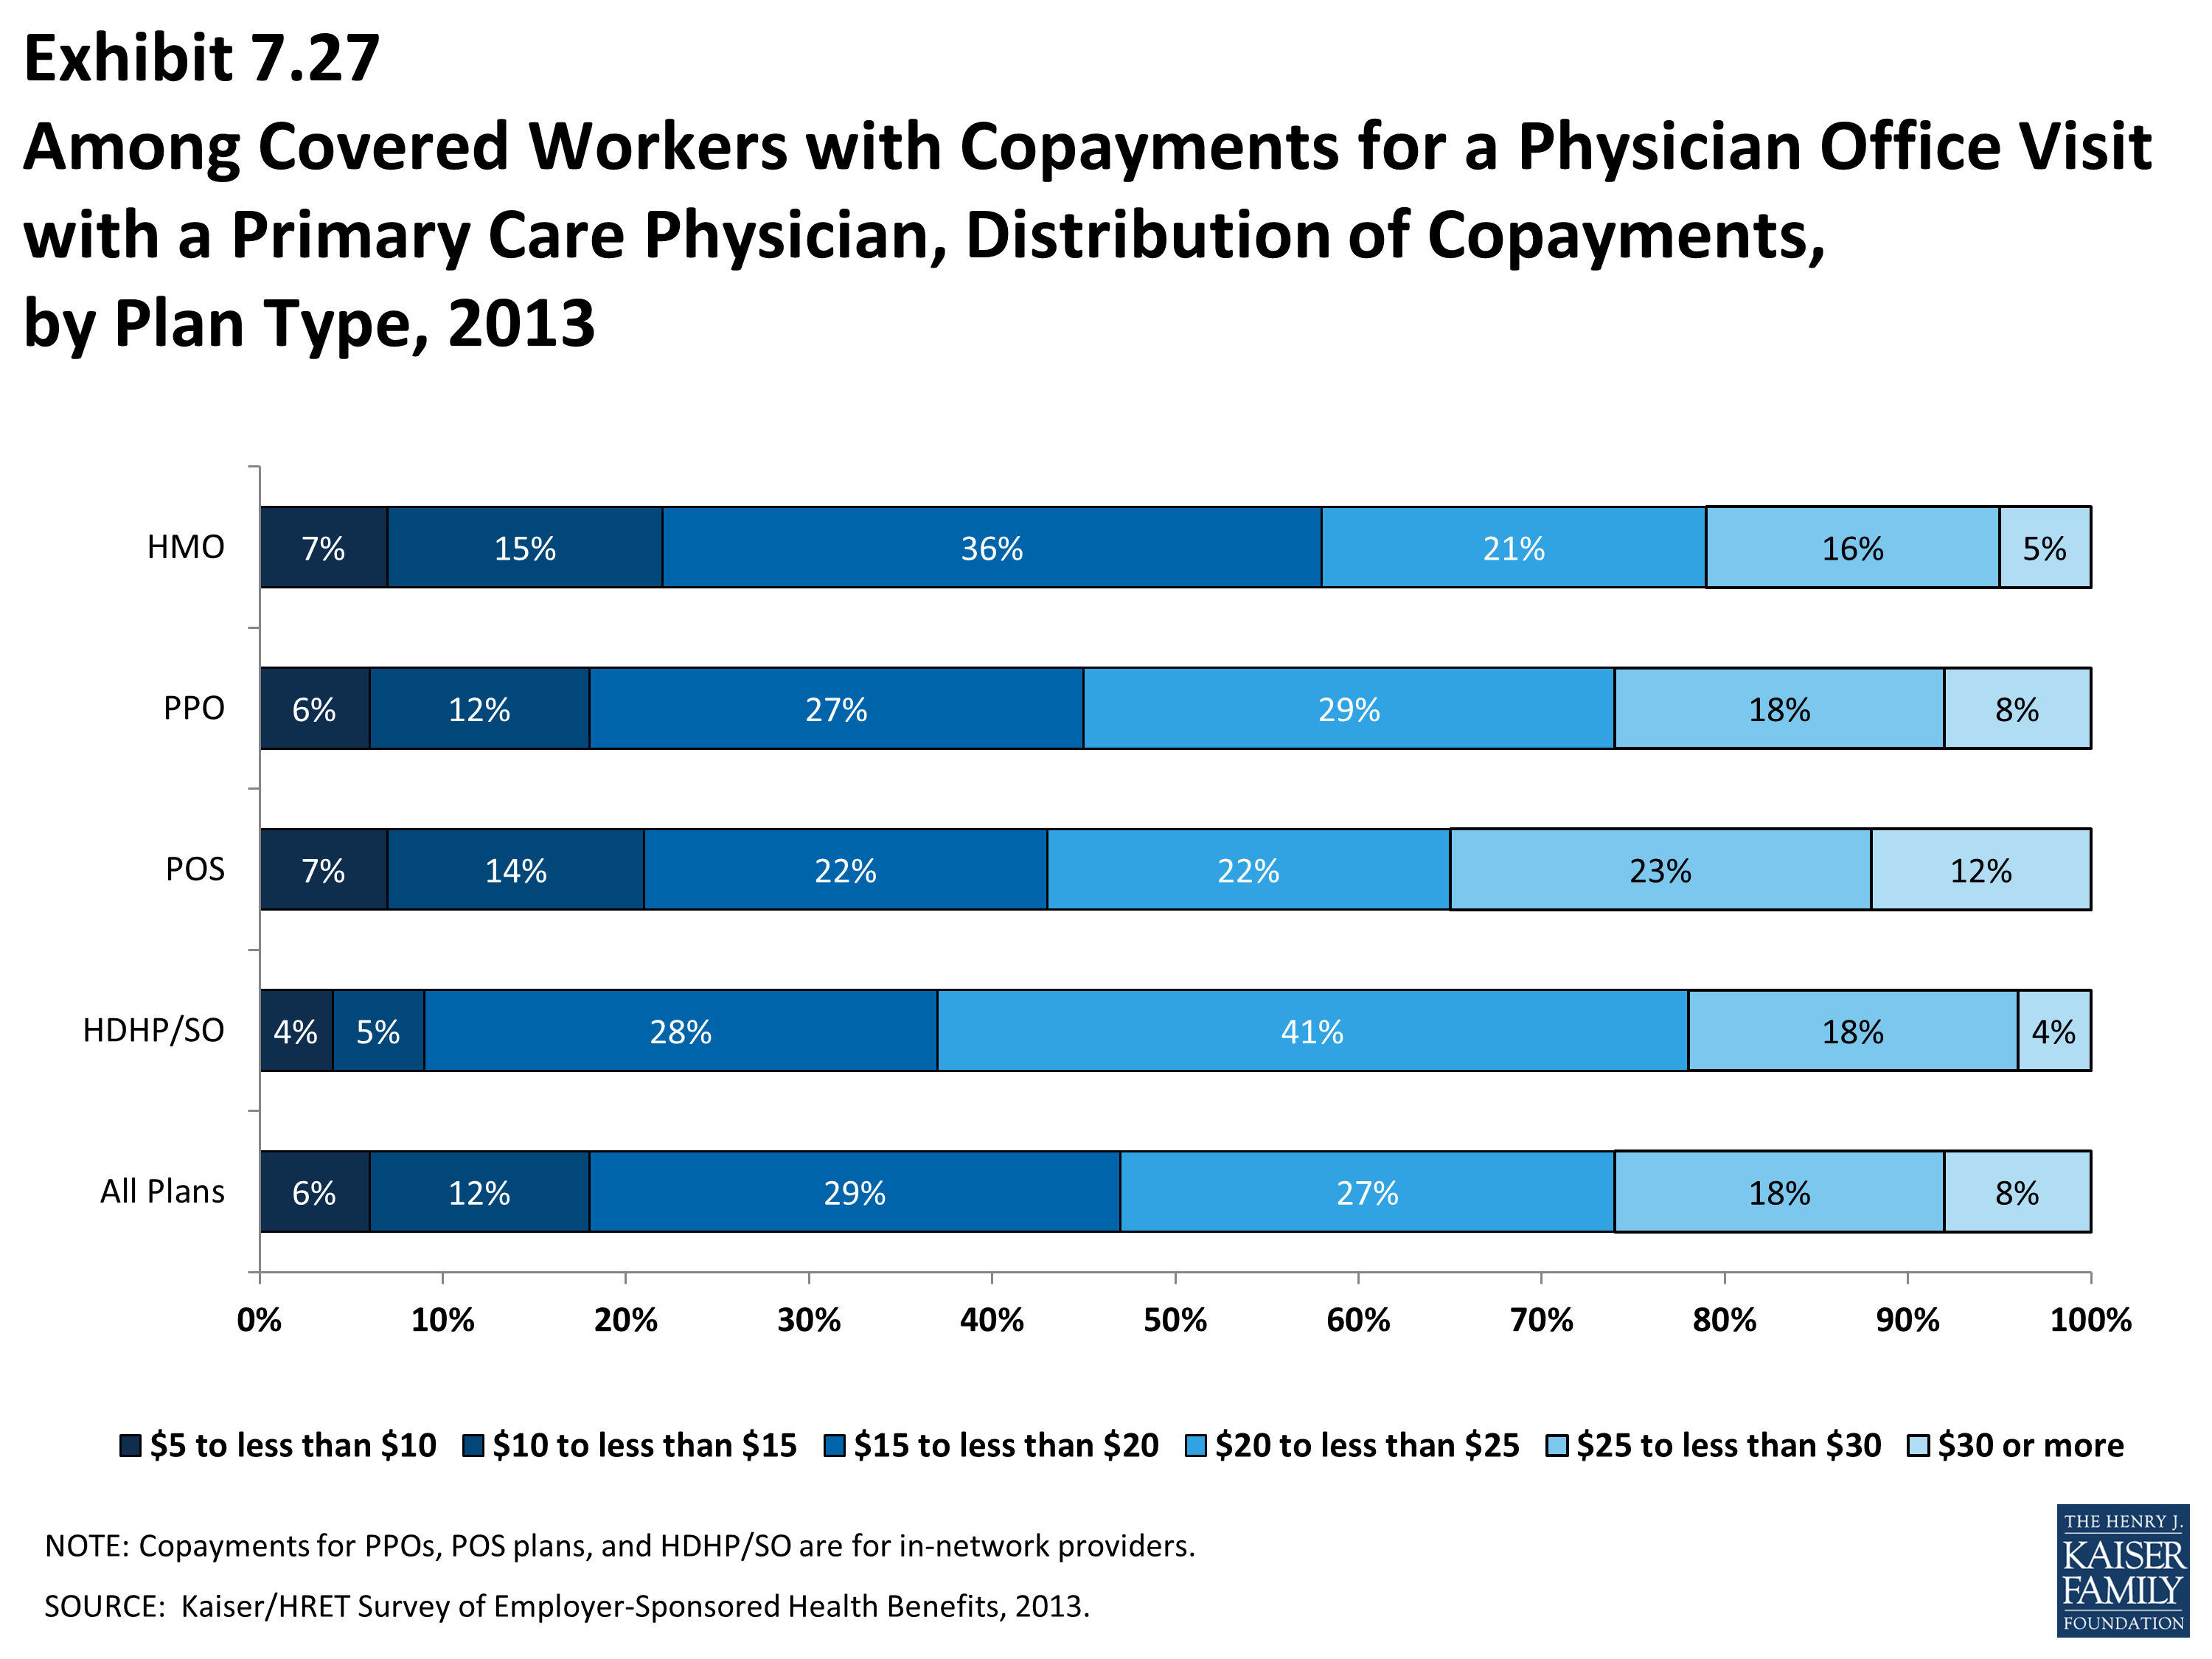
Among Covered Workers with Copayments for a Physician Office Visit with a Primary Care Physician, Distribution of Copayments, by Plan Type, 2013
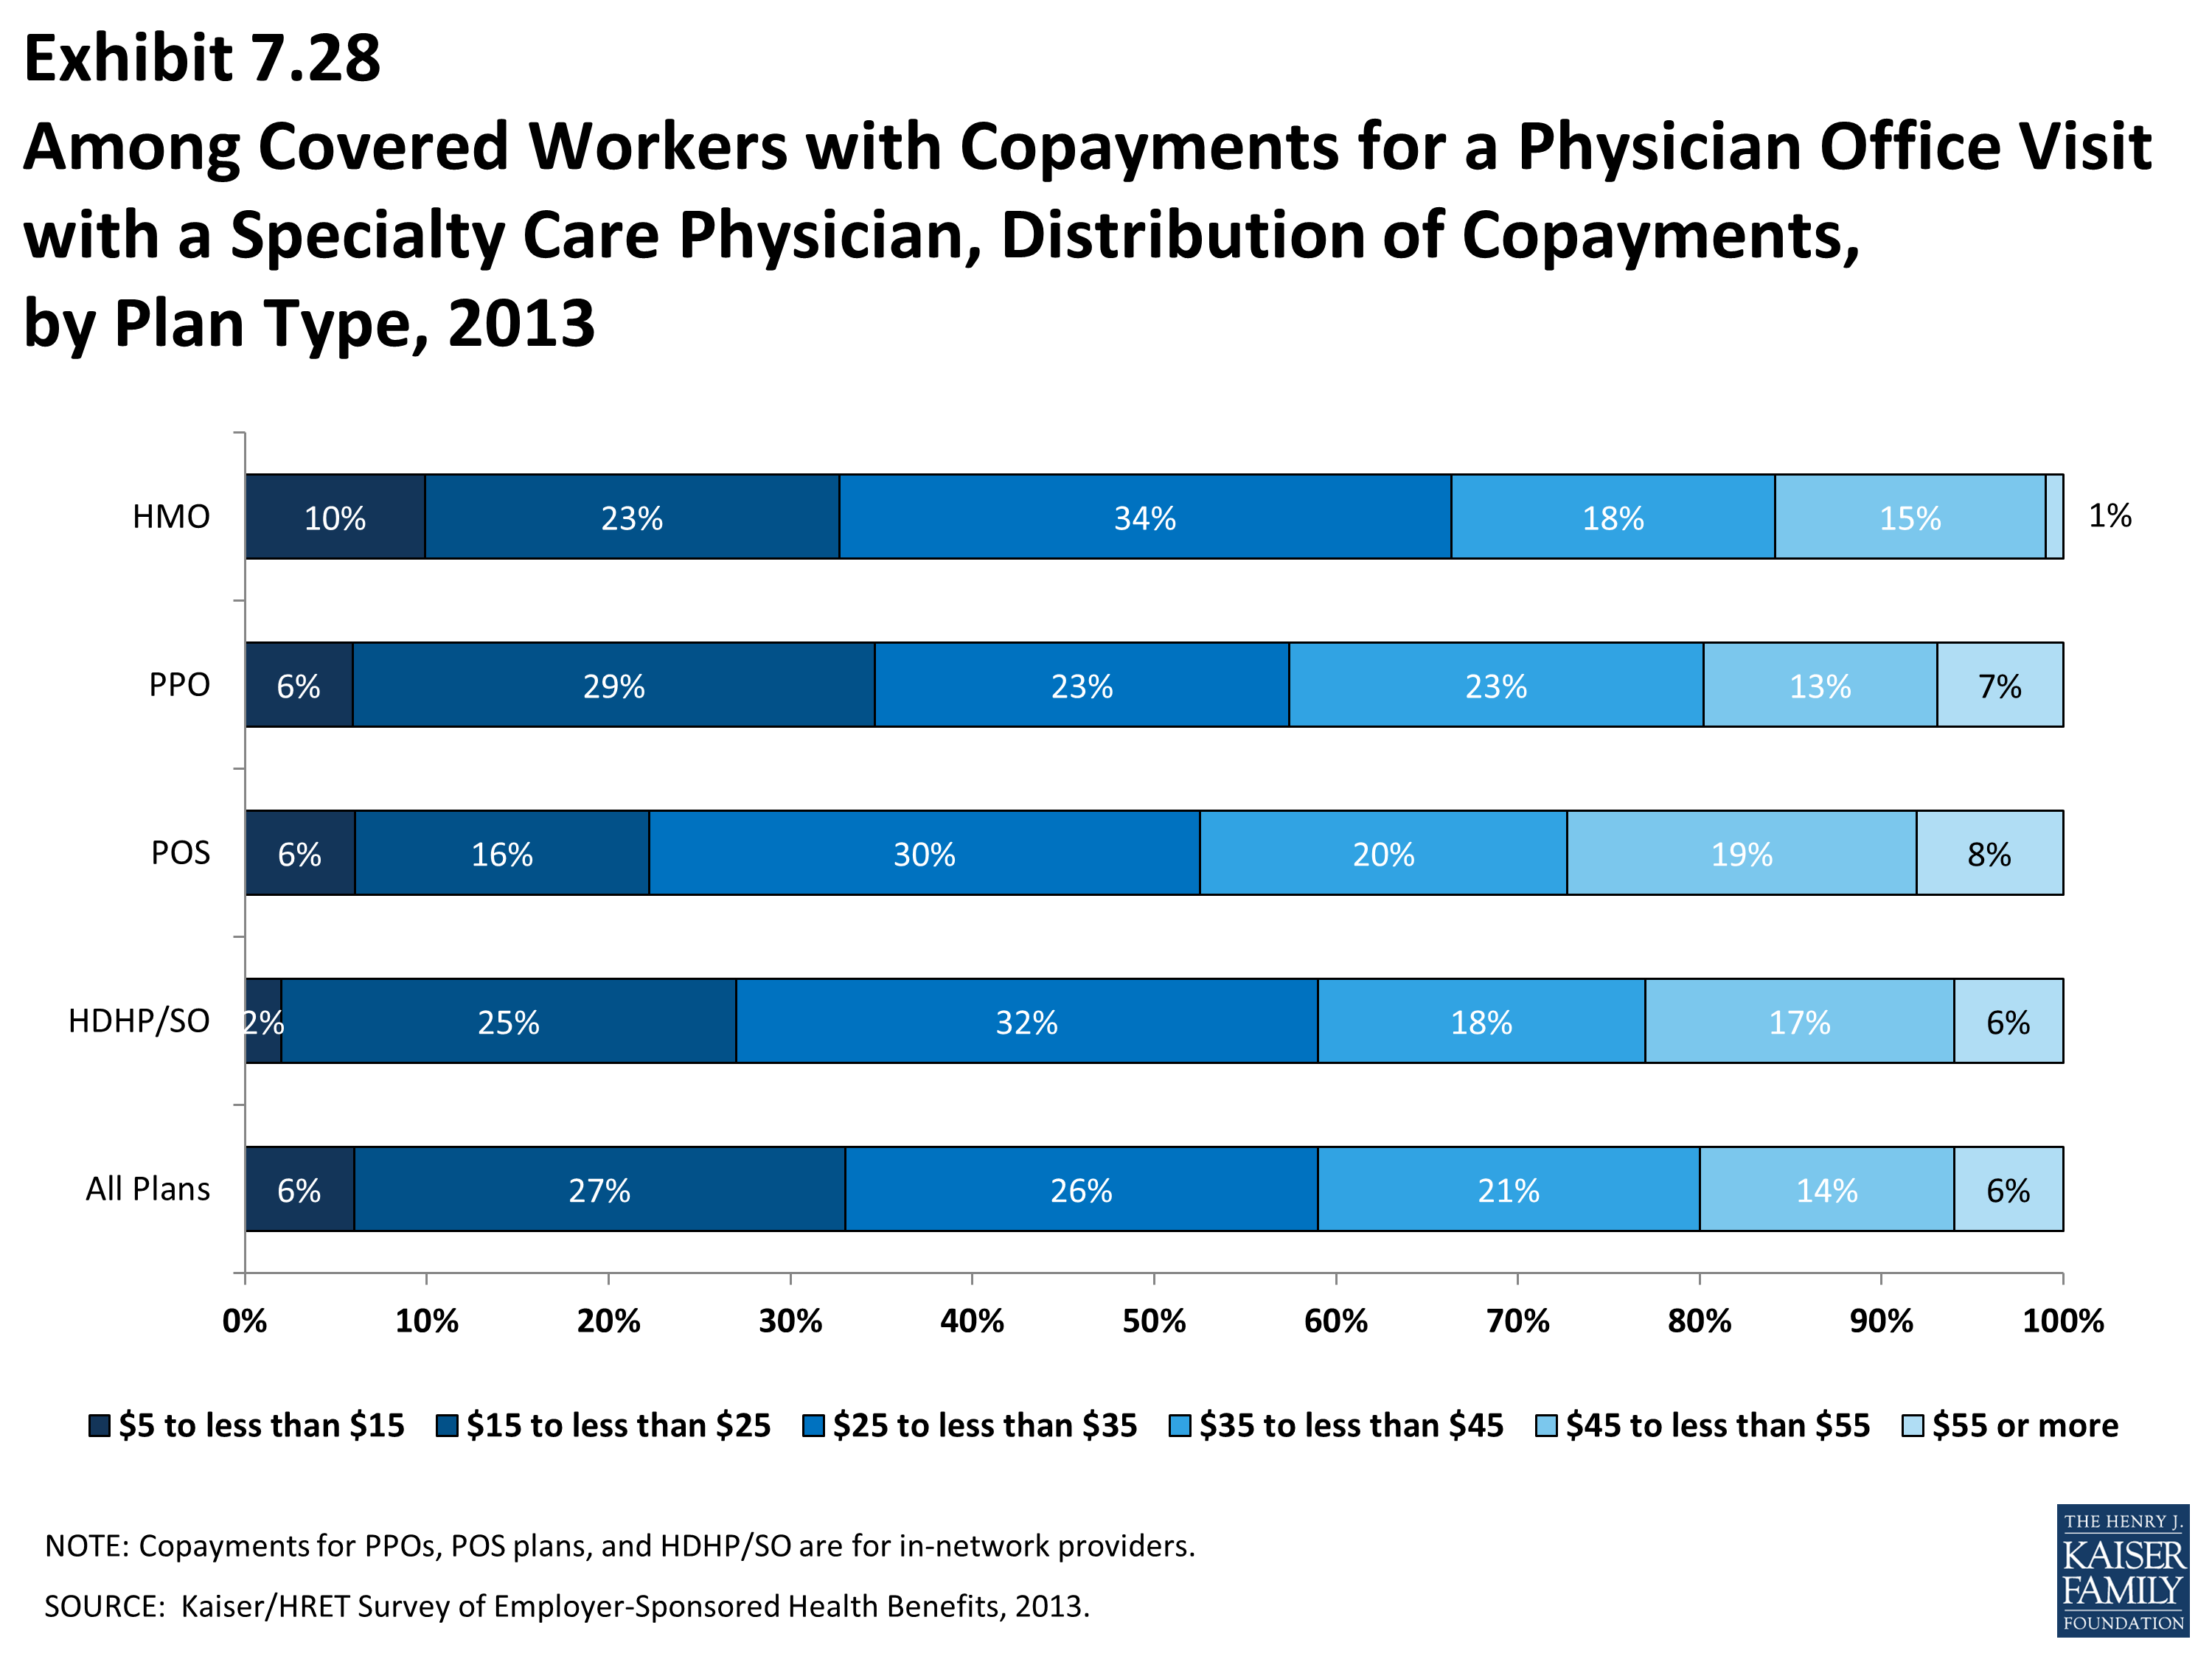
Among Covered Workers with Copayments for a Physician Office Visit with a Specialty Care Physician, Distribution of Copayments, by Plan Type, 2013
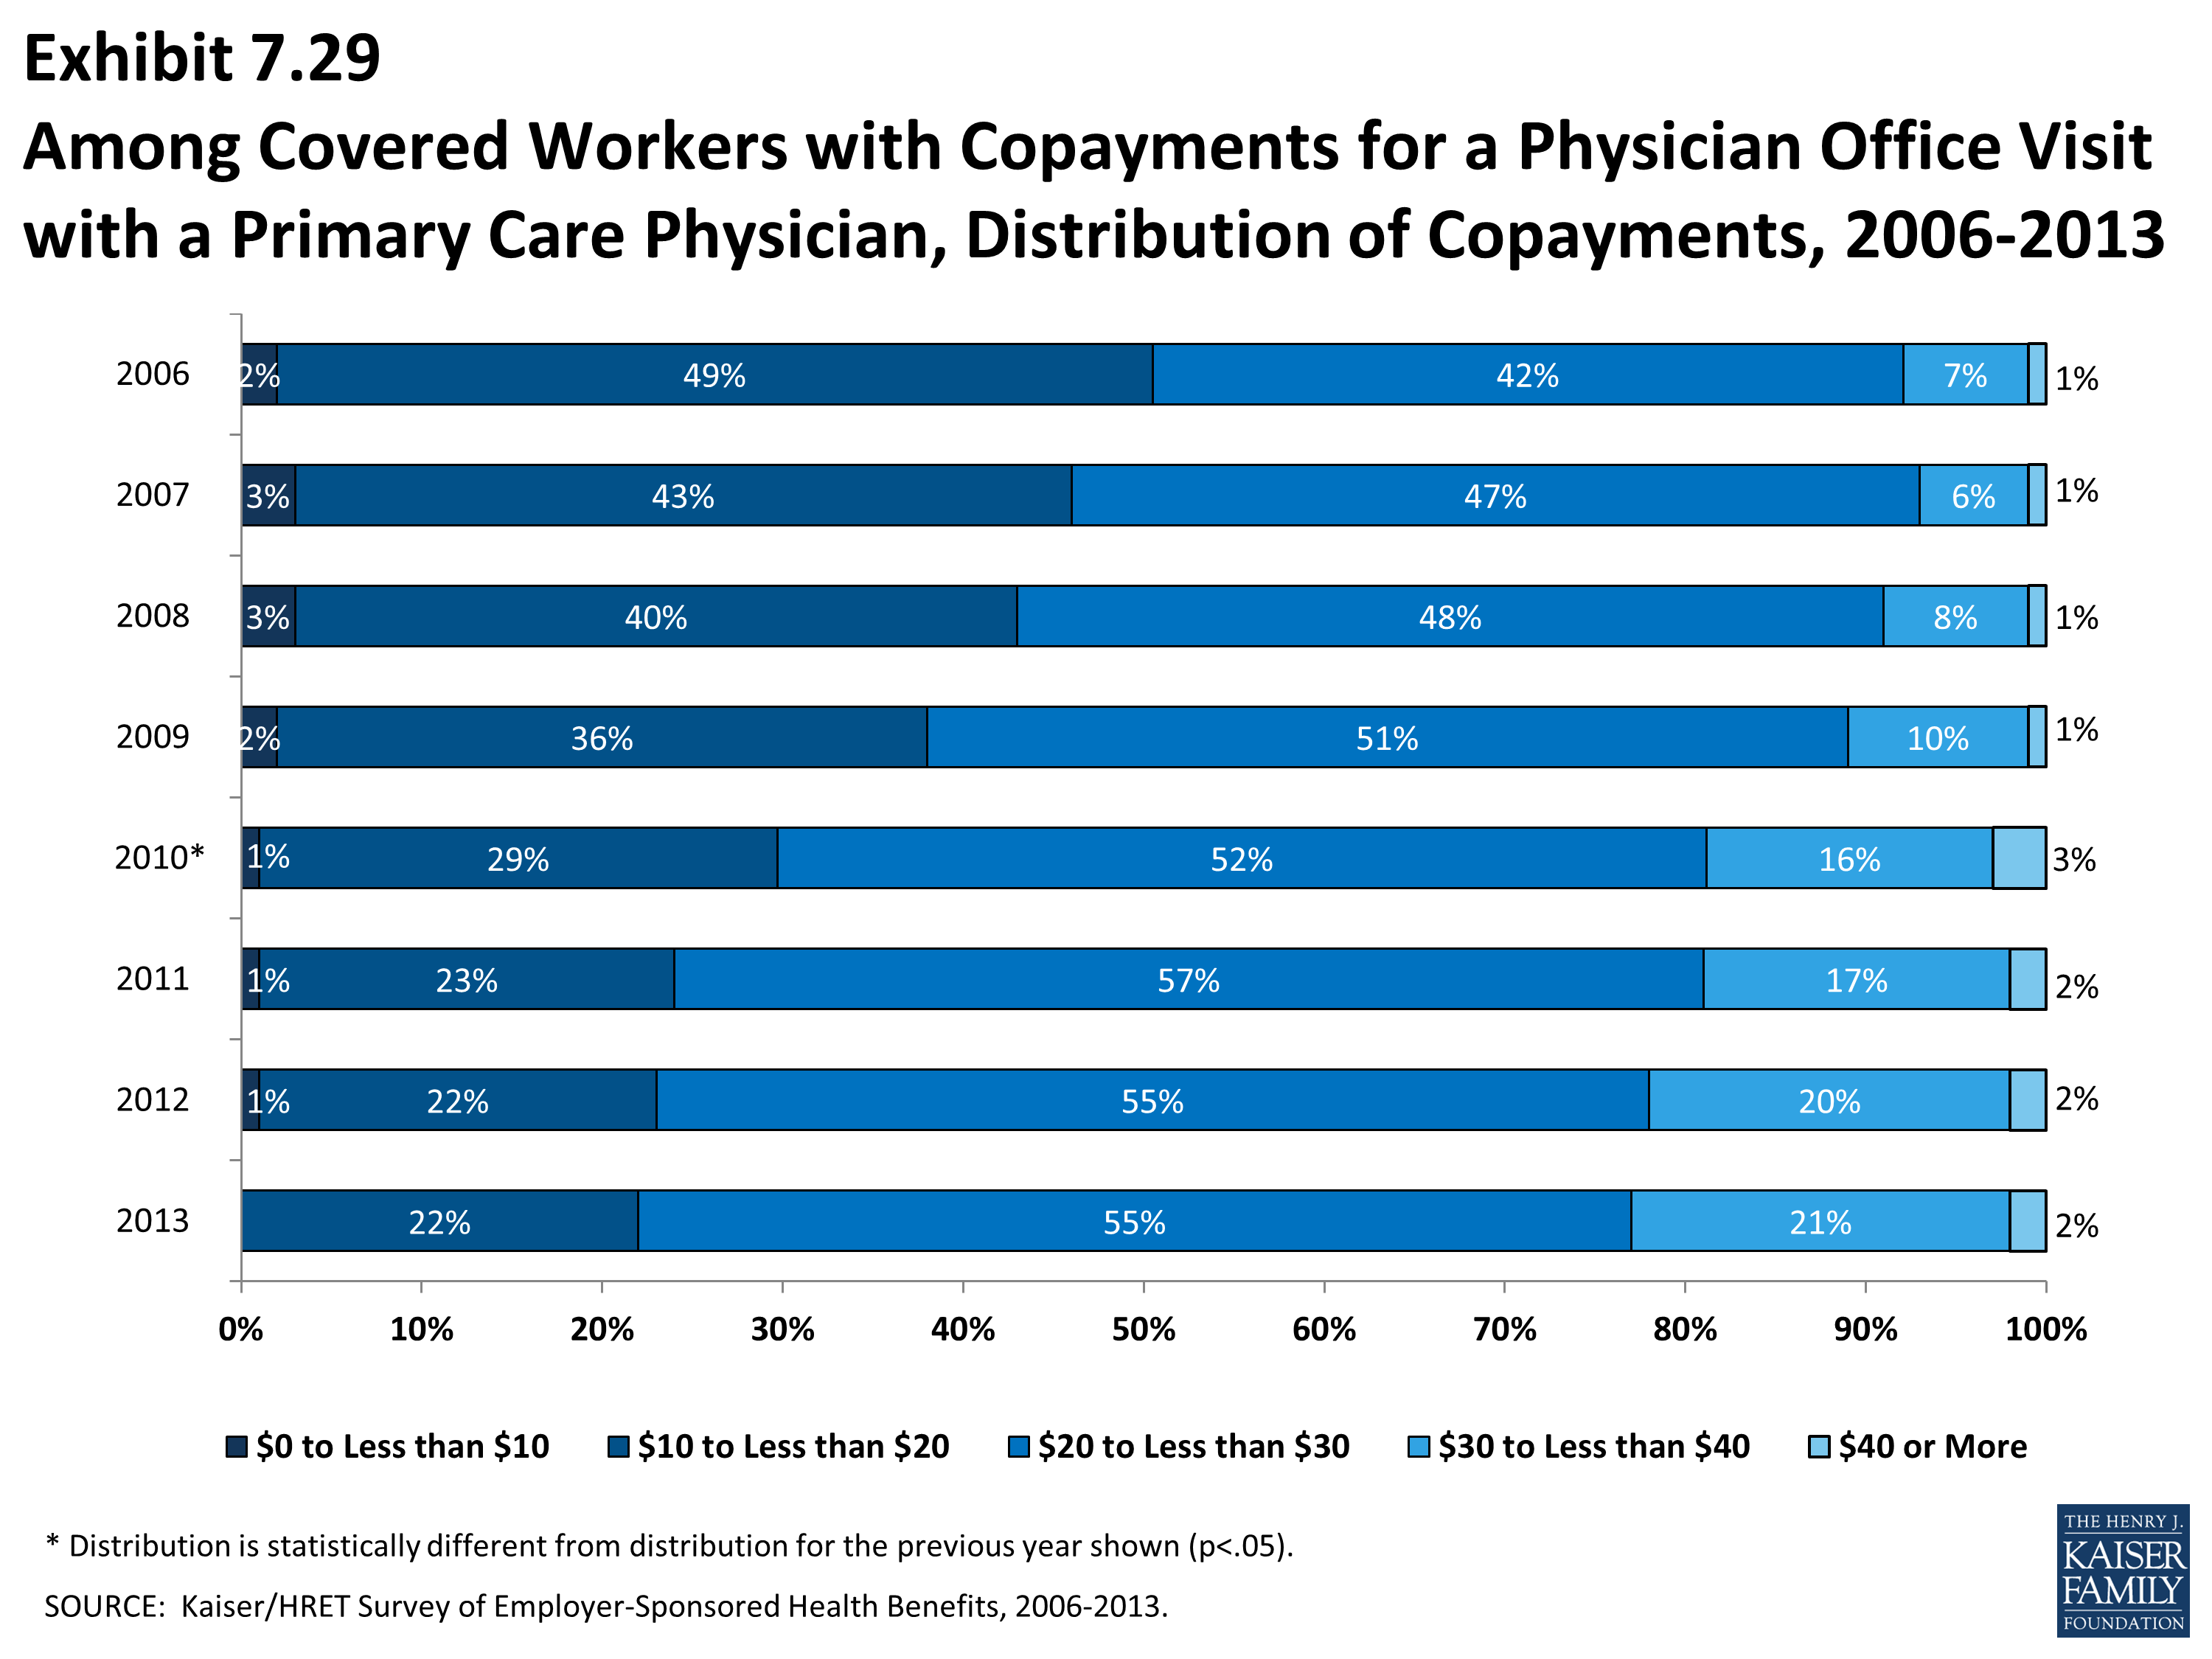
Among Covered Workers with Copayments for a Physician Office Visit with a Primary Care Physician, Distribution of Copayments, 2006-2013
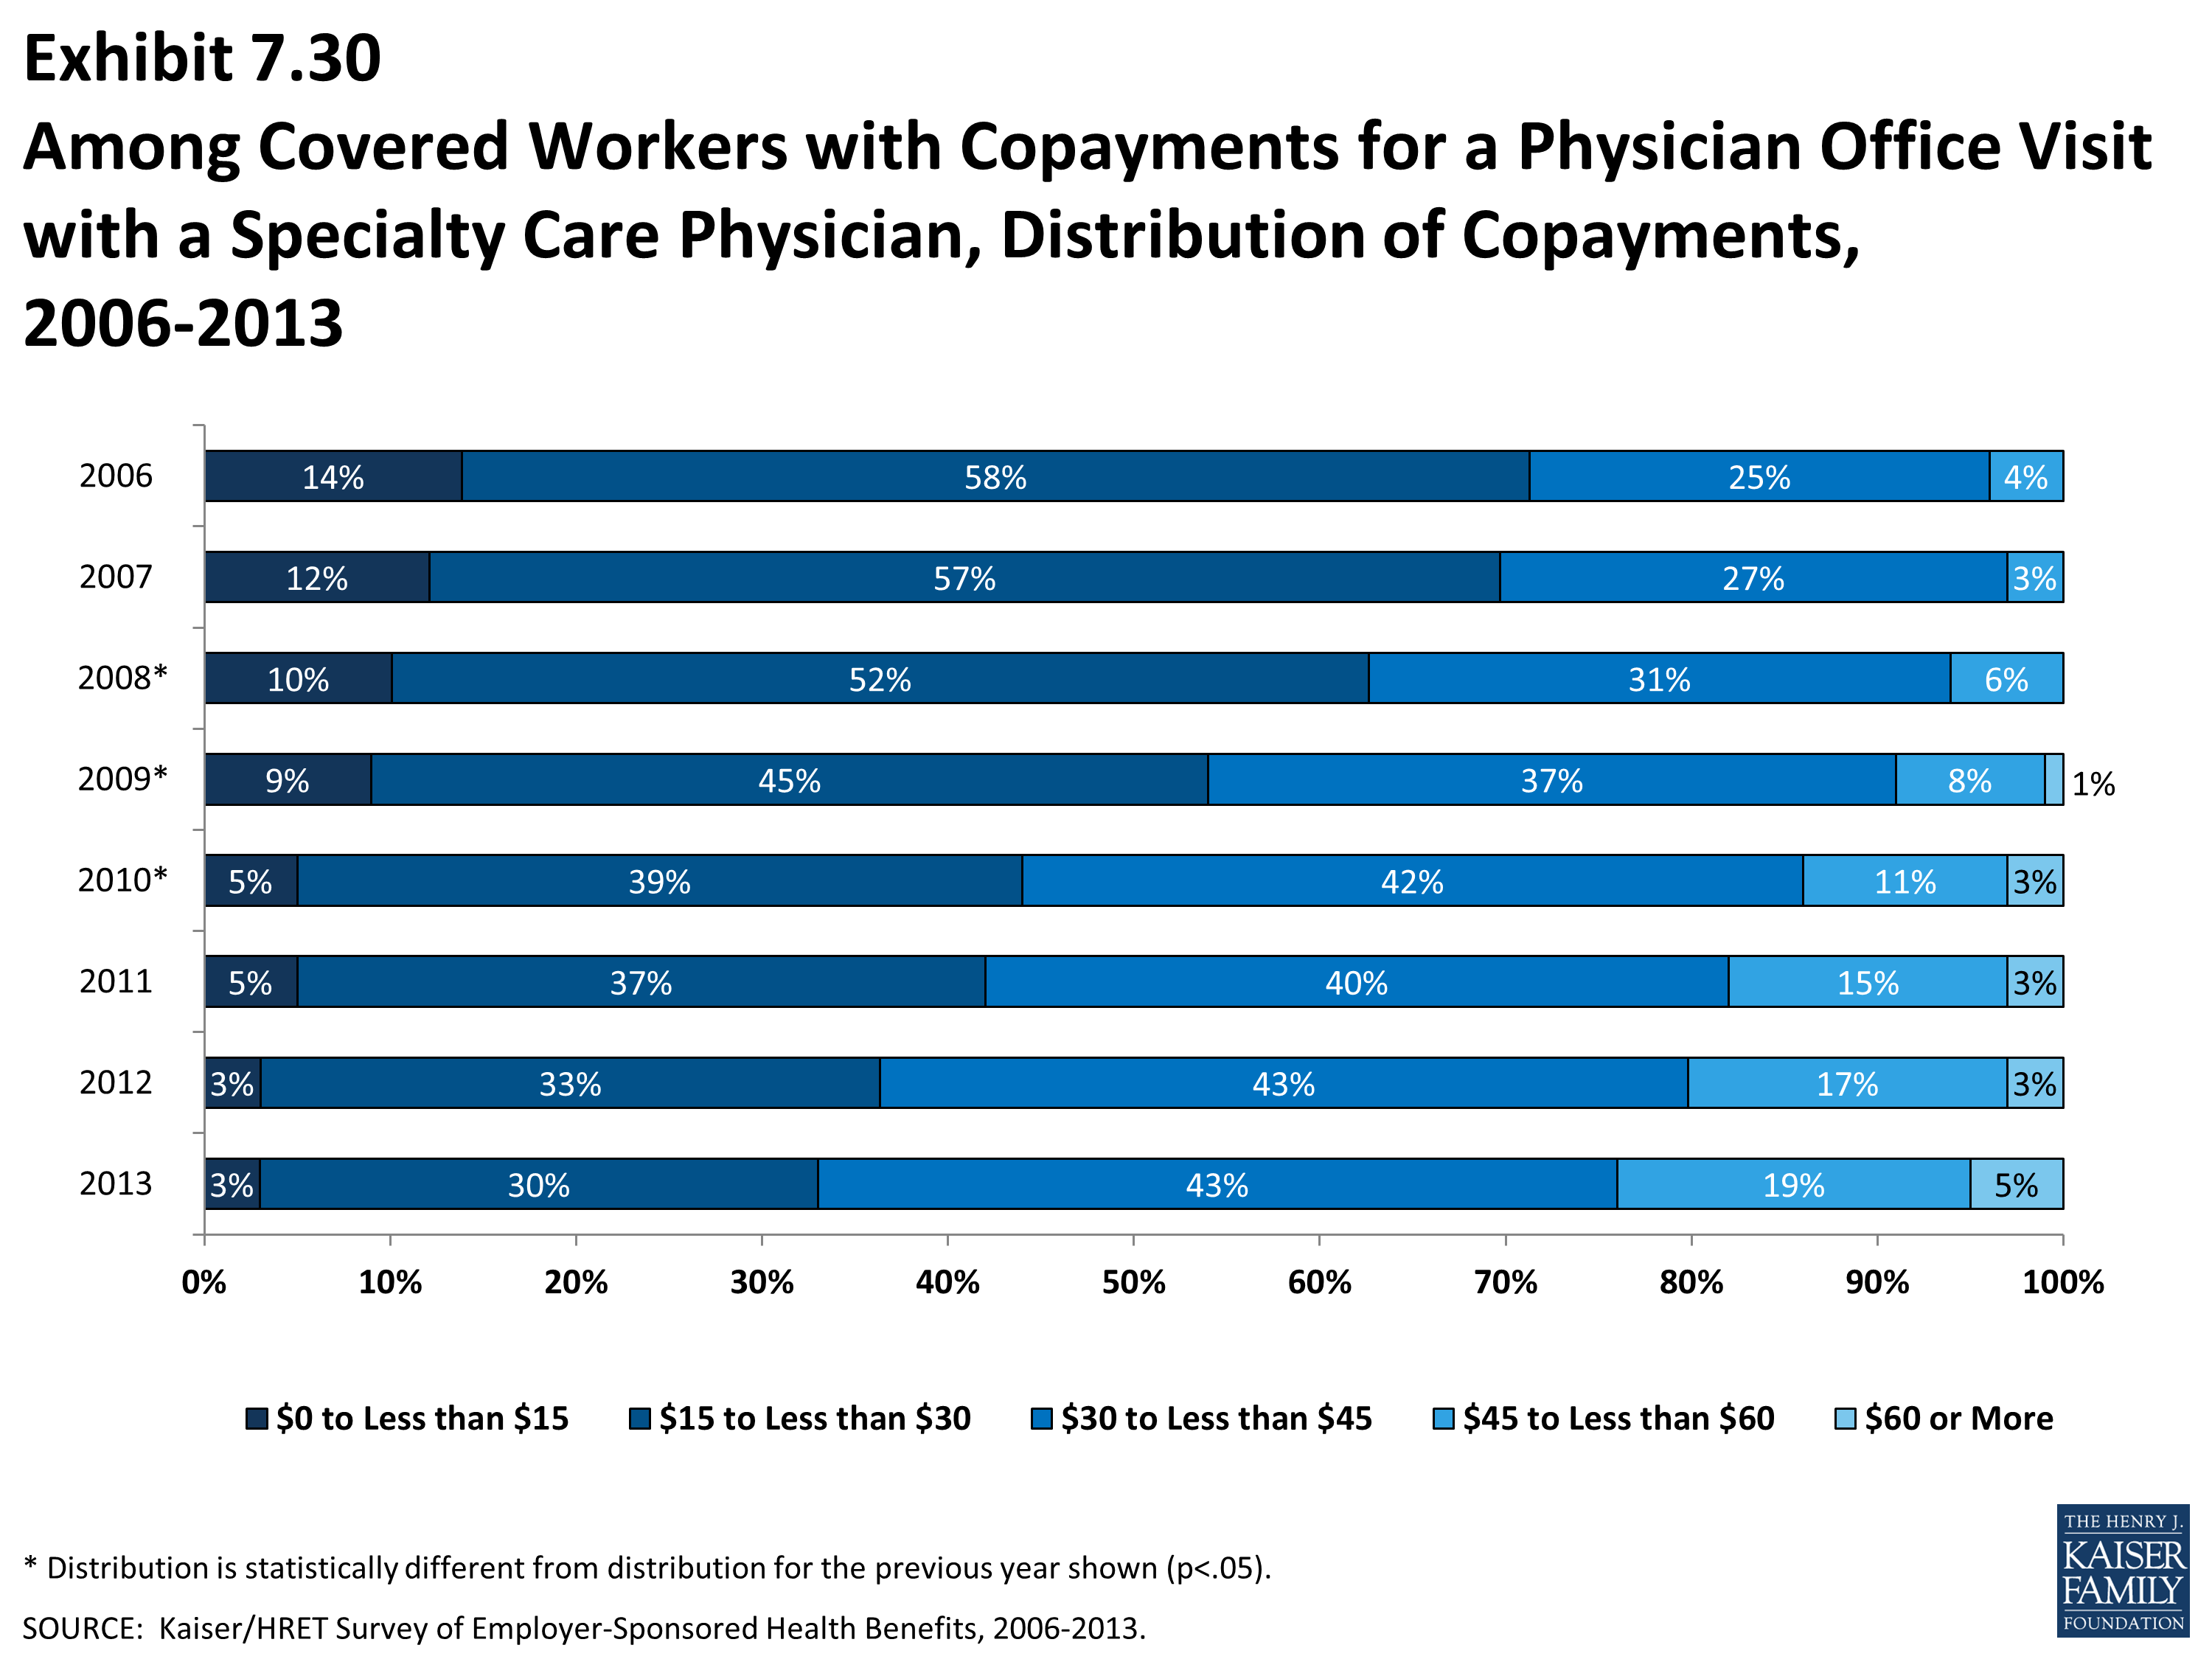
Among Covered Workers with Copayments for a Physician Office Visit with a Specialty Care Physician, Distribution of Copayments, 2006-2013
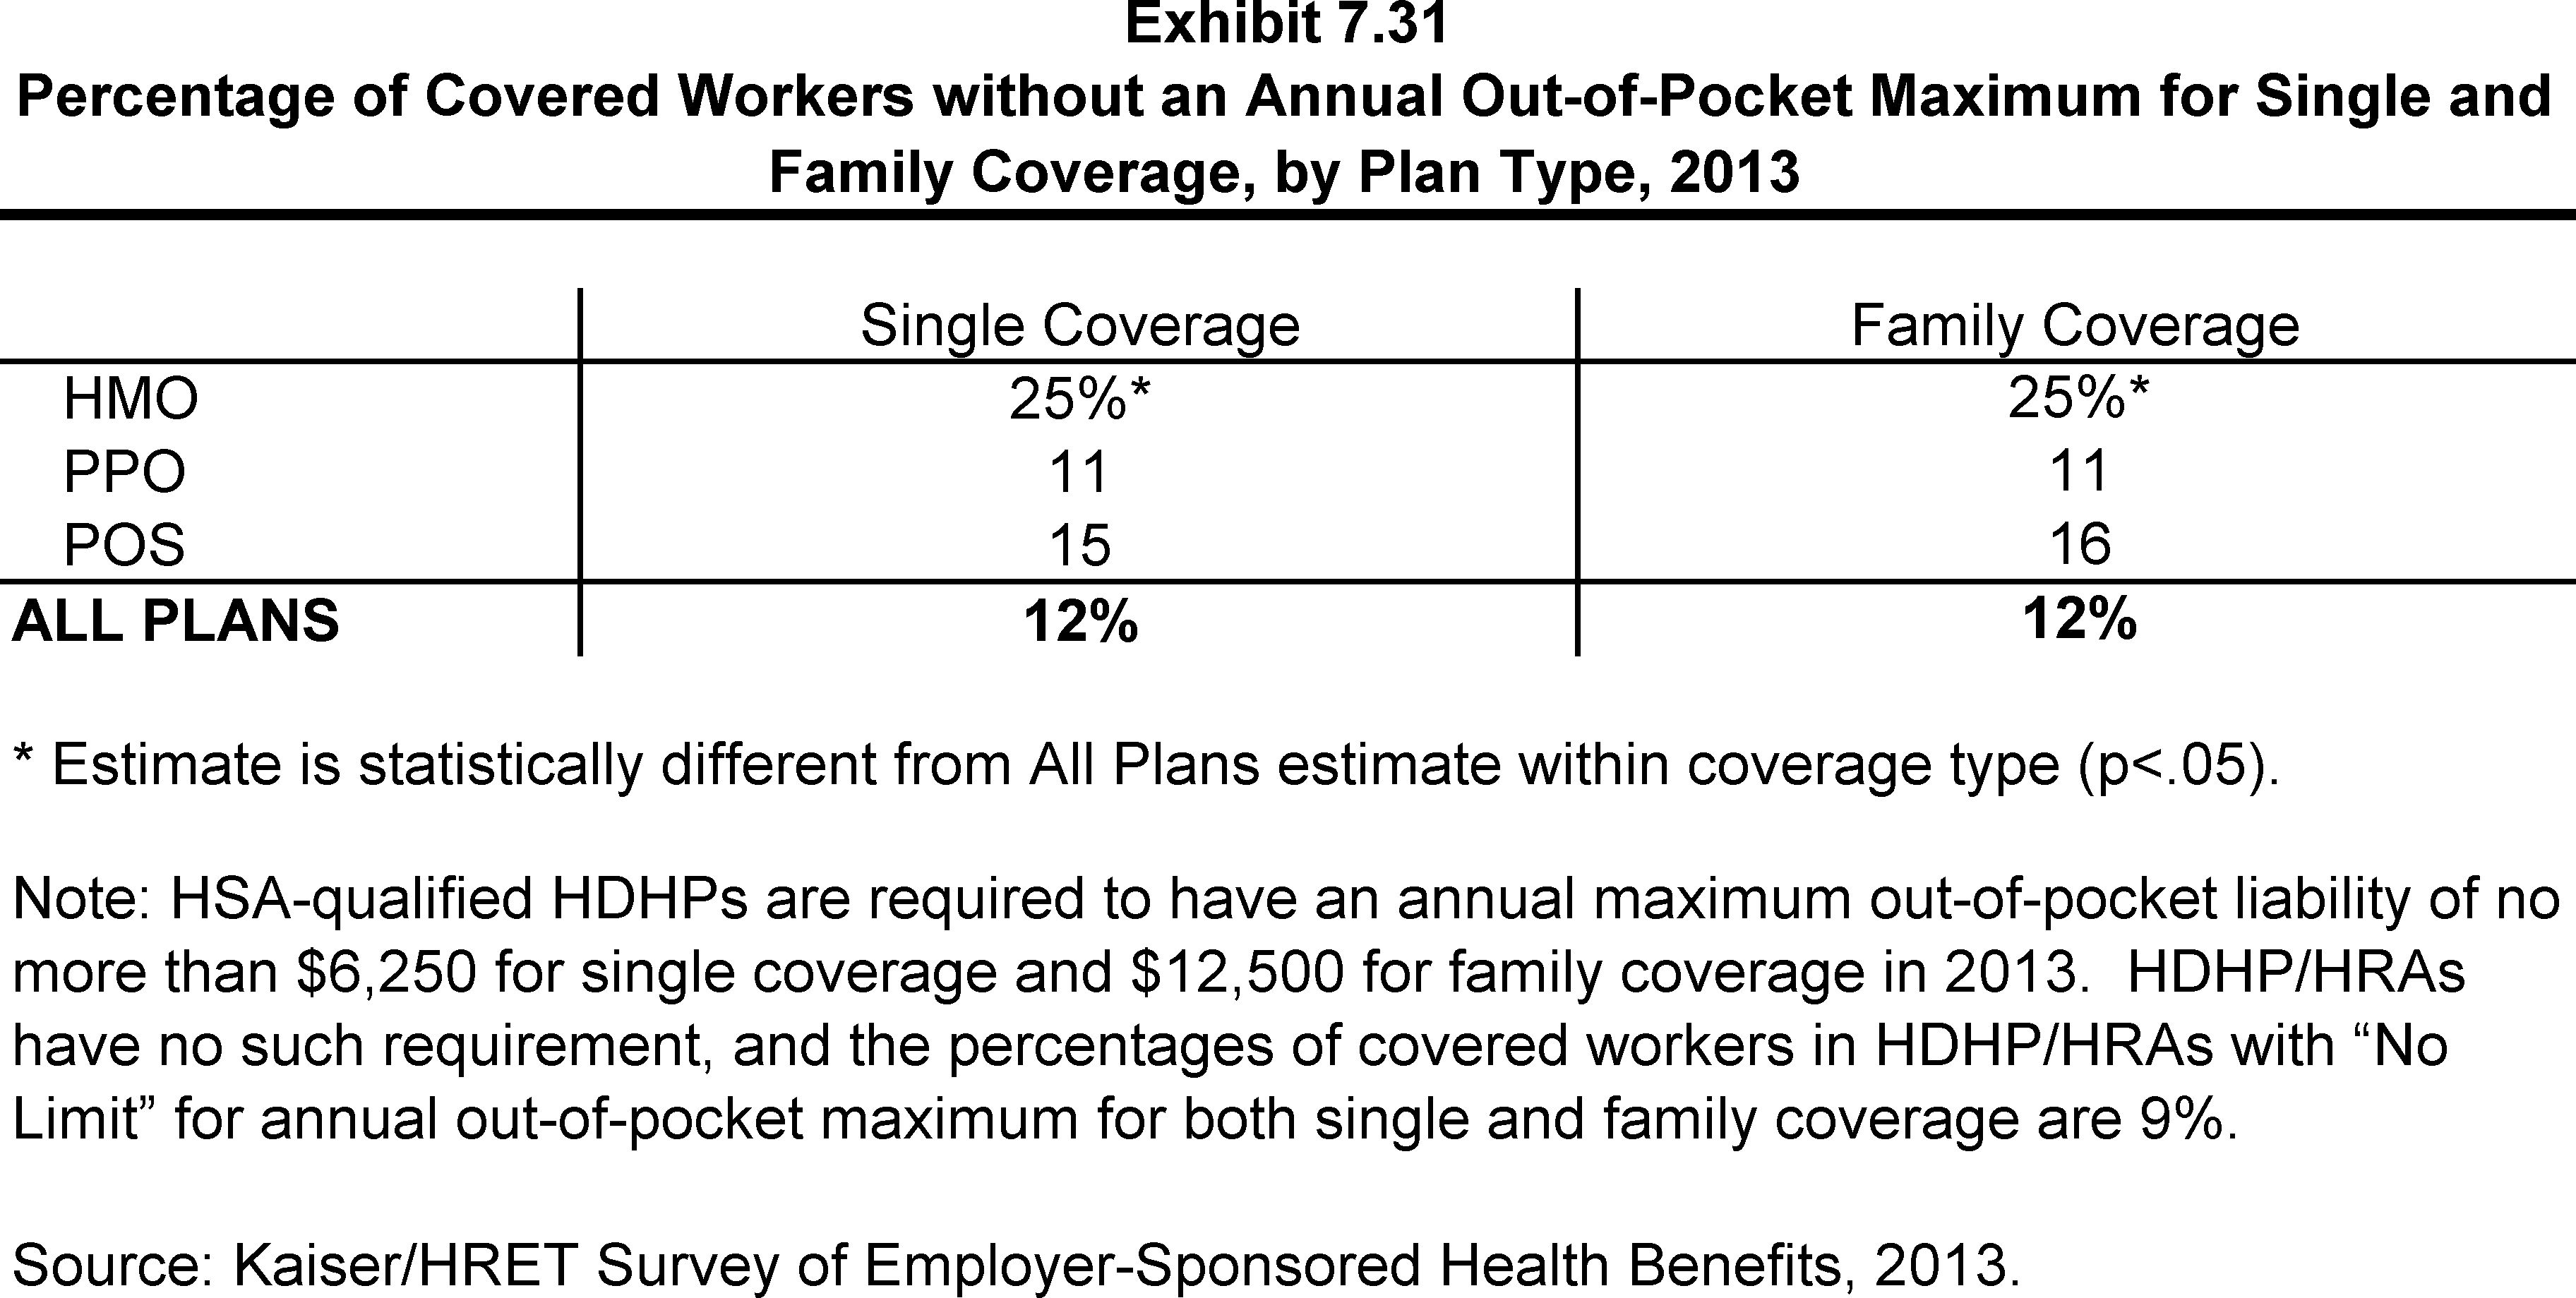
Percentage of Covered Workers without an Annual Out-of-Pocket Maximum for Single and Family Coverage, by Plan Type, 2013
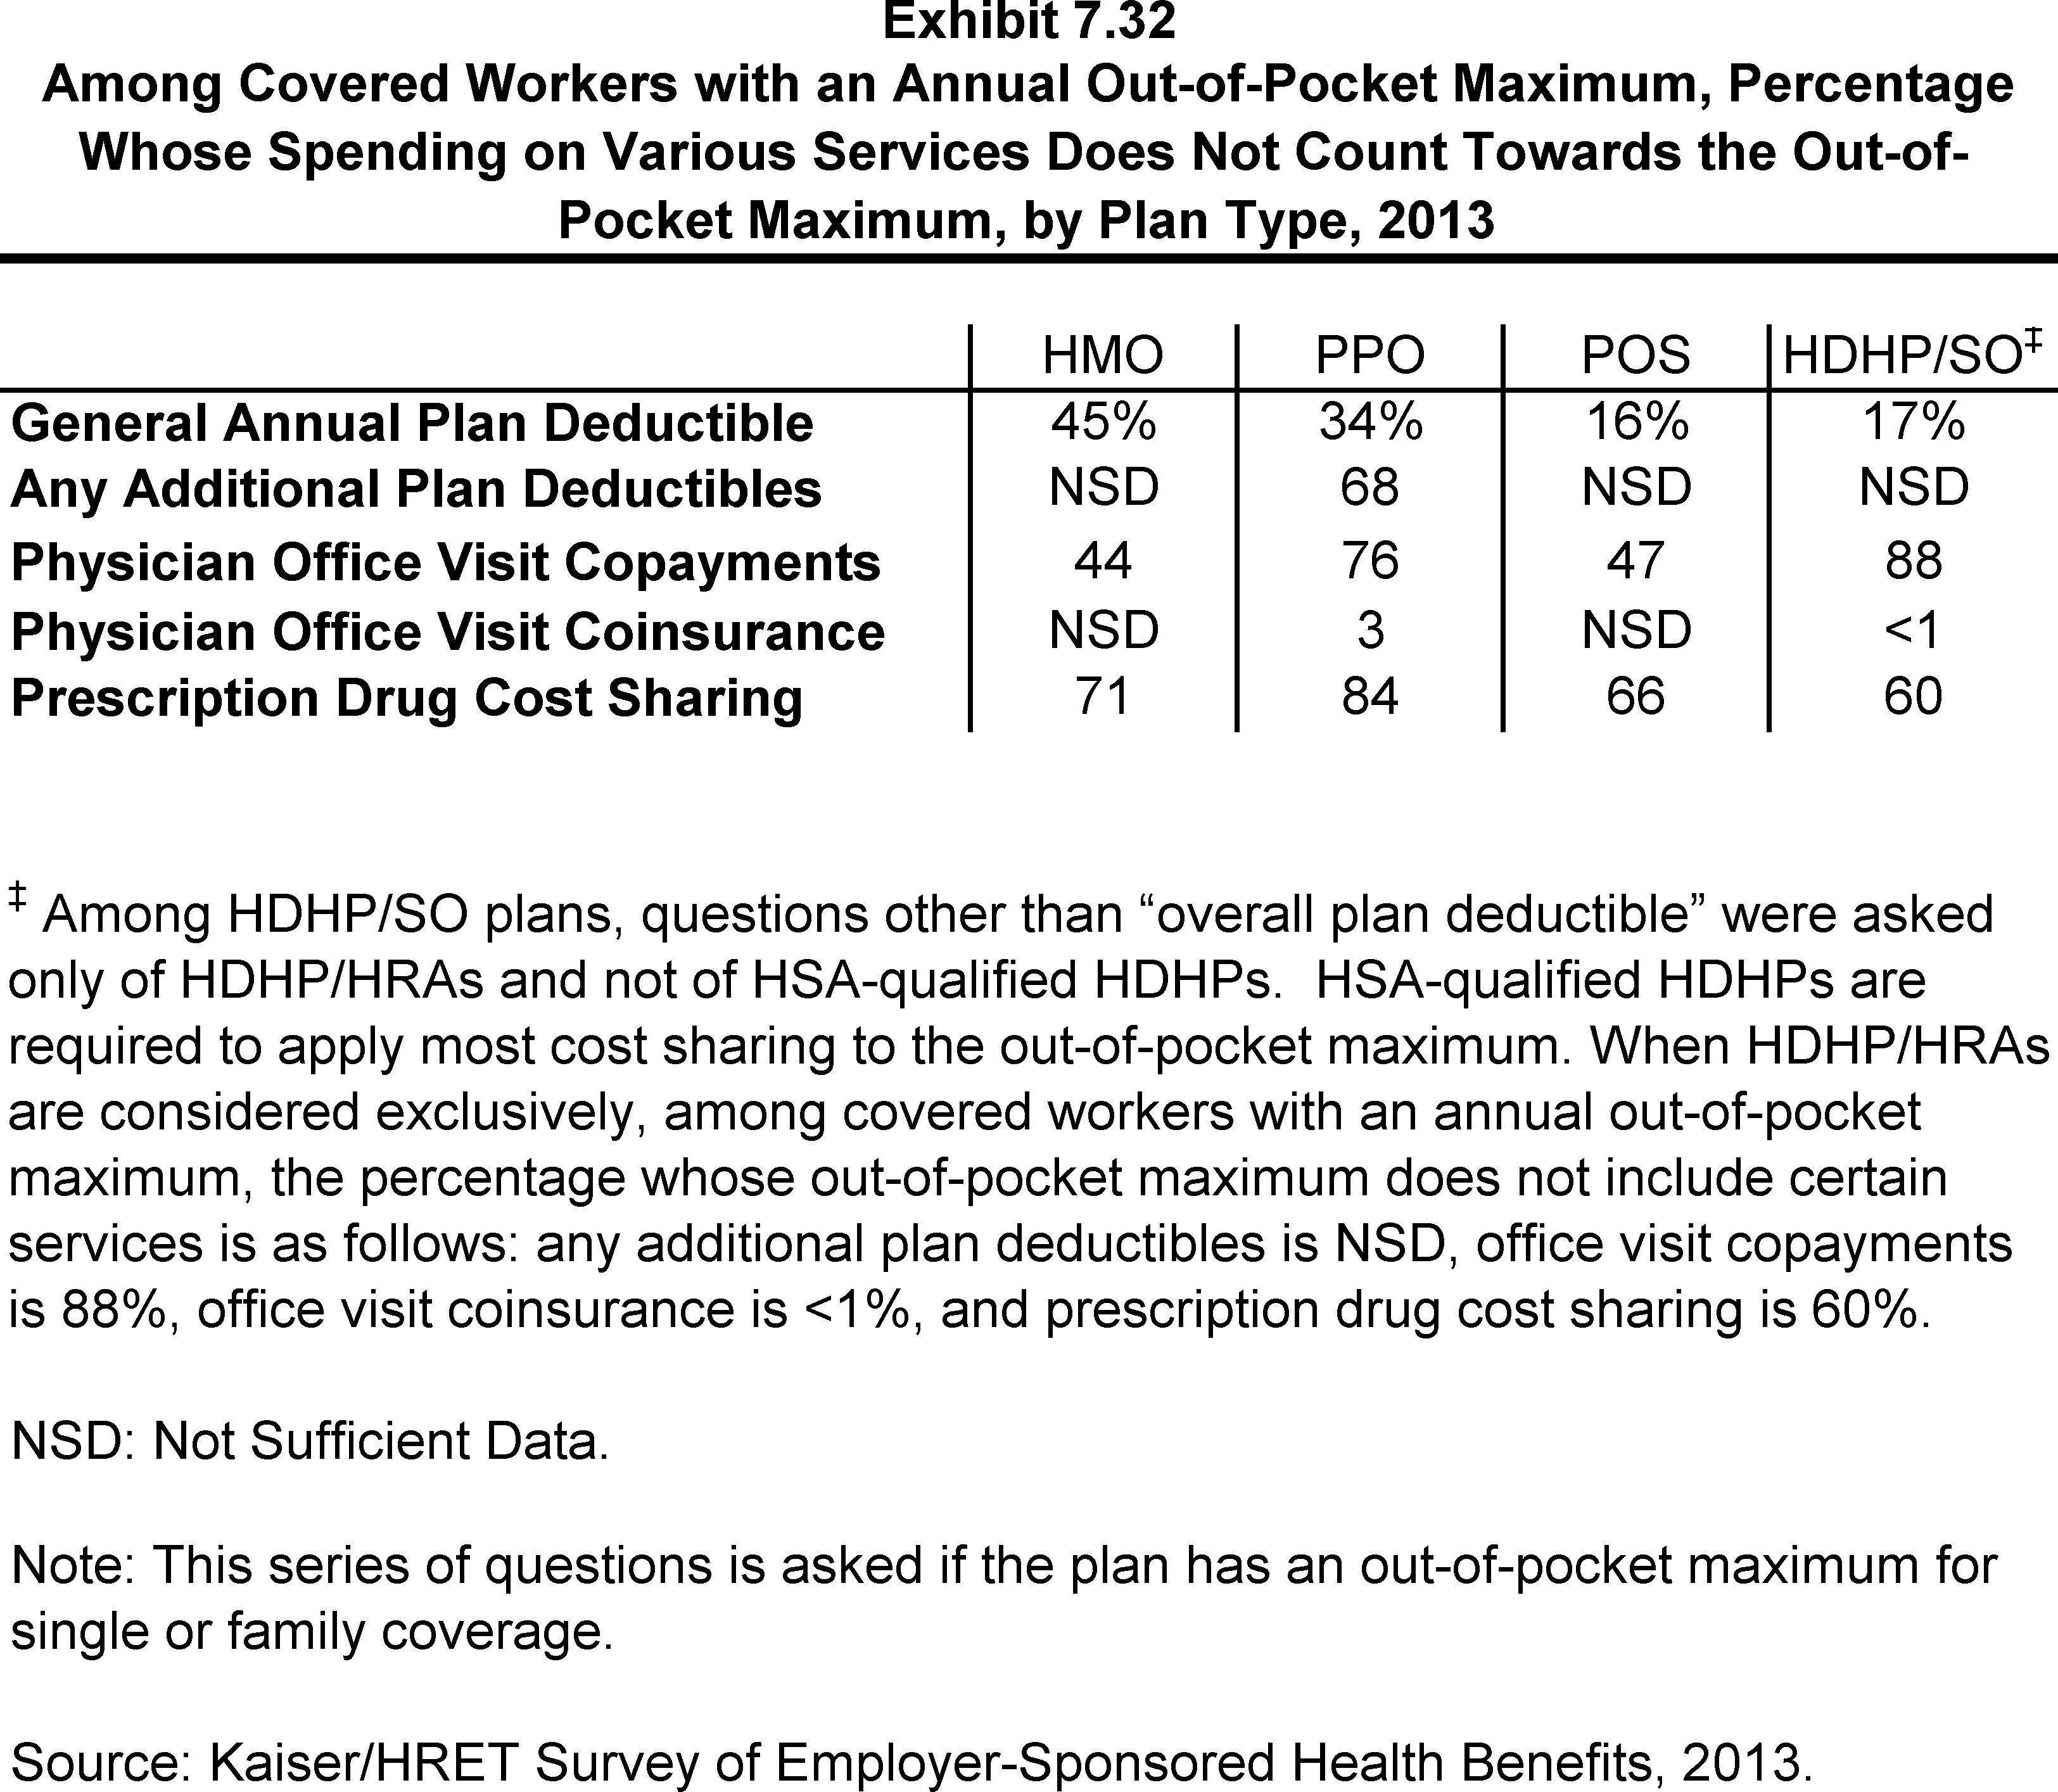
Among Covered Workers with an Annual Out-of-Pocket Maximum, Percentage Whose Spending on Various Services Does Not Count Towards the Out-of-Pocket Maximum, by Plan Type, 2013
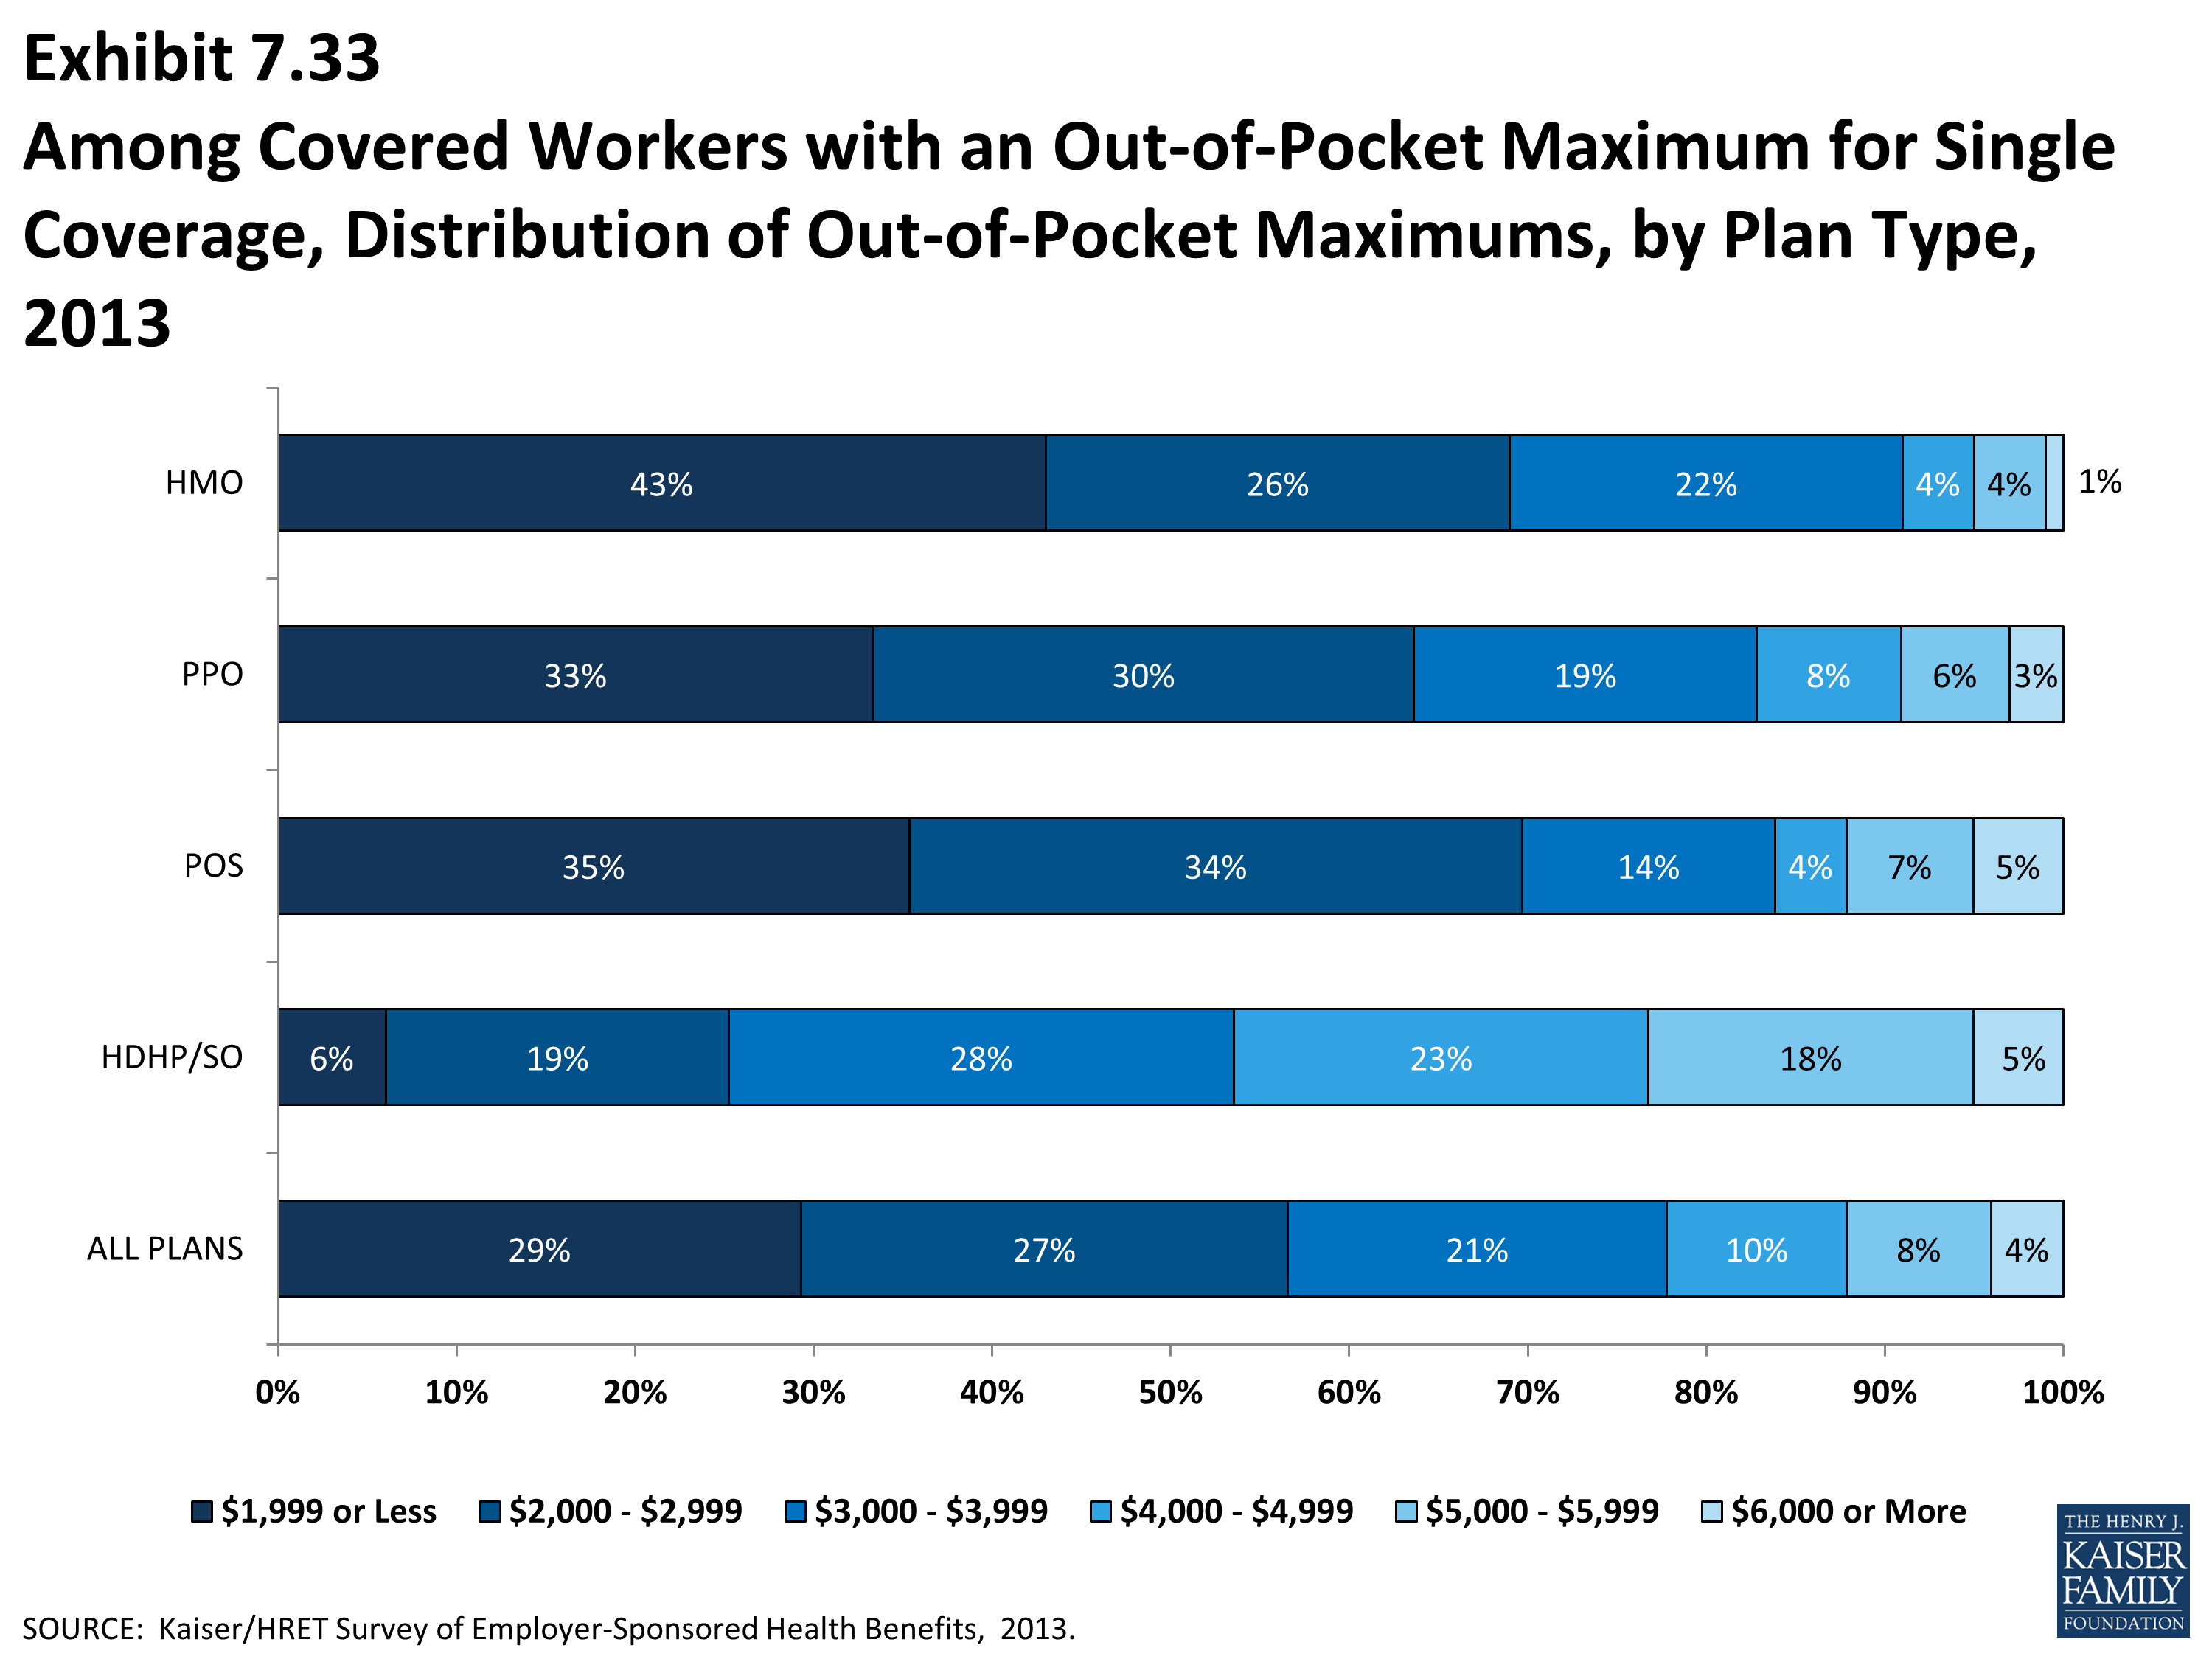
Among Covered Workers with an Out-of-Pocket Maximum for Single Coverage, Distribution of Out-of-Pocket Maximums, by Plan Type, 2013
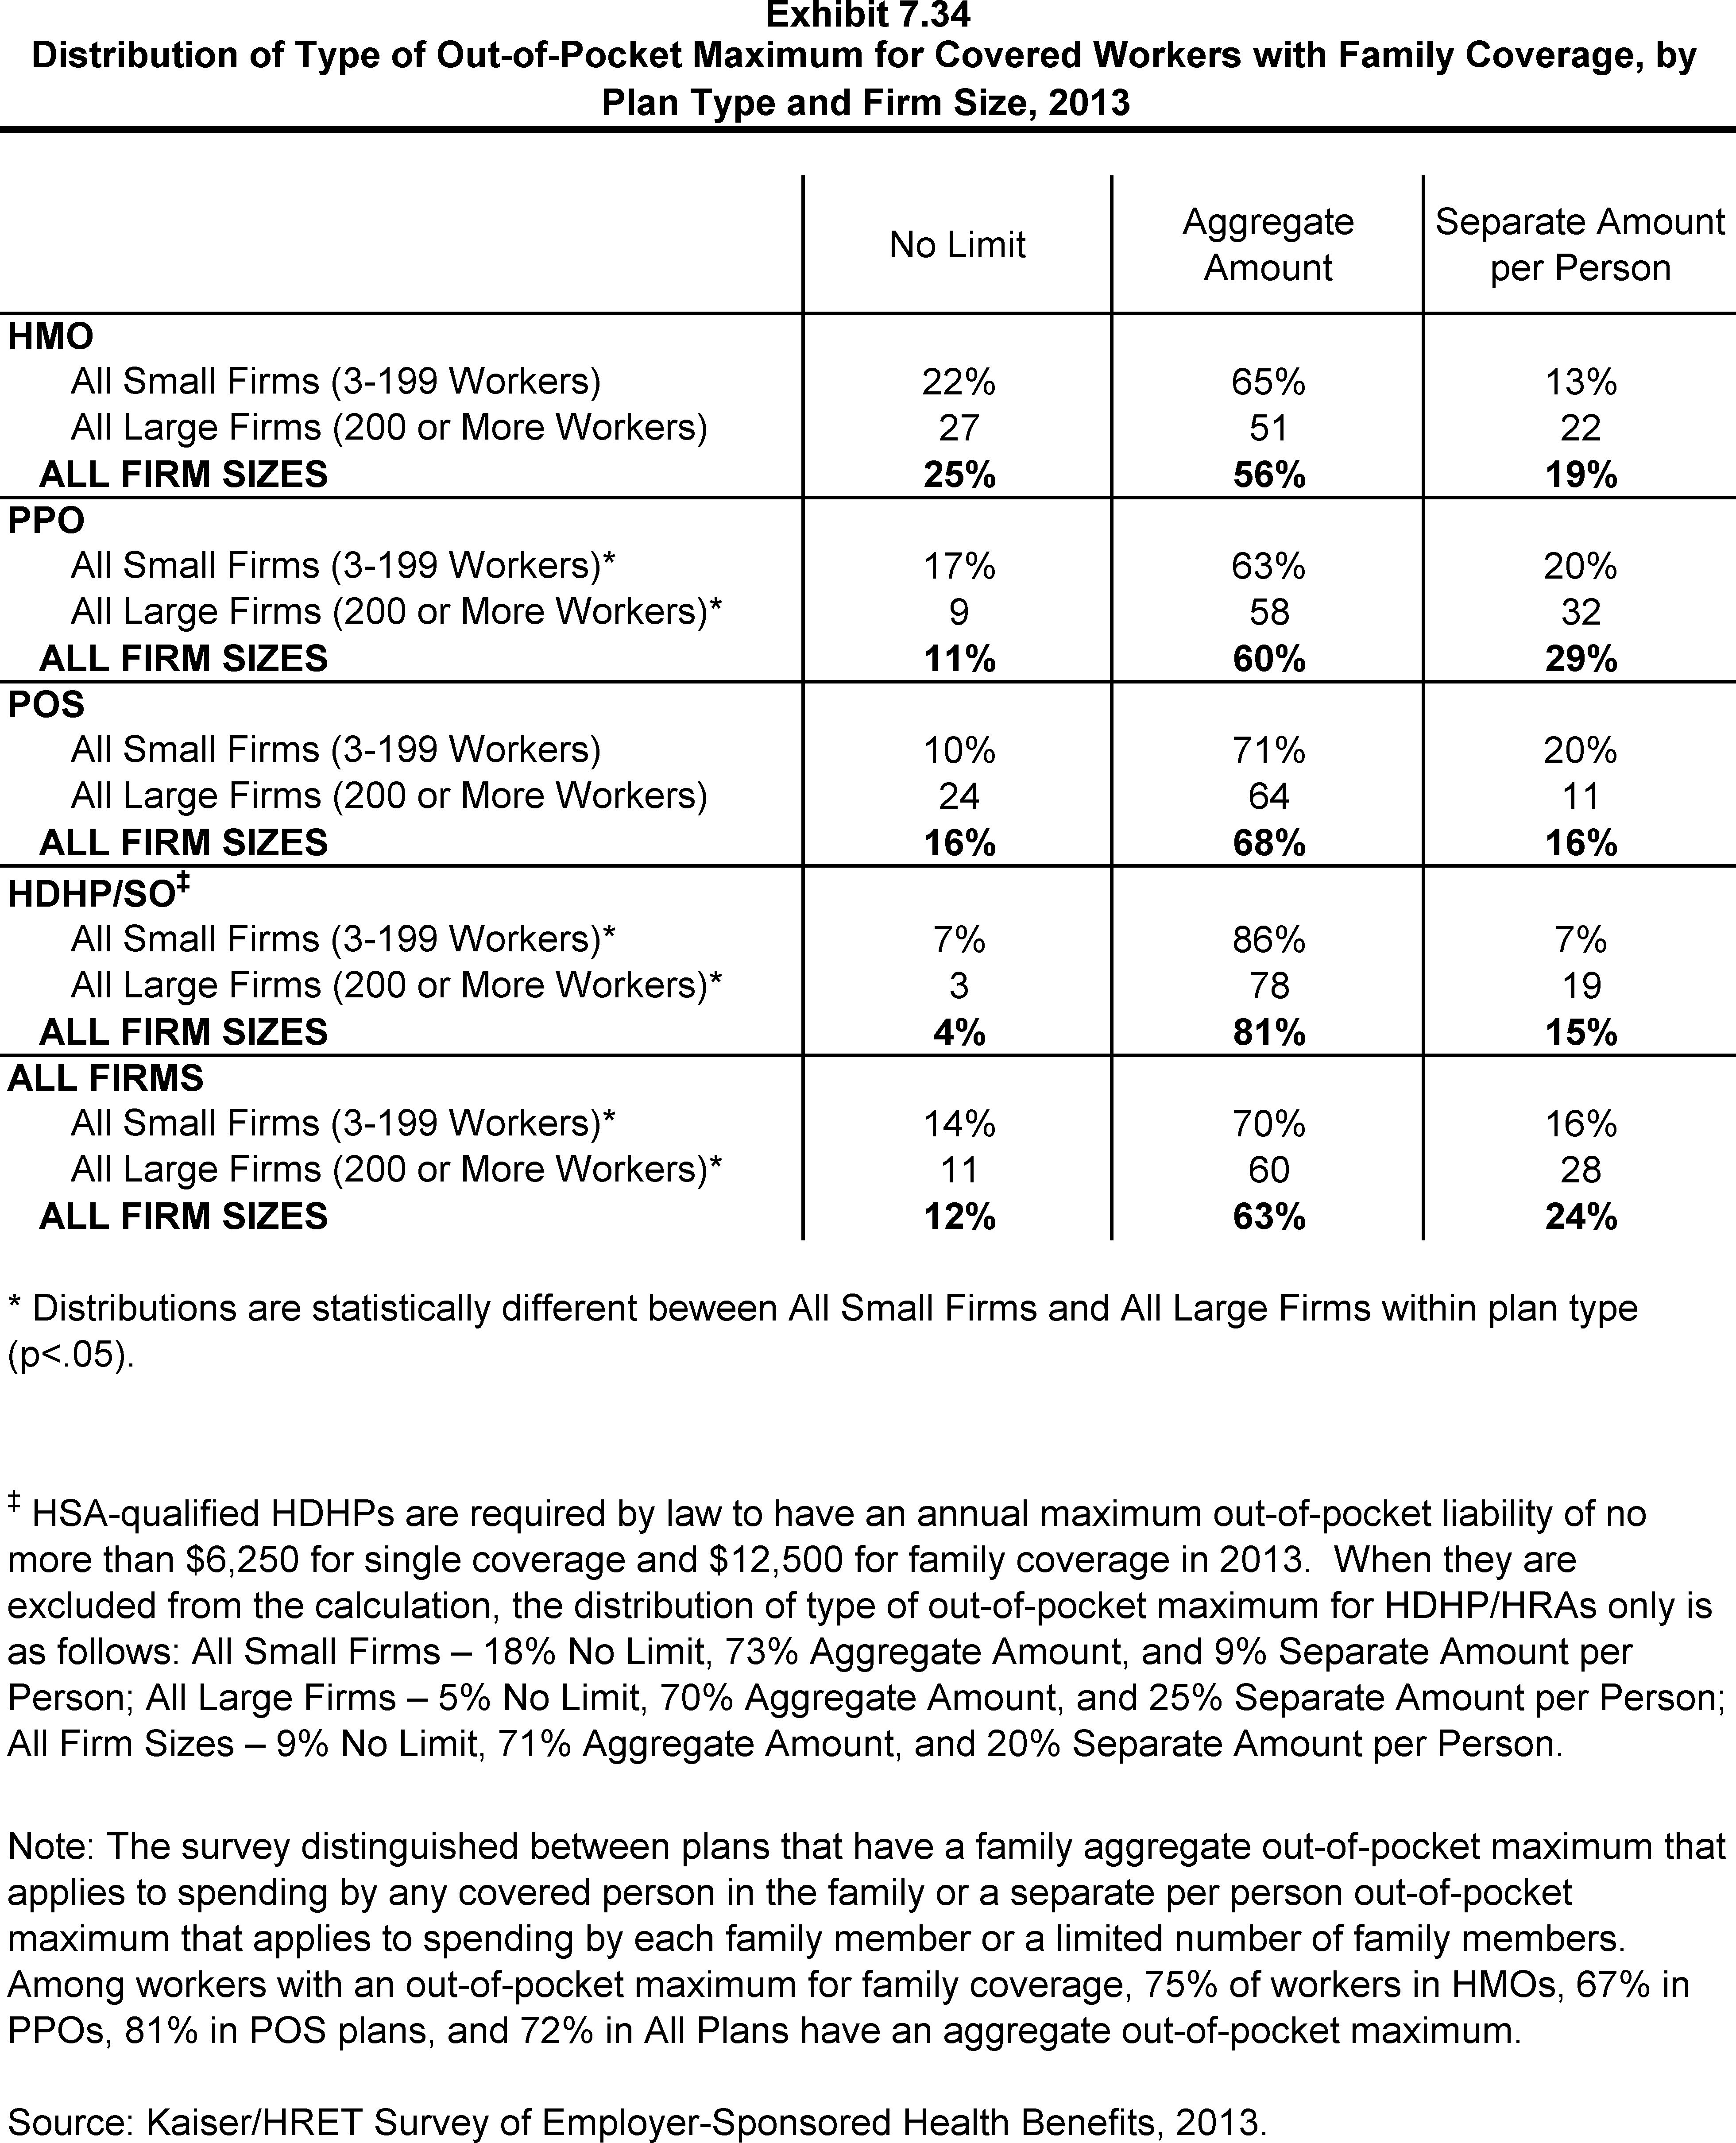
Distribution of Type of Out-of-Pocket Maximum for Covered Workers with Family Coverage, by Plan Type and Firm Size, 2013
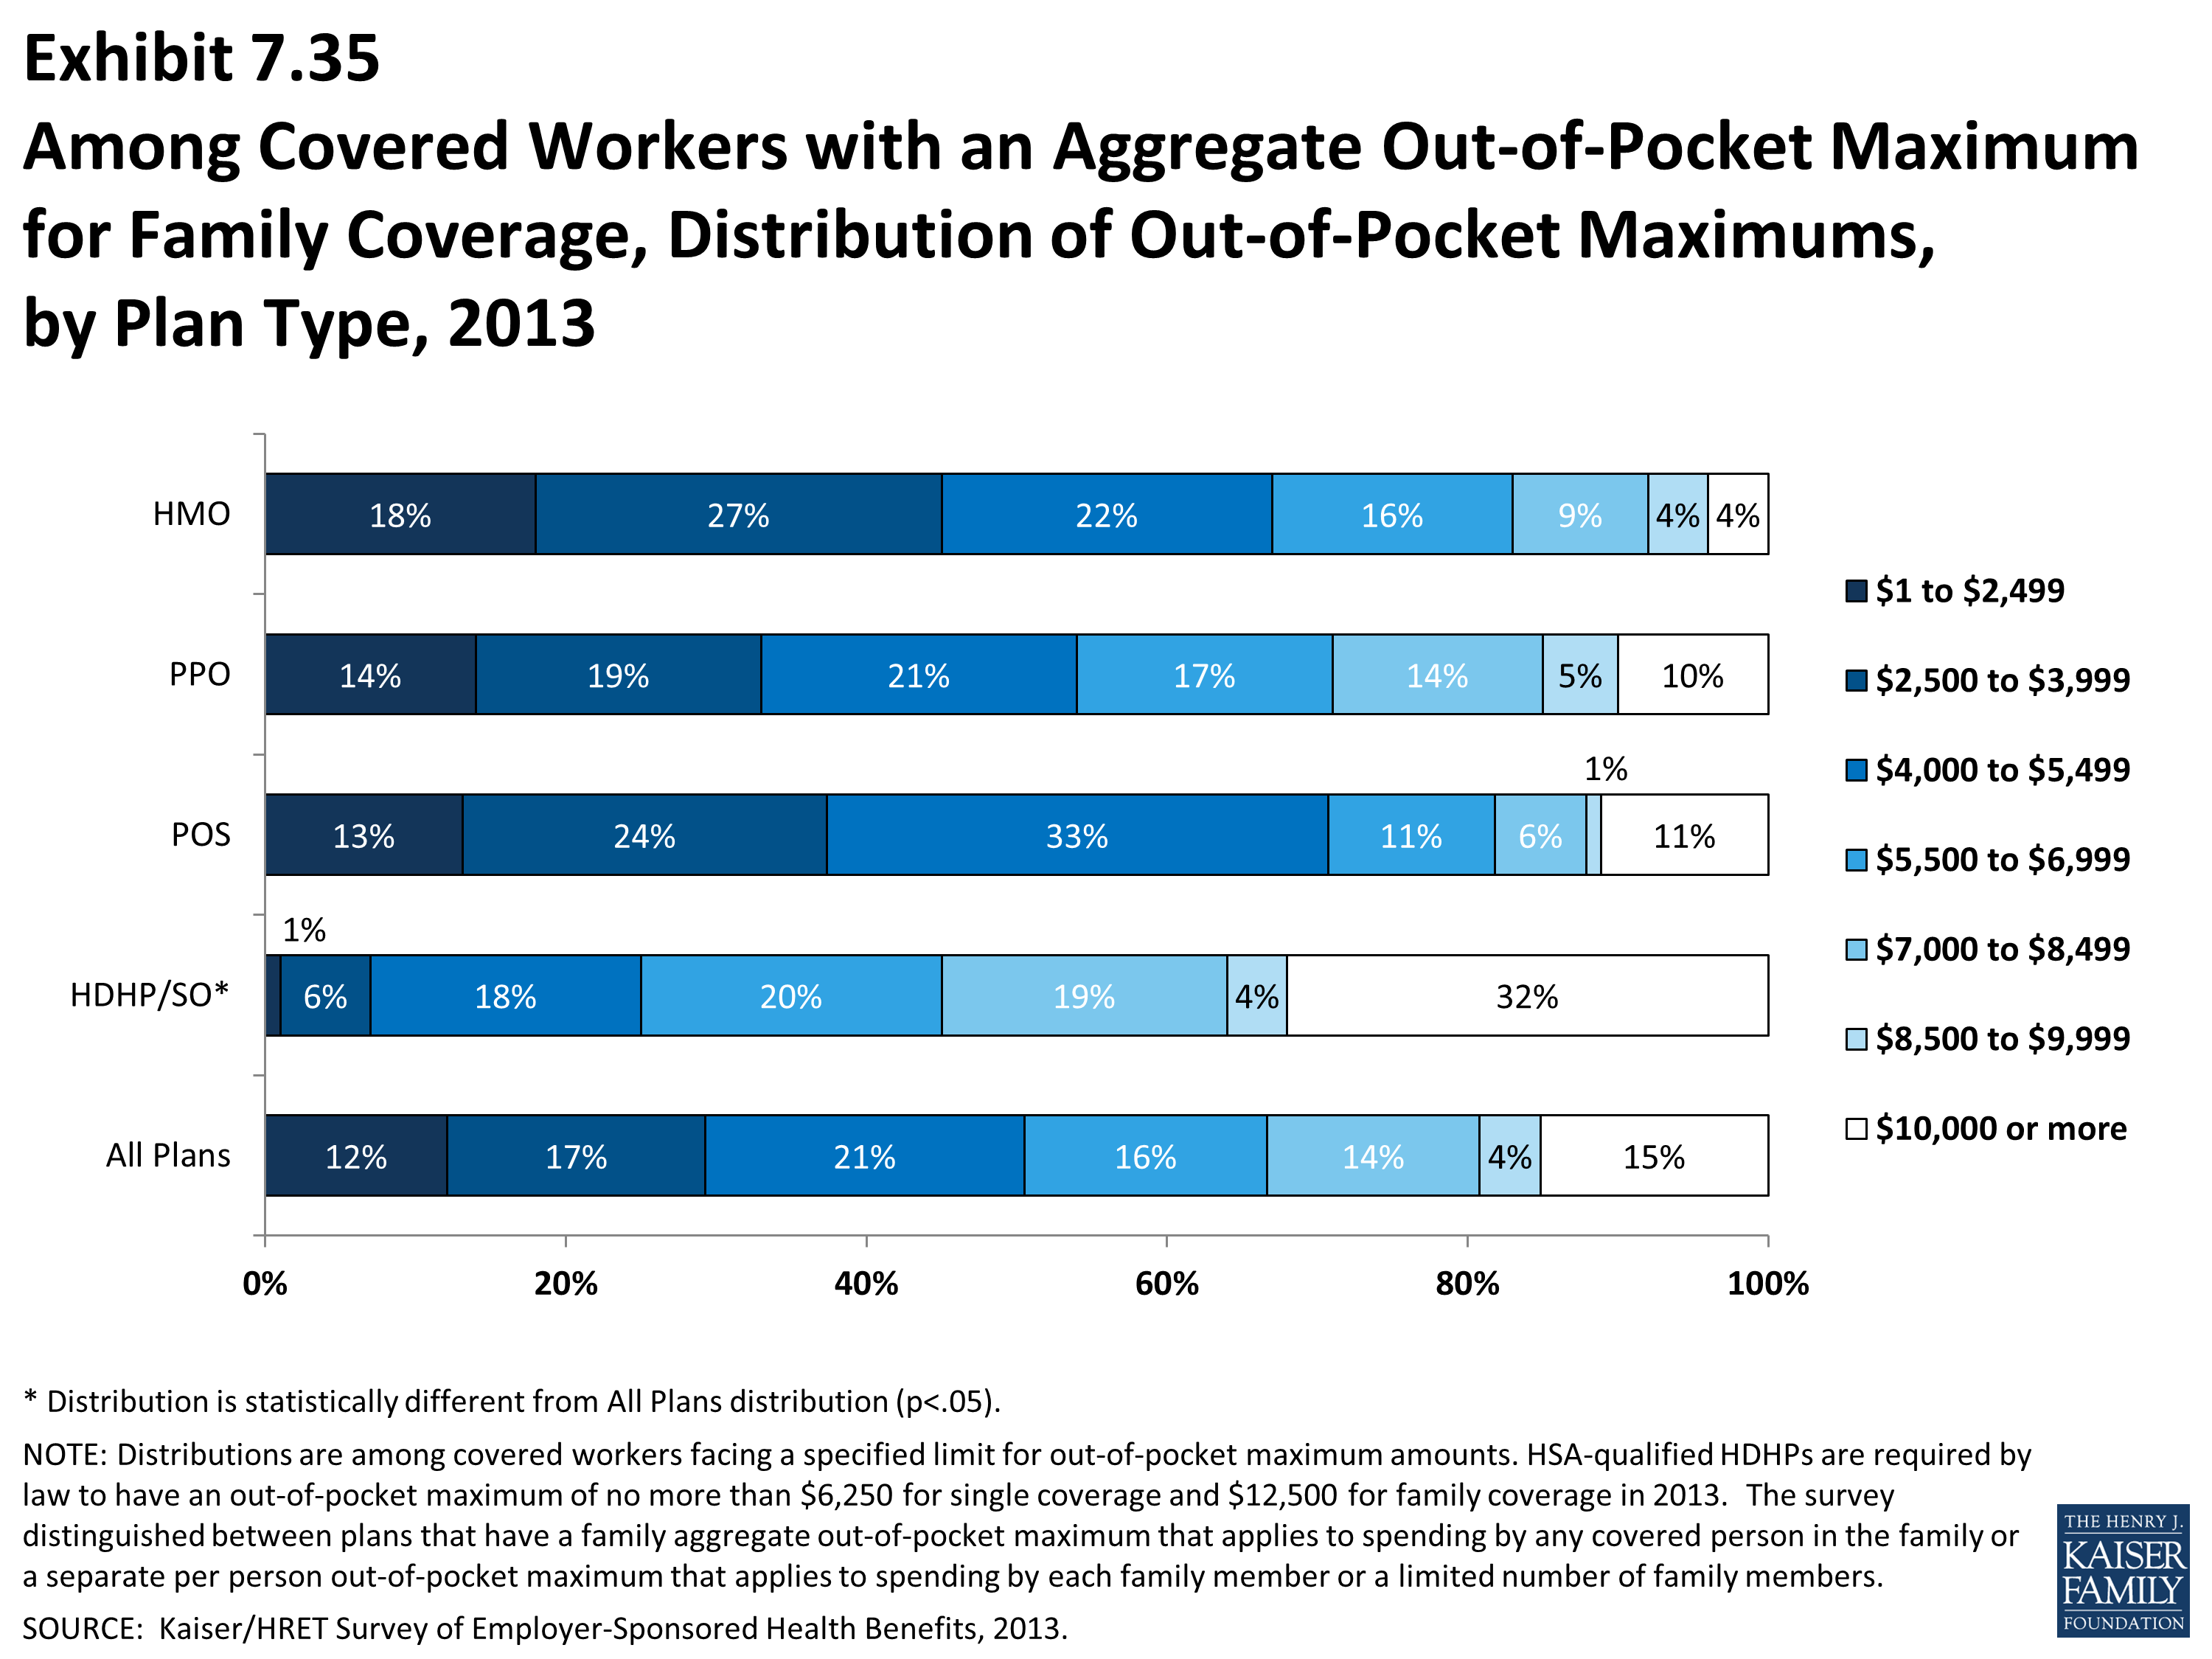
Among Covered Workers with an Aggregate Out-of-Pocket Maximum for Family Coverage, Distribution of Out-of-Pocket Maximums, by Plan Type, 2013
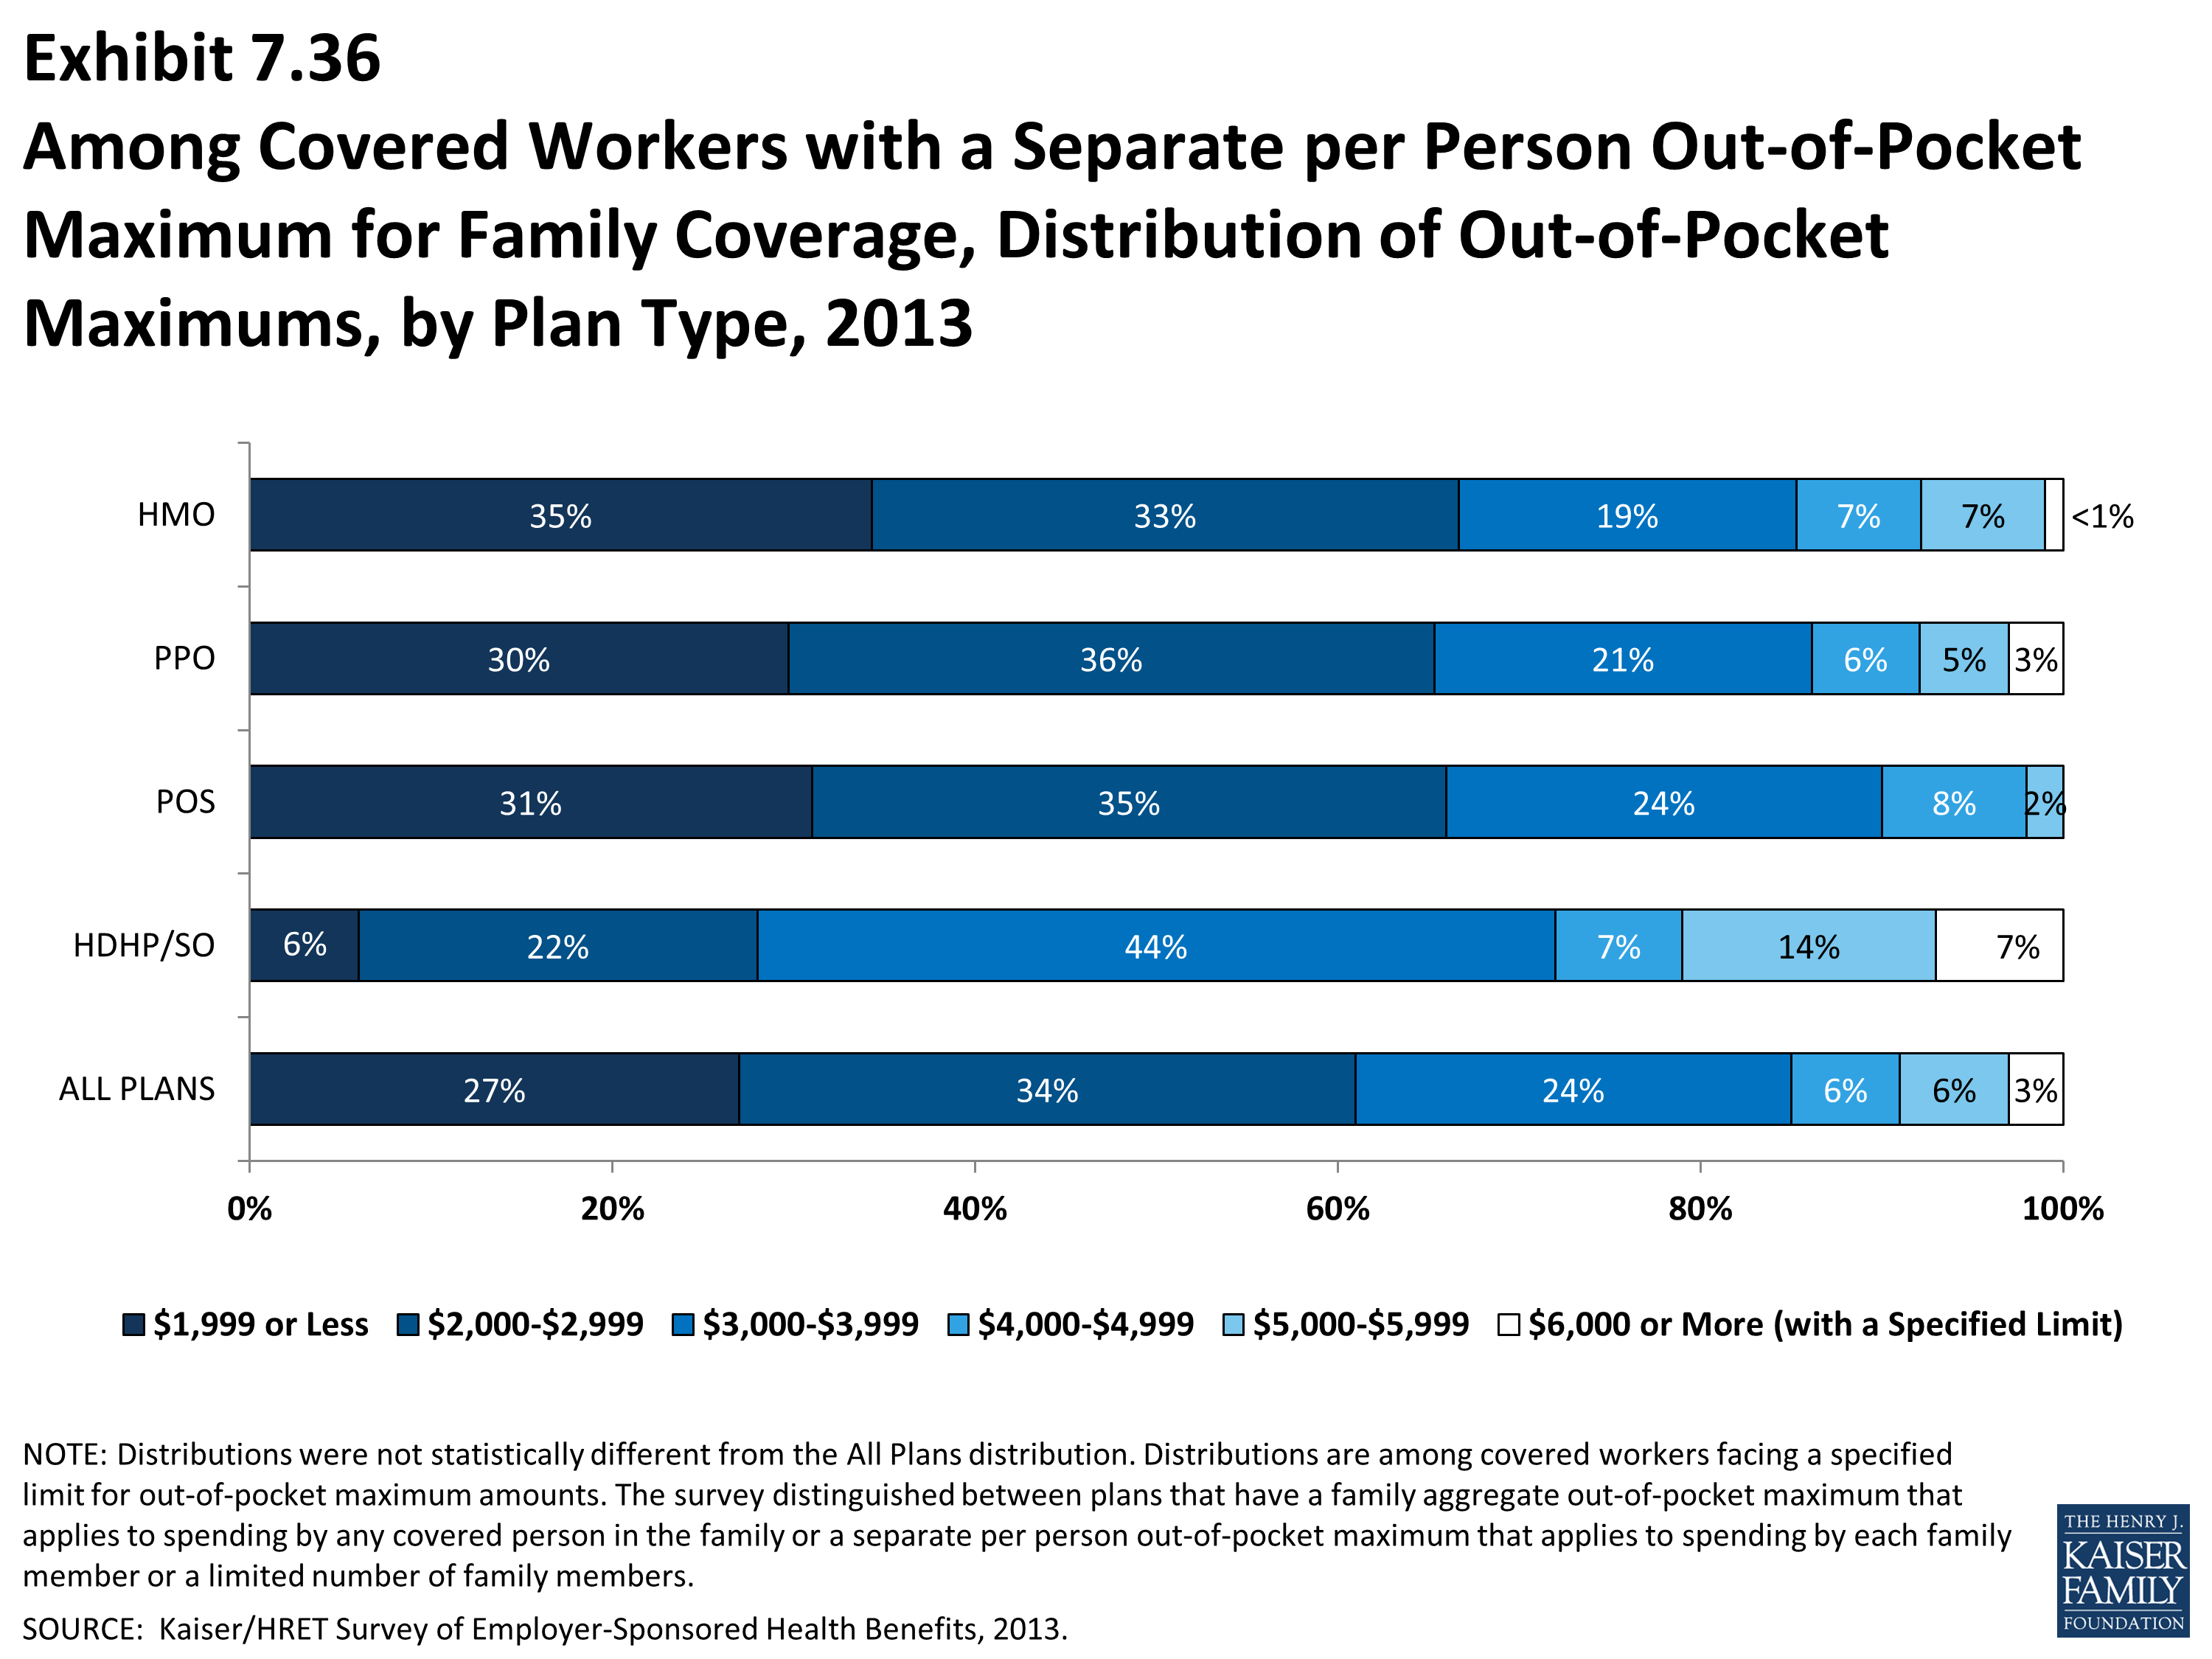
Among Covered Workers with a Separate Per Person Out-of-Pocket Maximum for Family Coverage, Distribution of Out-of-Pocket Maximums, by Plan Type, 2013
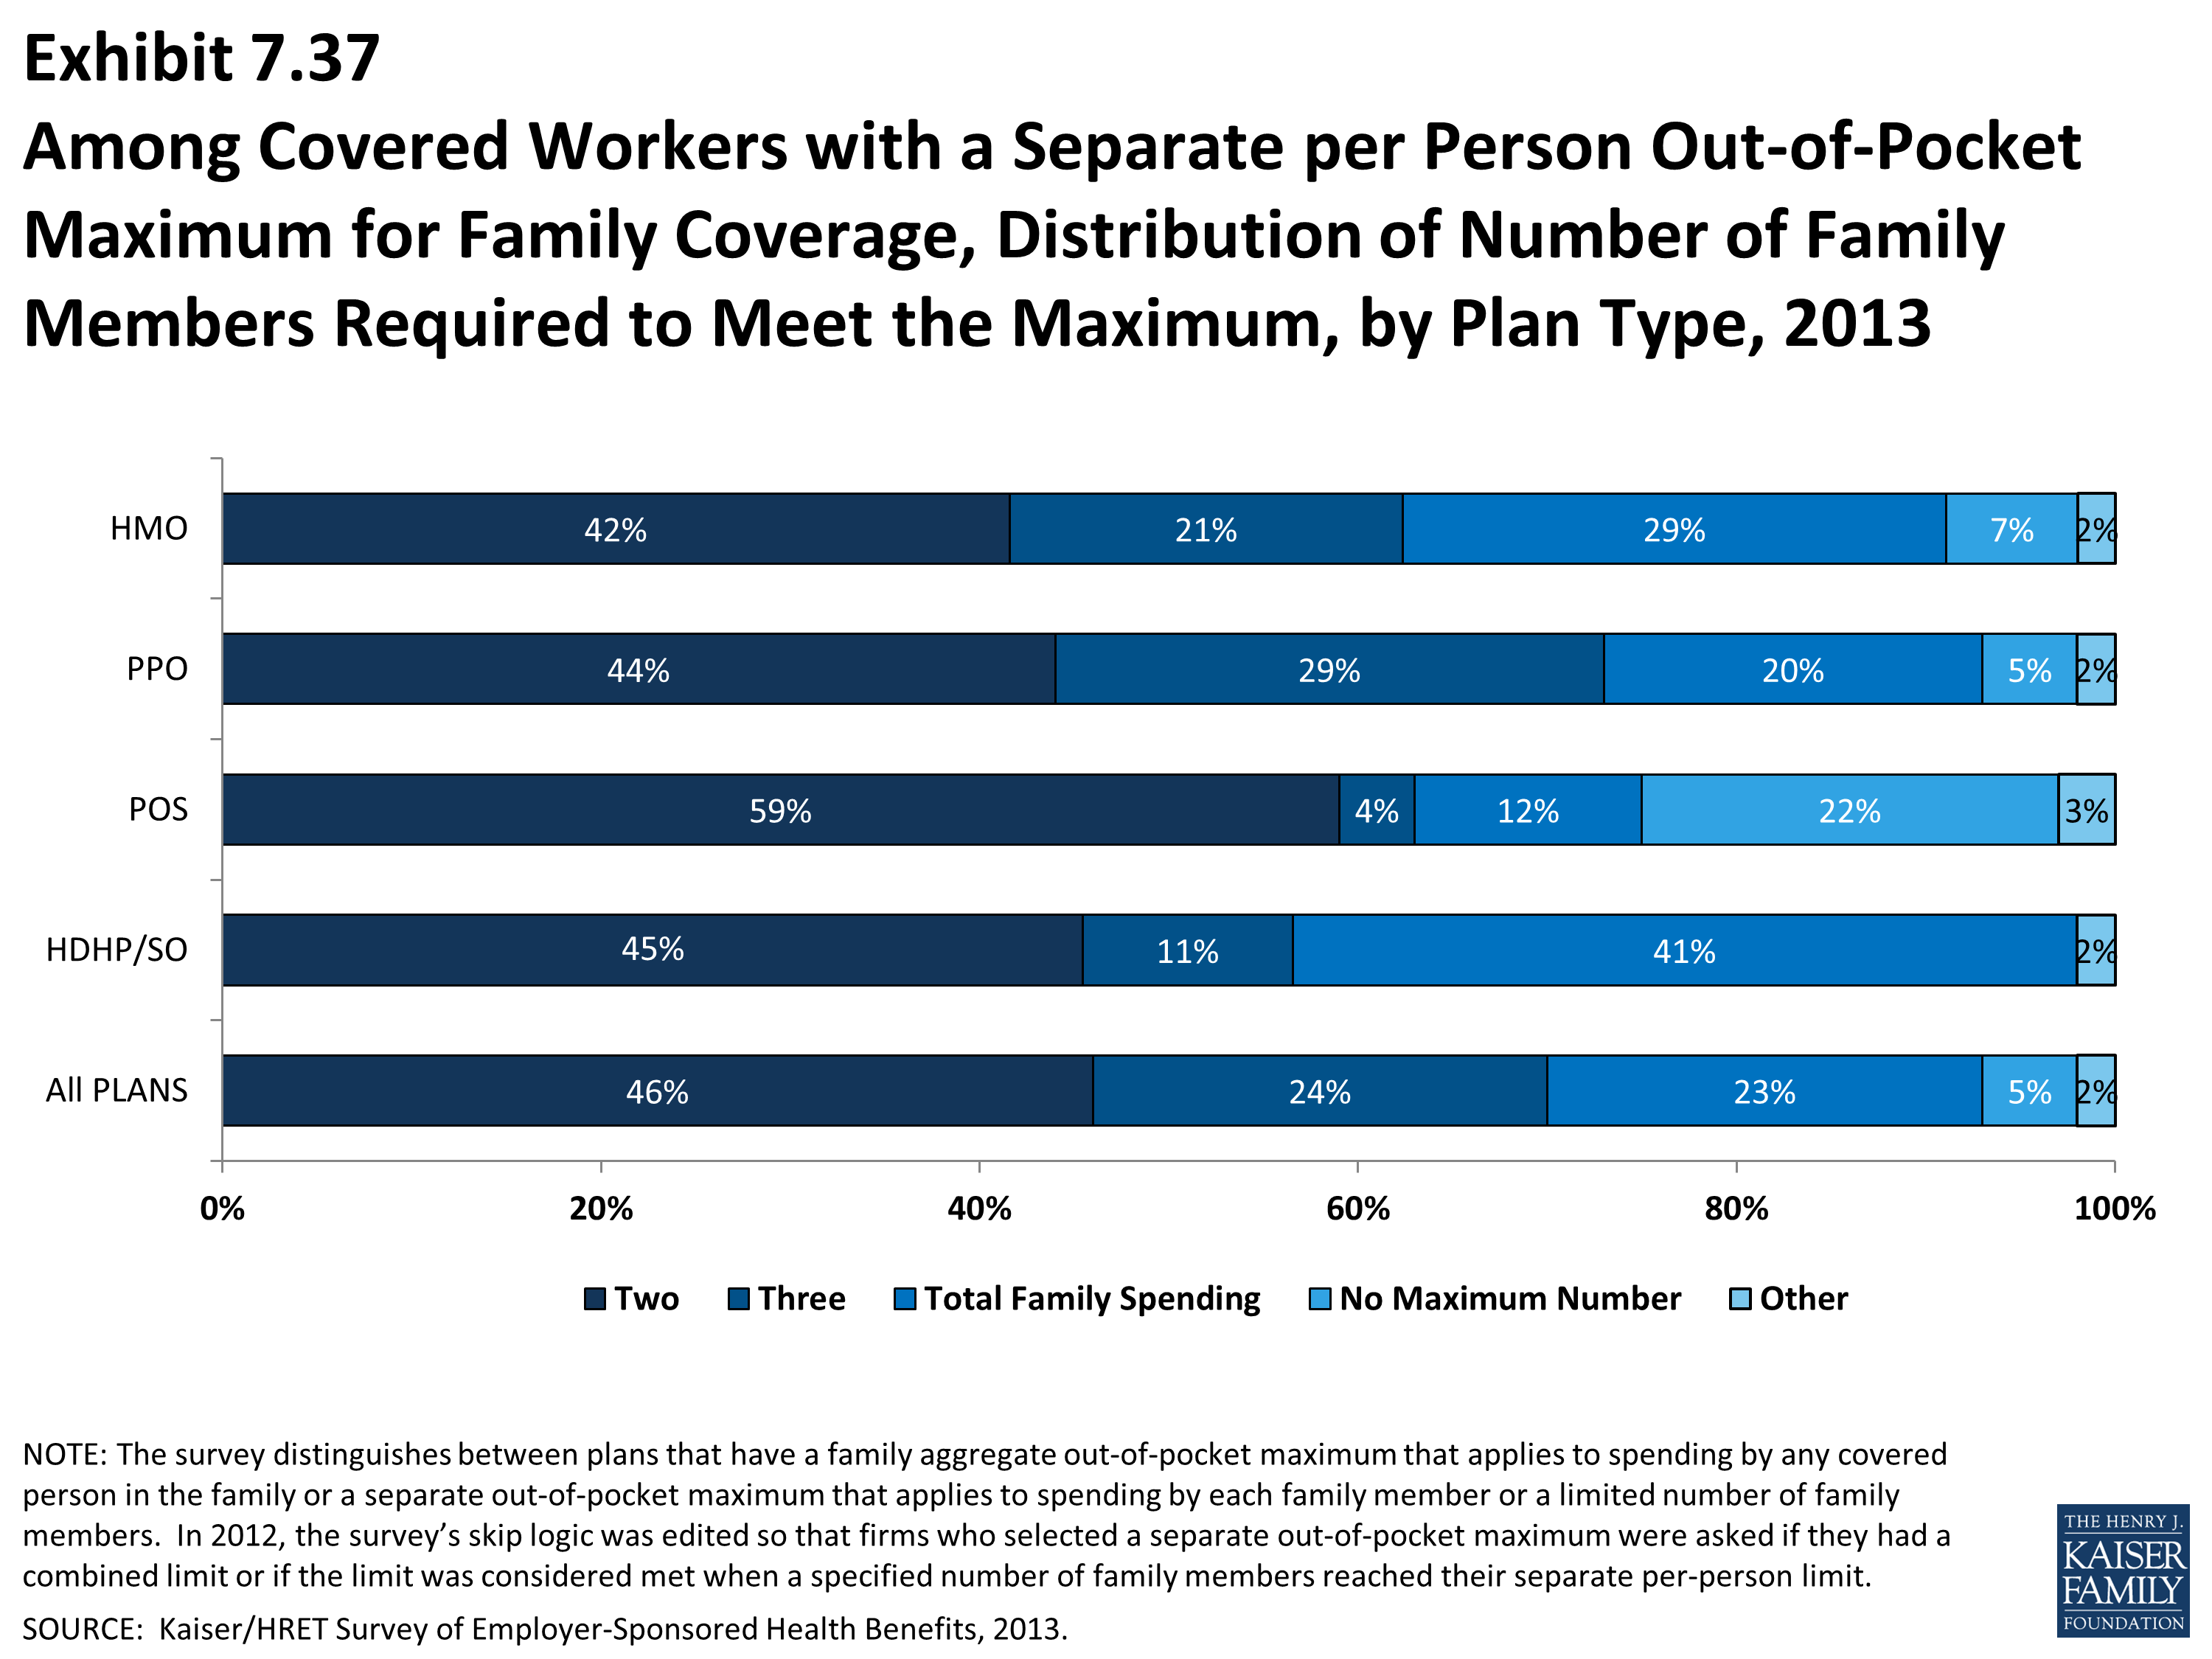
Among Covered Workers with a Separate Per Person Out-of-Pocket Maximum for Family Coverage, Distribution of Number of Family Members Required to Meet the Maximum, by Plan Type, 2013
Section Eight: High-Deductible Health Plans with Savings Option
Changes in law over the past few years have permitted the establishment of new types of savings arrangements for health care. The two most common are health reimbursement arrangements (HRAs) and health savings accounts (HSAs). HRAs and HSAs are both financial accounts that workers or their family members can use to pay for health care services. These savings arrangements are often (or, in the case of HSAs, always) paired with health plans with high deductibles. The survey treats high-deductible plans that can be paired with a savings option as a distinct plan type – High-Deductible Health Plan with Savings Option (HDHP/SO) – even if the plan would otherwise be considered a PPO, HMO, POS plan, or conventional health plan. Specifically for the survey, HDHP/SOs are defined as (1) health plans with a deductible of at least $1,000 for single coverage and $2,000 for family coverage1 offered with an HRA (referred to as HDHP/HRAs); or (2) high-deductible health plans that meet the federal legal requirements to permit an enrollee to establish and contribute to an HSA (referred to as HSA-qualified HDHPs).2
Percentage of Firms Offering HDHP/HRAs and HSA-Qualified HDHPs, and Enrollment
- Twenty-three percent of firms offering health benefits offer an HDHP/HRA or an HSA-qualified HDHP. Among firms offering health benefits, 6% offer an HDHP/HRA and 17% offer an HSA-qualified HDHP (Exhibit 8.1).
- Firms with 5,000 or more workers are significantly more likely to offer an HDHP/SO than smaller firms. Forty-three percent of firms with 1,000 or more workers offer an HDHP/SO, compared to 22% of firms with 3 to 199 workers, 39% of firms with 200-999 workers (Exhibit 8.2).
Health Reimbursement Arrangements (HRAs) are medical care reimbursement plans established by employers that can be used by employees to pay for health care. HRAs are funded solely by employers. Employers typically commit to make a specified amount of money available in the HRA for premiums and medical expenses incurred by employees or their dependents. HRAs are accounting devices, and employers are not required to expend funds until an employee incurs expenses that would be covered by the HRA. Unspent funds in the HRA usually can be carried over to the next year (sometimes with a limit). Employees cannot take their HRA balances with them if they leave their job, although an employer can choose to make the remaining balance available to former employees to pay for health care.
HRAs often are offered along with a high-deductible health plan (HDHP). In such cases, the employee pays for health care first from his or her HRA and then out-of-pocket until the health plan deductible is met. Sometimes certain preventive services or other services such as prescription drugs are paid for by the plan before the employee meets the deductible.
Health Savings Accounts (HSAs) are savings accounts created by individuals to pay for health care. An individual may establish an HSA if he or she is covered by a “qualified health plan” which is a plan with a high deductible (i.e., a deductible of at least $1,250 for single coverage and $2,500 for family coverage in 2013) that also meets other requirements.[1] Employers can encourage their employees to create HSAs by offering an HDHP that meets the federal requirements. Employers in some cases also may assist their employees by identifying HSA options, facilitating applications, or negotiating favorable fees from HSA vendors.
Both employers and employees can contribute to an HSA, up to the statutory cap of $3,250 for single coverage and $6,450 for family coverage in 2013. Employee contributions to the HSA are made on a pre-income tax basis, and some employers arrange for their employees to fund their HSAs through payroll deductions. Employers are not required to contribute to HSAs established by their employees but, if they elect to do so, their contributions are not taxable to the employee. Interest and other earnings on amounts in an HSA are not taxable. Withdrawals from the HSA by the account owner to pay for qualified health care expenses are not taxed. The savings account is owned by the individual who creates the account, so employees retain their HSA balances if they leave their job.
1 See U.S. Department of the Treasury, Health Savings Accounts, available at http://www.irs.gov/pub/irs-drop/rp-12-26.pdf
- Twenty percent of covered workers are enrolled in an HDHP/SO in 2013, similar to the 19% enrolled last year (Exhibit 8.5). Enrollment in HDHP/SOs had increased significantly in previous years (17% in 2011; 13% in 2010; 8% in 2009).
- Nine percent of covered workers are enrolled in HDHP/HRAs in 2013, and 11% percent of covered workers are enrolled in HSA-qualified HDHPs (Exhibit 8.5).
Plan Deductibles
- As expected, workers enrolled in HDHP/SOs have higher deductibles than workers enrolled in HMOs, PPOs, or POS plans.
- The average general annual deductible for single coverage is $1,854 for HDHP/HRAs and $2,098 for HSA-qualified HDHPs (Exhibit 8.7). These averages are similar to the amounts reported in recent years. There is wide variation around these averages (Exhibit 8.9). Eighteen percent of covered workers are enrolled in a HDHP/SO with a deductible of $3,000 or more.
- Since 2006, the survey has collected information on two types of family deductibles. The survey asks employers whether the family deductible amount is (1) an aggregate amount (i.e., the out-of-pocket expenses of all family members are counted until the deductible is satisfied), or (2) a per-person amount that applies to each family member (typically with a limit on the number of family members that would be required to meet the deductible amount).
- The average aggregate deductibles for workers with family coverage are $4,059 for HDHP/HRAs and $4,037 for HSA-qualified HDHPs (Exhibit 8.7). There is wide variation around these average amounts for family coverage (Exhibit 8.1). Almost a third of covered workers enrolled in HDHP/So plans have an aggregate family deductible of $5,000 dollars or more.
Out-of-Pocket Maximum Amounts
- HSA-qualified HDHPs are legally required to have a maximum annual out-of-pocket liability of no more than $6,250 for single coverage and $12,500 for family coverage in 2013. HDHP/HRAs have no similar requirement.
- The average annual out-of-pocket maximum for single coverage is $4,093 for HDHP/HRAs3 and $3,509 for HSA-qualified HDHPs (Exhibit 8.7).
- As with deductibles, the survey asks employers whether the family out-of-pocket maximum liability is (1) an aggregate amount that applies to spending by any covered person in the family, or (2) a separate per person amount that applies to spending by each family member or a limited number of family members. The survey also asks whether spending by enrollees on various services counts towards meeting the plan out-of-pocket maximum.
- Among covered workers with family coverage whose out-of-pocket maximum is an aggregate amount that applies to spending by any covered person in the family, the average annual out-of-pocket maximums are $8,886 for HDHP/HRAs and $7,077 for HSA-qualified HDHPs (Exhibit 8.7).
Premiums
- In 2013, the average annual premiums for HDHP/HRAs are $5,655 for single coverage and $16,477 for family coverage (Exhibit 8.8).
- The average annual premium for workers in HSA-qualified HDHPs is $5,006 for single coverage and $14,155 for family coverage. These amounts are lower than the average single and family premium for workers in plans that are not HDHP/SOs (Exhibit 8.7).
Worker Contributions to Premiums
- The average annual worker contributions to premiums for workers enrolled in HDHP/HRAs are $1,058 for single coverage and $4,087 for family coverage (Exhibit 8.8).
- The average annual worker contributions to premiums for workers in HSA-qualified HDHPs are $726 for single coverage and $3,241 for family coverage (Exhibit 8.8). The average contribution for single coverage for workers in HSA-qualified HDHPs is significantly less than the average premium contribution made by covered workers in plans that are not HDHP/SOs (Exhibit 8.7).
Employer Contributions to Premiums and Savings Options
- Employers contribute to HDHP/SOs in two ways: through their contributions toward the premium for the health plan and through their contributions (if any, in the case of HSAs) to the savings account option (i.e., the HRAs or HSAs themselves).
- Looking just at the annual employer contributions to premiums, covered workers in HDHP/HRAs on average receive employer contributions of $4,597 for single coverage and $12,390 for family coverage. The average employer contribution for single coverage in HDHP/HRAs is significantly less than the average employer premium contribution for plans that are not HDHP/SOs (Exhibit 8.8).
- The average annual employer contributions to premiums for workers in HSA-qualified HDHPs are $4,280 for single coverage and $10,914 for family coverage. These amounts are lower than the average contributions for single or family coverage for workers in plans that are not HDHP/SOs (Exhibit 8.8).
- When looking at employer contributions to the savings option, workers enrolled in HDHP/HRAs receive, on average, an annual employer contribution to their HRA of $947 for single coverage and $1,800 for family coverage (Exhibit 8.8).
- HRAs are generally structured in such a way that employers may not actually spend the whole amount that they make available to their employees’ HRAs.4 Amounts committed to an employee’s HRA that are not used by the employee generally roll over and can be used in future years, but any balance may revert back to the employer if the employee leaves his or her job. Thus, the employer contribution amounts to HRAs that we capture in the survey may exceed the amount that employers will actually spend.
- Workers enrolled in HSA-qualified HDHPs on average receive an annual employer contribution to their HSA of $653 for single coverage and $1,150 for family coverage (Exhibit 8.8).
- In some cases, employers that sponsor HSA-qualified HDHP/SOs do not make contributions to HSAs established by their employees. Fifty-one percent of employers offering single coverage and fifty percent offering family coverage through HSA-qualified HDHPs do not make contributions towards the HSAs that their workers establish (Exhibit 8.8). Thirty-one percent of workers with single coverage and thirty-two percent of workers with family coverage in an HSA-qualified HDHP do not receive an account contribution from their employer (Exhibit 8.14) and (Exhibit 8.15).
- The percent of covered workers enrolled in a plan where the employer makes no HSA contribution for single coverage is similar to 34% last year and 26% five years ago.
- The average HSA contributions reported above include the portion of covered workers whose employer contribution to the HSA is zero. When those firms that do not contribute to the HSA are excluded from the calculation, the average employer contribution for covered workers is $950 for single coverage and $1,680 for family coverage (Exhibit 8.7).
- Employer contributions to savings account options (i.e., the HRAs and HSAs themselves) for their employees can be added to their health plan premium contributions to calculate total employer contributions toward HDHP/SOs.
- For HDHP/HRAs, the average annual total employer contribution for covered workers is $5,544 for single coverage and $14,190 for family coverage. The average total employer contribution amounts for single and family coverage in HDHP/HRAs are higher than the average amount that employers contribute towards single and family coverage in health plans that are not HDHP/SOs (Exhibit 8.8).
- For HSA-qualified HDHPs, the average annual total employer contribution for covered workers is $4,931 for single coverage and $12,065 for workers with family coverage. The total amounts contributed for workers in HSA-qualified HDHPs for single and family coverage are similar to the amounts contributed for workers not in HDHP/SOs (Exhibit 8.8).
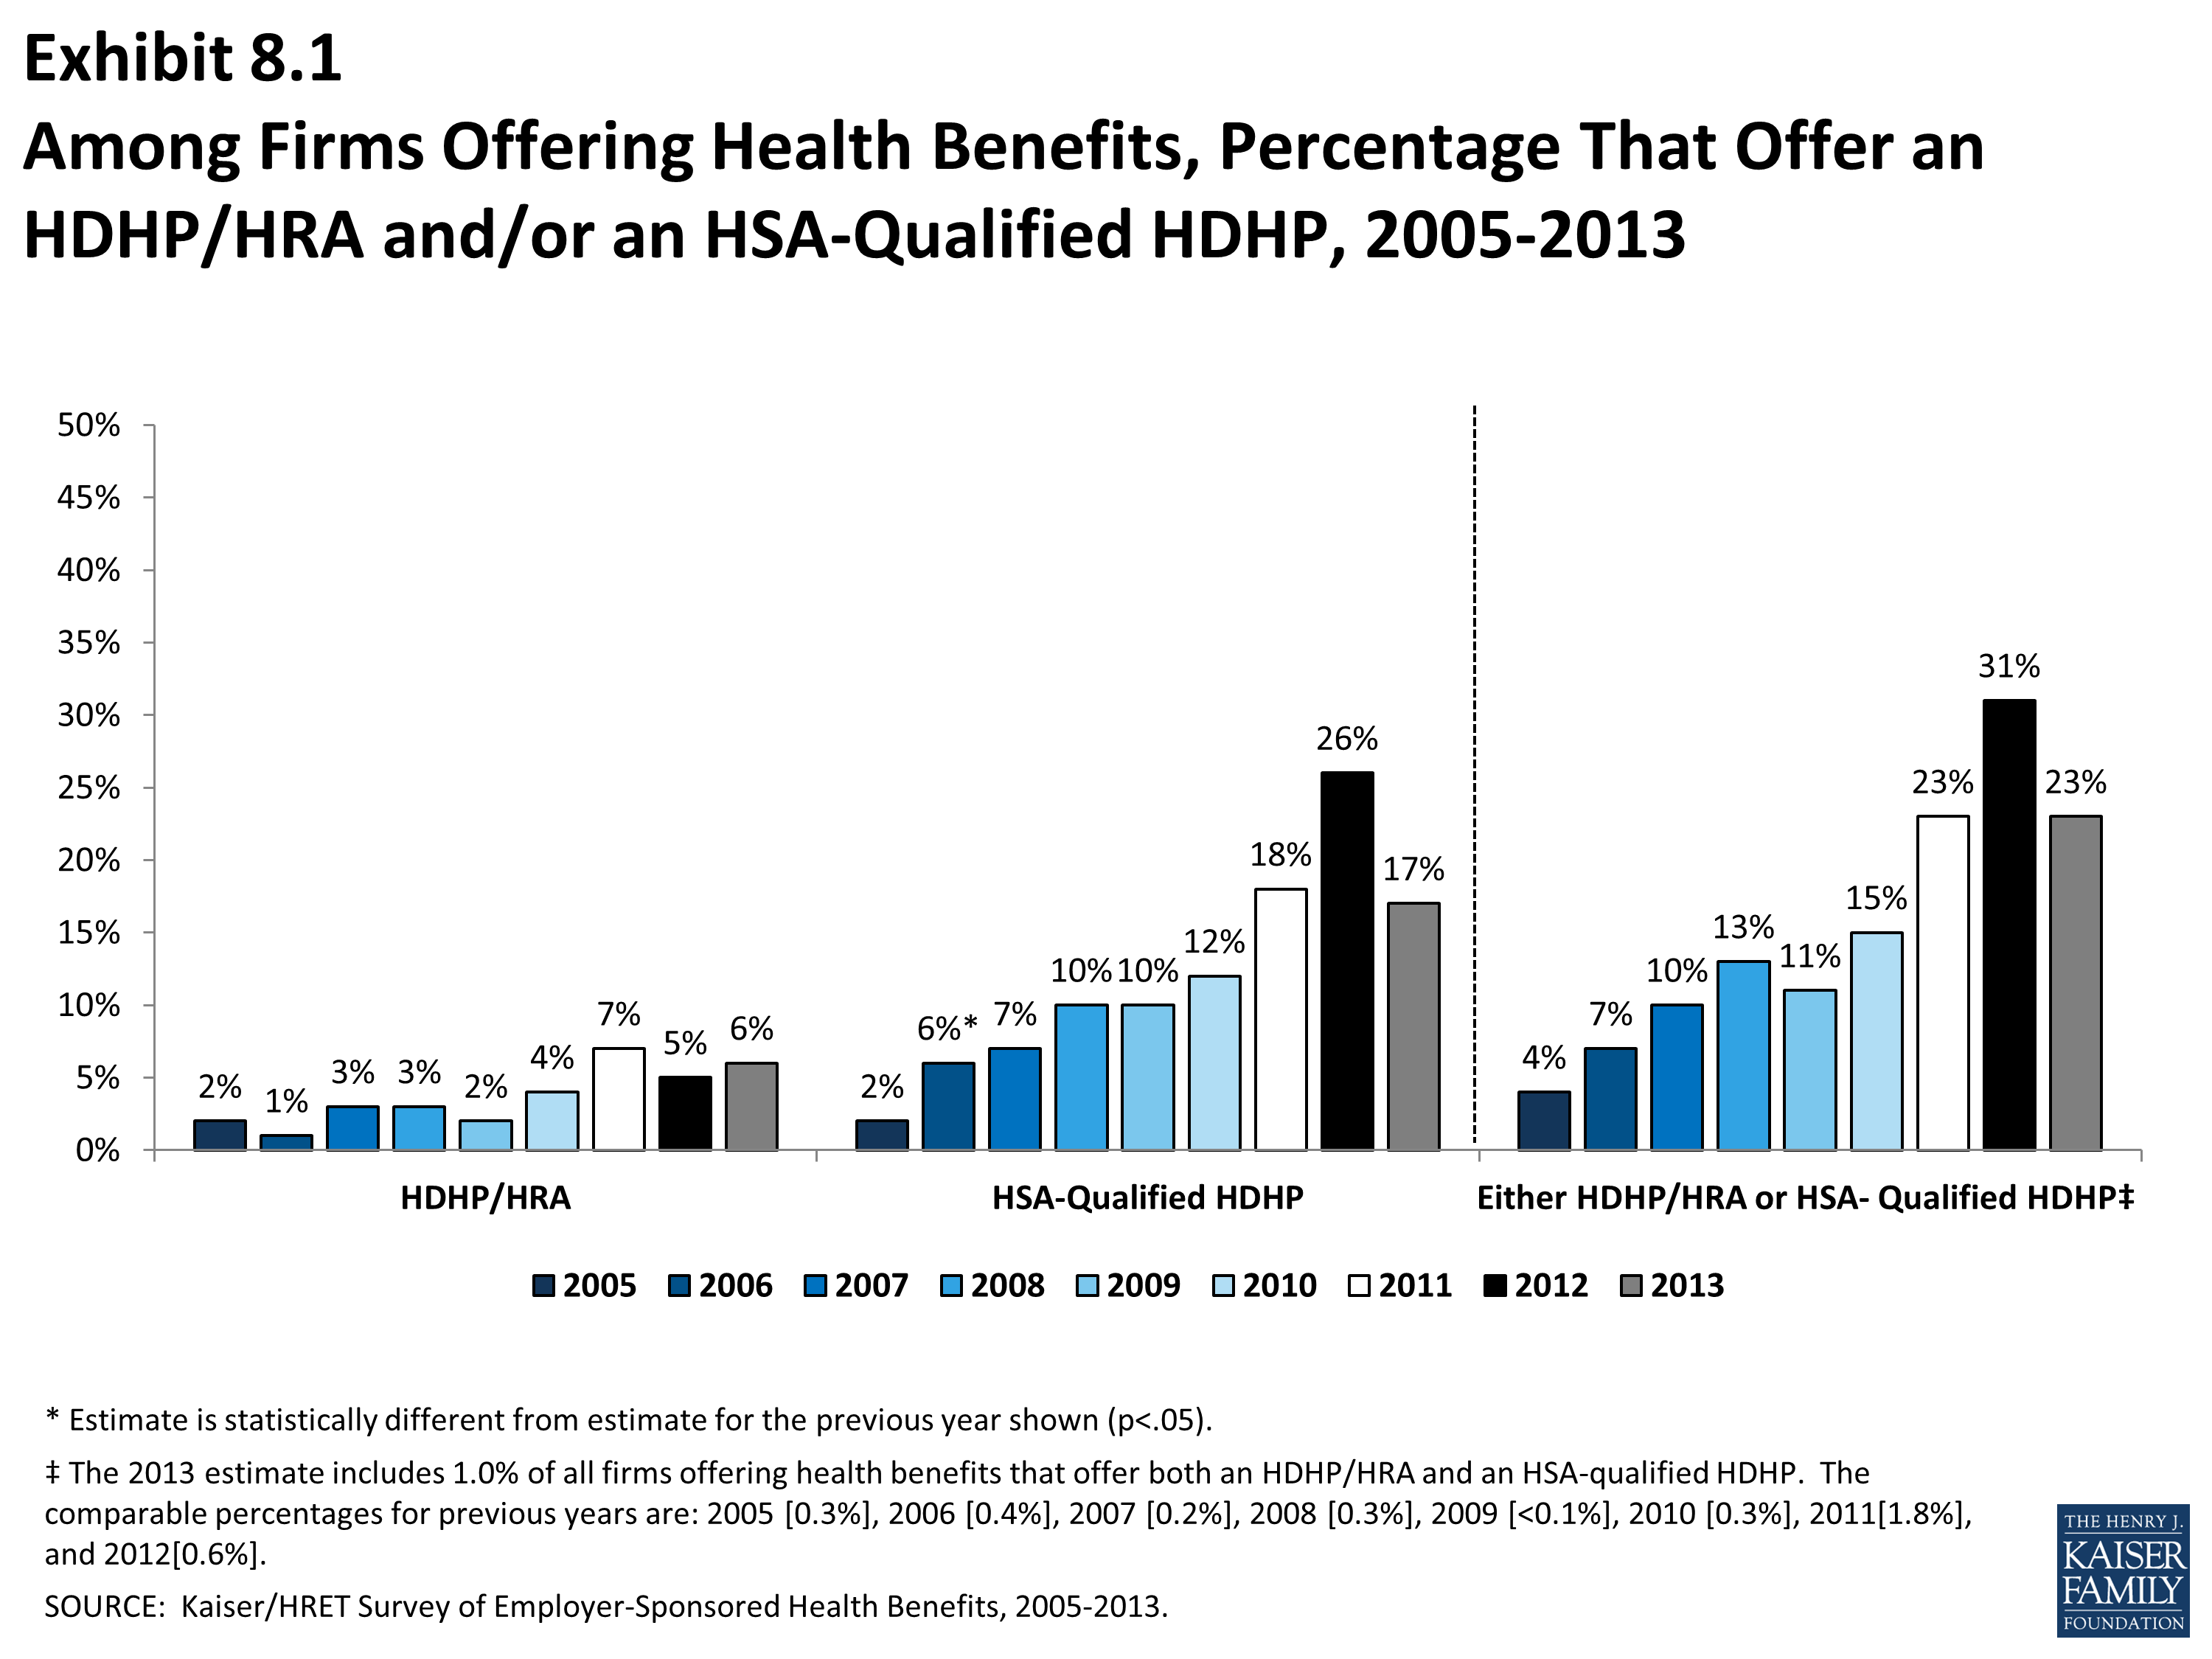
Among Firms Offering Health Benefits, Percentage That Offer an HDHP/HRA and/or an HSA-Qualified HDHP, 2005-2013
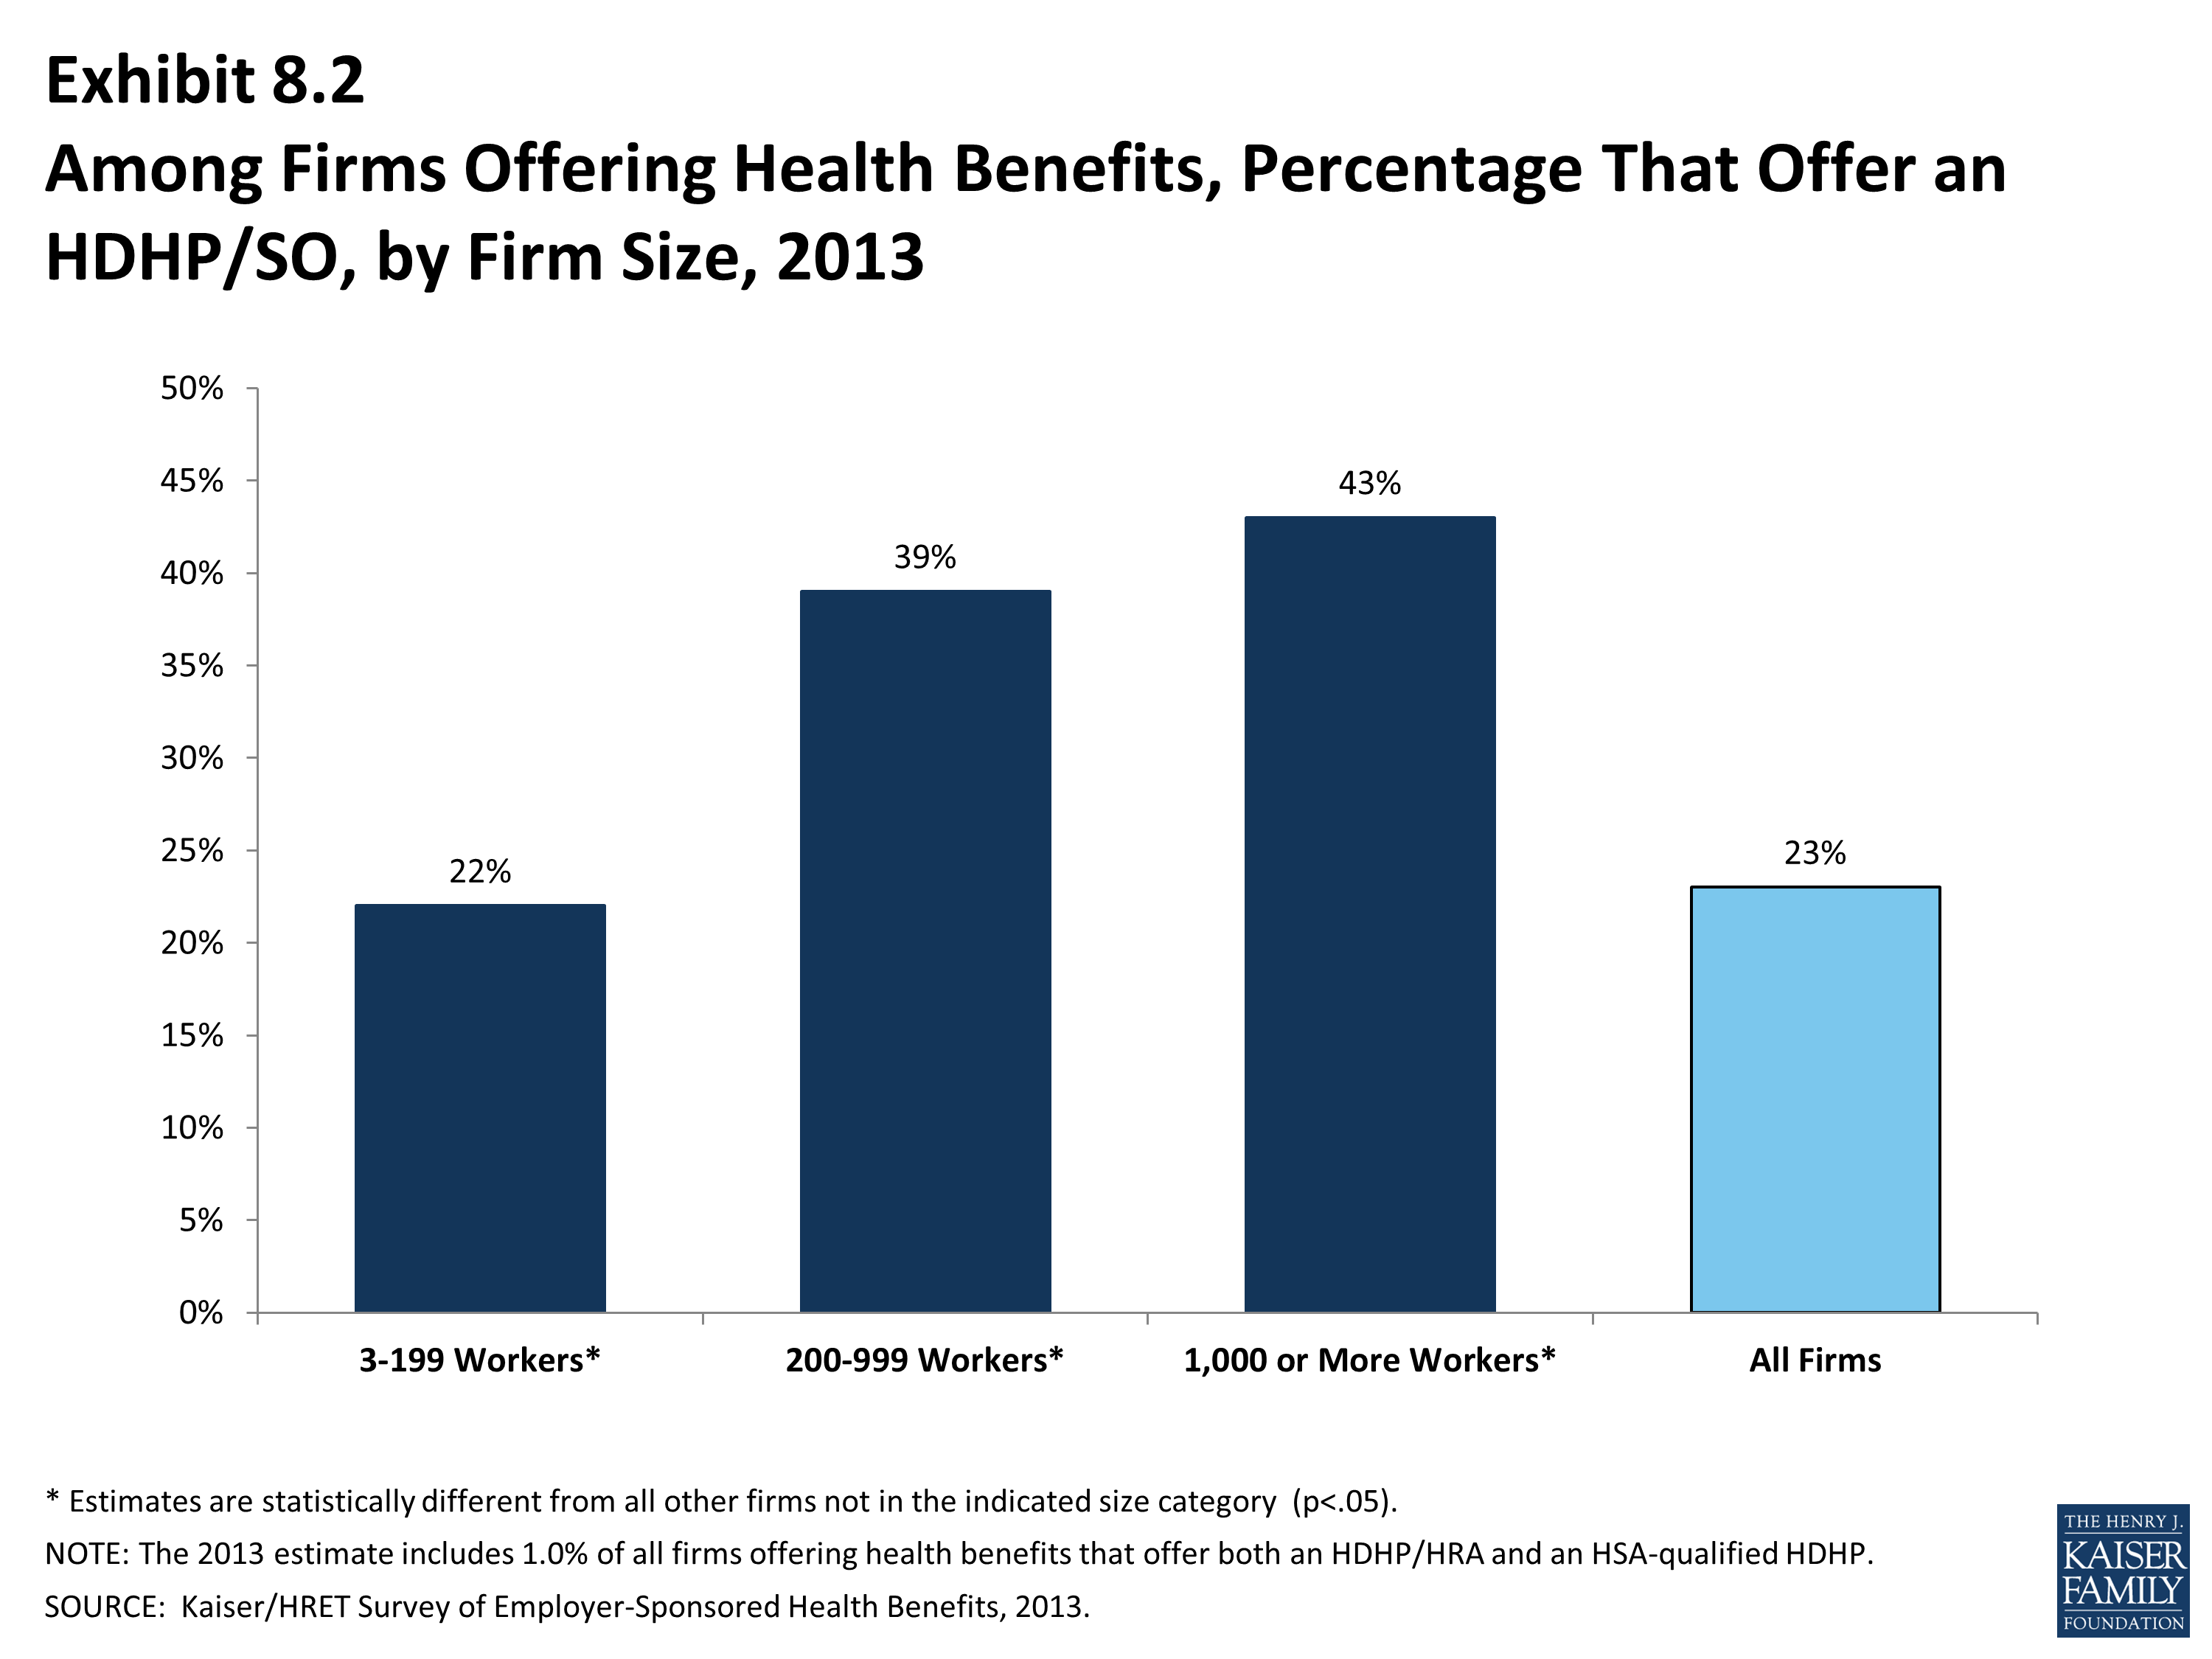
Among Firms Offering Health Benefits, Percentage That Offer an HDHP/SO, by Firm Size, 2013

Among Firms Offering Health Benefits, Percentage That Offer an HDHP/SO, by Firm Size, 2005-2013
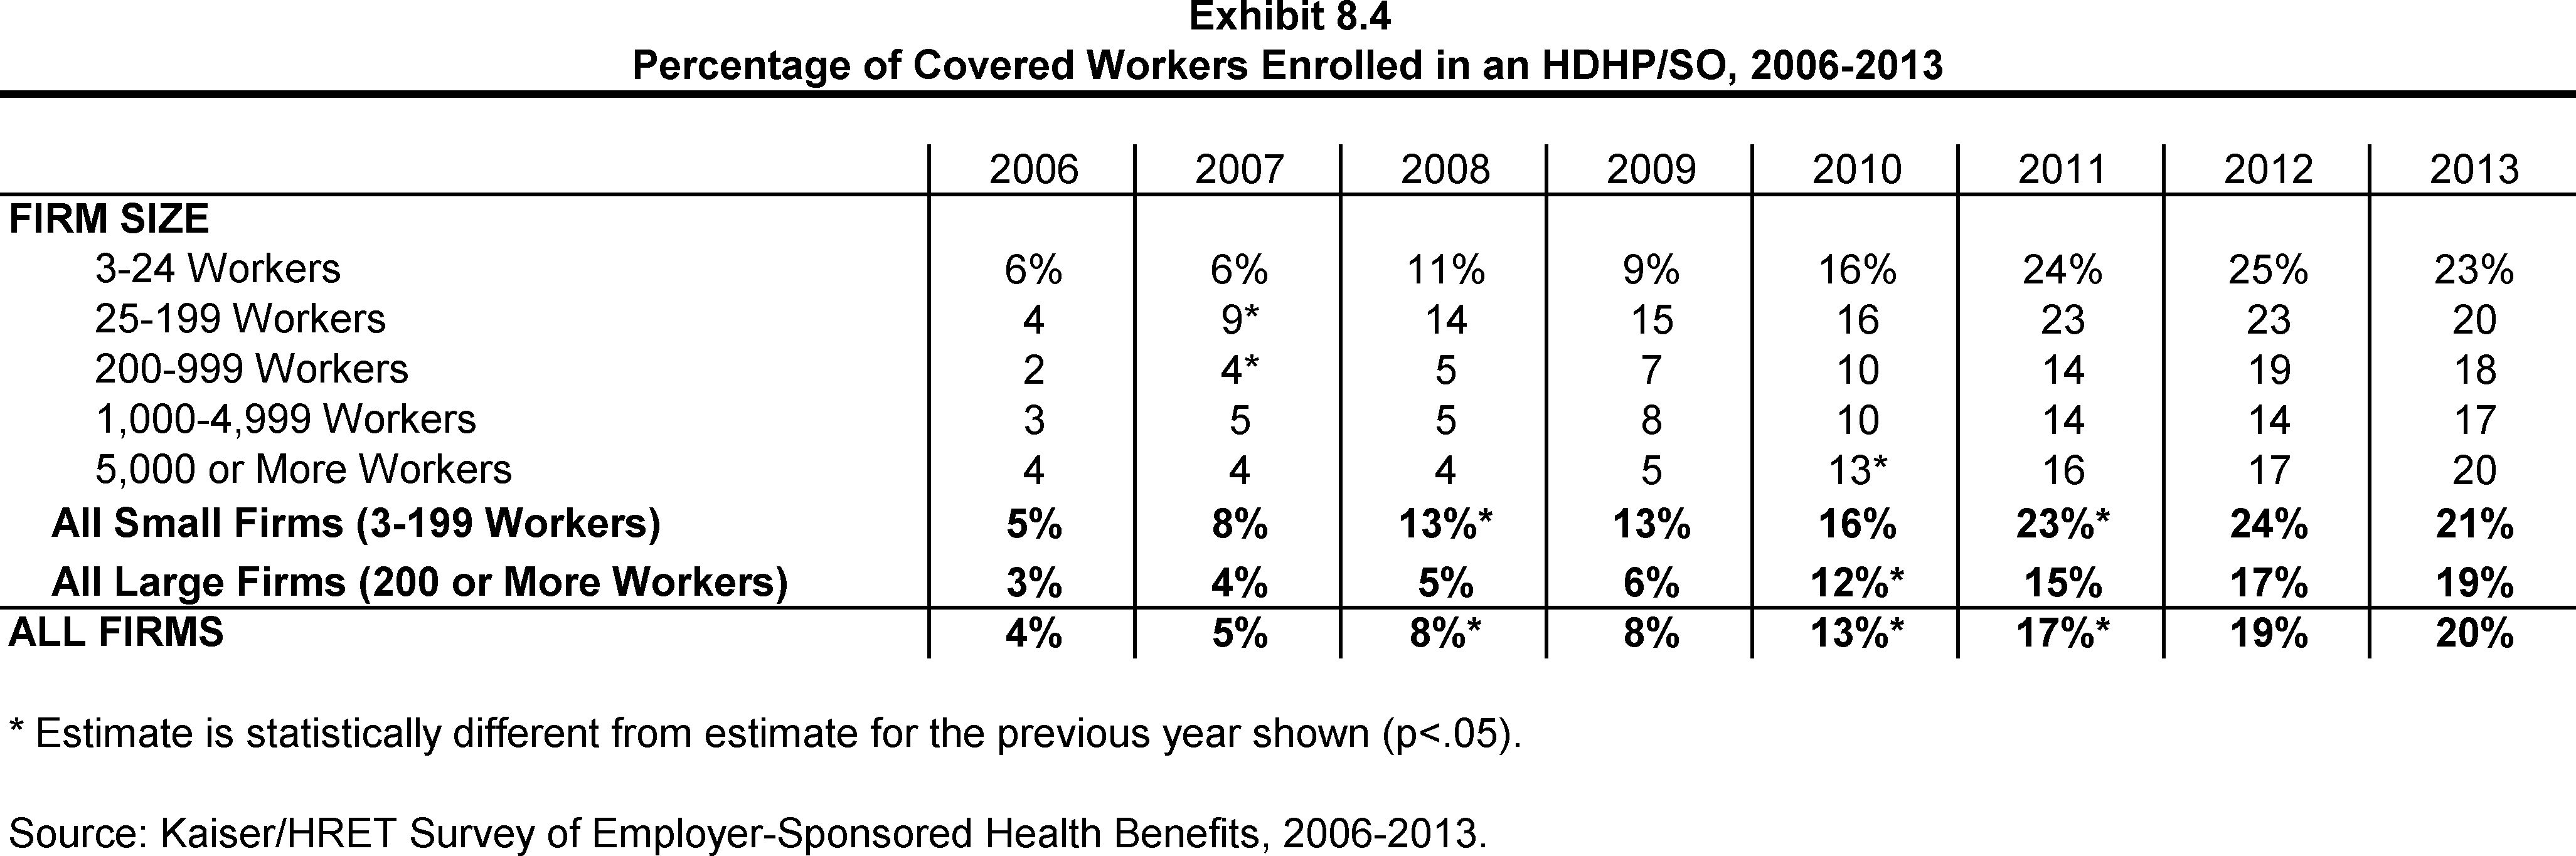
Percentage of Covered Workers Enrolled in an HDHP/SO, 2006-2013
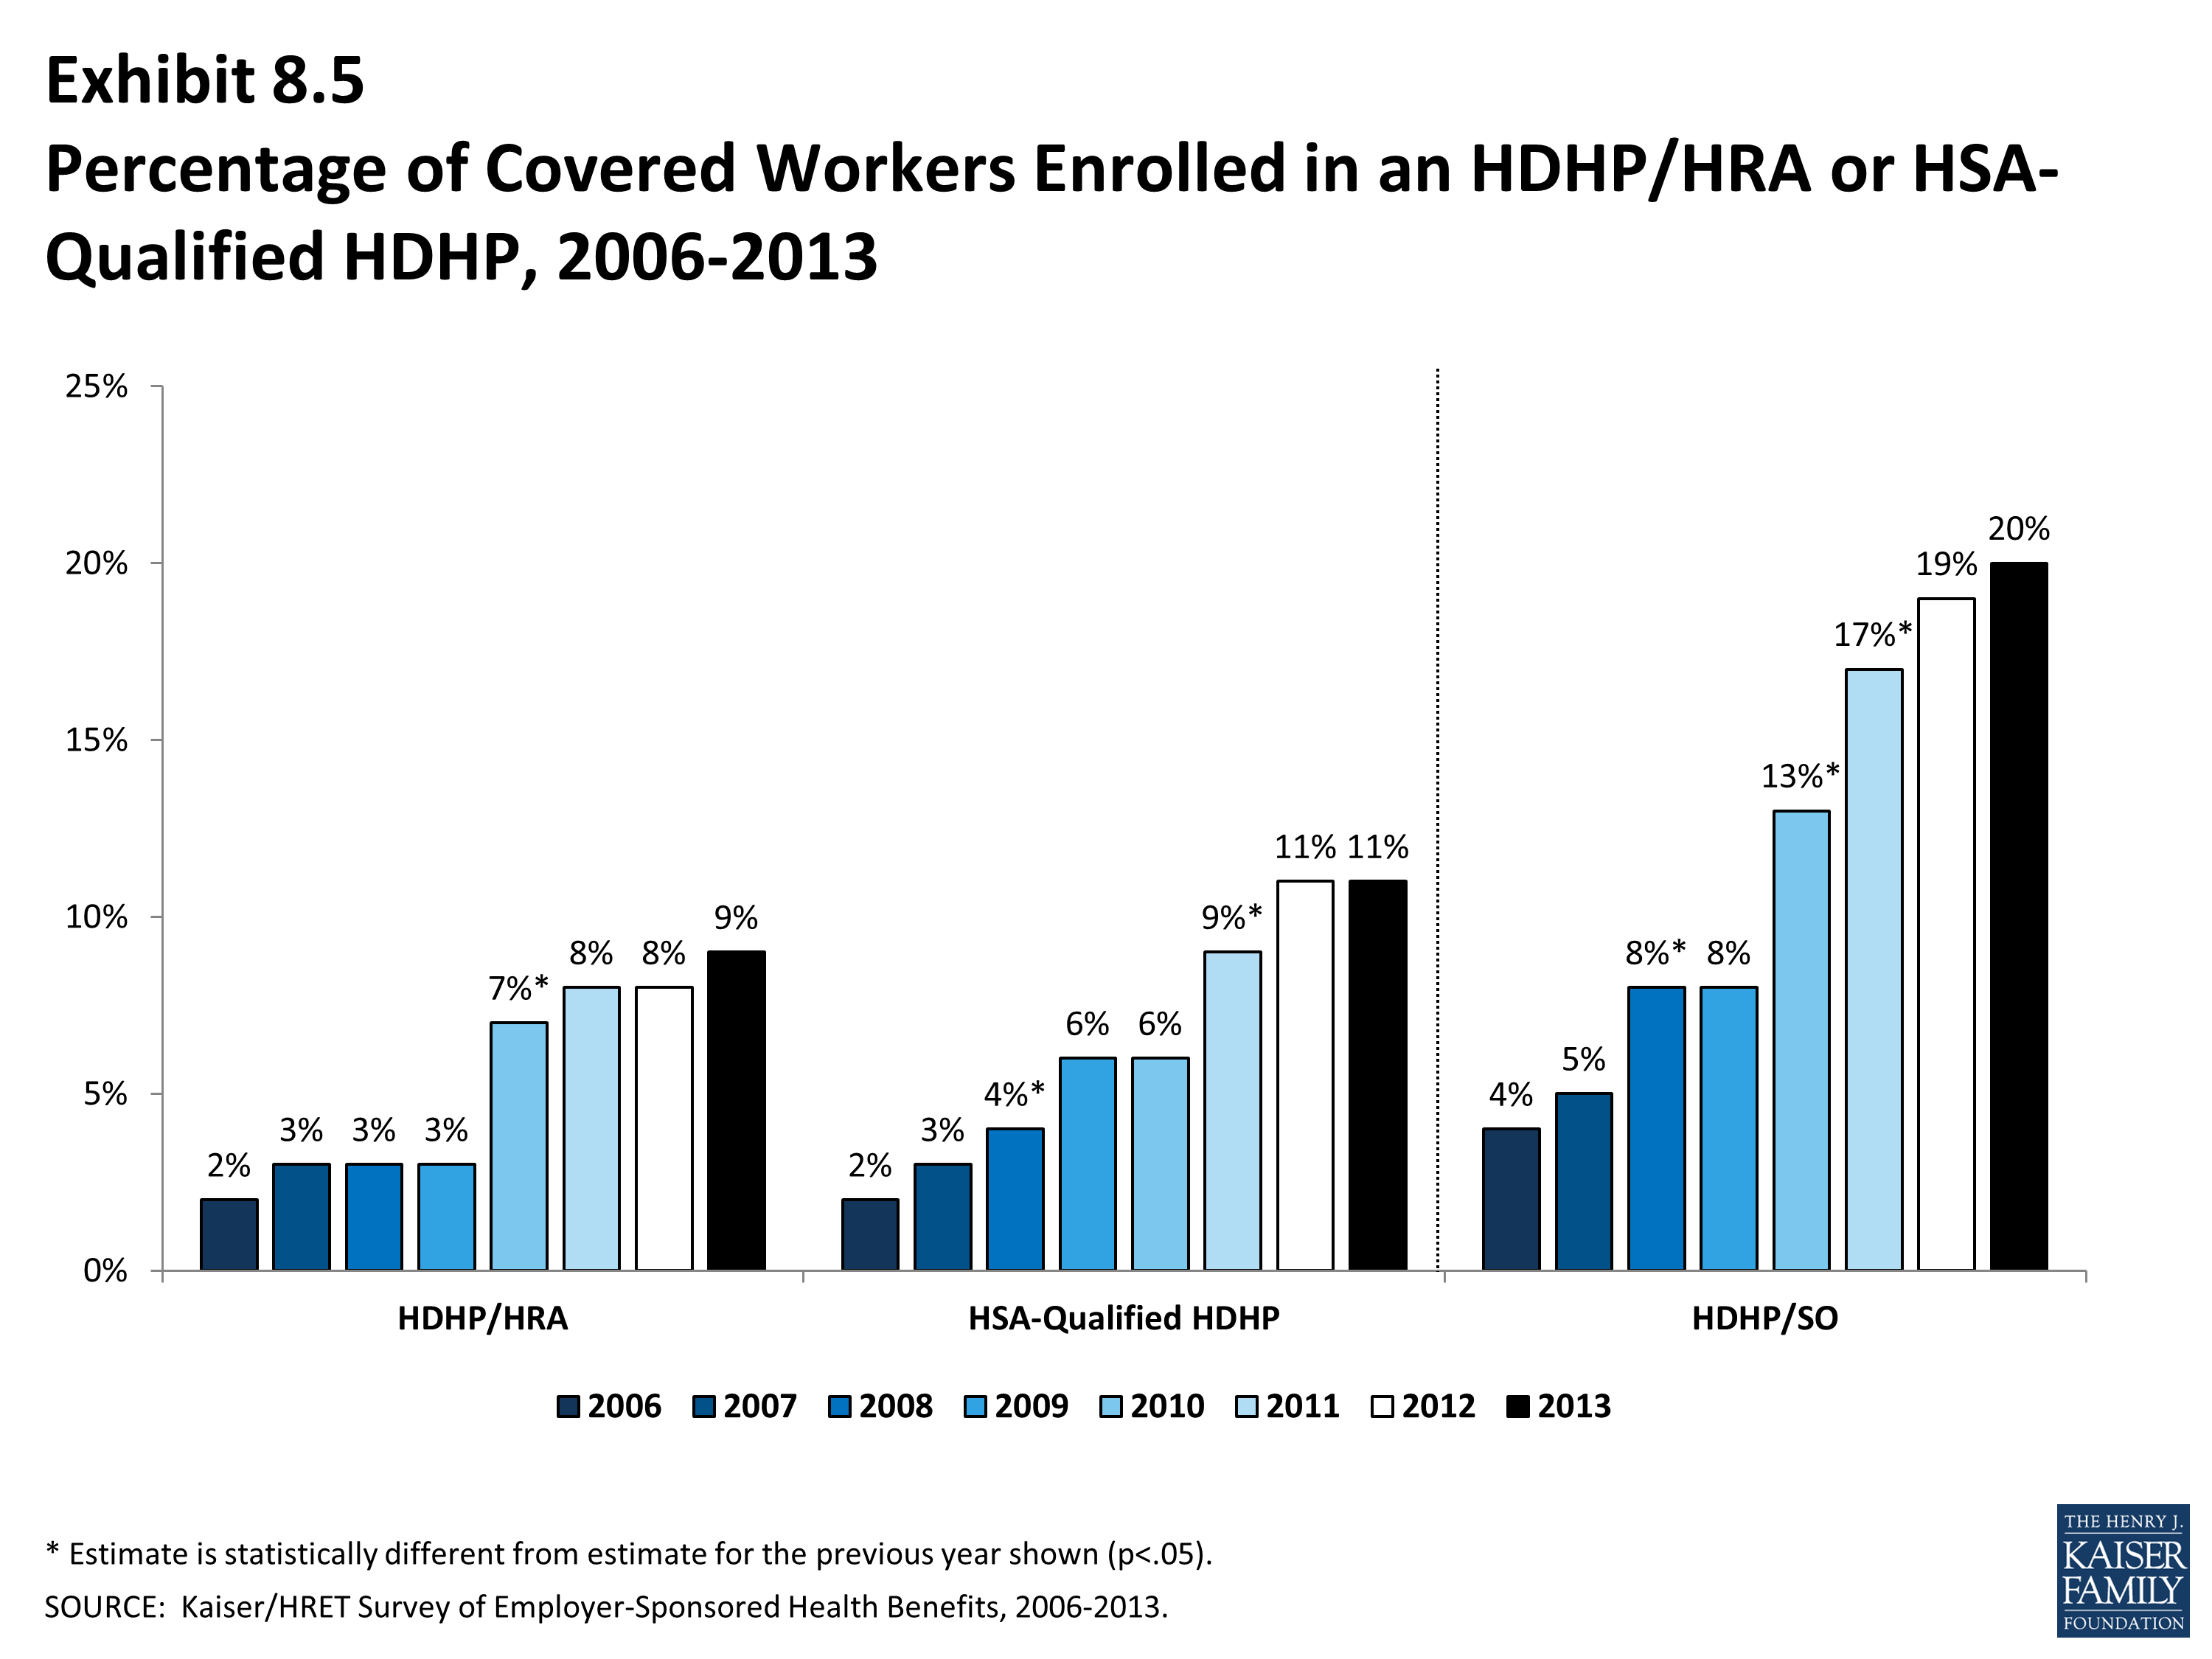
Percentage of Covered Workers Enrolled in an HDHP/HRA or HSA-Qualified HDHP, 2006-2013
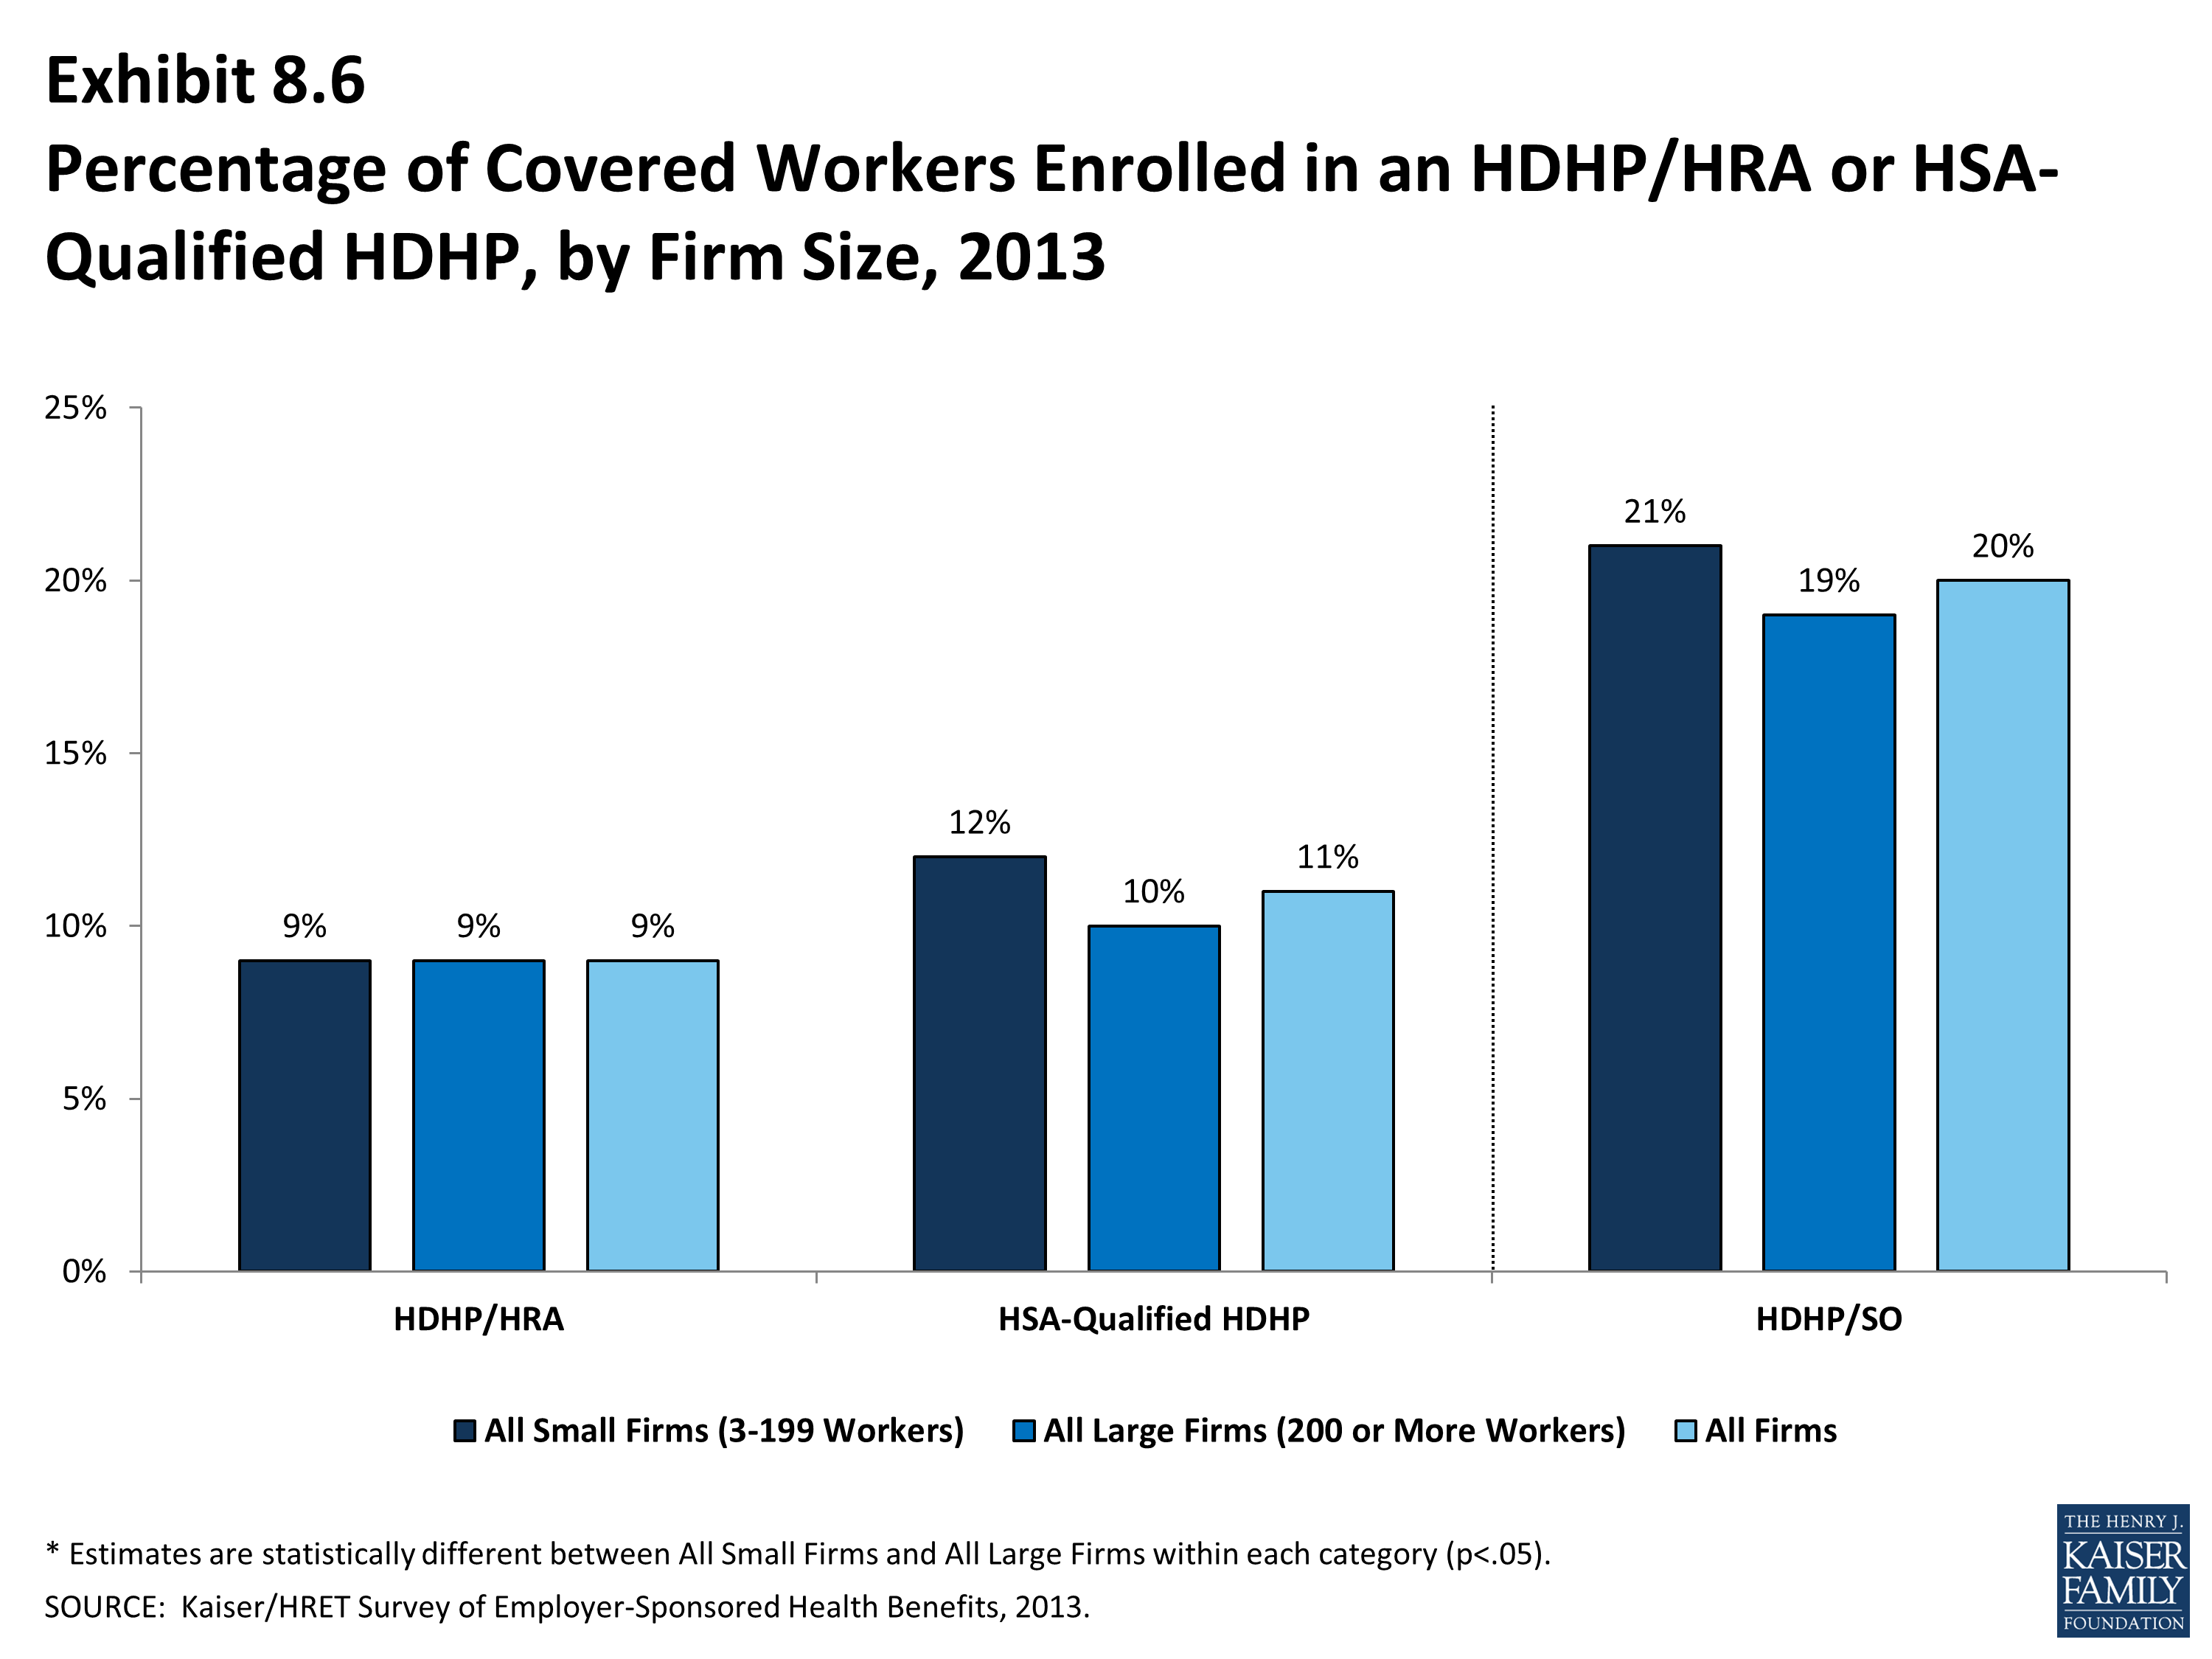
Percentage of Covered Workers Enrolled in an HDHP/HRA or HSA-Qualified HDHP, by Firm Size, 2013
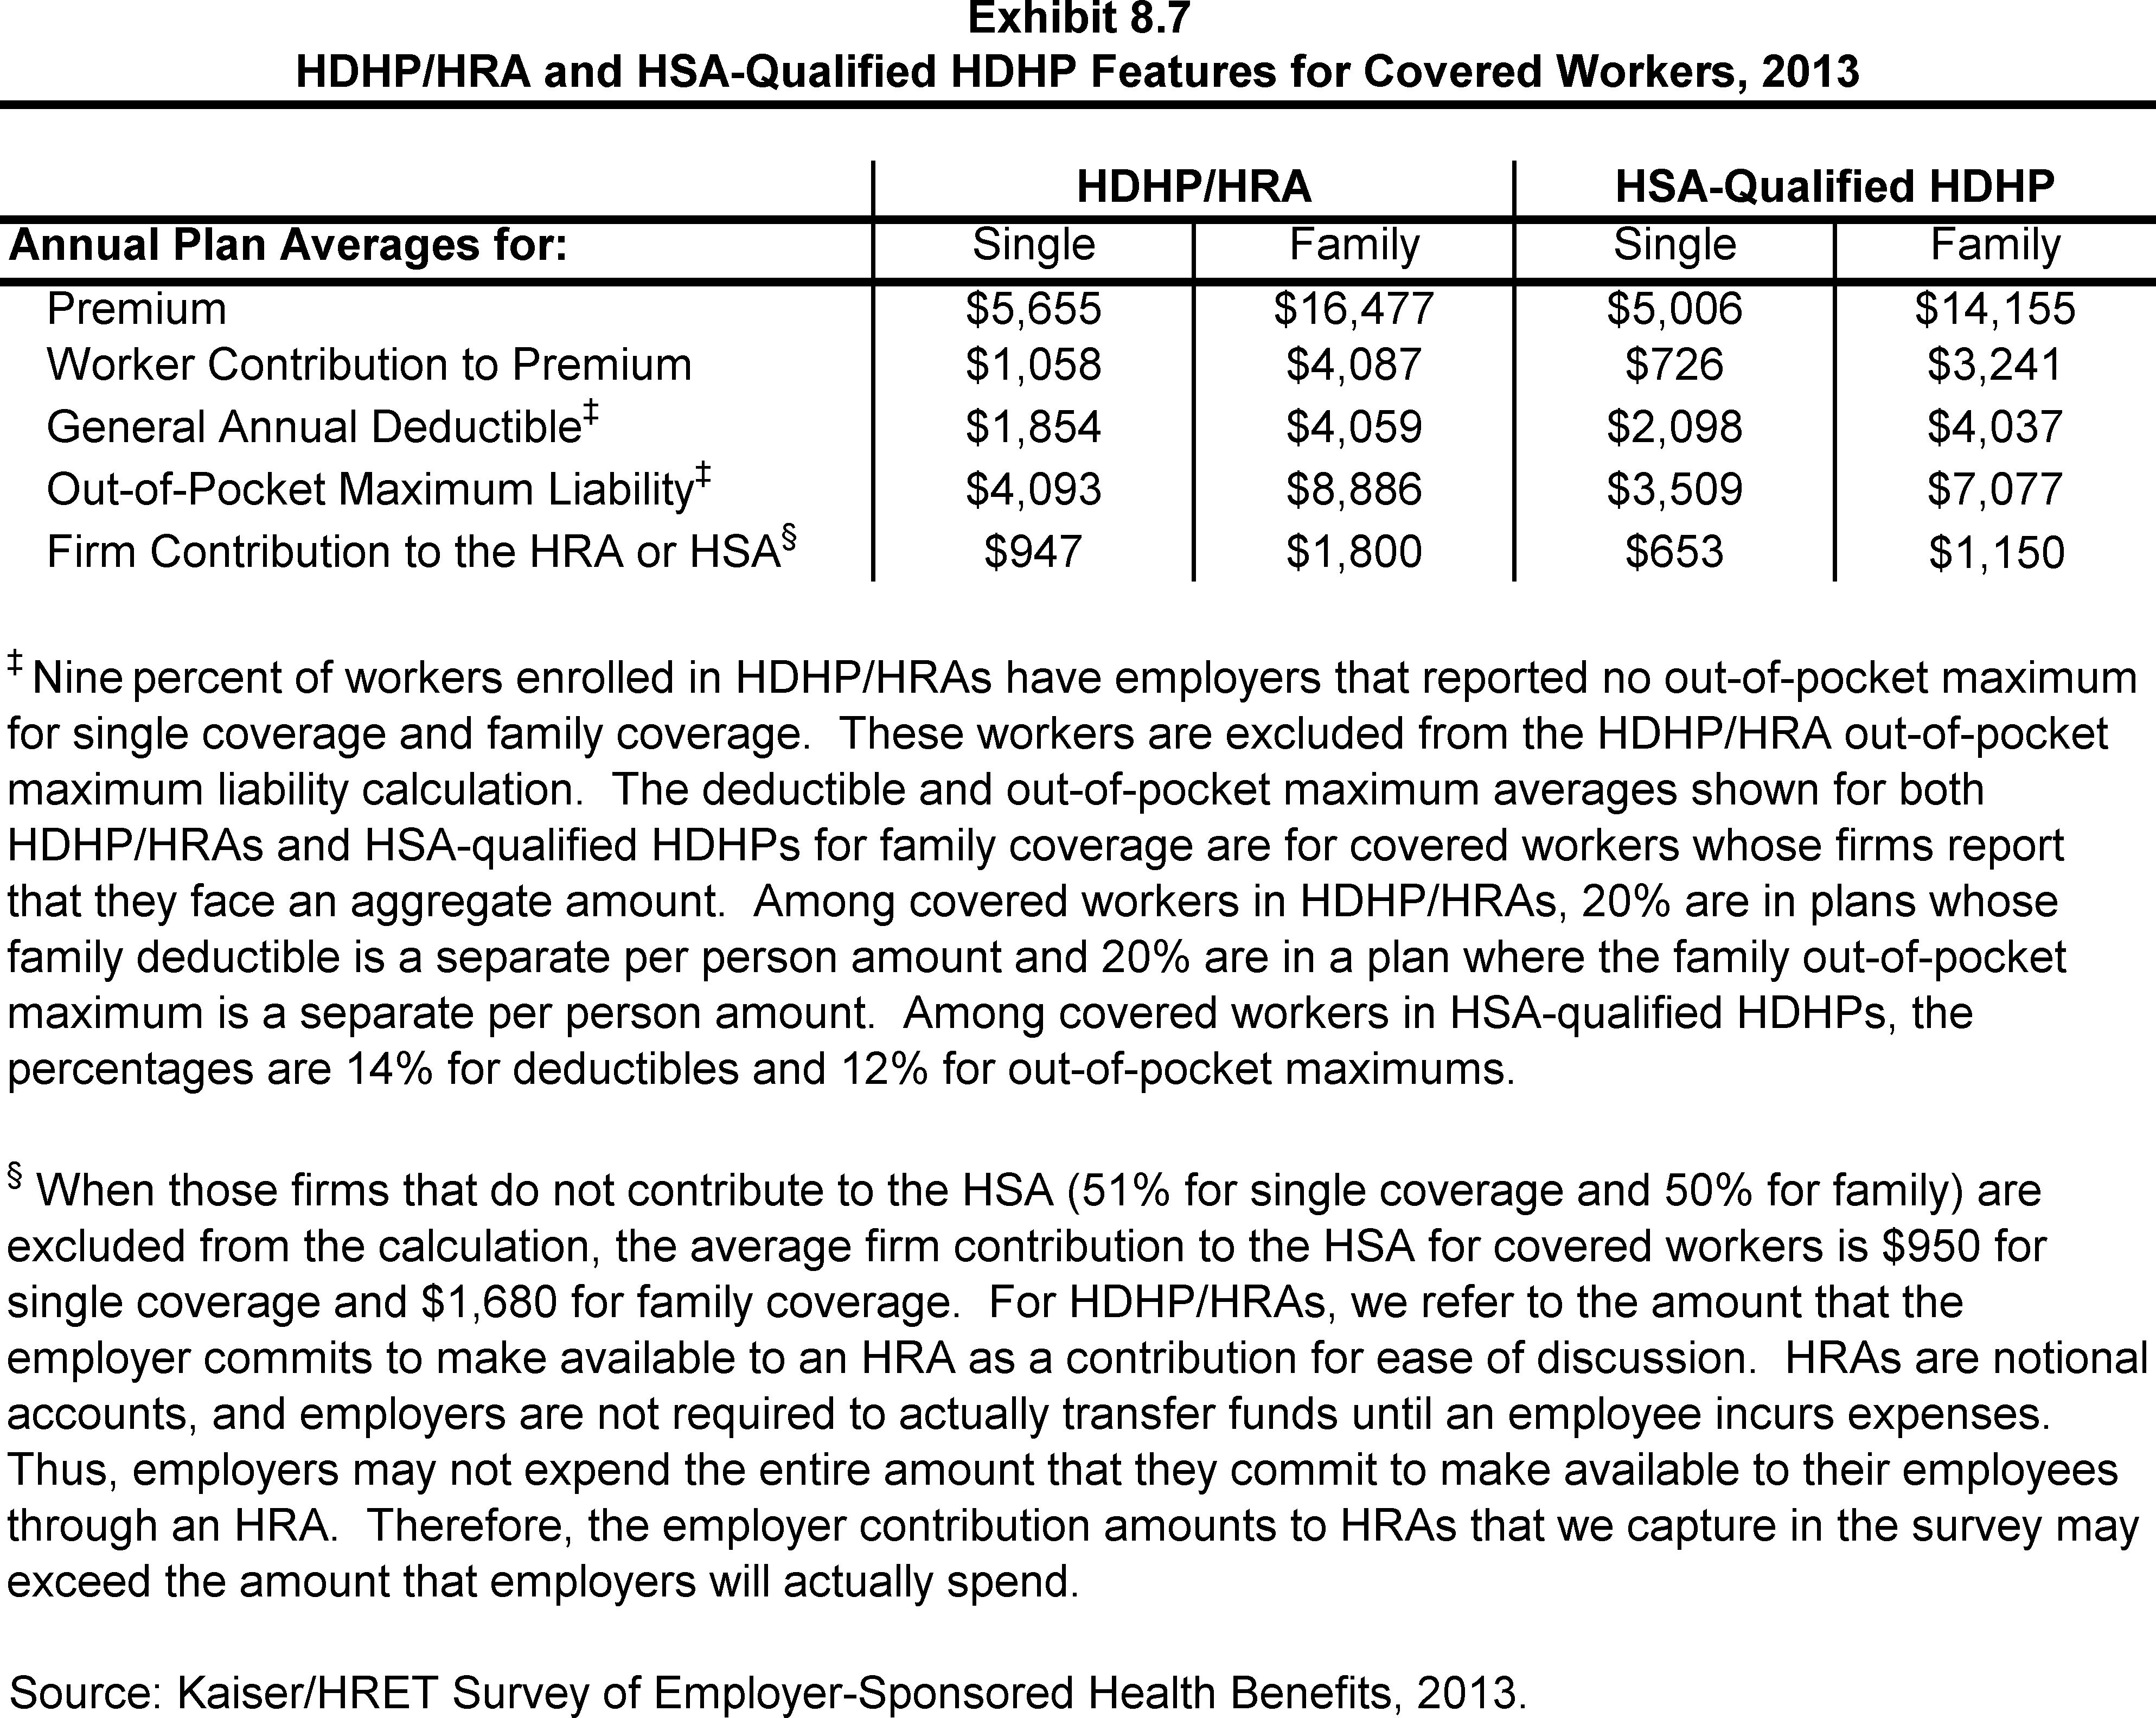
HDHP/HRA and HSA-Qualified HDHP Features for Covered Workers, 2013
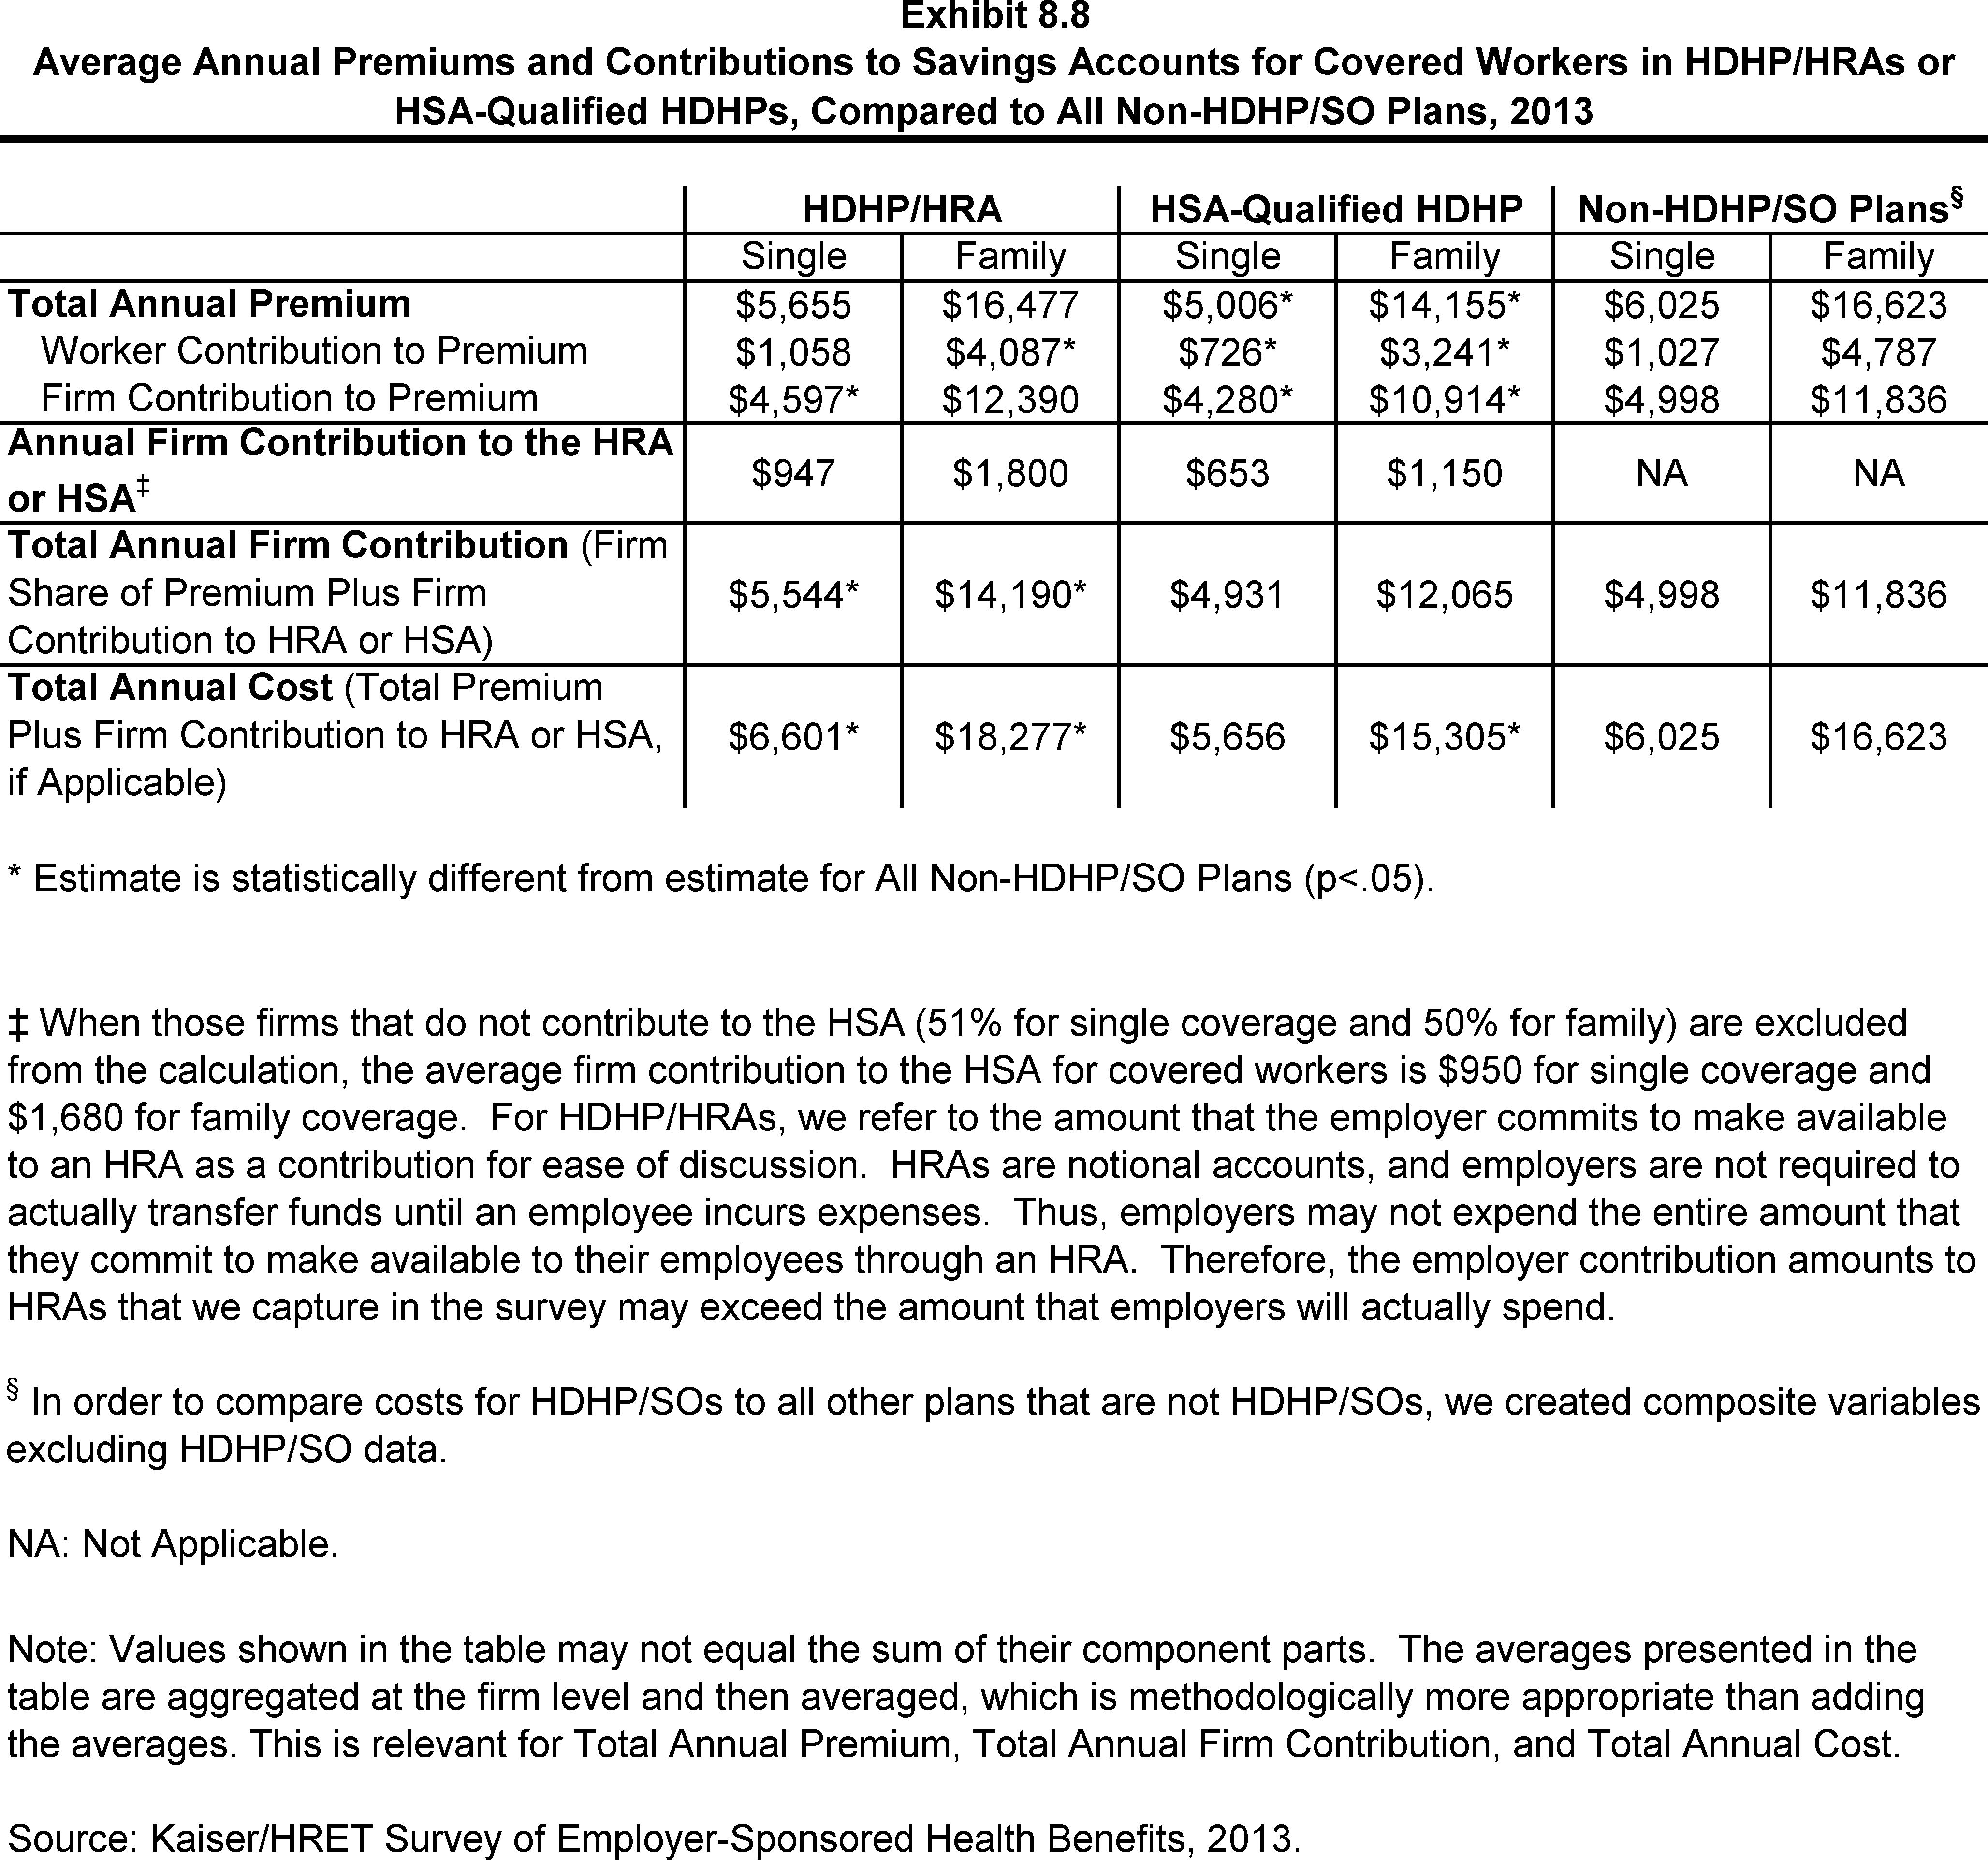
Average Annual Premiums and Contributions to Savings Accounts for Covered Workers in HDHP/HRAs or HSA-Qualified HDHPs, Compared to All Non-HDHP/SO Plans, 2013
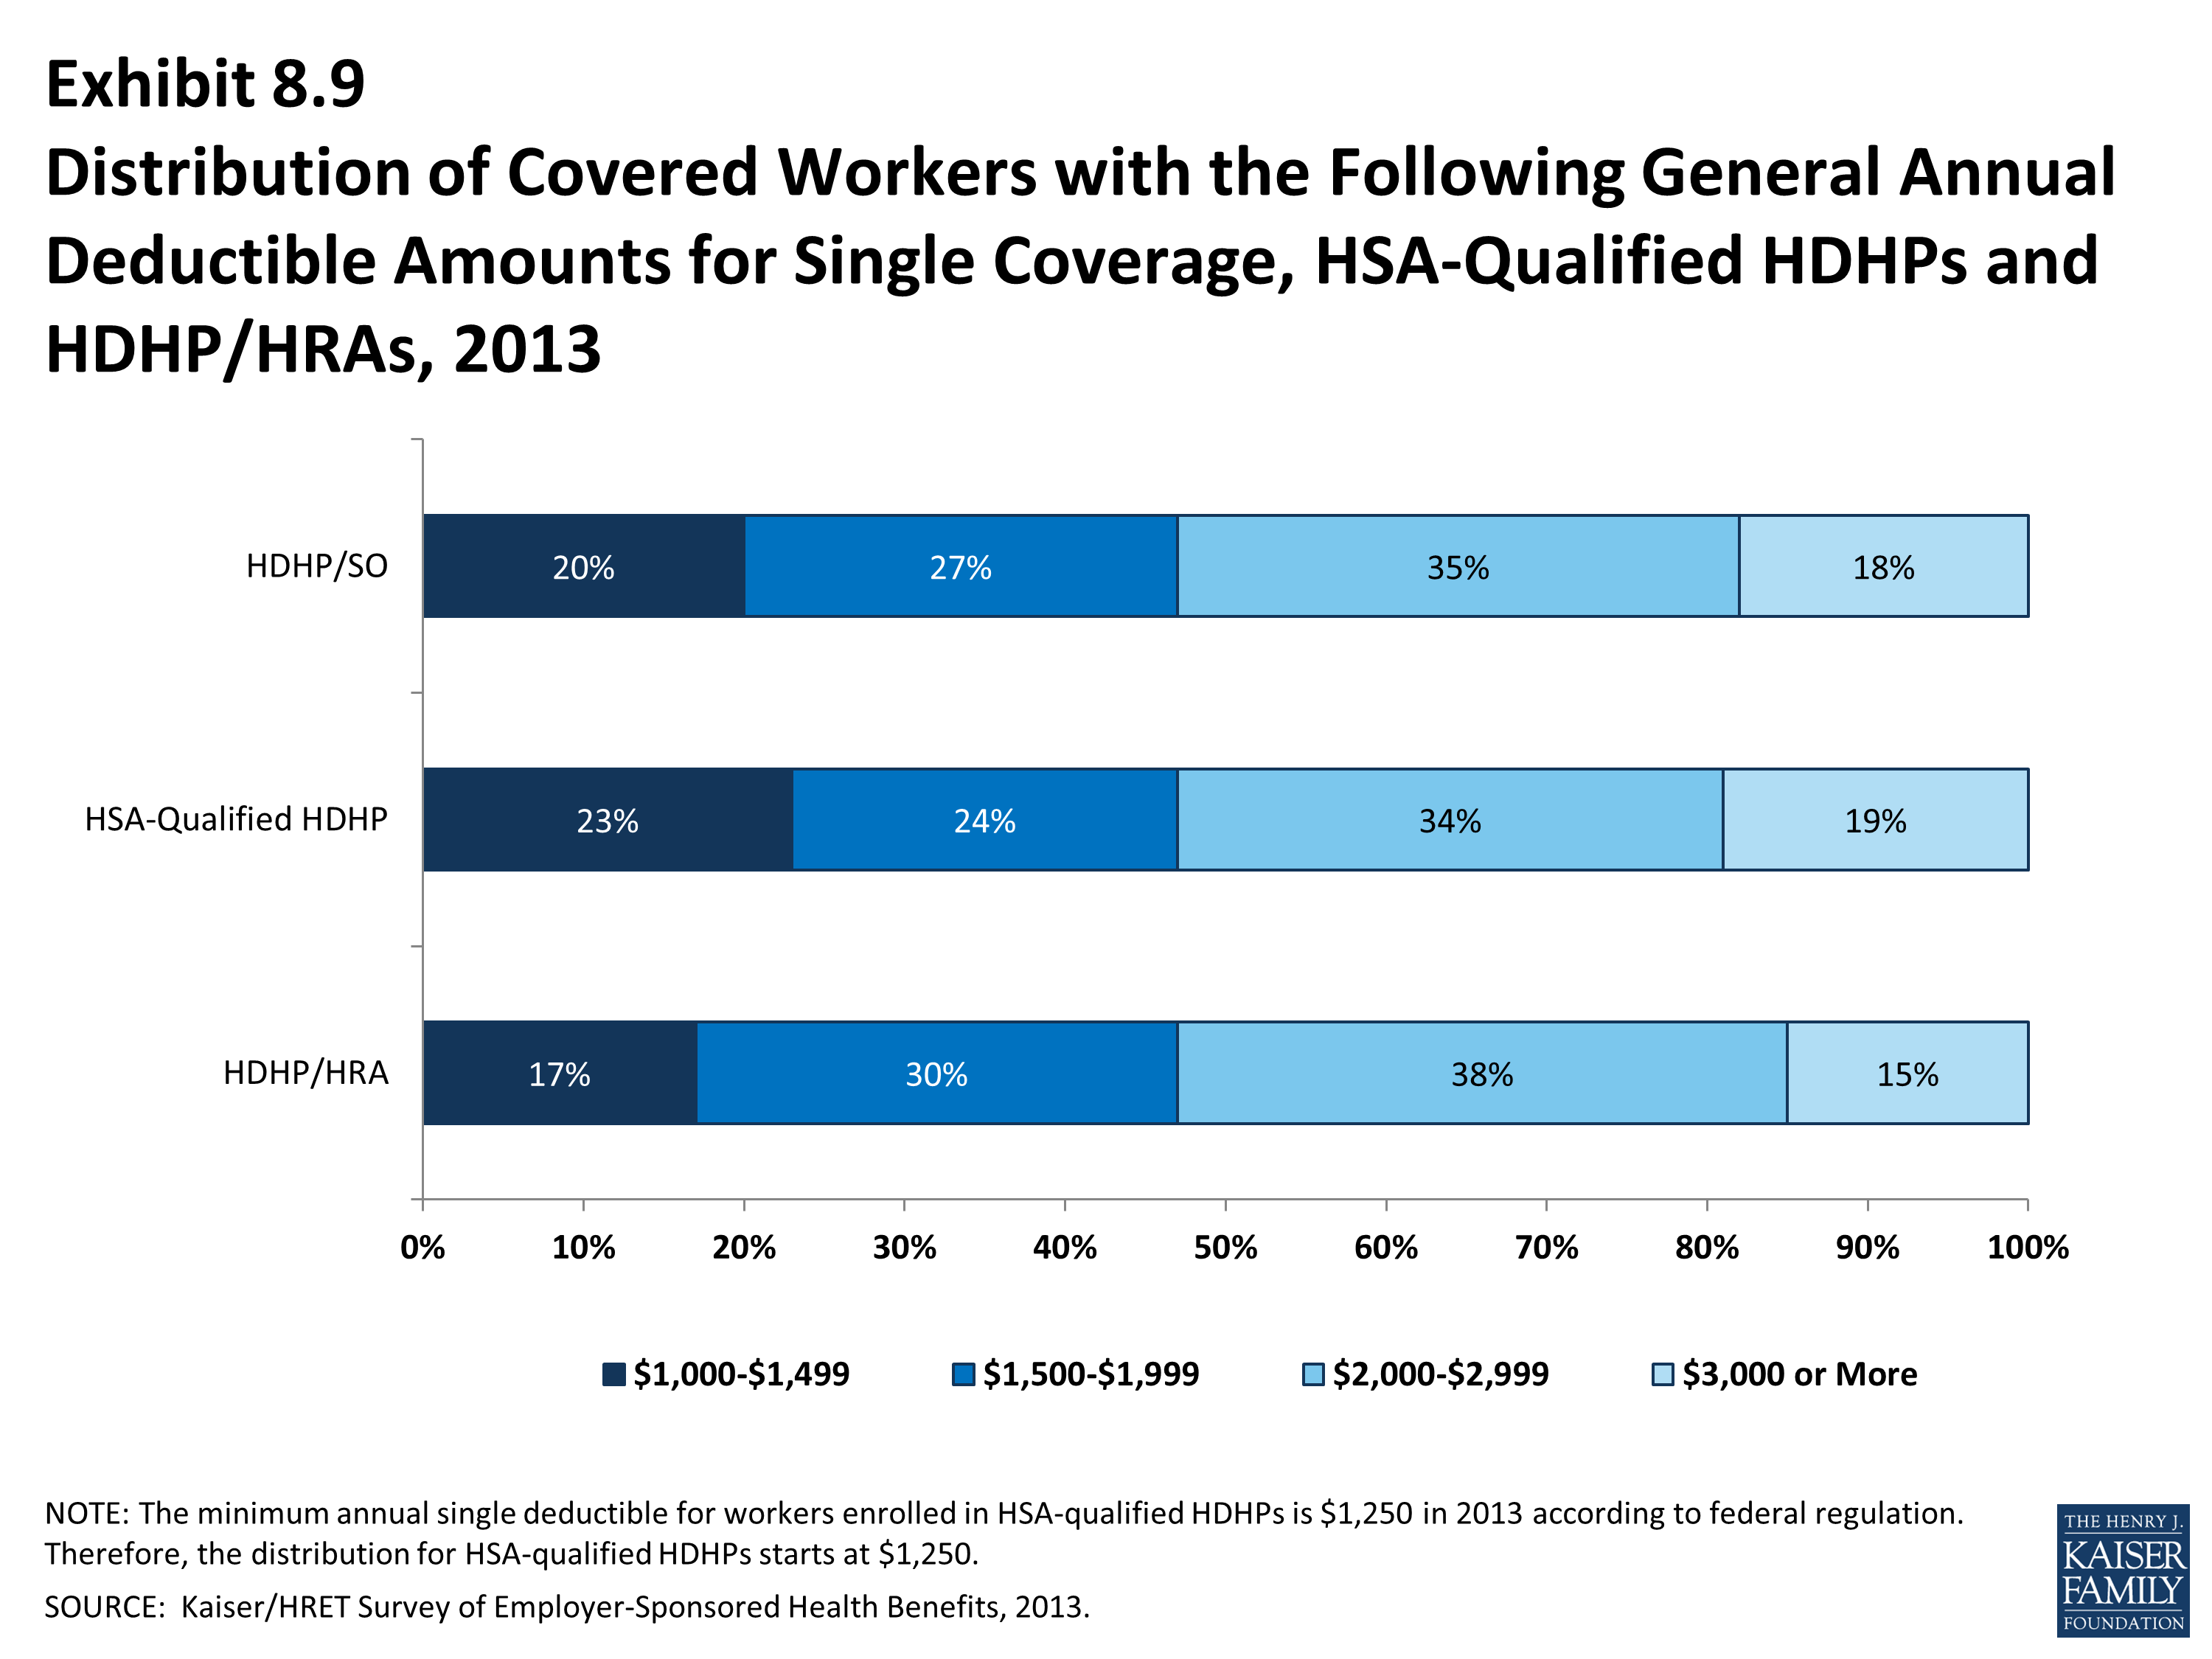
Distribution of Covered Workers with the Following General Annual Deductible Amounts for Single Coverage, HSA-Qualified HDHPs and HDHP/HRAs, 2013
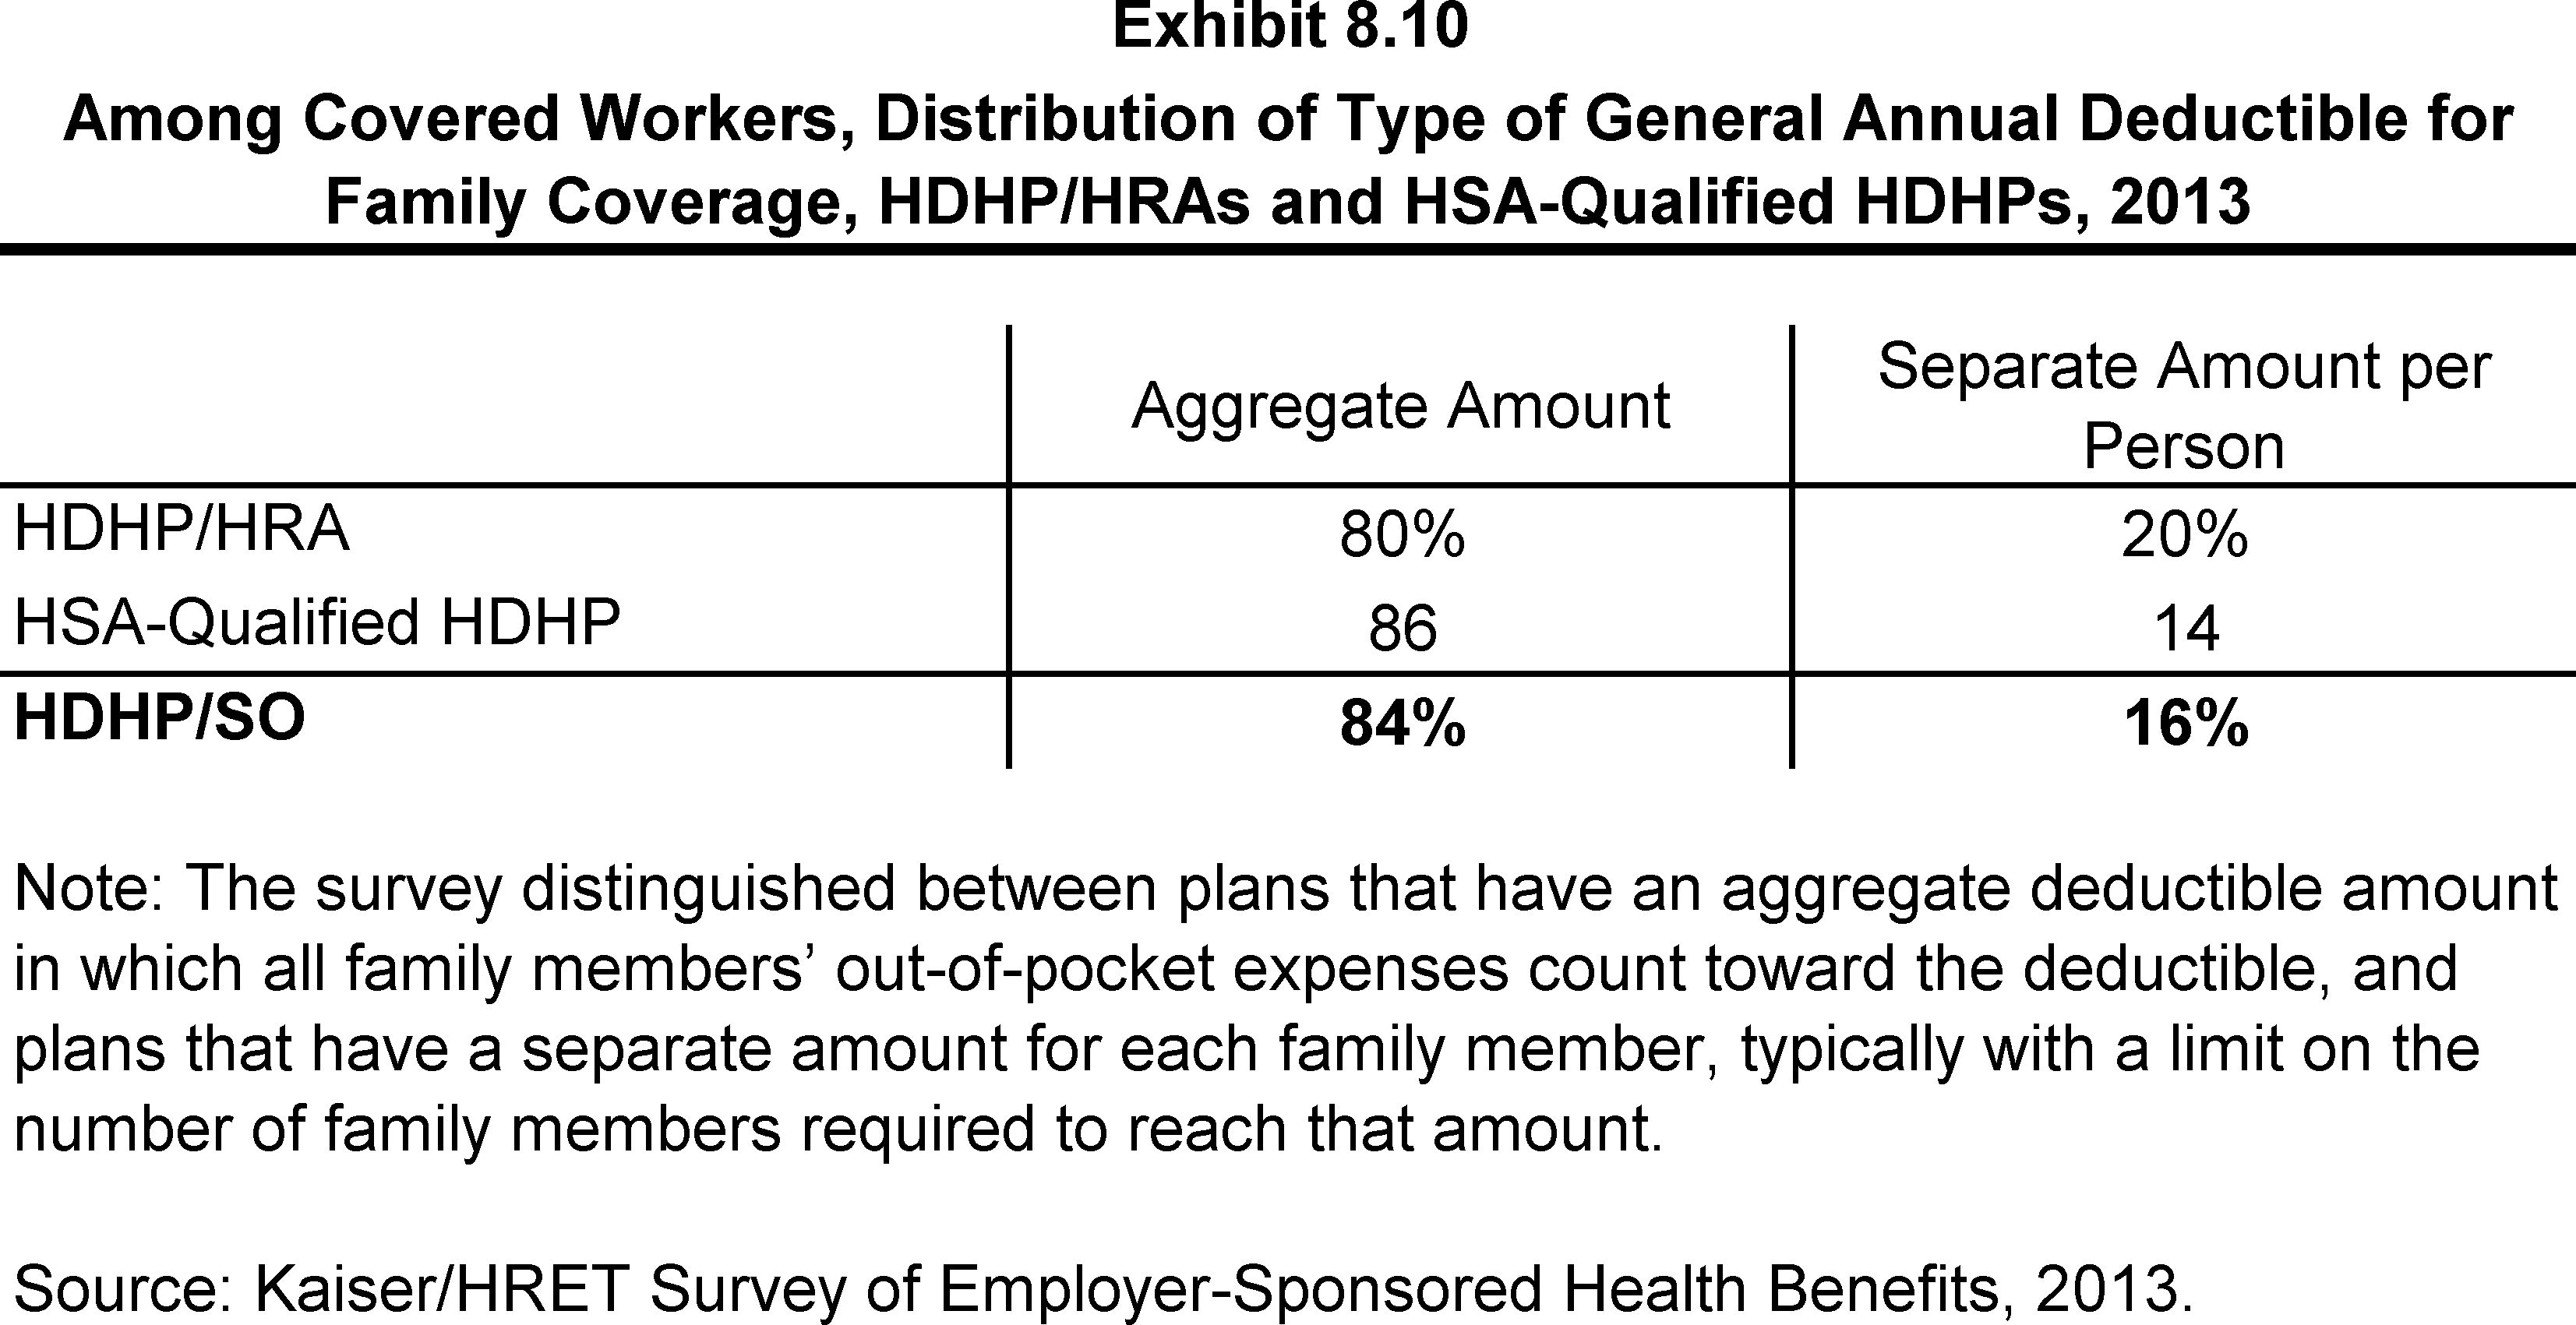
Among Covered Workers, Distribution of Type of General Annual Deductible for Family Coverage, HDHP/HRAs and HSA-Qualified HDHPs, 2013
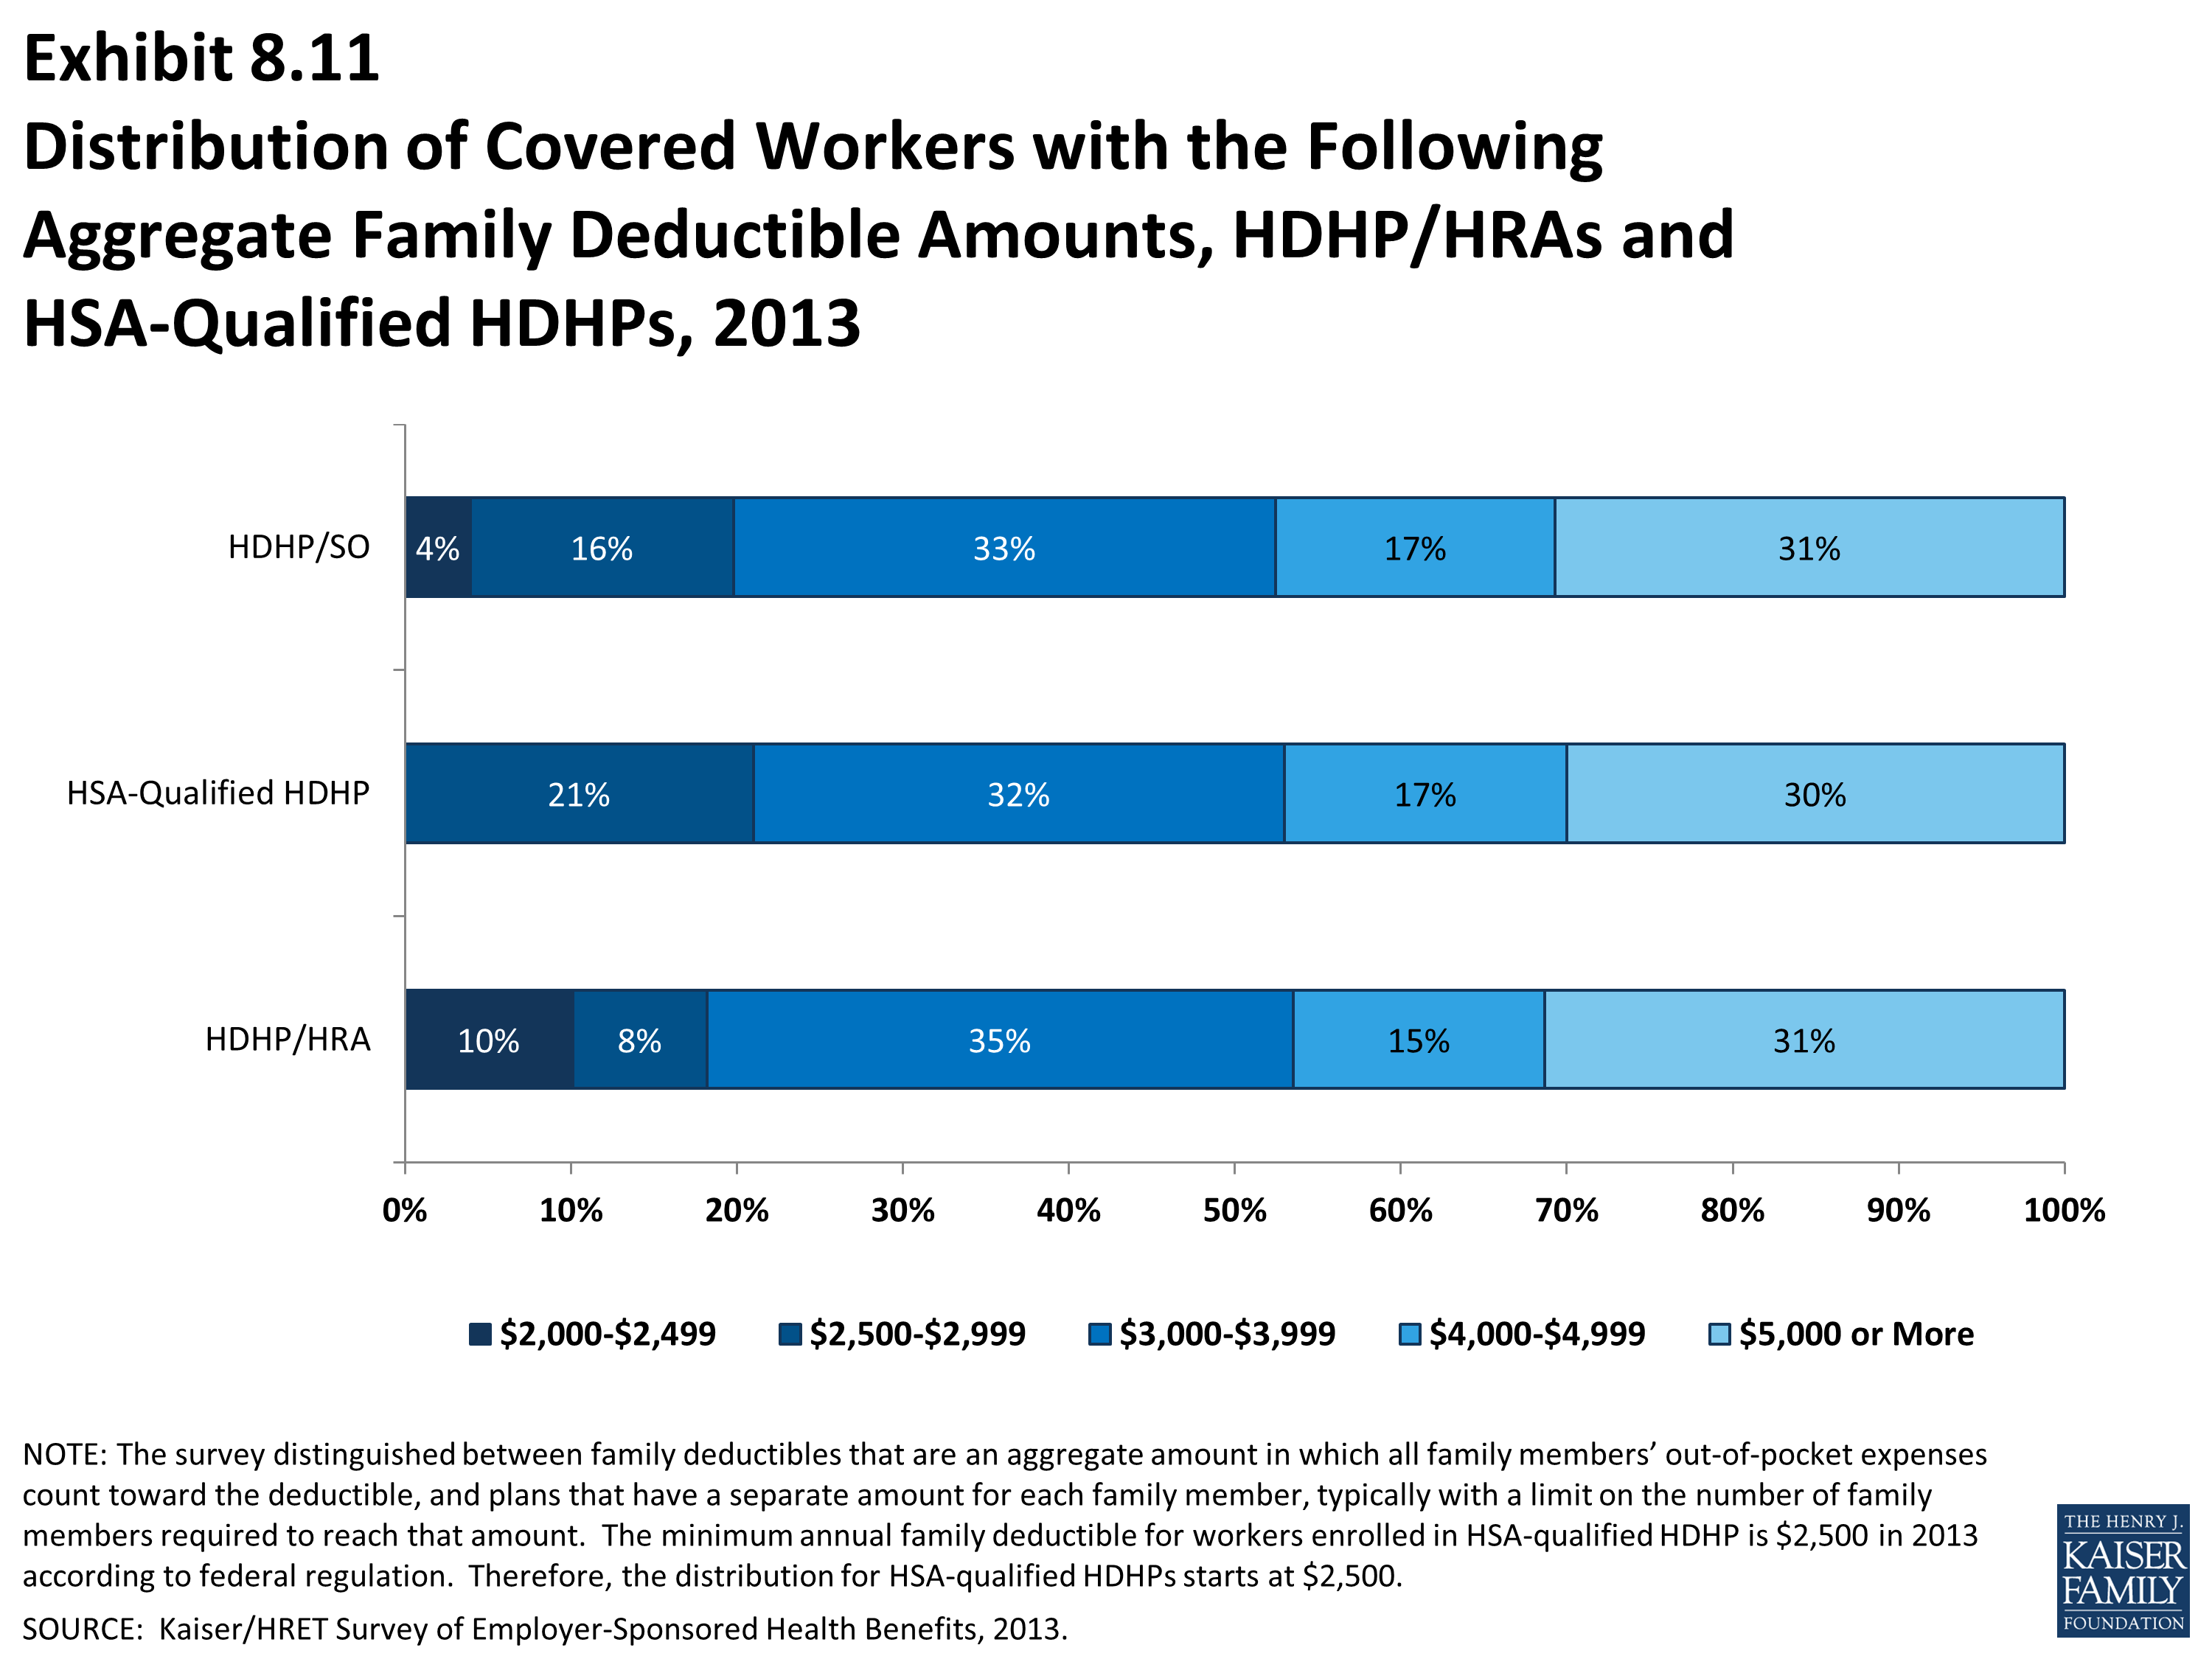
Distribution of Covered Workers with the Following Aggregate Family Deductible Amounts, HDHP/HRAs and HSA-Qualified HDHPs, 2013
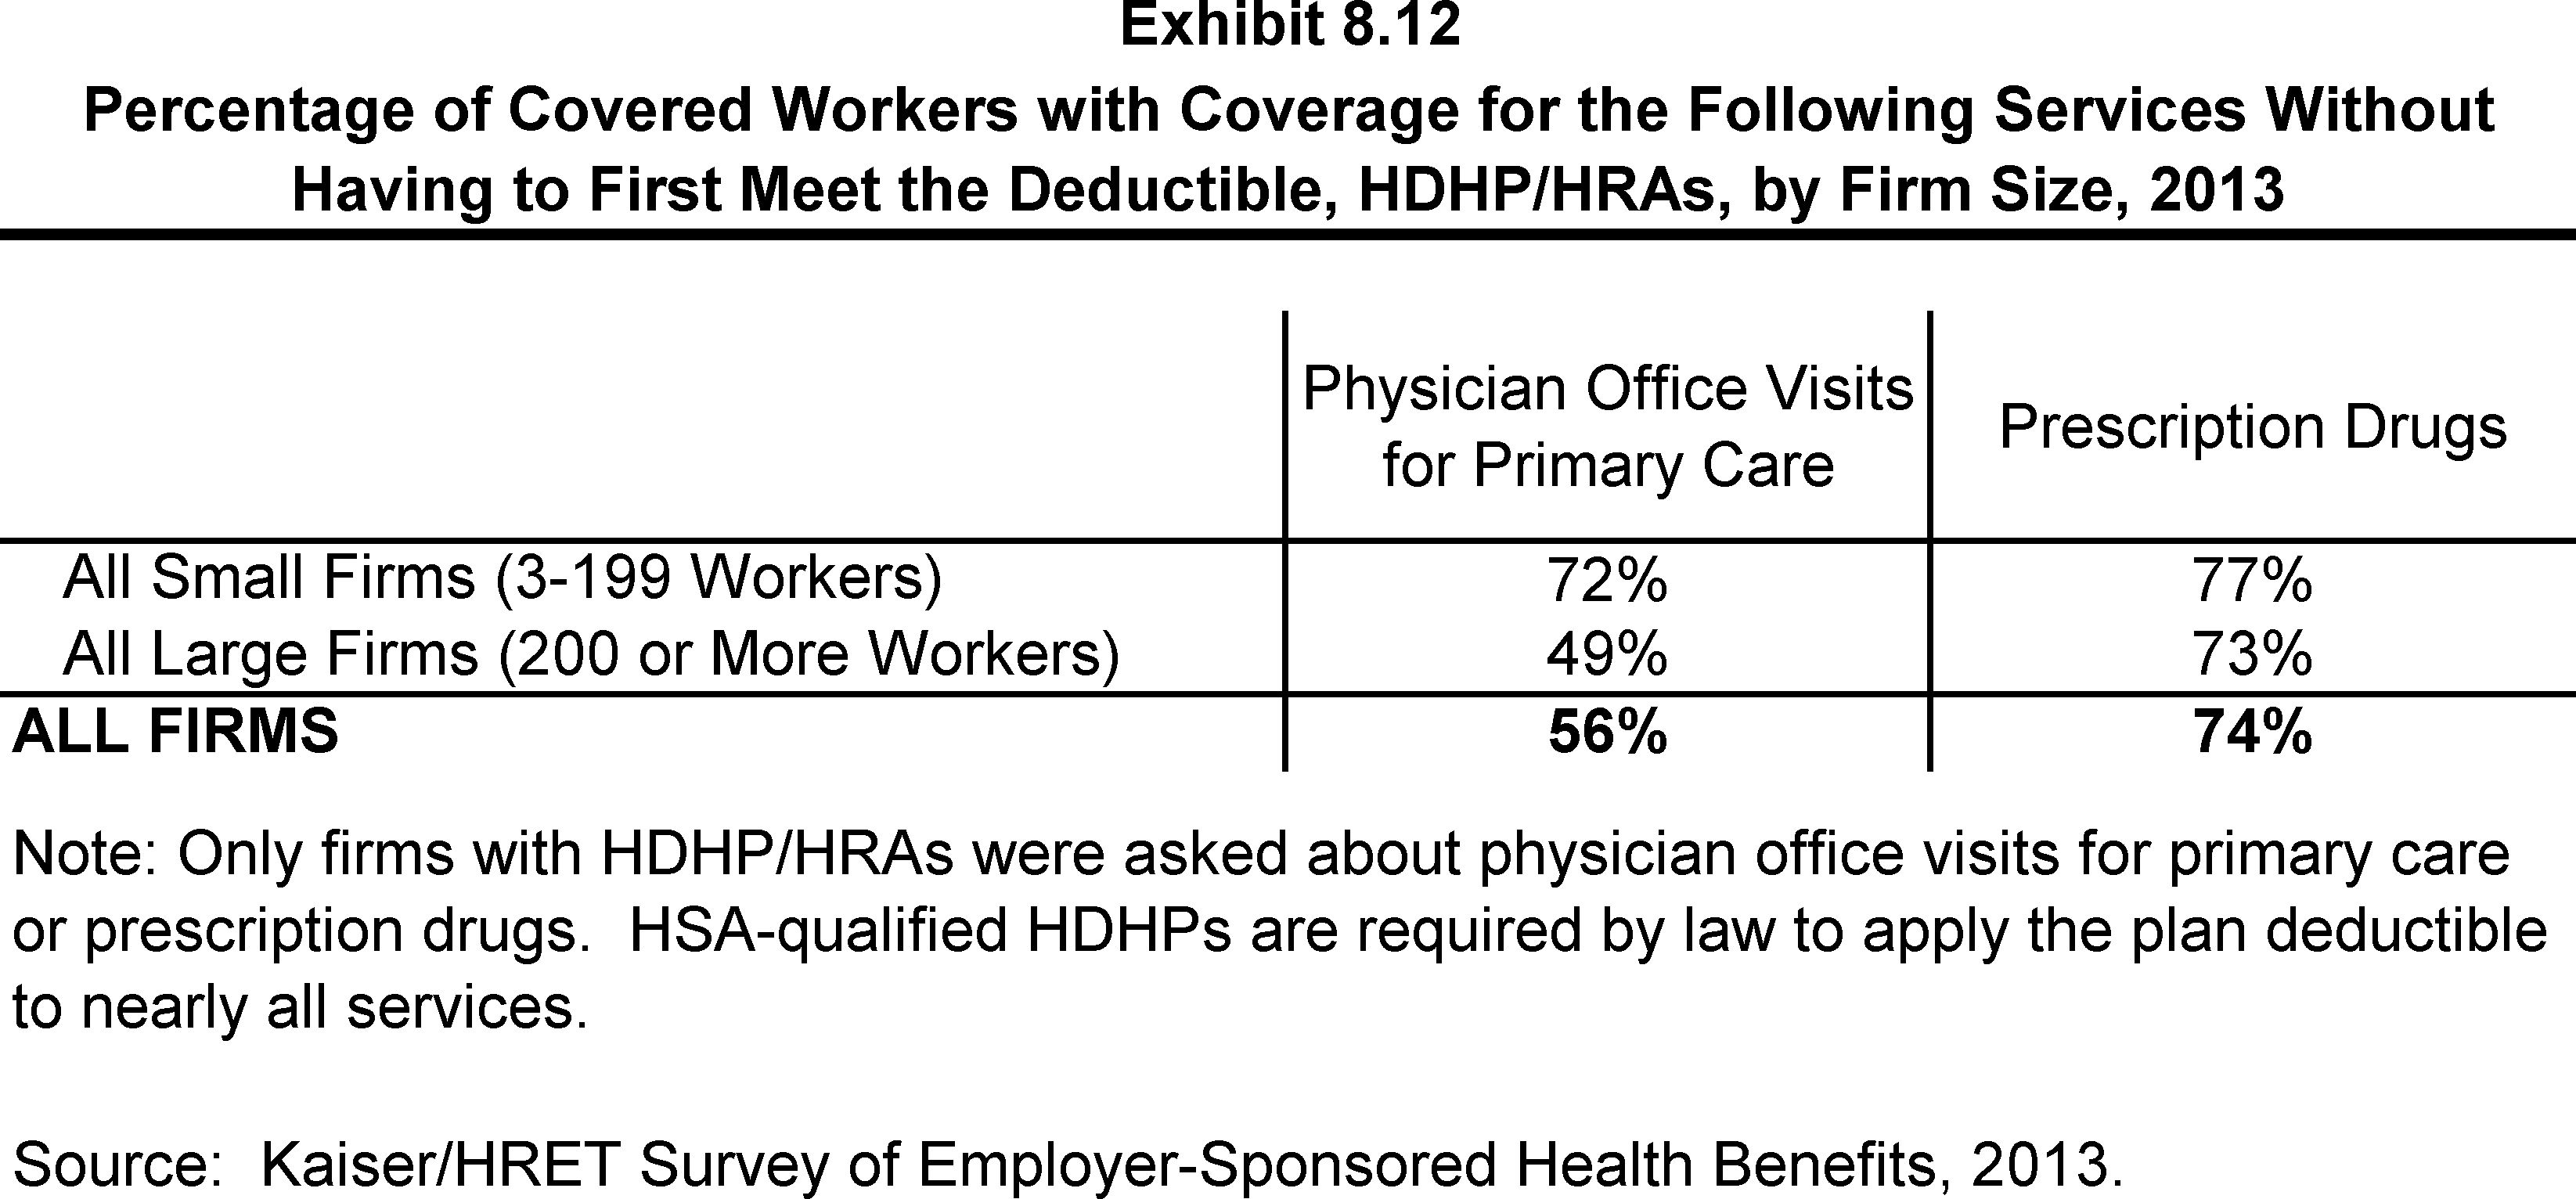
Percentage of Covered Workers with Coverage for the Following Services Without Having to First Meet the Deductible, HDHP/HRAs, by Firm Size, 2013
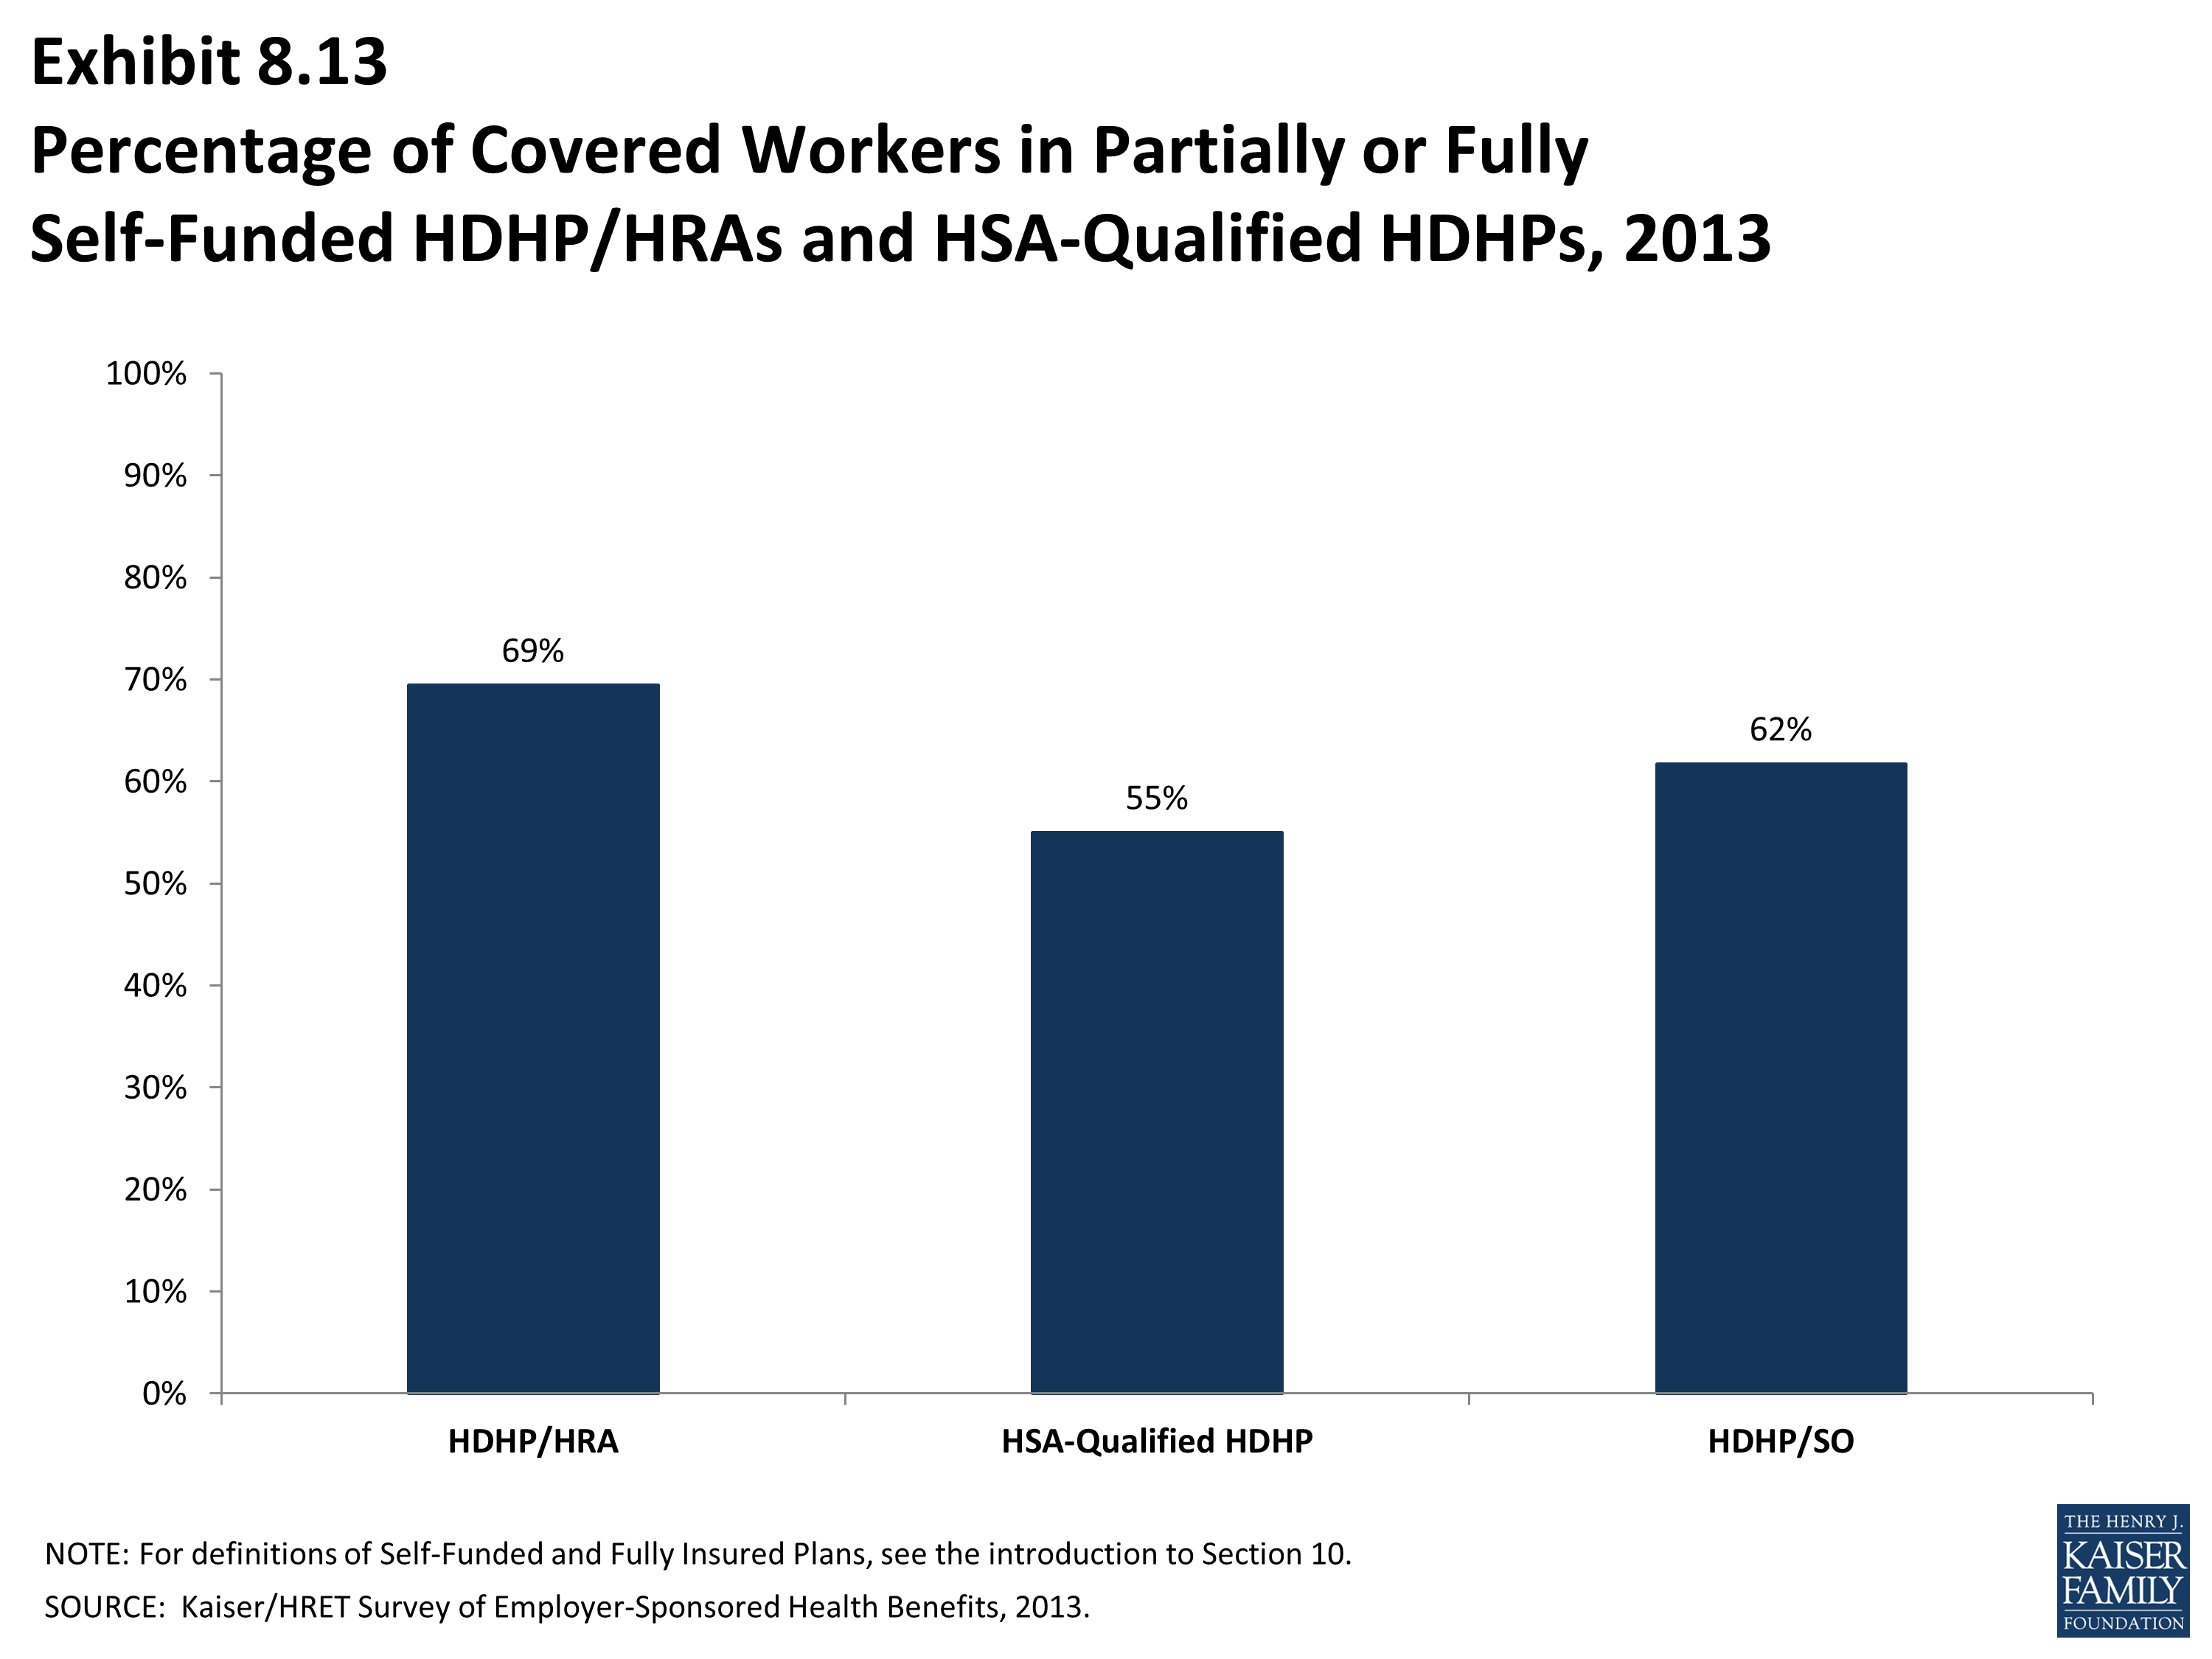
Percentage of Covered Workers in Partially or Fully Self-Funded HDHP/HRAs and HSA-Qualified HDHPs, 2013
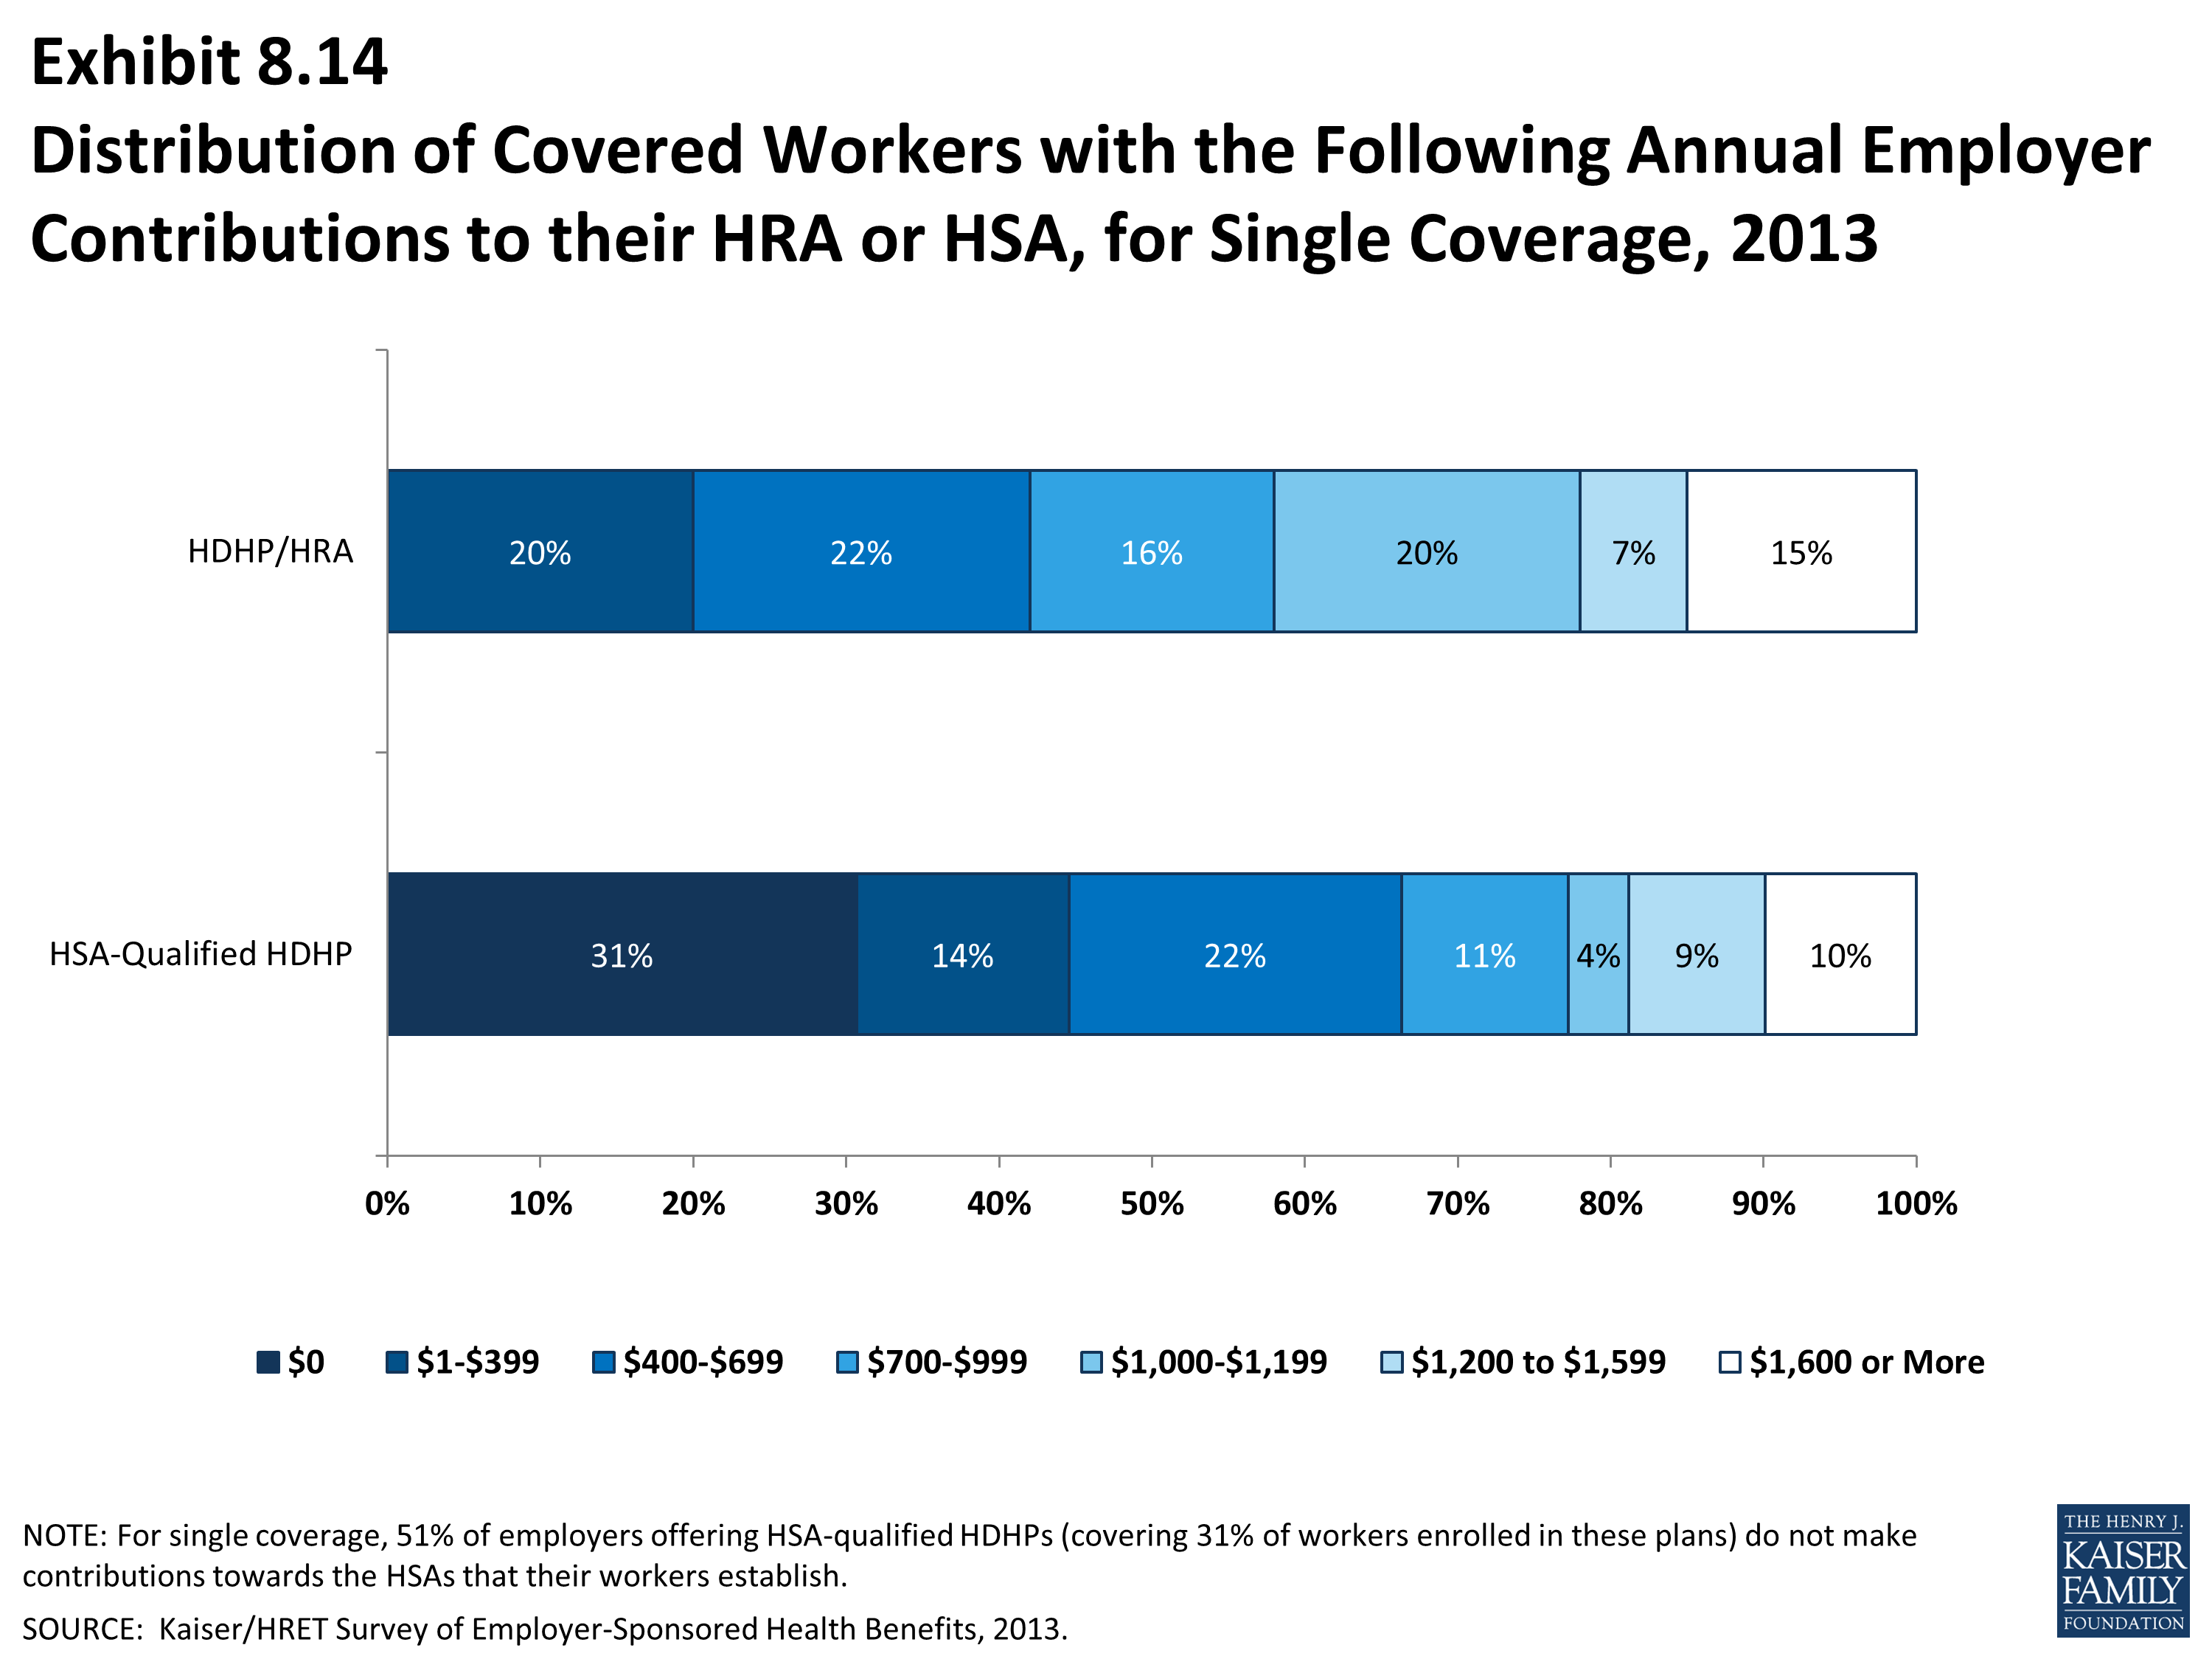
Distribution of Covered Workers with the Following Annual Employer Contributions to their HRA or HSA, for Single Coverage, 2013
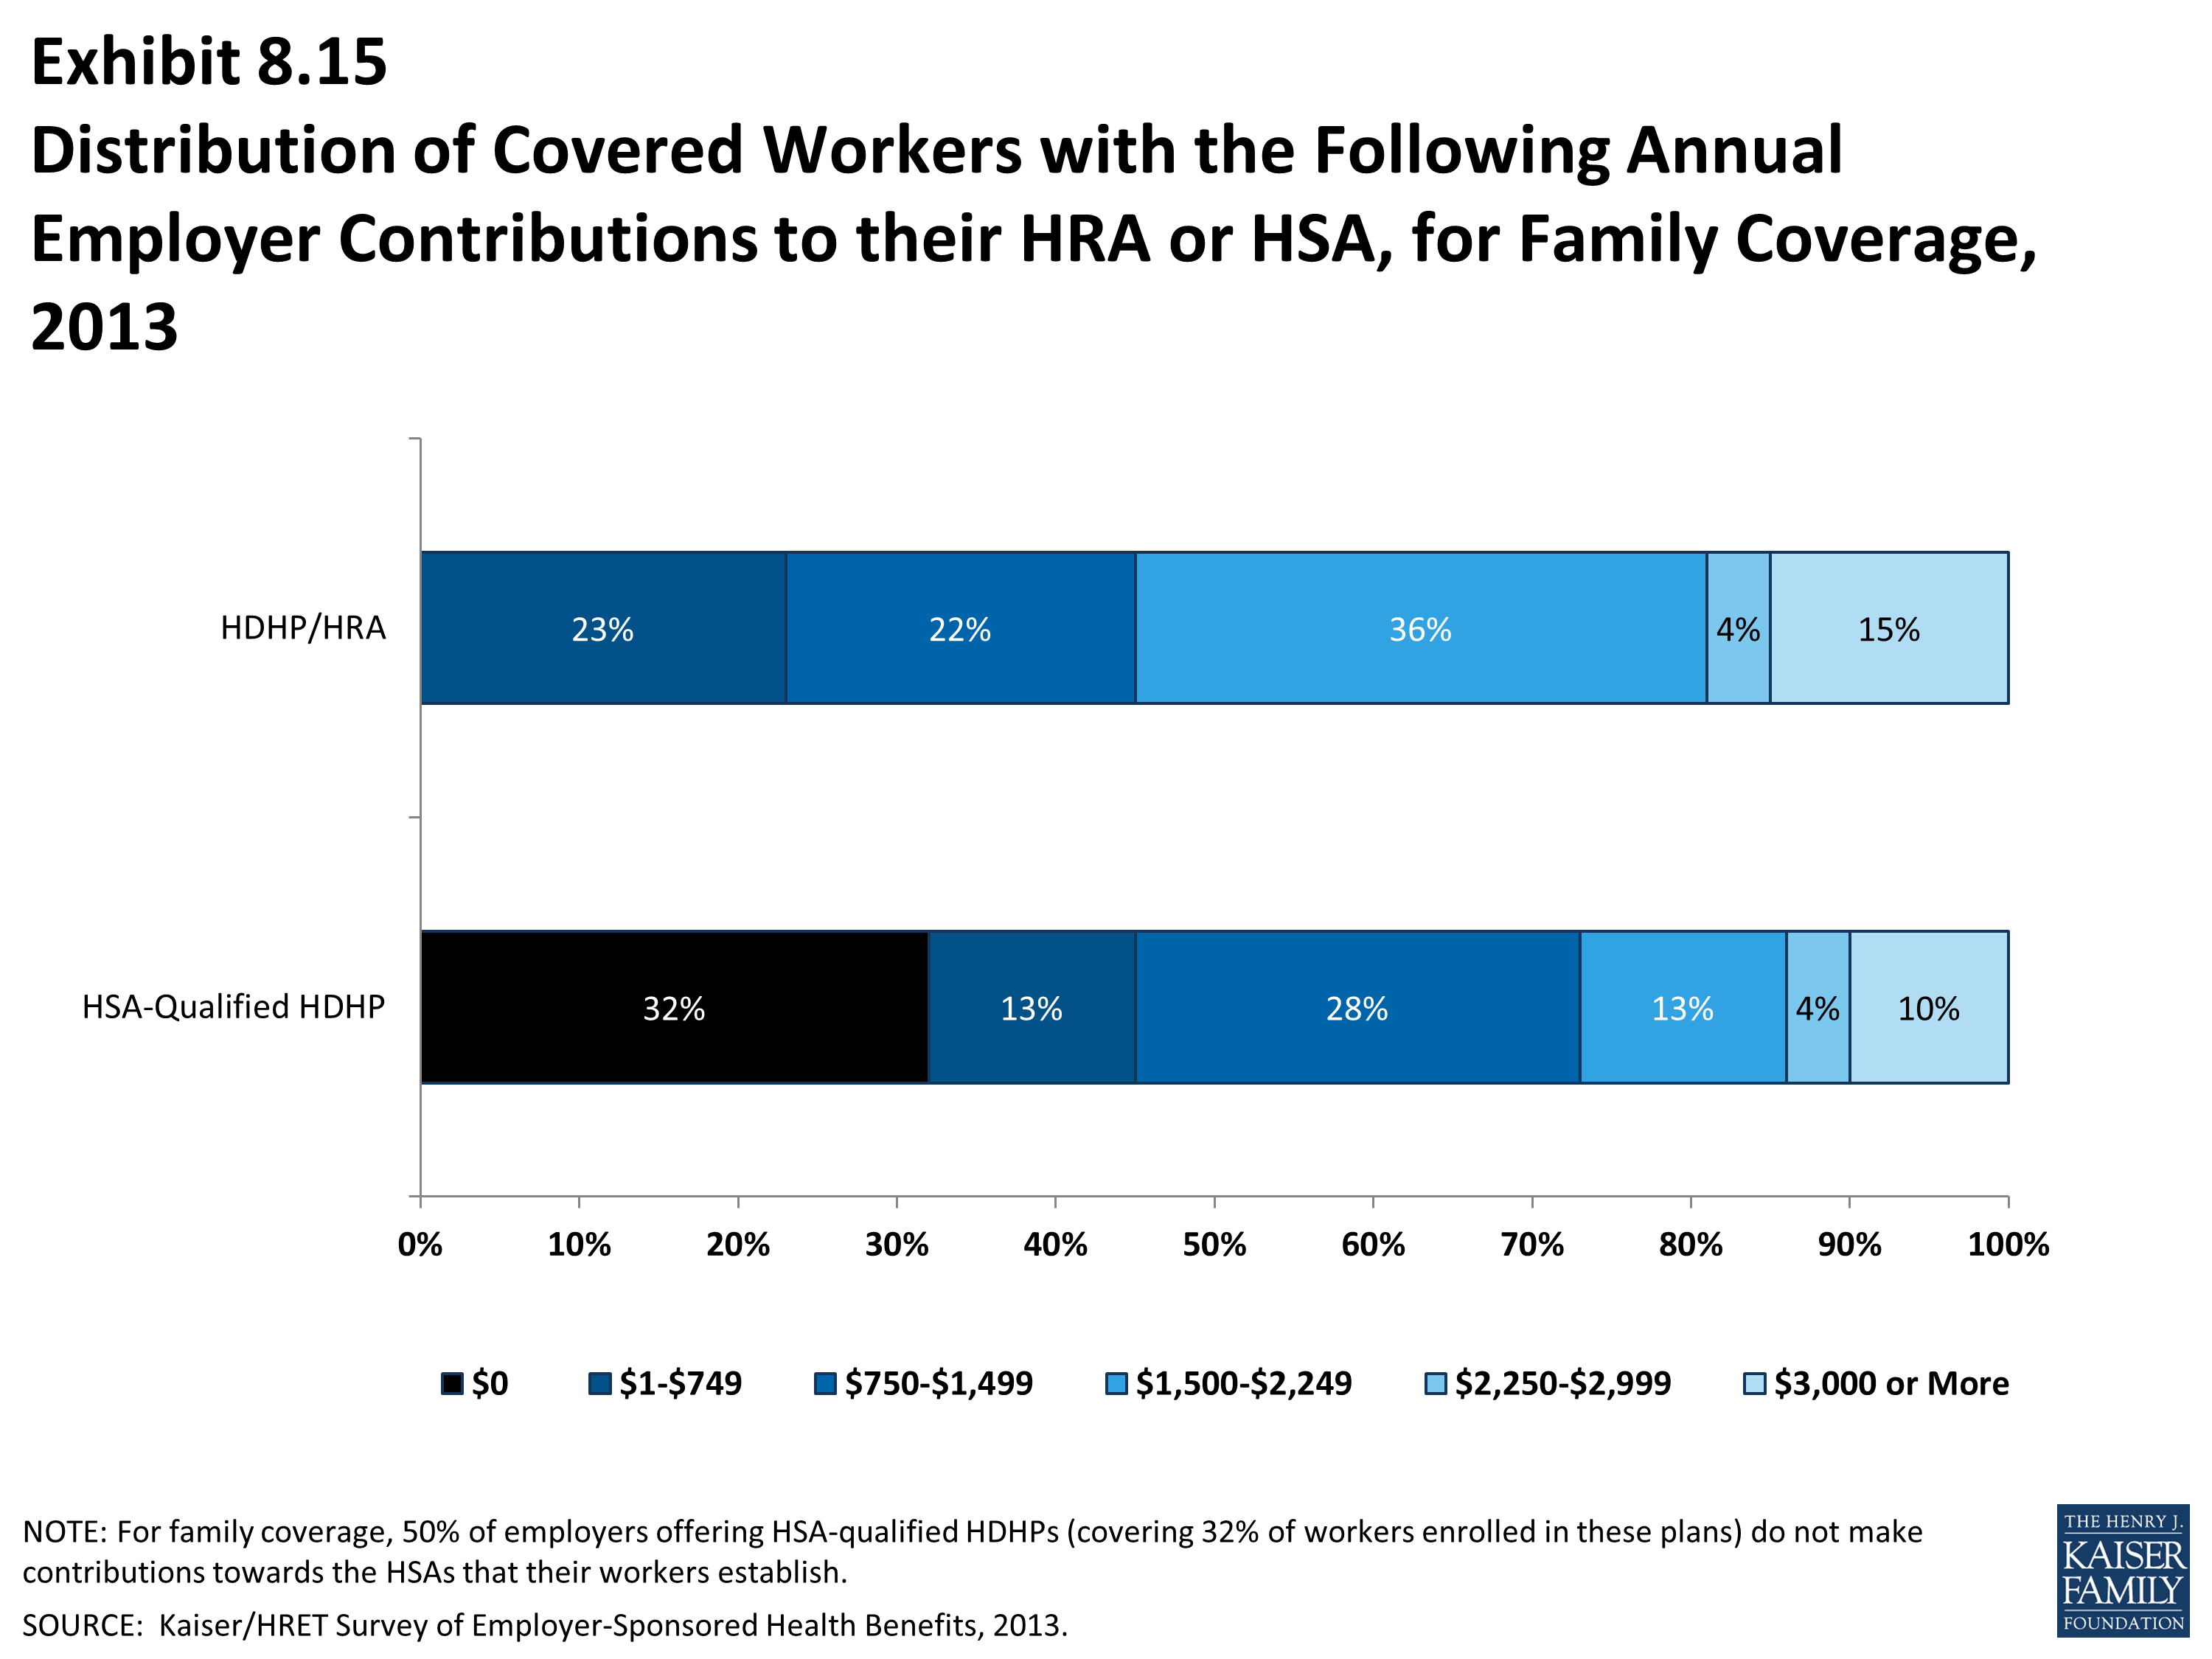
Distribution of Covered Workers with the Following Annual Employer Contributions to their HRA or HSA, for Family Coverage, 2013
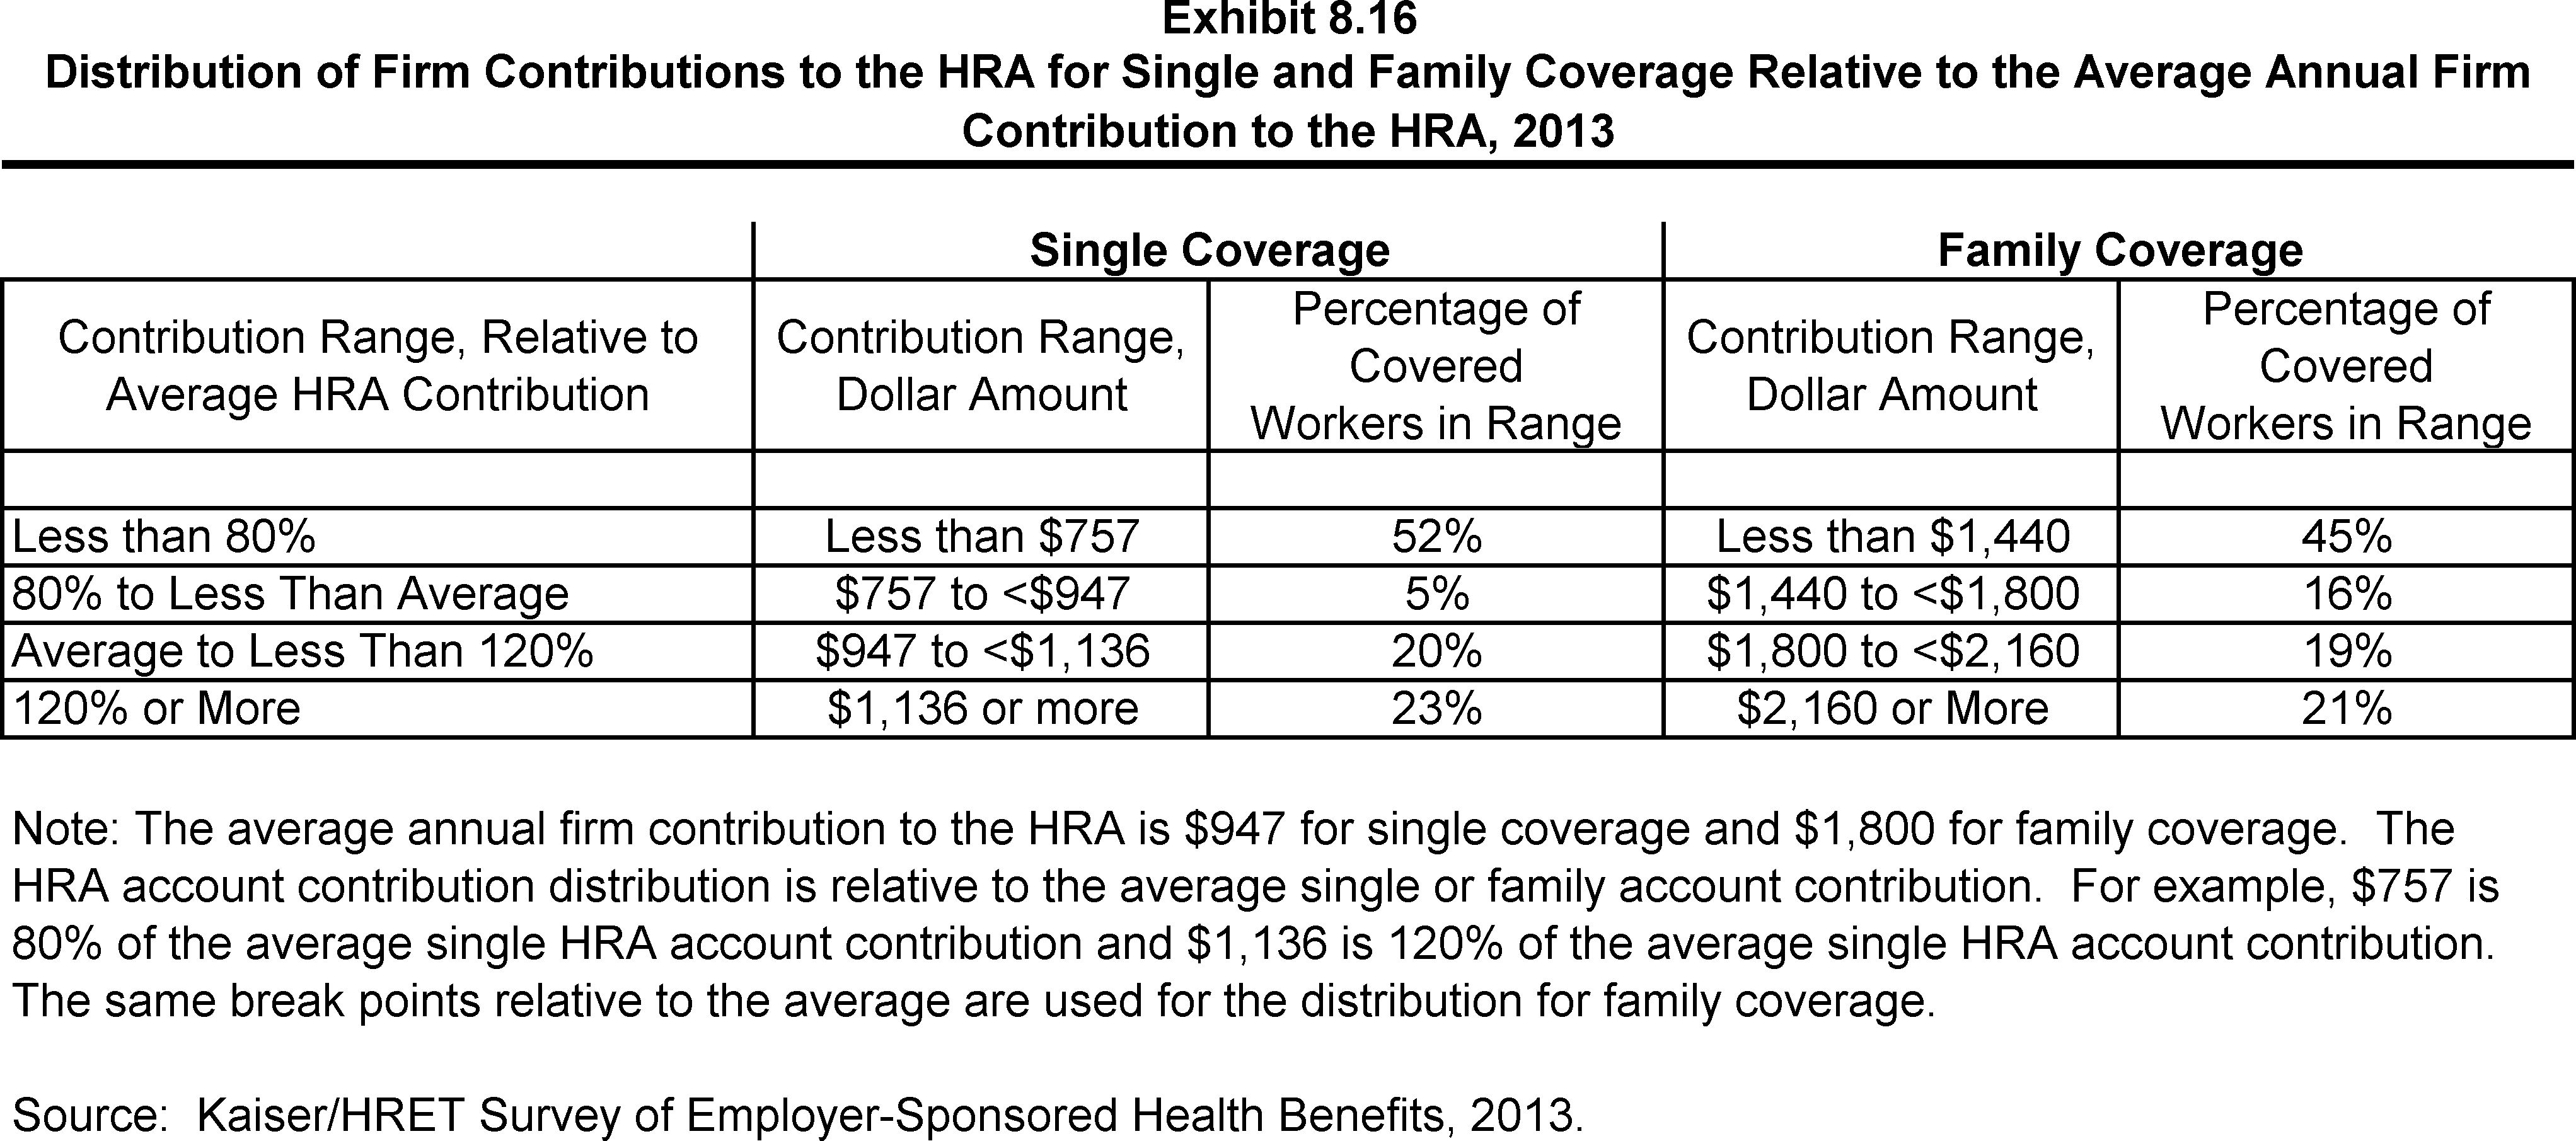
Distribution of Firm Contributions to the HRA for Single and Family Coverage Relative to the Average Annual Firm Contribution to the HRA, 2013
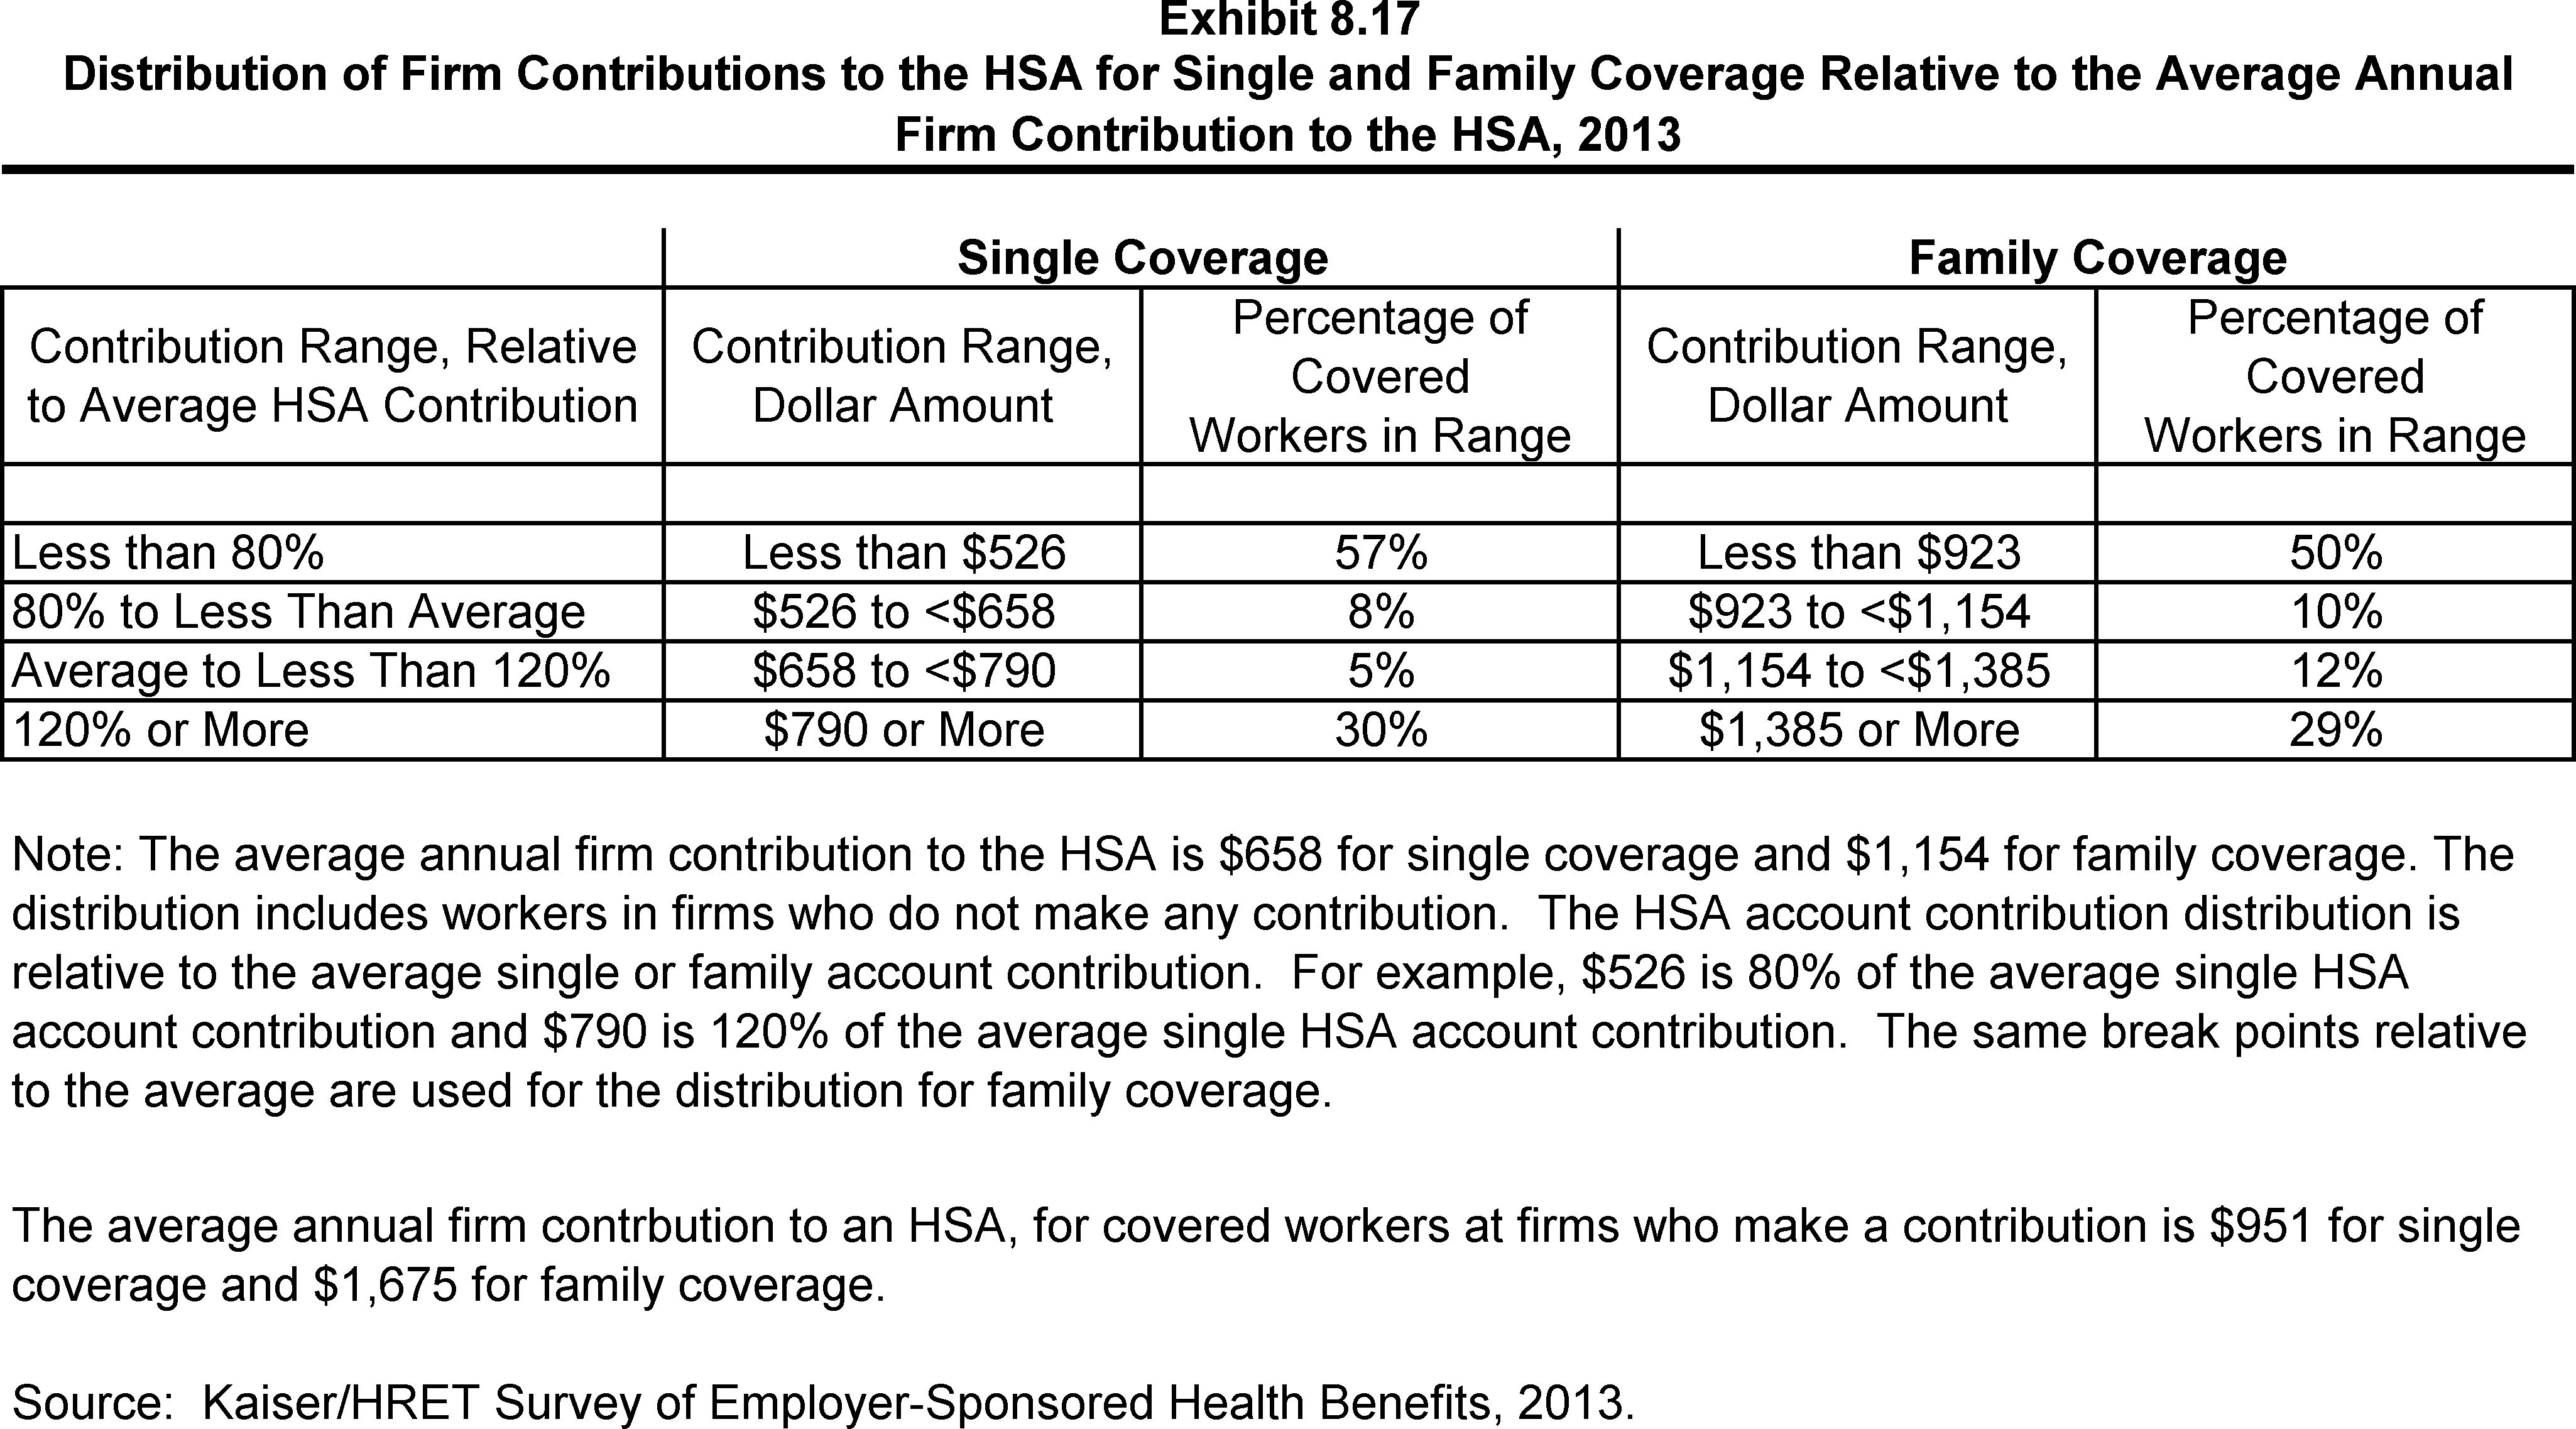
Distribution of Firm Contributions to the HSA for Single and Family Coverage Relative to the Average Annual Firm Contribution to the HSA, 2013
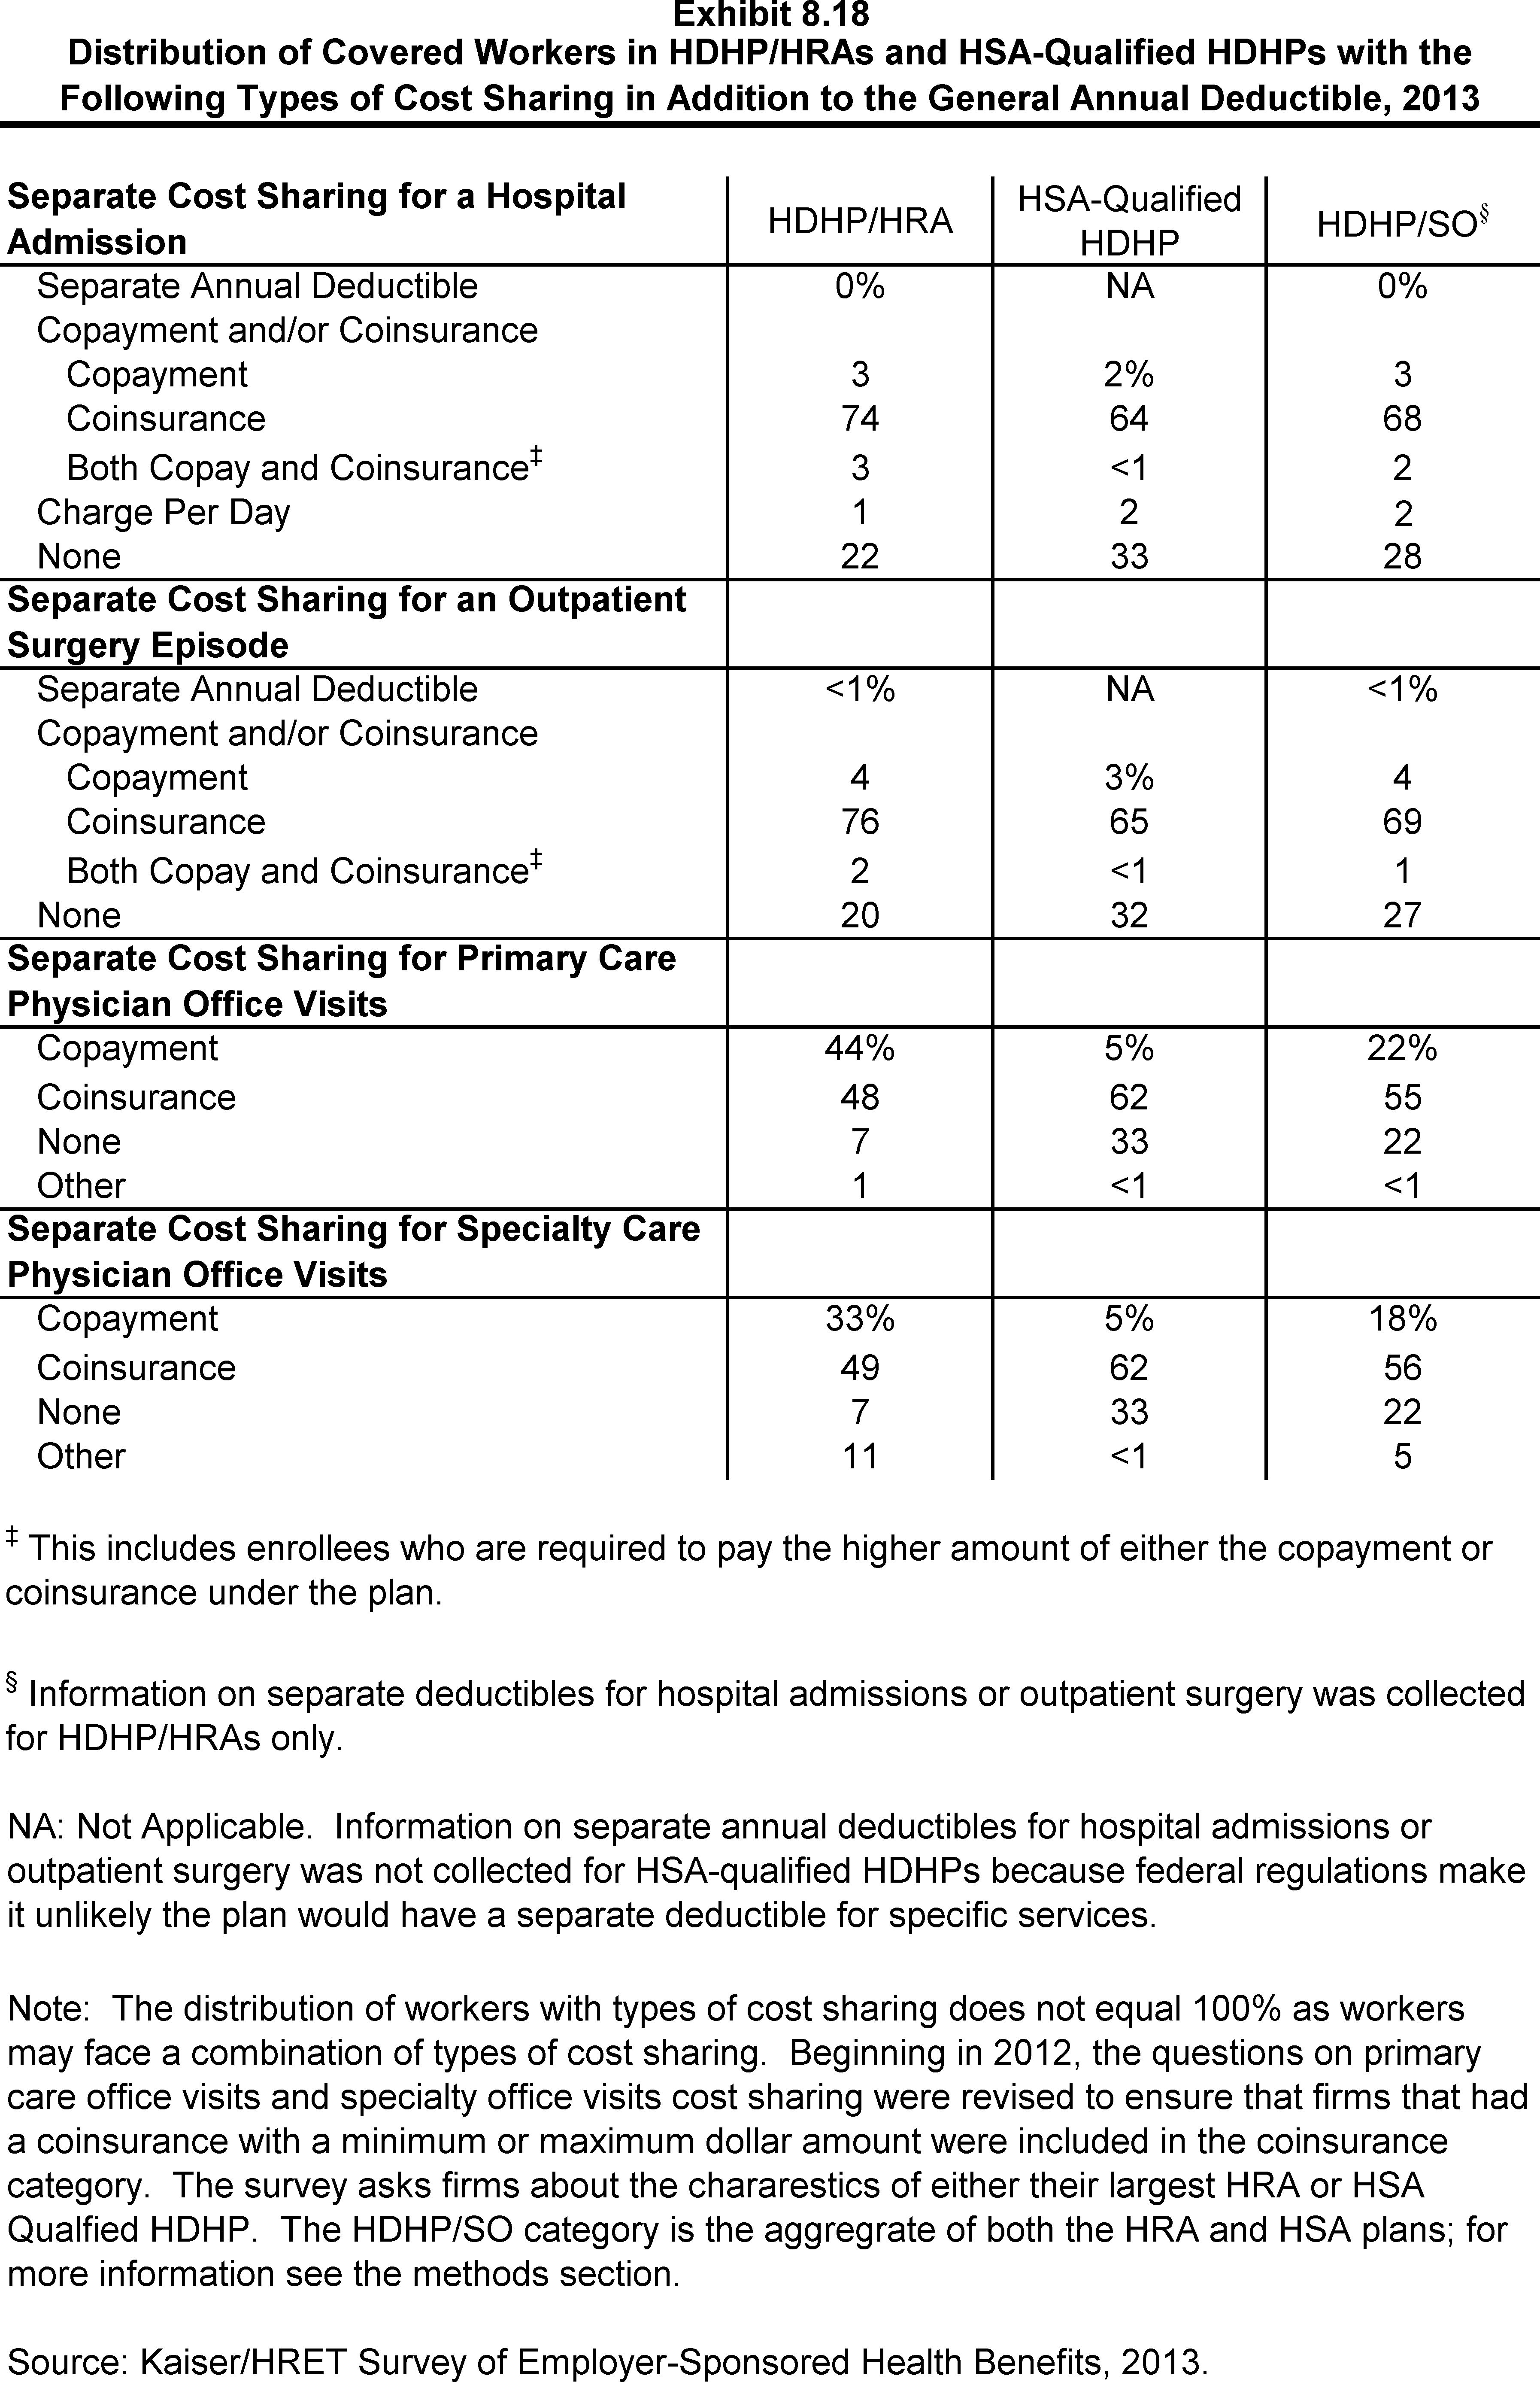
Distribution of Covered Workers in HDHP/HRAs and HSA-Qualified HDHPs with the Following Types of Cost Sharing in Addition to the General Annual Deductible, 2013
Section Nine: Prescription Drug Benefits
Almost all covered workers have coverage for prescription drugs. More than three in four covered workers are in plans with three or more cost-sharing tiers for prescription drugs. Copayments, rather than coinsurance, continue to be the preferred form of cost sharing in most drug tiers.
- As in prior years, nearly all (98%) covered workers in employer-sponsored plans have a prescription drug benefit.
Three-or-More Drug Cost-Sharing Tiers
- A large majority of covered workers (92%) in 2013 have a tiered cost-sharing formula for prescription drugs (Exhibit 9.1). Cost-sharing tiers generally refer to a health plan placing a drug on a formulary or preferred drug list, which classifies drugs as generic, preferred, or non-preferred. Over the past years, an increasing number of plans have created a fourth or even higher tier of drug cost sharing, which may be used for lifestyle drugs or expensive biologics. Employers often place various drugs in generic, preferred, or non-preferred tiers to encourage enrollees to select cheaper alternatives or to pass on to enrollees the higher costs of more expensive drugs.
- Eighty-one percent of covered workers are enrolled in plans with three, four, or more tiers of cost sharing for prescription drugs, similar to 77% of covered workers in 2012 (Exhibit 9.1). The percentage of covered workers enrolled in a plan with four or more tiers for prescription drugs has increased from 14% in 2012 to 23% in 2013.
- HDHP/SOs have different cost-sharing patterns for prescription drugs than other plan types. Only 45% of covered workers in HDHP/SOs are in a plan with three or more tiers of cost sharing for prescription drugs; 12% are in plans that pay 100% of prescription costs once the plan deductible is met (Exhibit 9.2).
- Twenty-three percent of covered workers are in a plan that has four or more tiers of cost sharing for prescription drugs (Exhibit 9.1). Among workers covered by plans with three or more tiers of cost sharing for prescription drugs, copayments are far more common than coinsurance in the first three tiers (Exhibit 9.3). For covered workers in plans with three or more cost-sharing tiers, 39% face a copayment for fourth-tier drugs and 48% face coinsurance (Exhibit 9.3).
- For covered workers in plans with three, four, or more tiers of cost sharing for prescription drugs, the average drug copayments for first-tier drugs ($10), second-tier drugs ($29), third-tier drugs ($52), and fourth-tier ($80) are comparable to the amounts reported in 2012 ($10, $29, $51, and $79, respectively) (Exhibit 9.4).
- For covered workers in plans with three, four, or more tiers of cost sharing for prescription drugs who face coinsurance rather than copayments, coinsurance levels average 16% for first-tier drugs, 25% for second-tier drugs, 38% for third-tier drugs, and 32% for fourth-tier drugs. All of the estimates are similar to last year except for the average coinsurance for first-tier drugs (16%) which is statistically different from 2012 (20%) (Exhibit 9.4).
Two Drug Cost-Sharing Tiers
- Ten percent of covered workers are in a plan that has two tiers for prescription drug cost sharing (Exhibit 9.1). Similar to workers in plans with more cost-sharing tiers, copayments are more common than coinsurance for workers in plans with two tiers (Exhibit 9.5). The average copayment for the first tier is $11, and the average copayment for the second tier is $31. The average coinsurance rate for the second tier is 30% (Exhibit 9.6).
Single Drug Cost-Sharing Tiers
- Five percent of covered workers are covered by plans in which cost sharing is the same regardless of the type of drug chosen (Exhibit 9.1). Among these covered workers, 19% have copayments and 81% have coinsurance (Exhibit 9.7).
- For those workers with the same cost sharing regardless of the type of drug, the average copayment is $12 and the average coinsurance is 22% (Exhibit 9.8).
- Coinsurance rates for prescription drugs often have maximum or minimum dollar amounts associated with the coinsurance rate. Twenty-three percent of workers with a coinsurance rate have a maximum dollar amount attached to the coinsurance rate, 6% have a minimum, and 17% have both for first-tier drugs (Exhibit 9.9).
Generic drugs: Drugs product that are no longer covered by patent protection and thus may be produced and/or distributed by multiple drug companies.
Preferred drugs: Drugs included on a formulary or preferred drug list; for example, a brand-name drug without a generic substitute.
Nonpreferred drugs: Drugs not included on a formulary or preferred drug list; for example, a brand-name drug with a generic substitute.
Fourth-tier drugs: New types of cost-sharing arrangements that typically build additional layers of higher copayments or coinsurance for specifically identified types of drugs, such as lifestyle drugs or biologics.
Brand-name drugs: Generally, a drug product that is covered by a patent and is thus manufactured and sold exclusively by one firm. Cross-licensing occasionally occurs, allowing an additional firm to market the drug. After the patent expires, multiple firms can produce the drug product, but the brand name or trademark remains with the original manufacturer’s product.
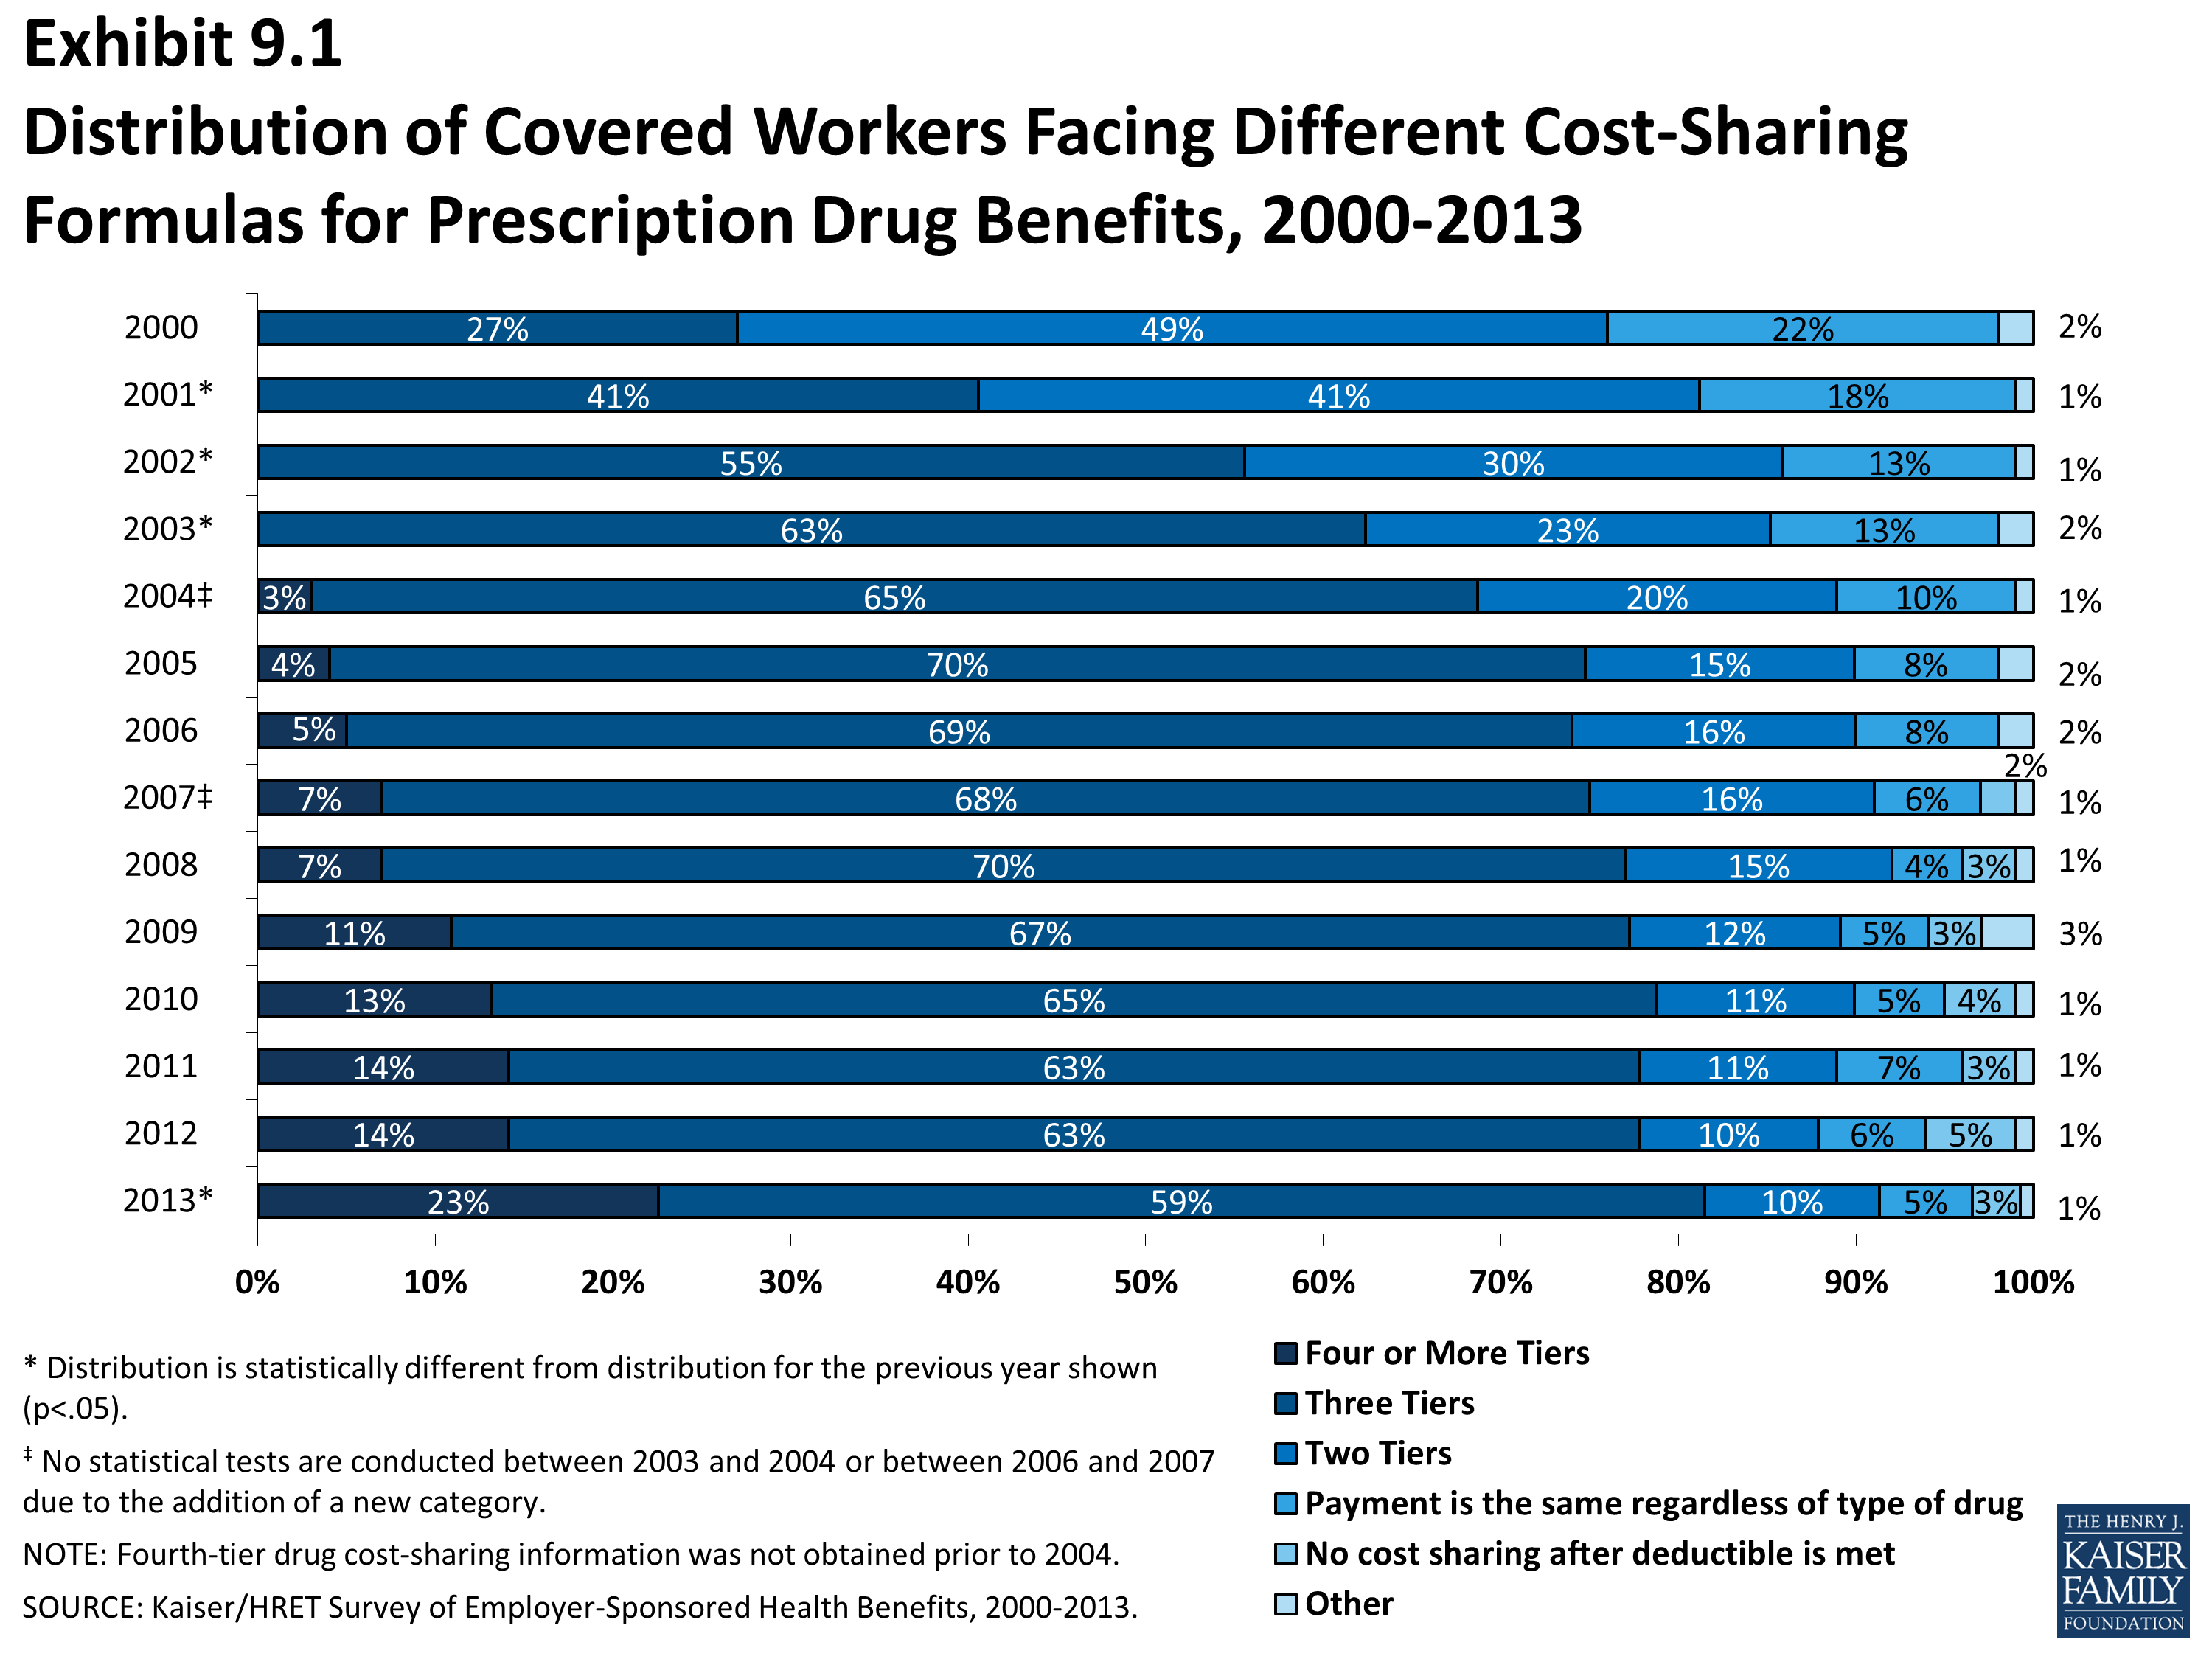
Distribution of Covered Workers Facing Different Cost-Sharing Formulas for Prescription Drug Benefits, 2000-2013
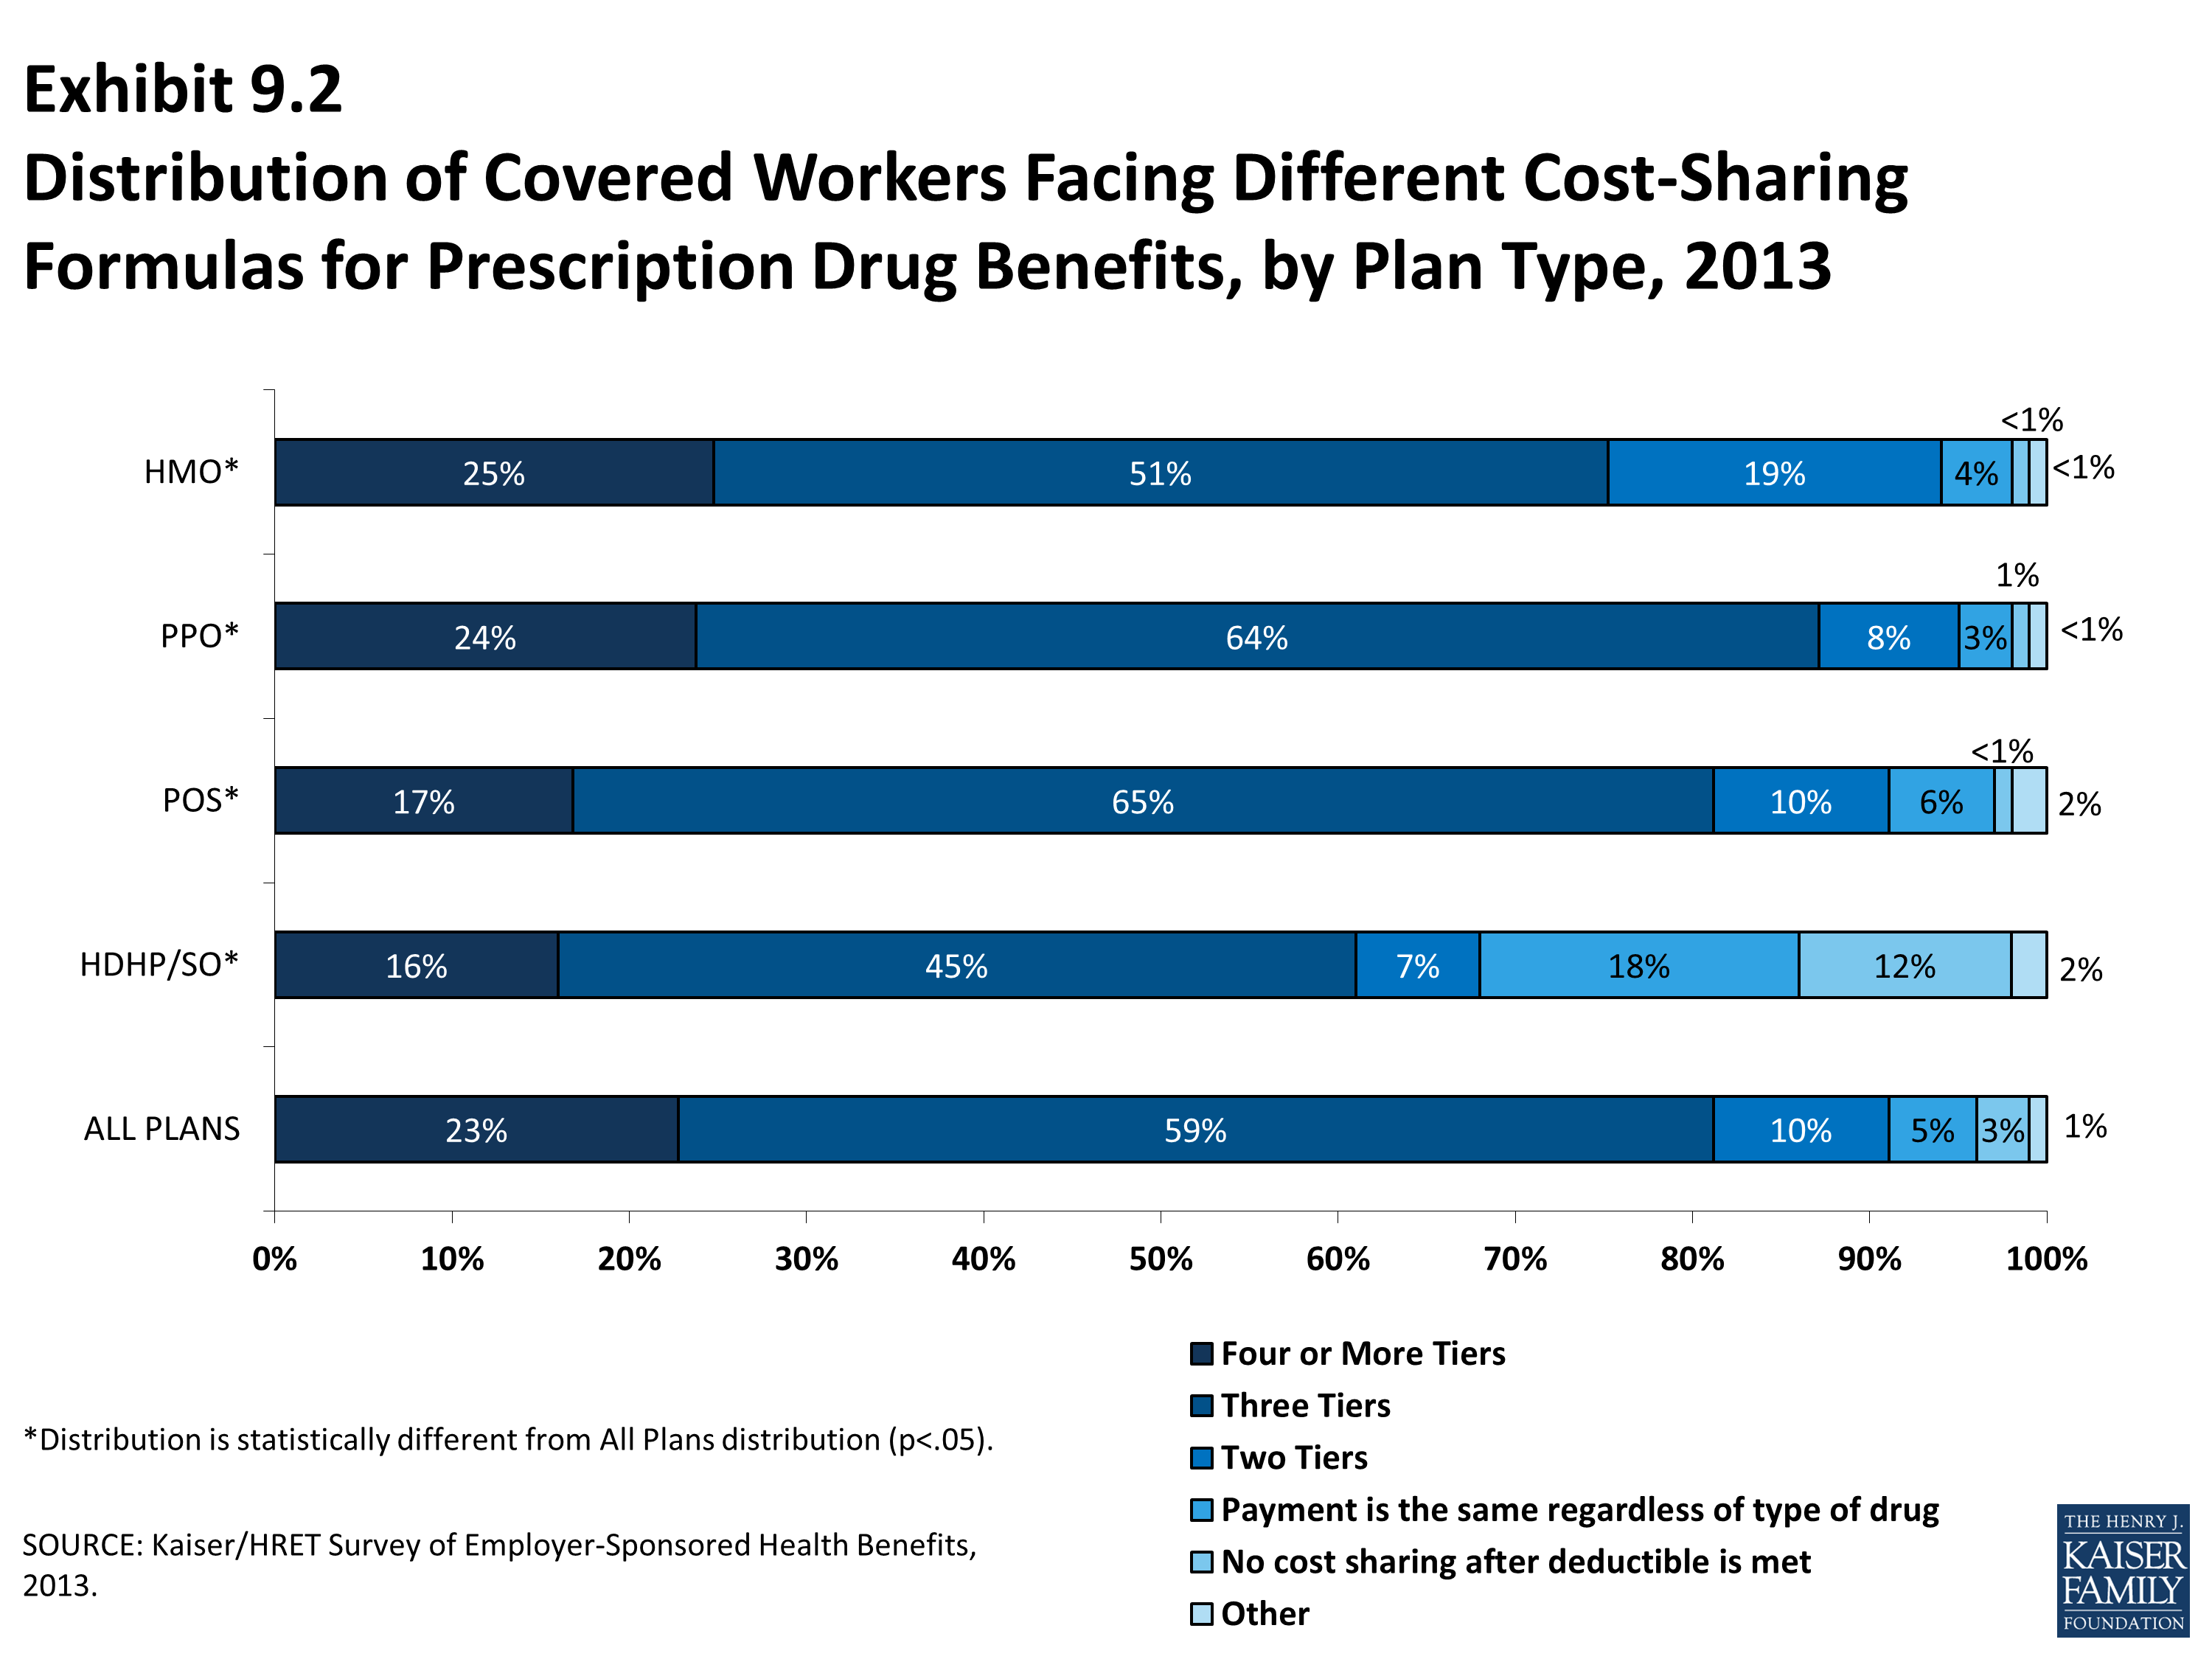
Distribution of Covered Workers Facing Different Cost-Sharing Formulas for Prescription Drug Benefits, by Plan Type, 2013
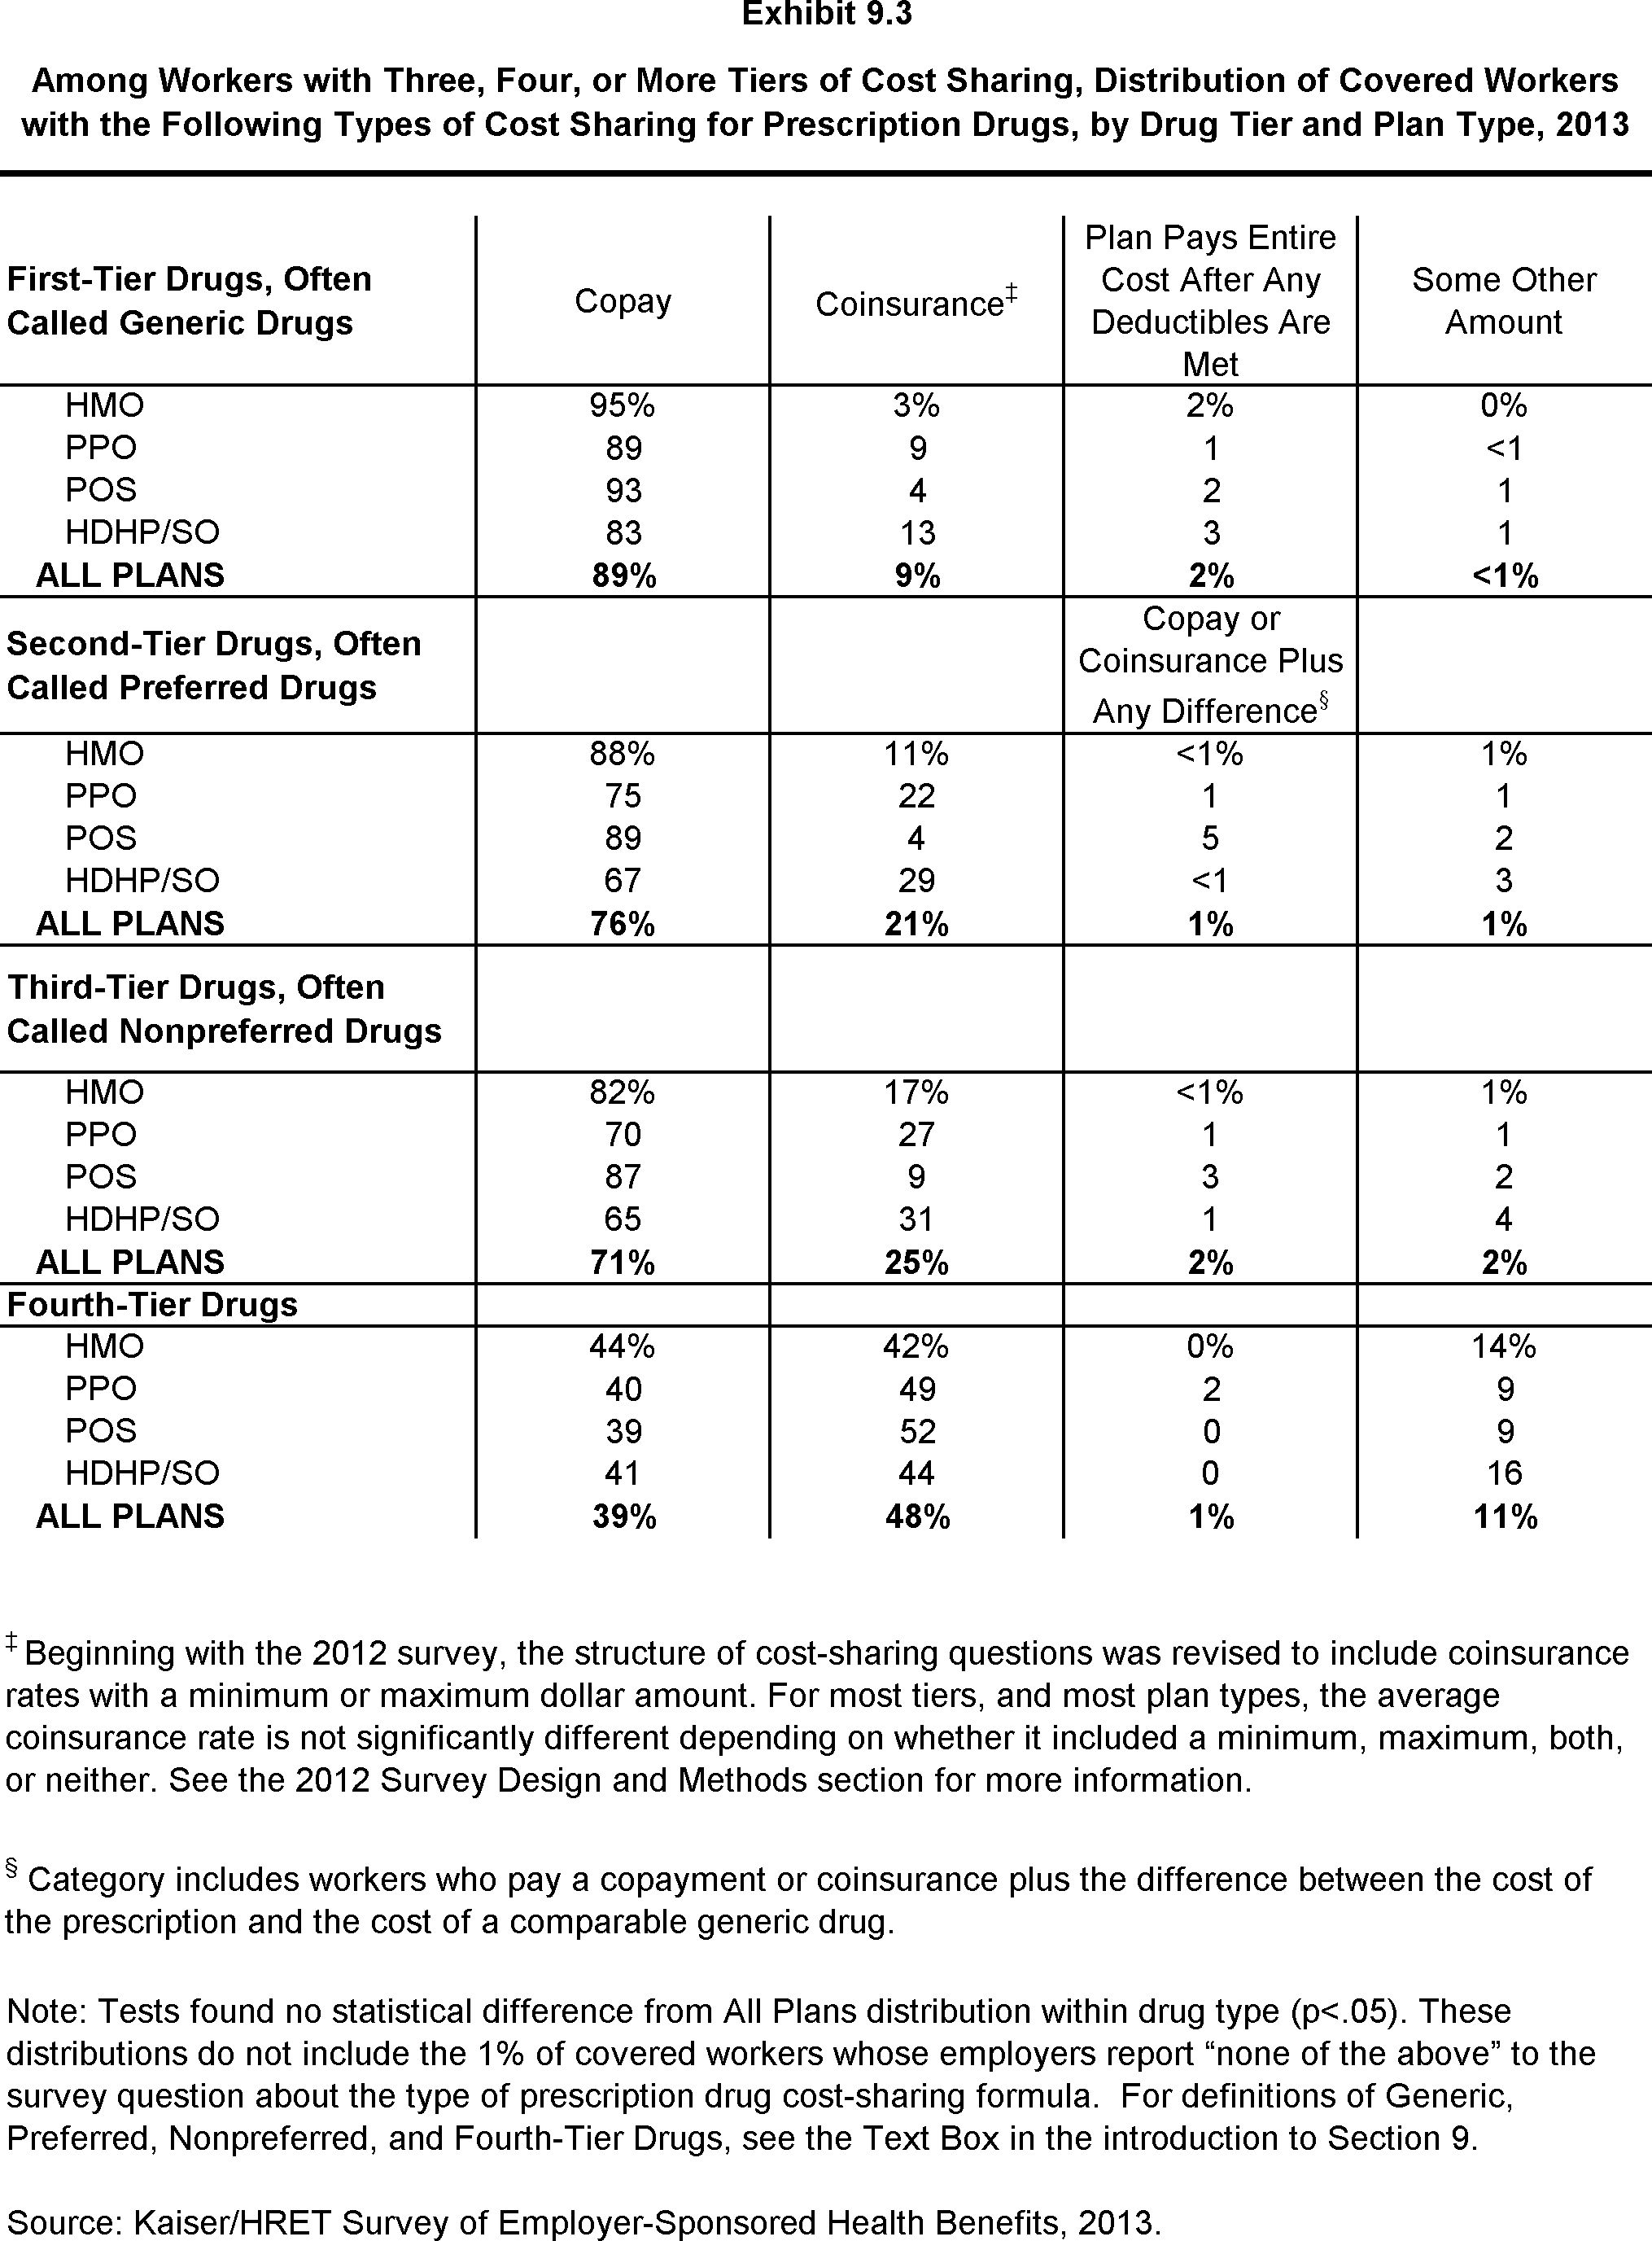
Among Workers with Three, Four, or More Tiers of Cost Sharing, Distribution of Covered Workers with the Following Types of Cost Sharing for Prescription Drugs, by Drug Tier and Plan Type, 2013
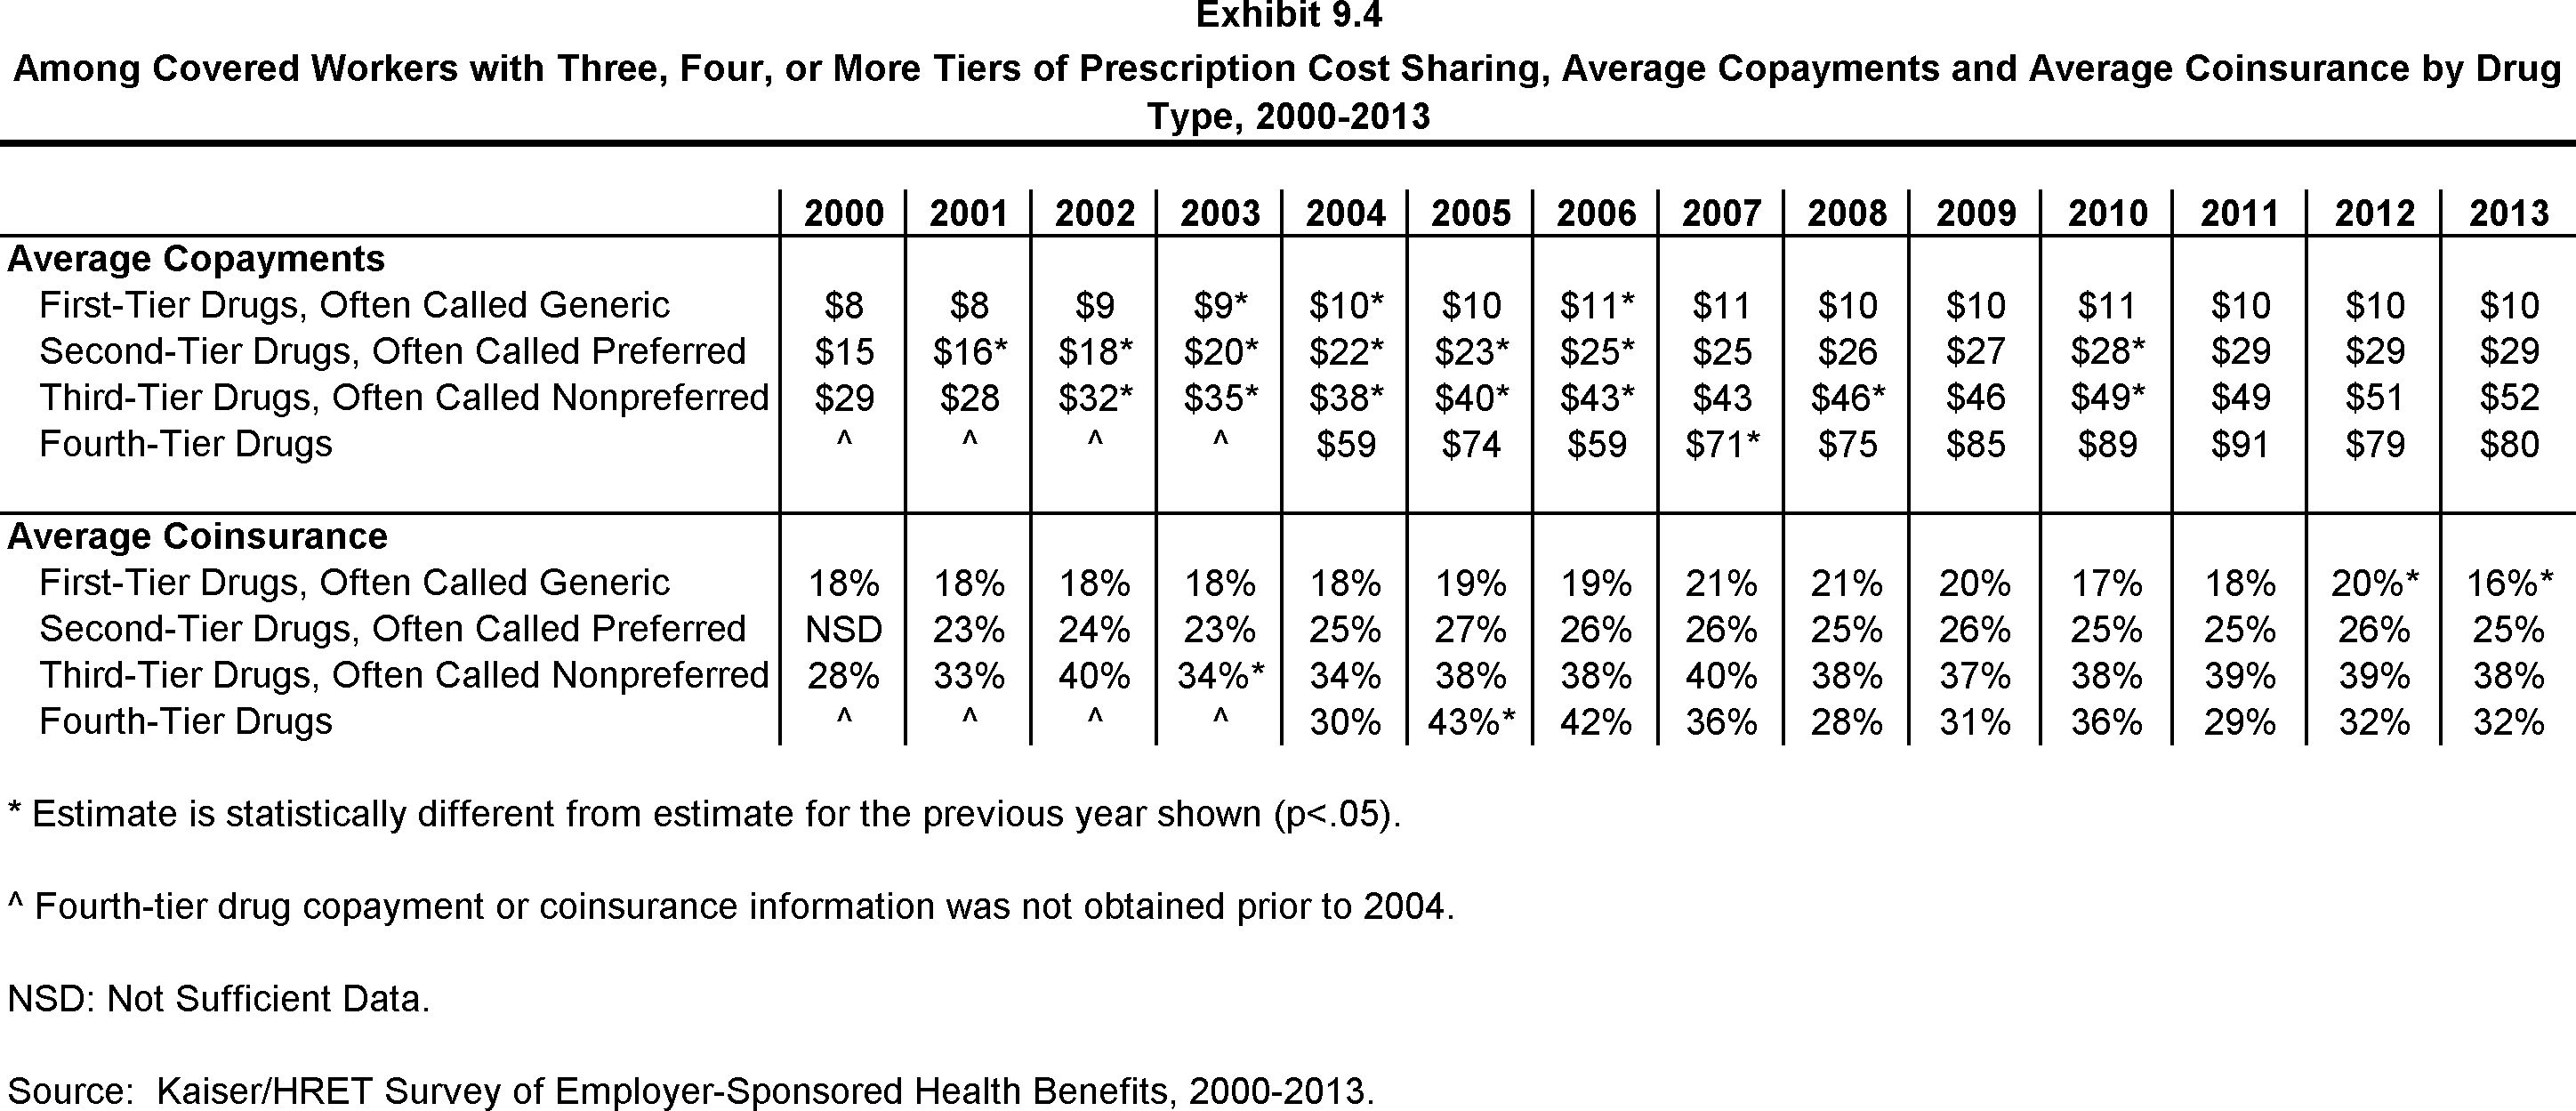
Among Covered Workers with Three, Four, or More Tiers of Prescription Cost Sharing, Average Copayments and Average Coinsurance by Drug Type, 2000-2013
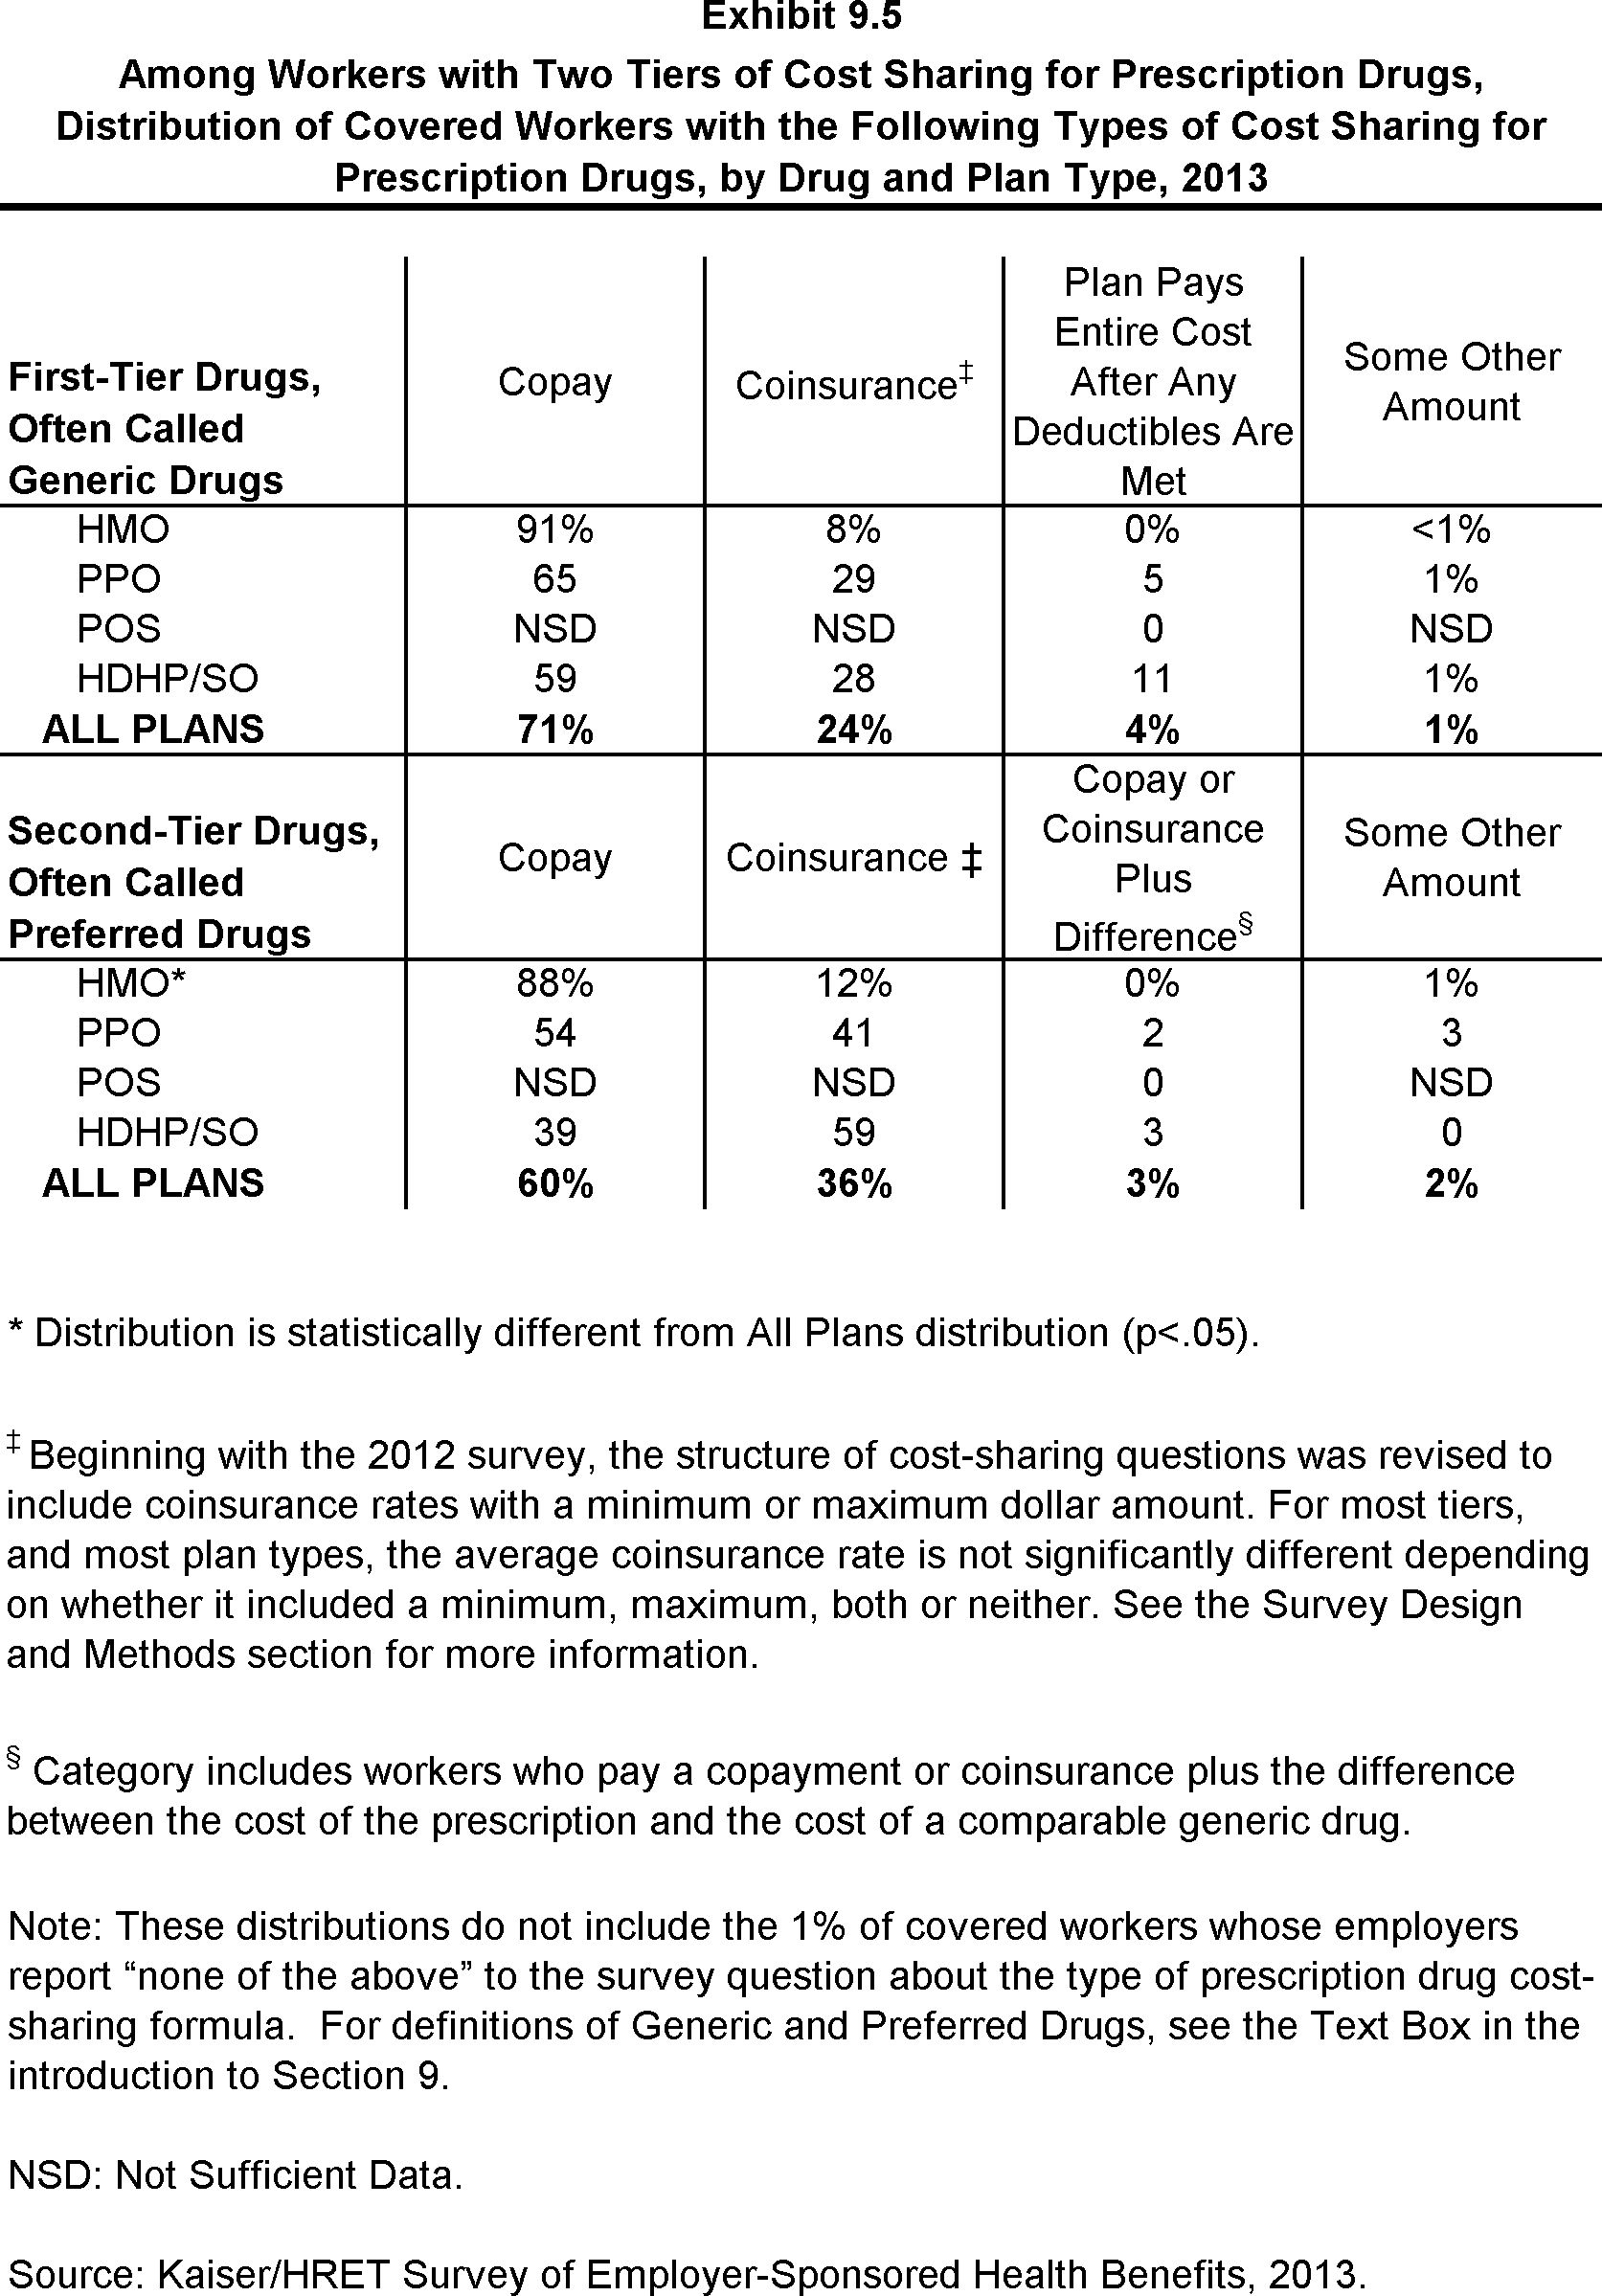
Among Workers with Two Tiers of Cost Sharing for Prescription Drugs, Distribution of Covered Workers with the Following Types of Cost Sharing for Prescription Drugs, by Drug and Plan Type, 2013
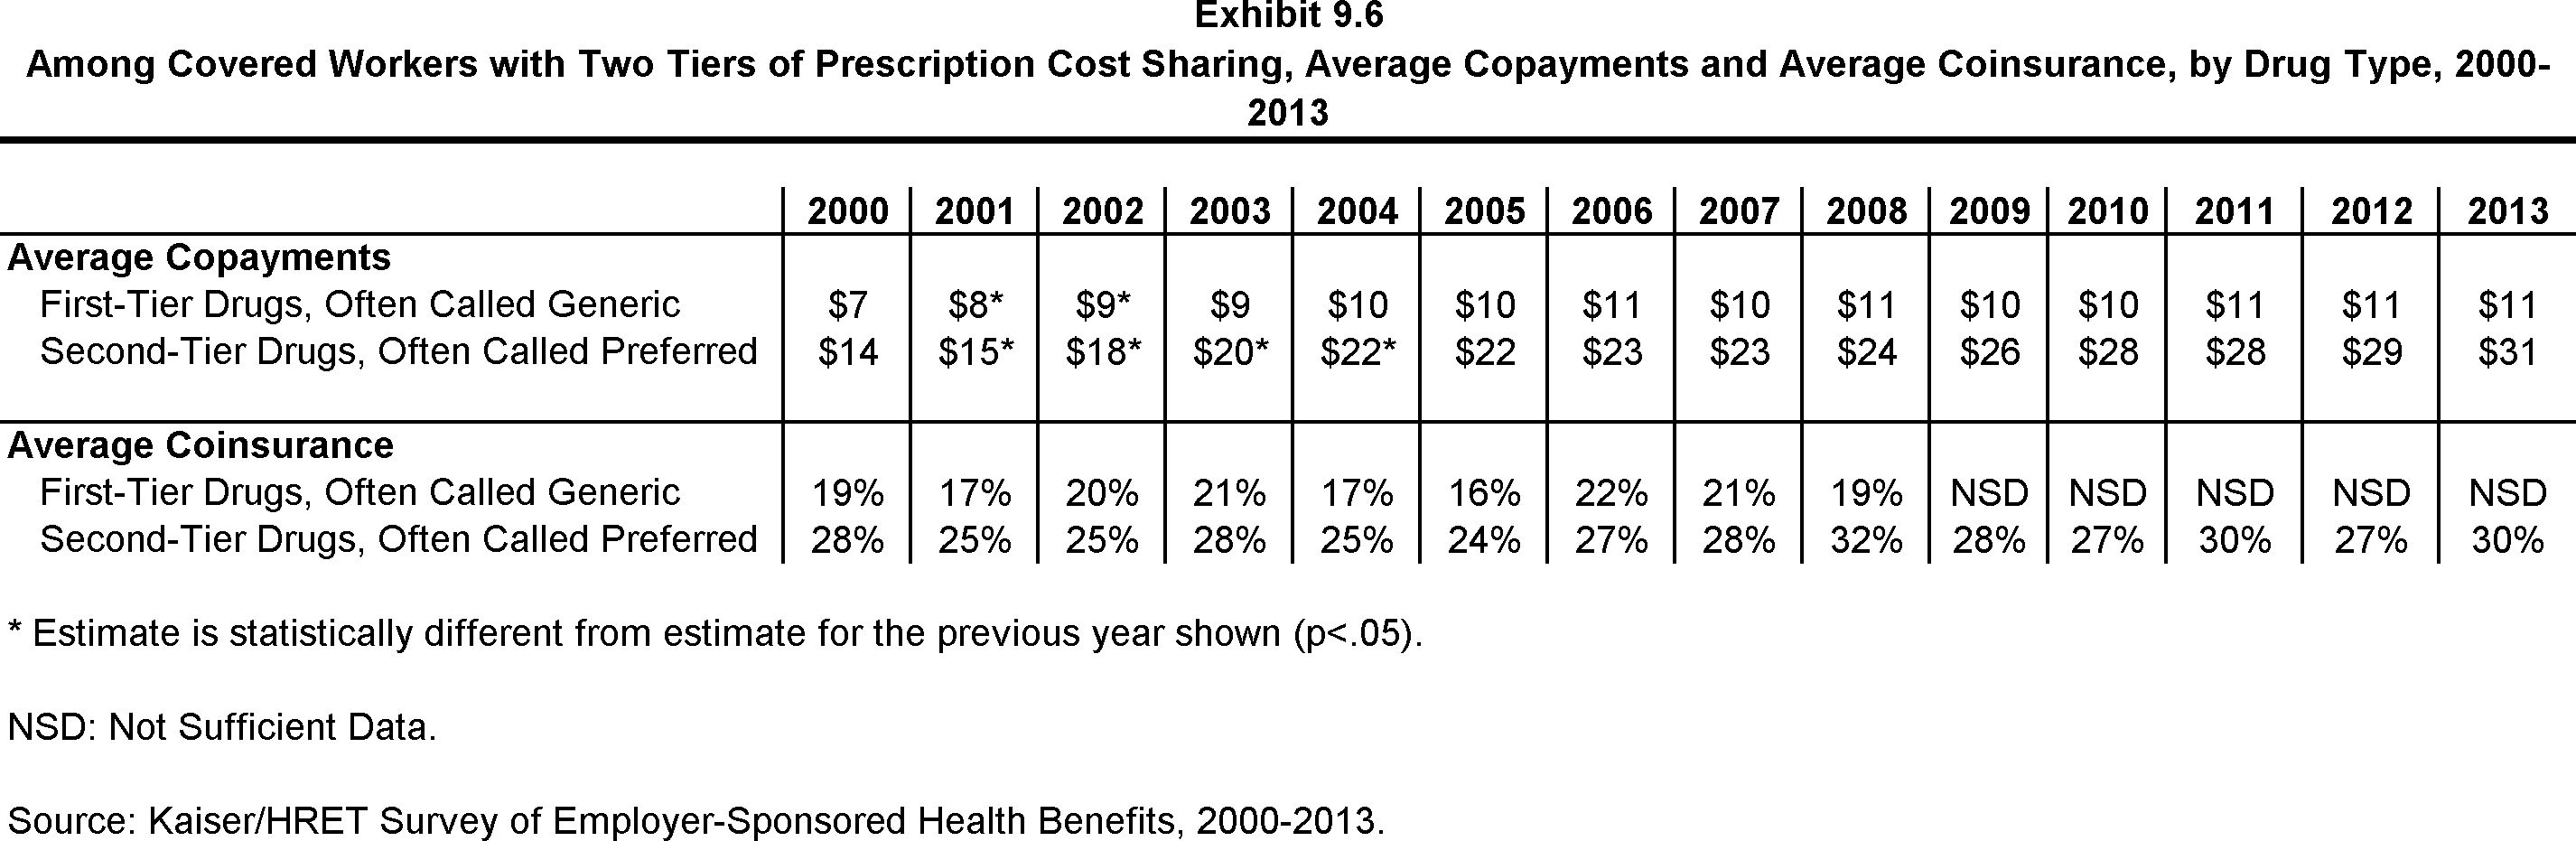
Among Covered Workers with Two Tiers of Prescription Cost Sharing, Average Copayments and Average Coinsurance, by Drug Type, 2000-2013
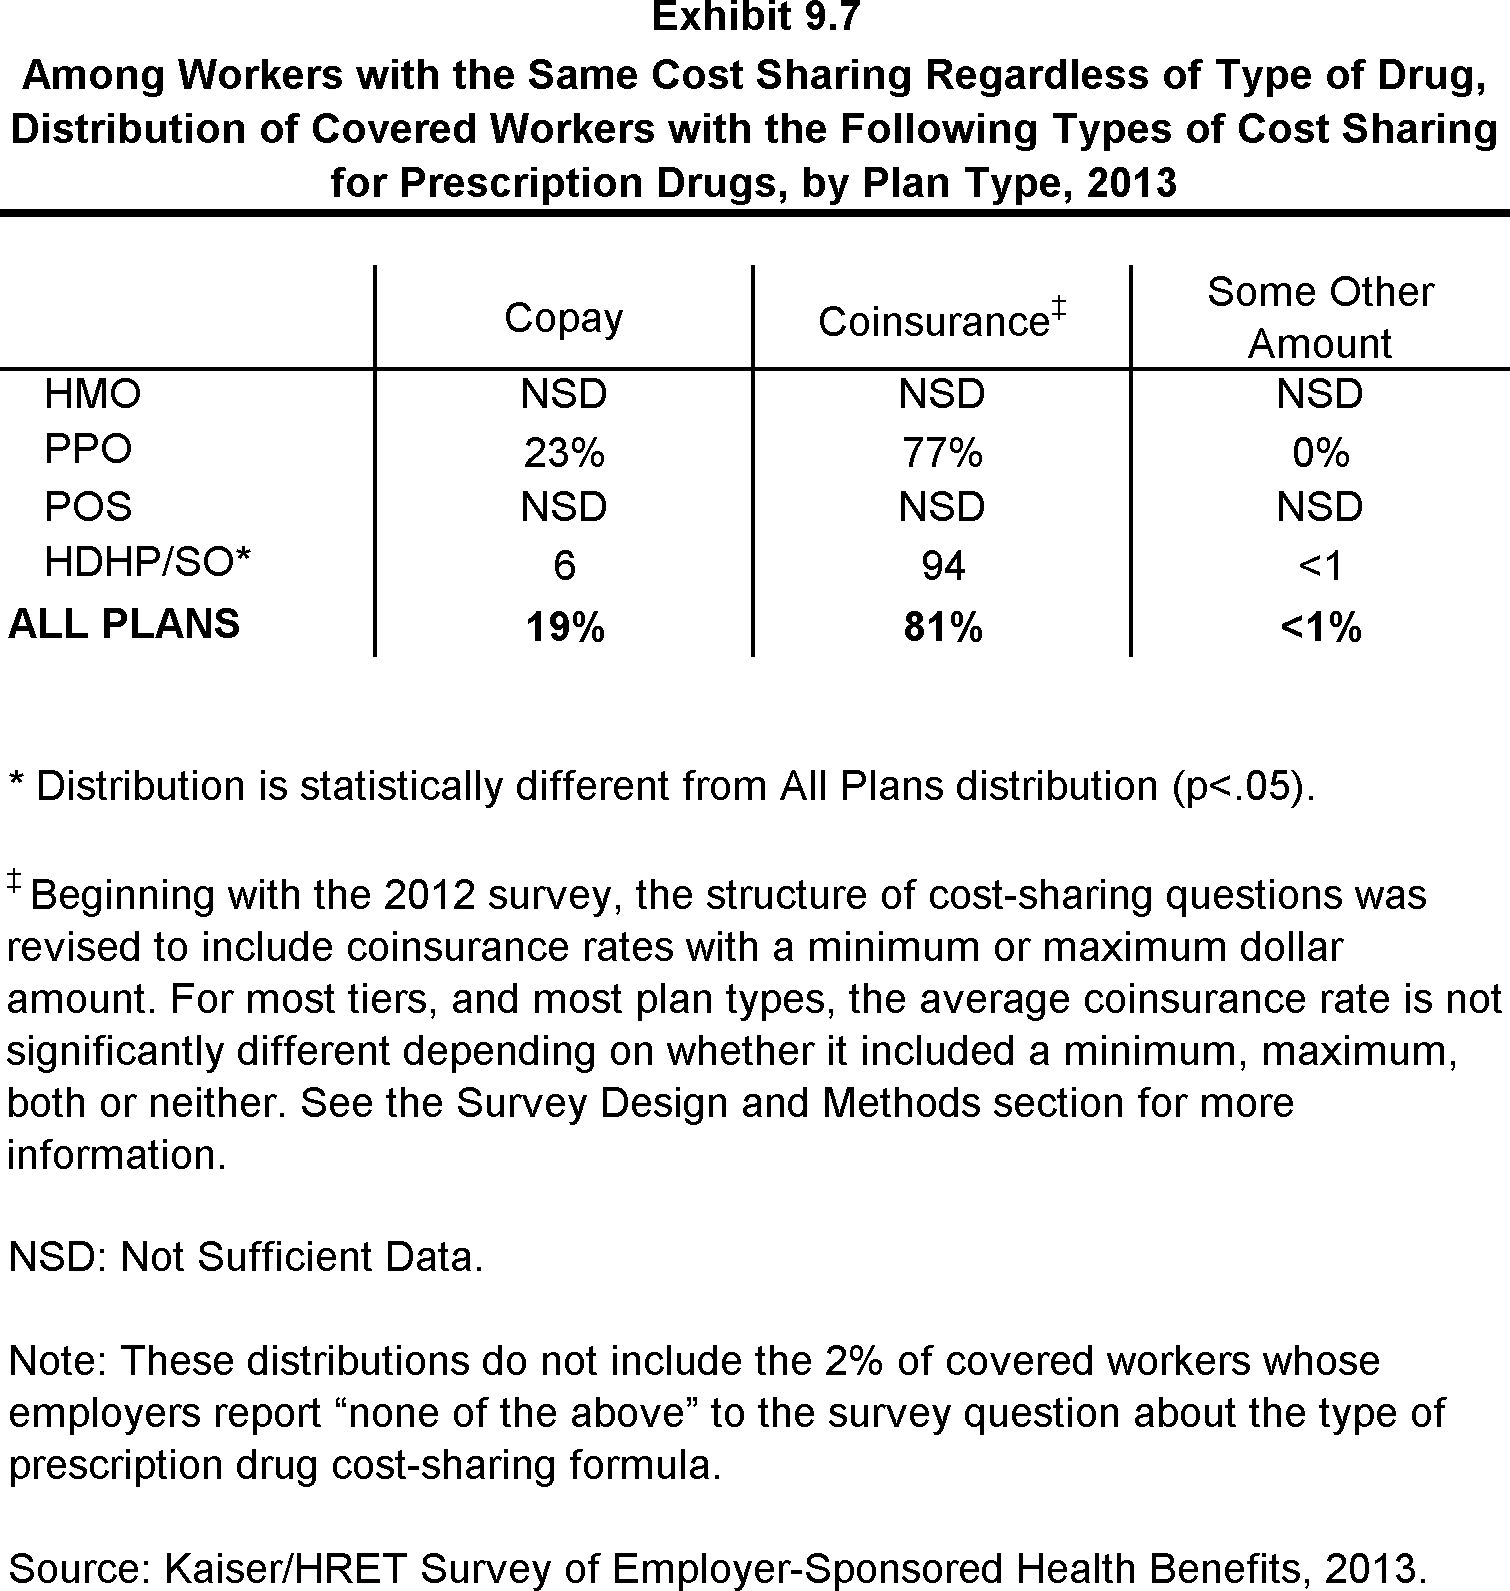
Among Workers with the Same Cost Sharing Regardless of Type of Drug, Distribution of Covered Workers with the Following Types of Cost Sharing for Prescription Drugs, by Plan Type, 2013
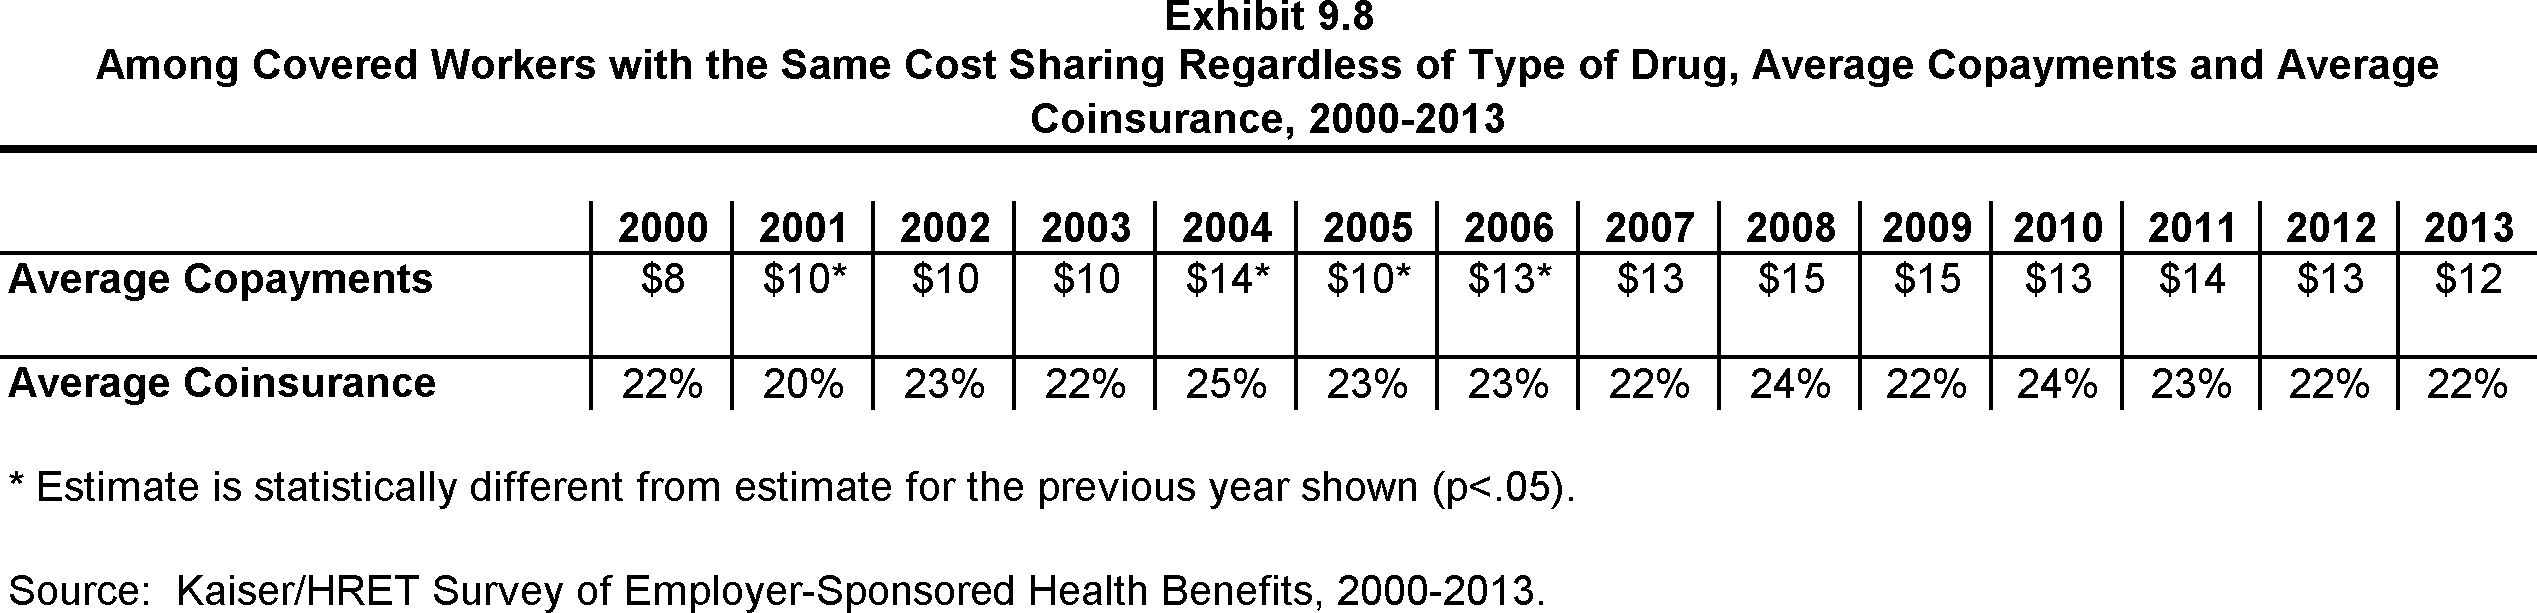
Among Covered Workers with the Same Cost Sharing Regardless of Type of Drug, Average Copayments and Average Coinsurance, 2000-2013
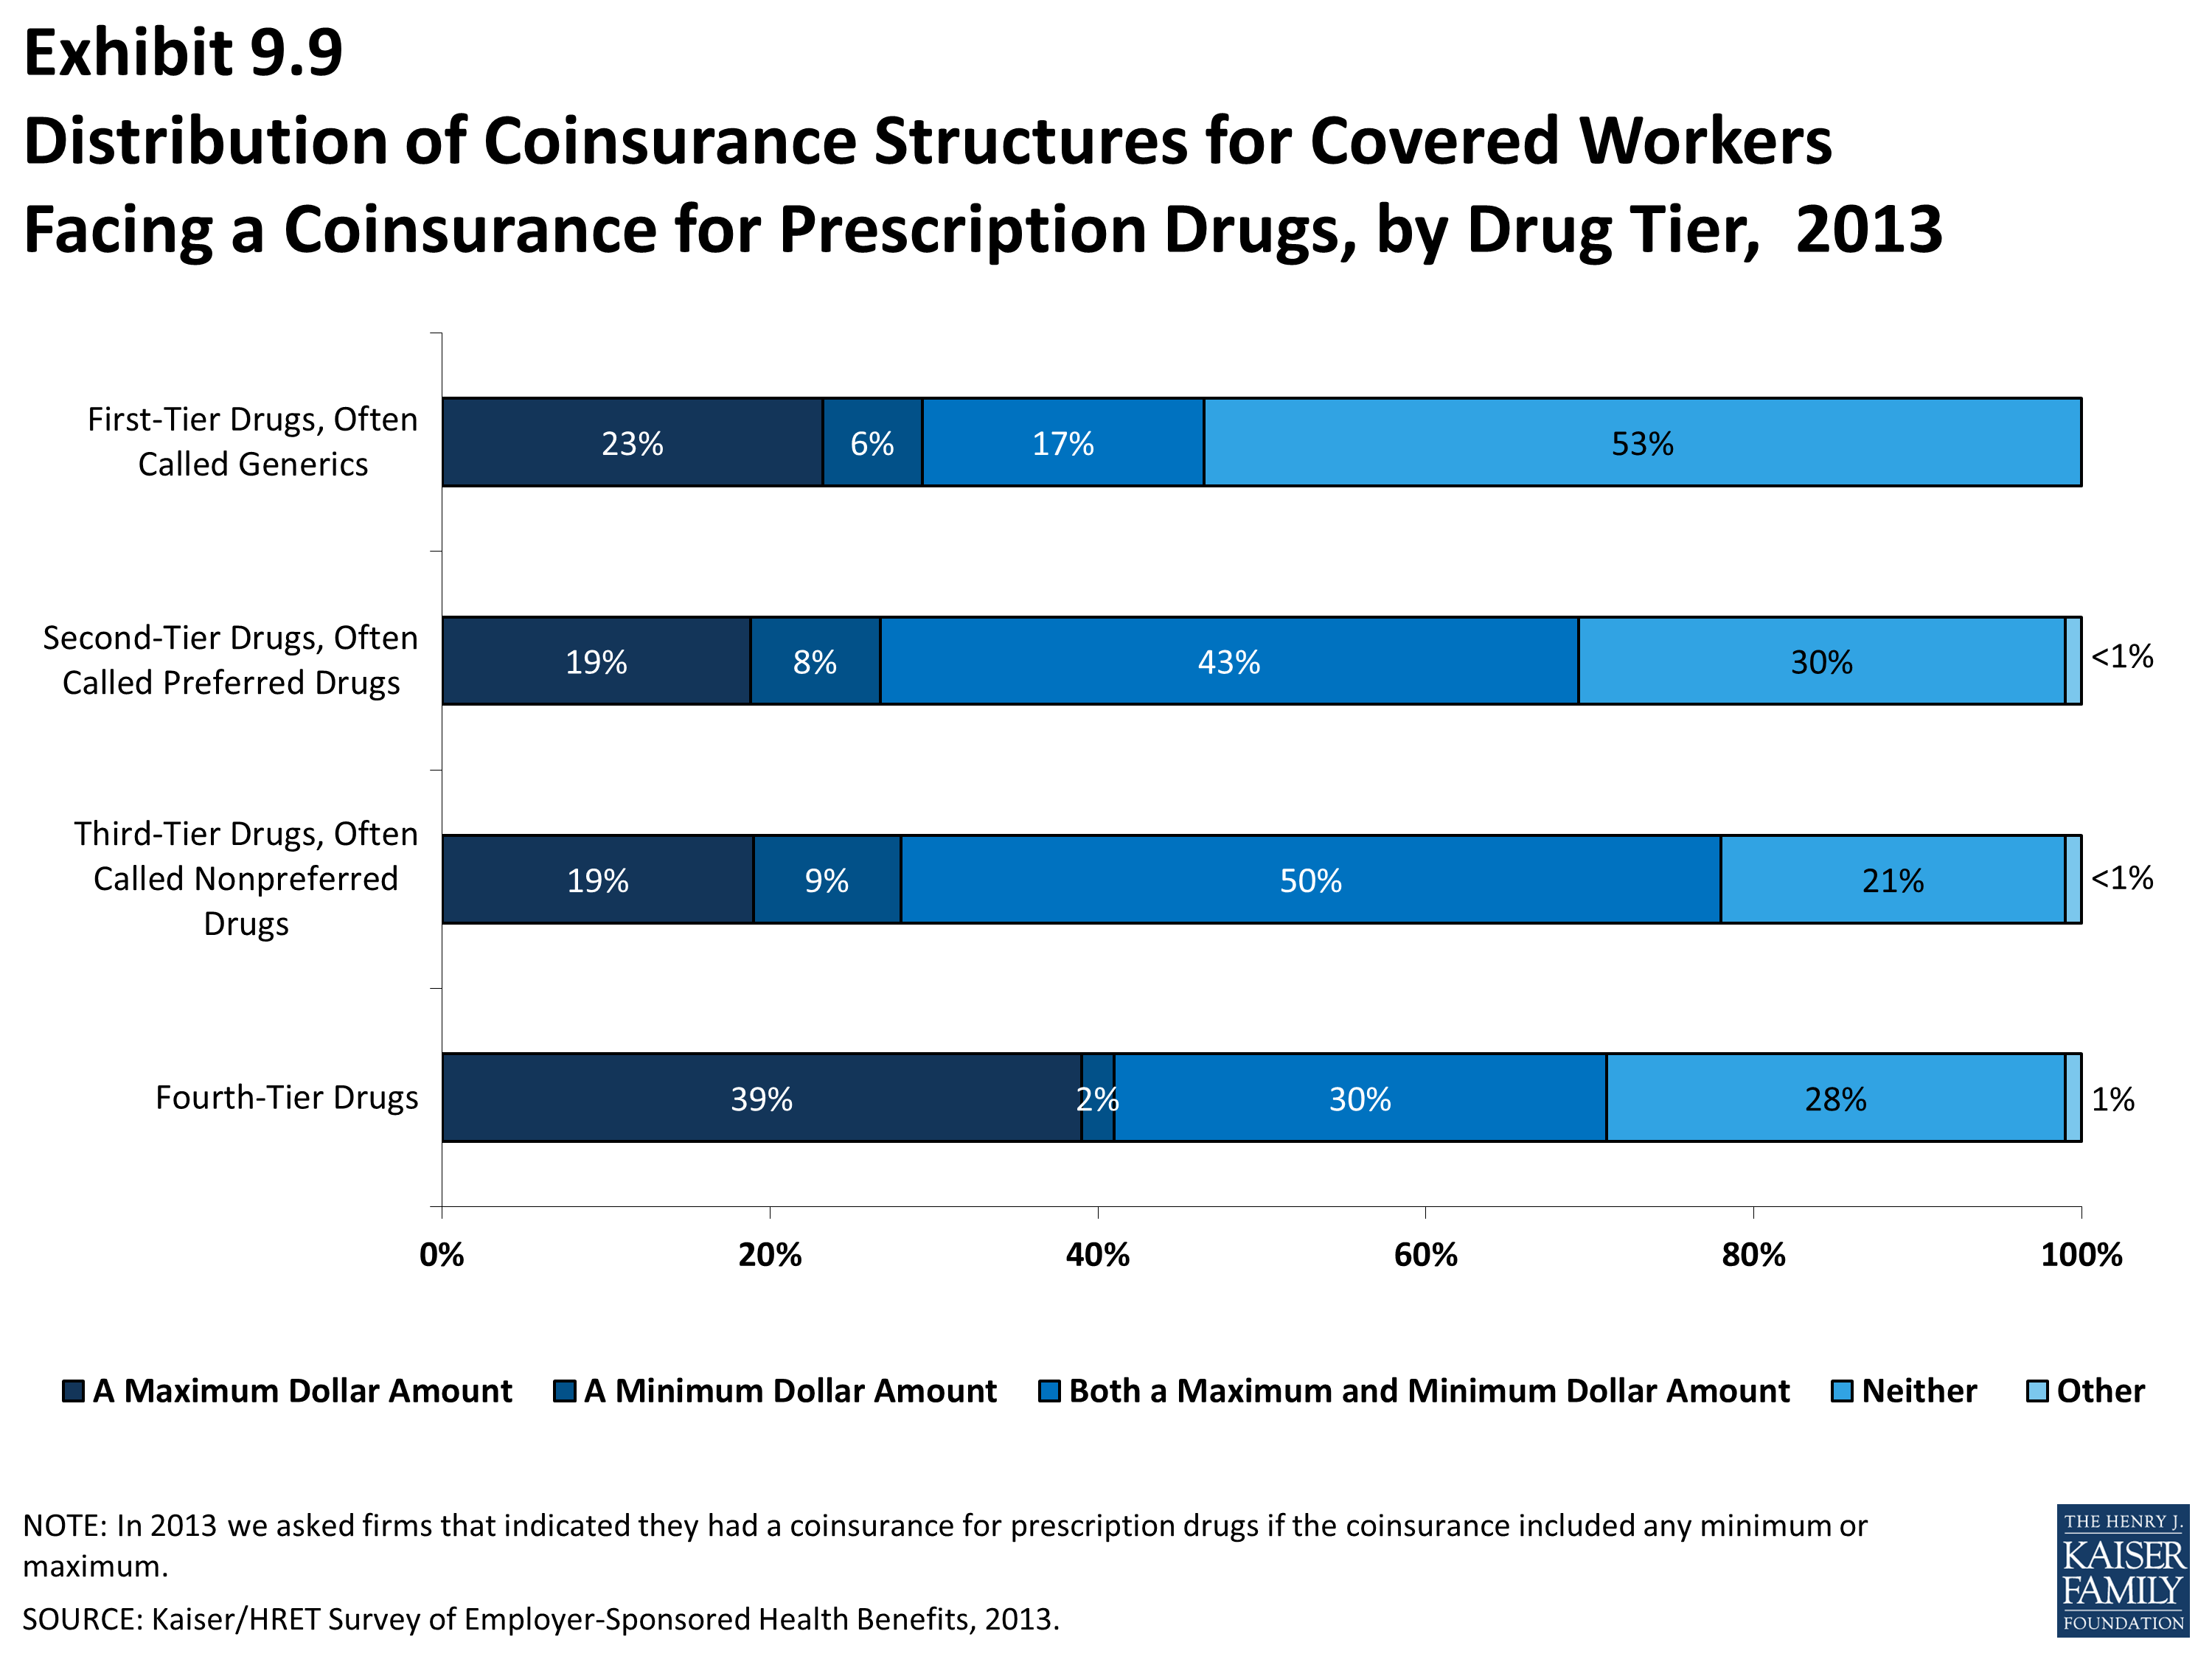
Distribution of Coinsurance Structures for Covered Workers Facing a Coinsurance for Prescription Drugs, by Drug Tier, 2013
Section Ten: Plan Funding
Federal law (the Employee Retirement Income Security Act of 1974, or ERISA) exempts self-funded plans from state insurance laws, including reserve requirements, mandated benefits, premium taxes, and consumer protection regulations. Three in five covered workers are in a self-funded health plan. Self-funding is common among larger firms because they can spread the risk of costly claims over a large number of employees and dependents. Many self-funded plans use insurance, often called stoploss coverage, to limit the plan sponsor’s liability for very large claims. Almost three in five covered workers in self-funded plans are in plans with stoploss protection.
Self-Funded Plan: An insurance arrangement in which the employer assumes direct financial responsibility for the costs of enrollees’ medical claims. Employers sponsoring self-funded plans typically contract with a third-party administrator or insurer to provide administrative services for the self-funded plan. In some cases, the employer may buy stop-loss coverage from an insurer to protect the employer against very large claims.
Fully Insured Plan: An insurance arrangement in which the employer contracts with a health plan that assumes financial responsibility for the costs of enrollees’ medical claims.
- Sixty-one percent of covered workers are in a self-funded plan, similar to the percentage reported in 2012 (Exhibit 10.1). The percentage of covered workers who are in a plan that is completely or partially self-funded has increased over time from 49% in 2000 to 54% in 2005 and to 59% in 2010.
- The percentage of covered workers differs by plan type: 70% of covered workers in PPOs, 62% in HDHP/SOs, 31% in HMOs, and 31% in POS plans are in a self-funded plan (Exhibit 10.5).
- As expected, covered workers in large firms (200 or more workers) are significantly more likely to be in a self-funded plan than covered workers in small firms (3-199 workers) (83% vs. 16%) (Exhibit 10.4). The percentage of covered workers in self-funded plans increases as the number of employees in a firm increases. Seventy-nine percent of covered workers in firms with 1,000 to 4,999 workers and 94% of covered workers in firms with 5,000 or more workers are in self-funded plans in 2013 (Exhibit 10.4).
- Fifty-nine percent of workers in self-funded health plans are in plans that have stoploss insurance (Exhibit 10.10). Stoploss coverage limits the amount that a plan sponsor has to pay in claims. Stoploss coverage may limit the amount of claims that must be paid for each employee or may limit the total amount the plan sponsor must pay for all claims over the plan year.
- Eighty-eight percent of covered workers in self-funded plans that have stoploss protection are in plans where the stoploss insurance limits the amount that the plan must spend on each employee (Exhibit 10.11).1
- Firms with per enrollee stoploss coverage were asked for the dollar amount where the stoploss coverage would start to pay for most or all of the claim (called an attachment point). The average attachment point in small firms (50-199 workers) is about $96,000. For larger firms (200 or more workers), the average attachment point is about $317,000 (Exhibit 10.11).
- In anticipation of major provisions of the Affordable Care Act (ACA) going into effect in 2014, firms offering health benefits were asked whether they plan to self-insure. Self-funded plans are not required to comply with the medical loss ratio or the essential health benefits rules that apply to some fully insured plans.
- Six percent of firms offering fully-insured plans reported they plan to self-insure, 83% reported that they did not plan to self-insure, and 11% did not know (Exhibit 10.13). There were no significant differences between small and large firms.
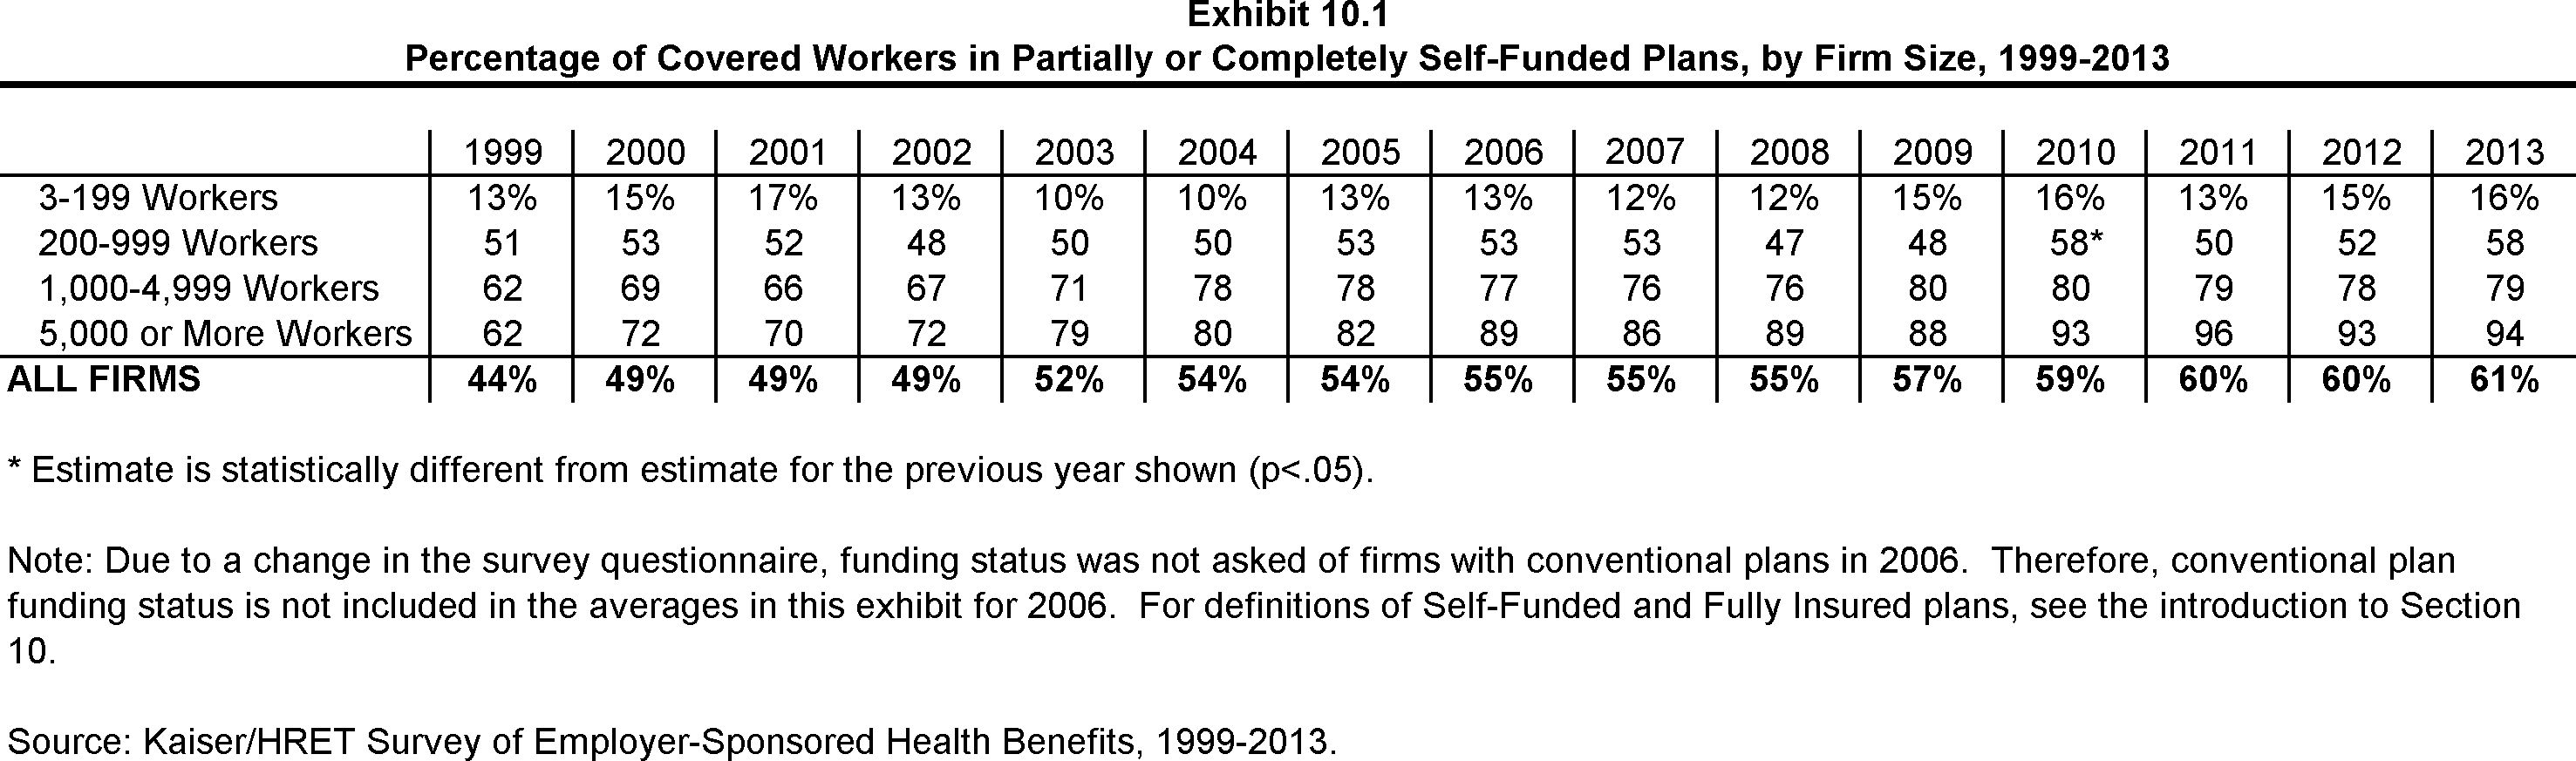
Percentage of Covered Workers in Partially or Completely Self-Funded Plans, by Firm Size, 1999-2013
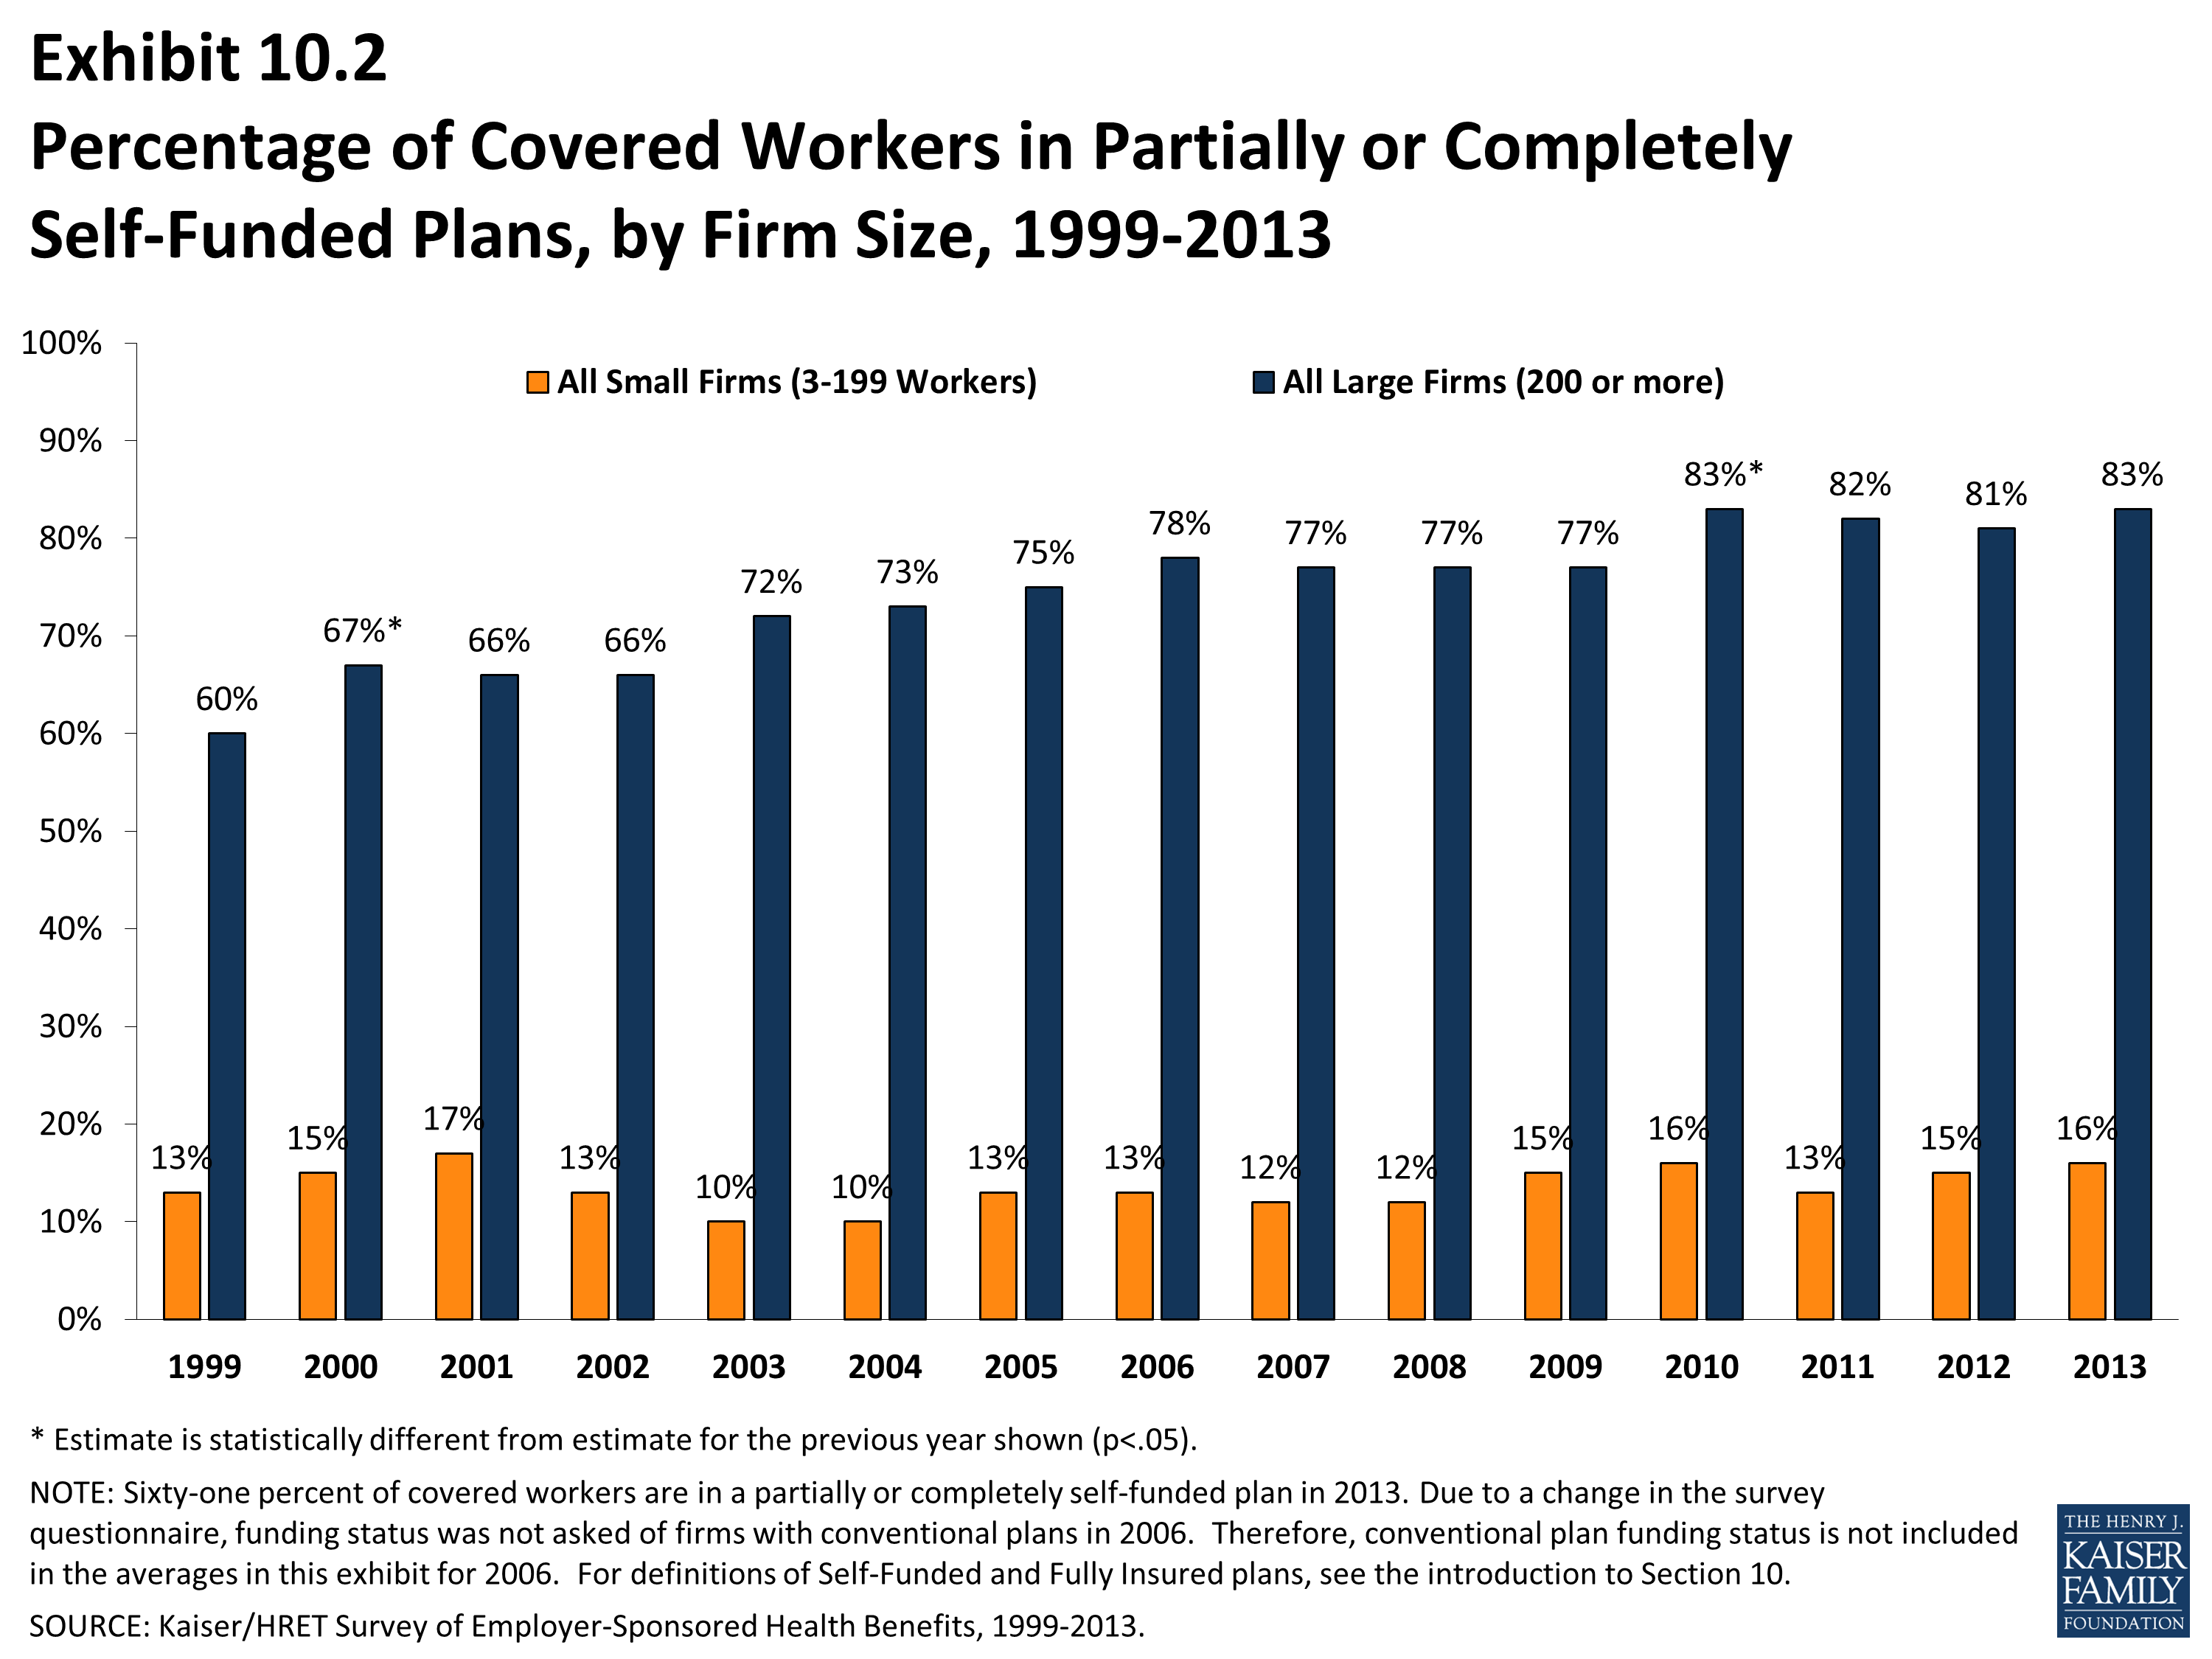
Percentage of Covered Workers in Partially or Completely Self-Funded Plans, by Firm Size, 1999-2013
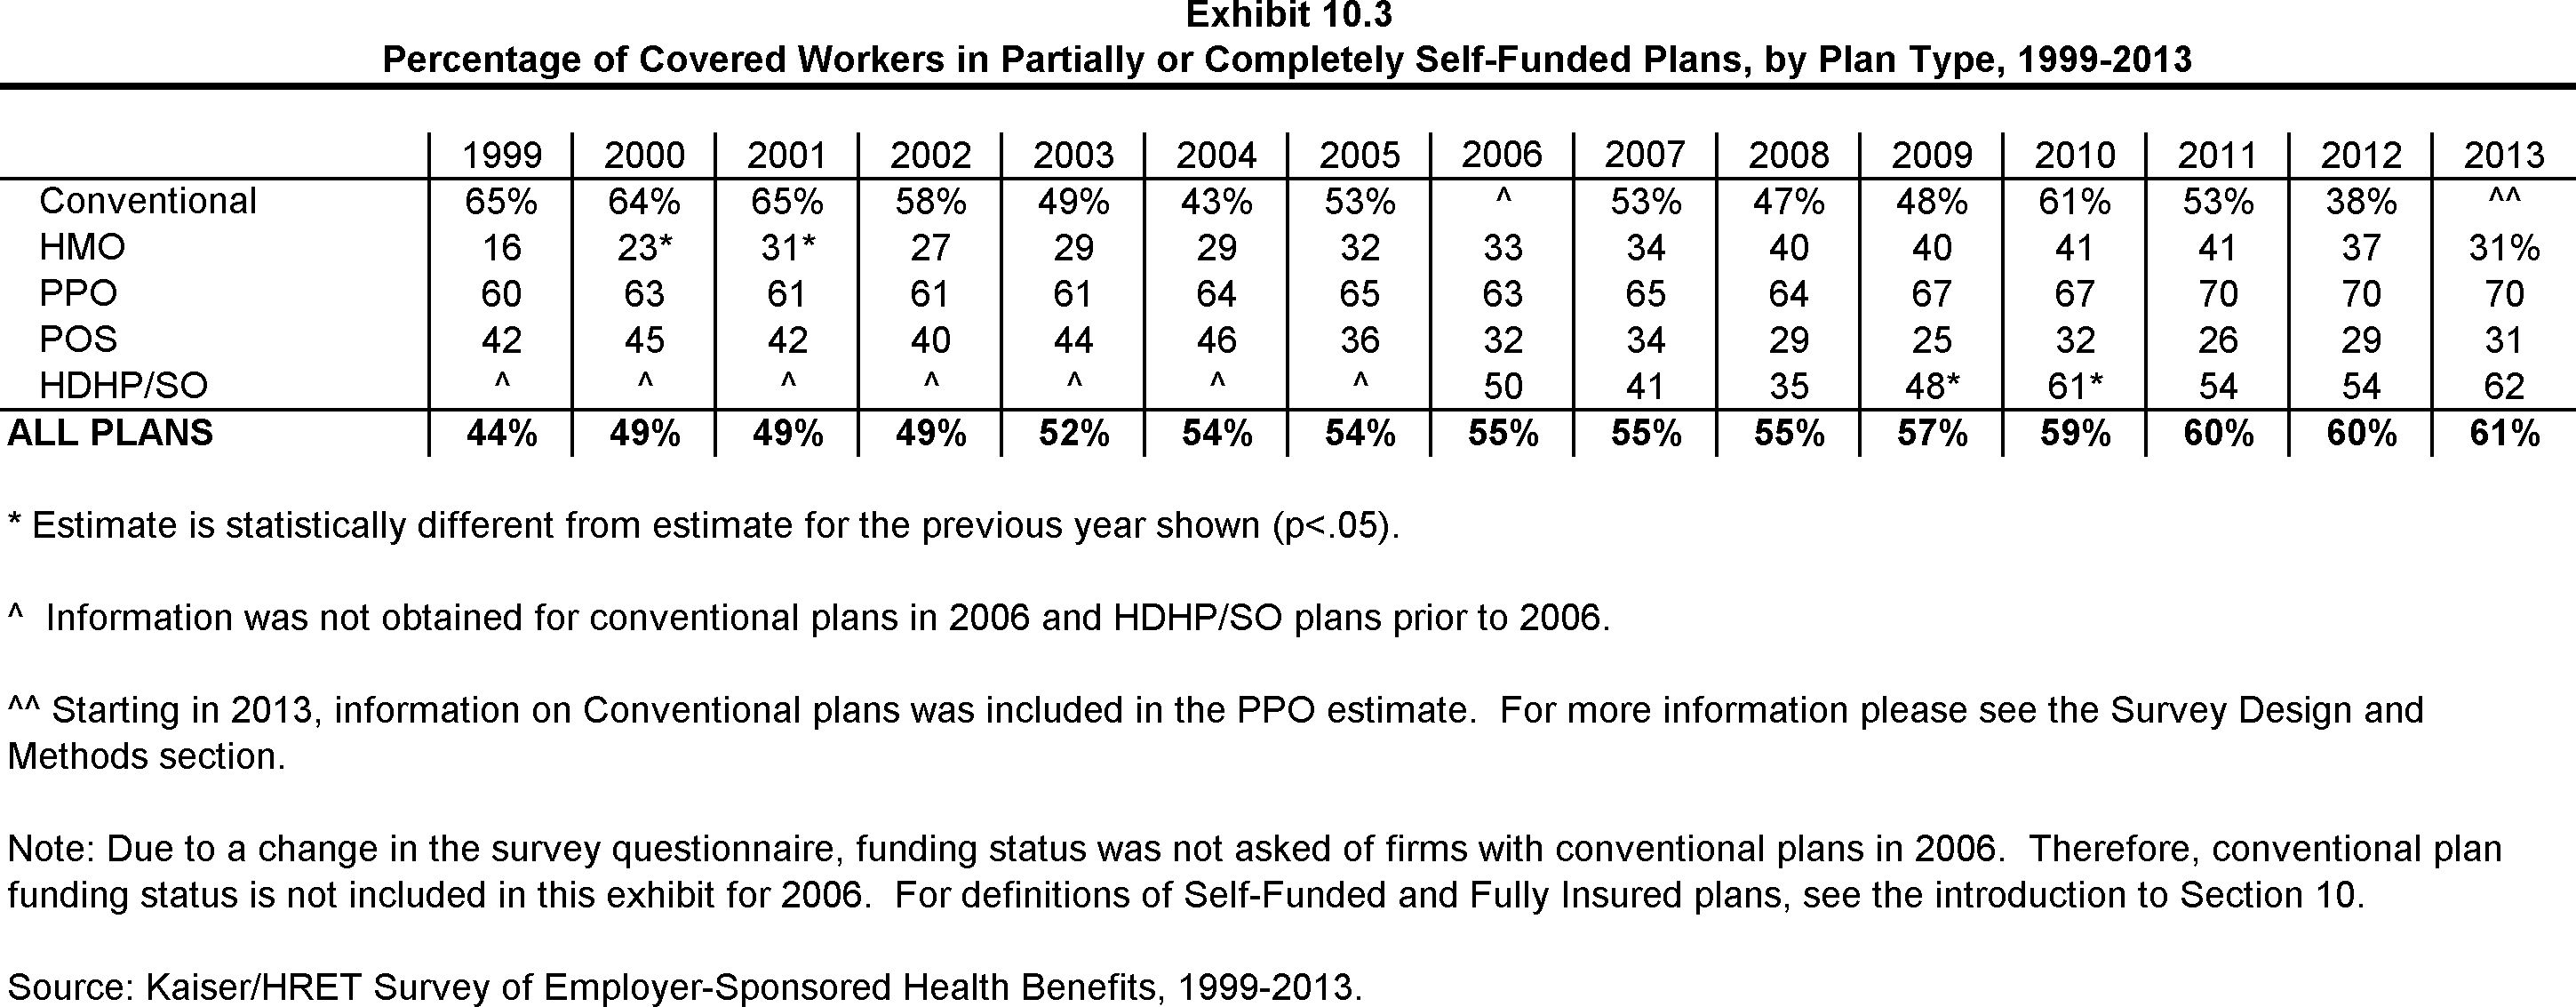
Percentage of Covered Workers in Partially or Completely Self-Funded Plans, by Plan Type, 1999-2013
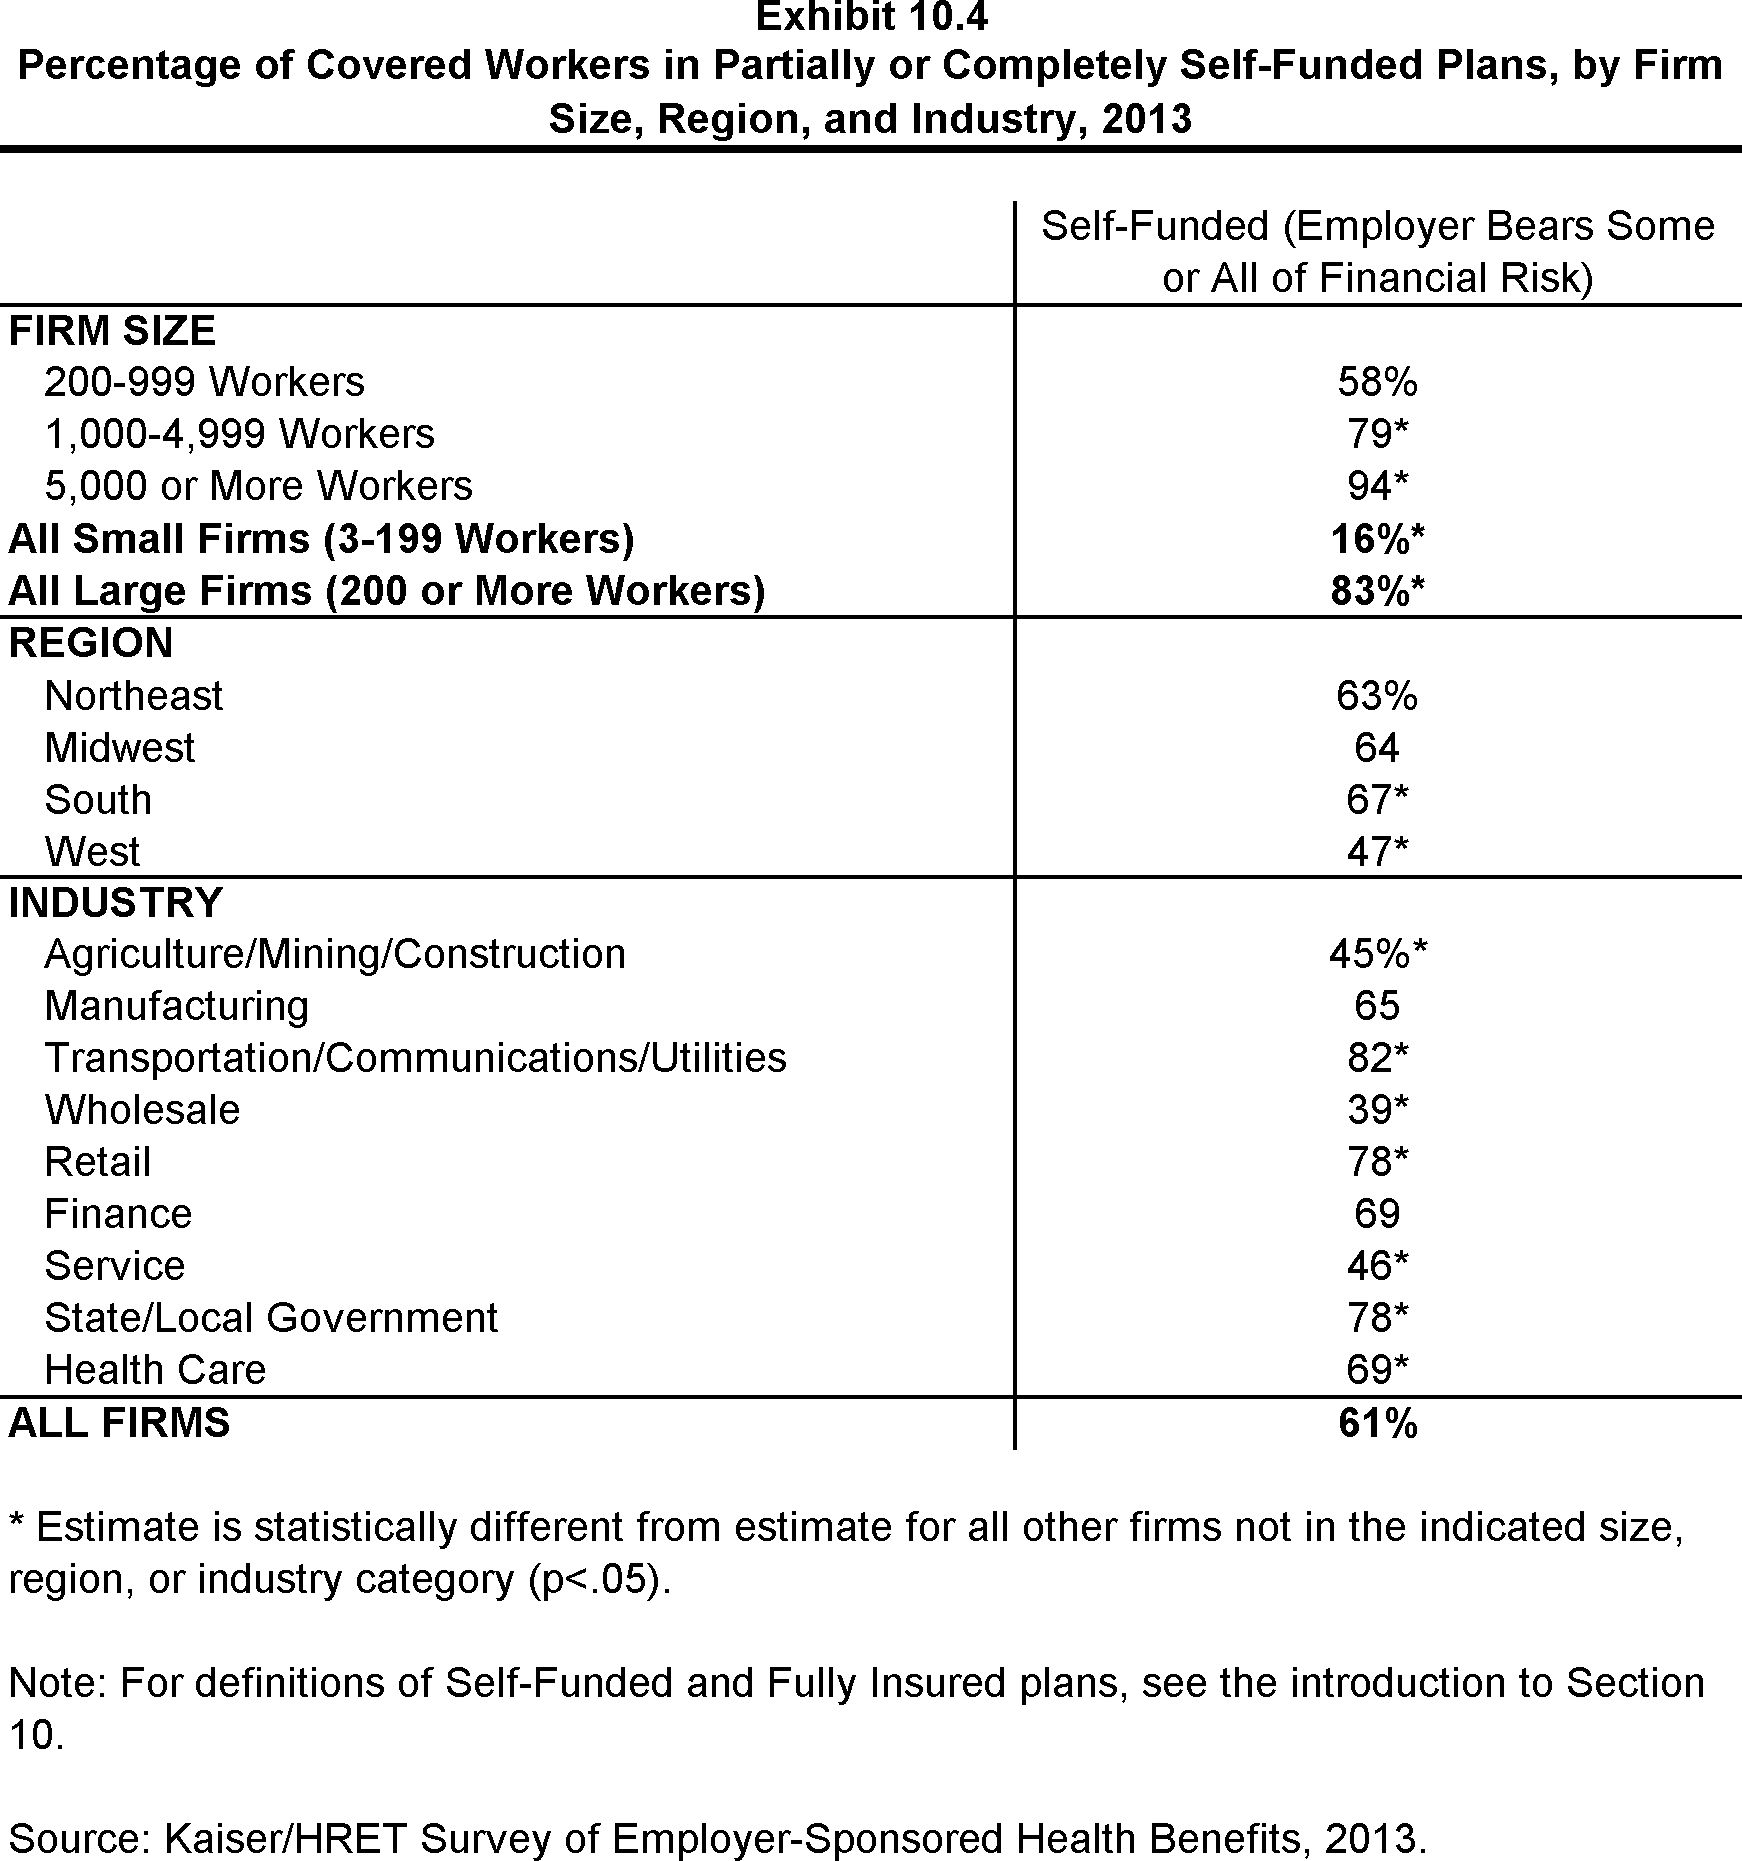
Percentage of Covered Workers in Partially or Completely Self-Funded Plans, by Firm Size, Region, and Industry, 2013
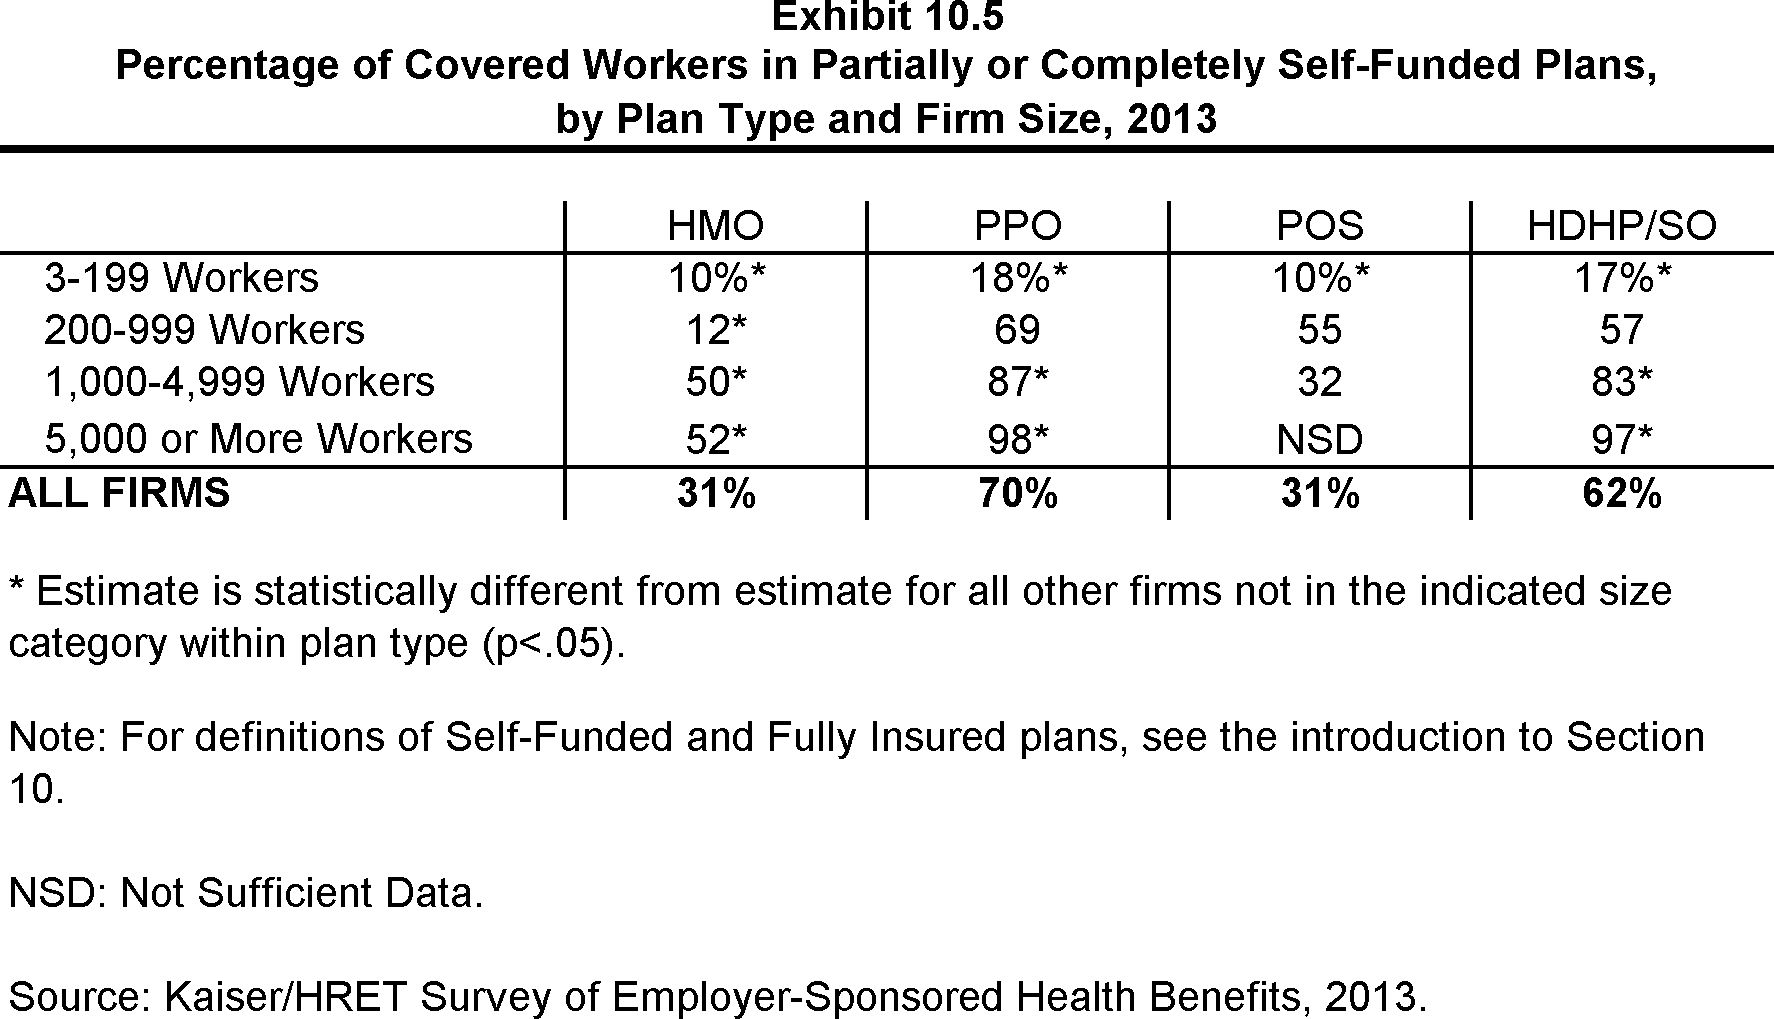
Percentage of Covered Workers in Partially or Completely Self-Funded Plans, by Plan Type and Firm Size, 2013

Percentage of Covered Workers in Partially or Completely Self-Funded HMO Plans, by Firm Size, 1999-2013
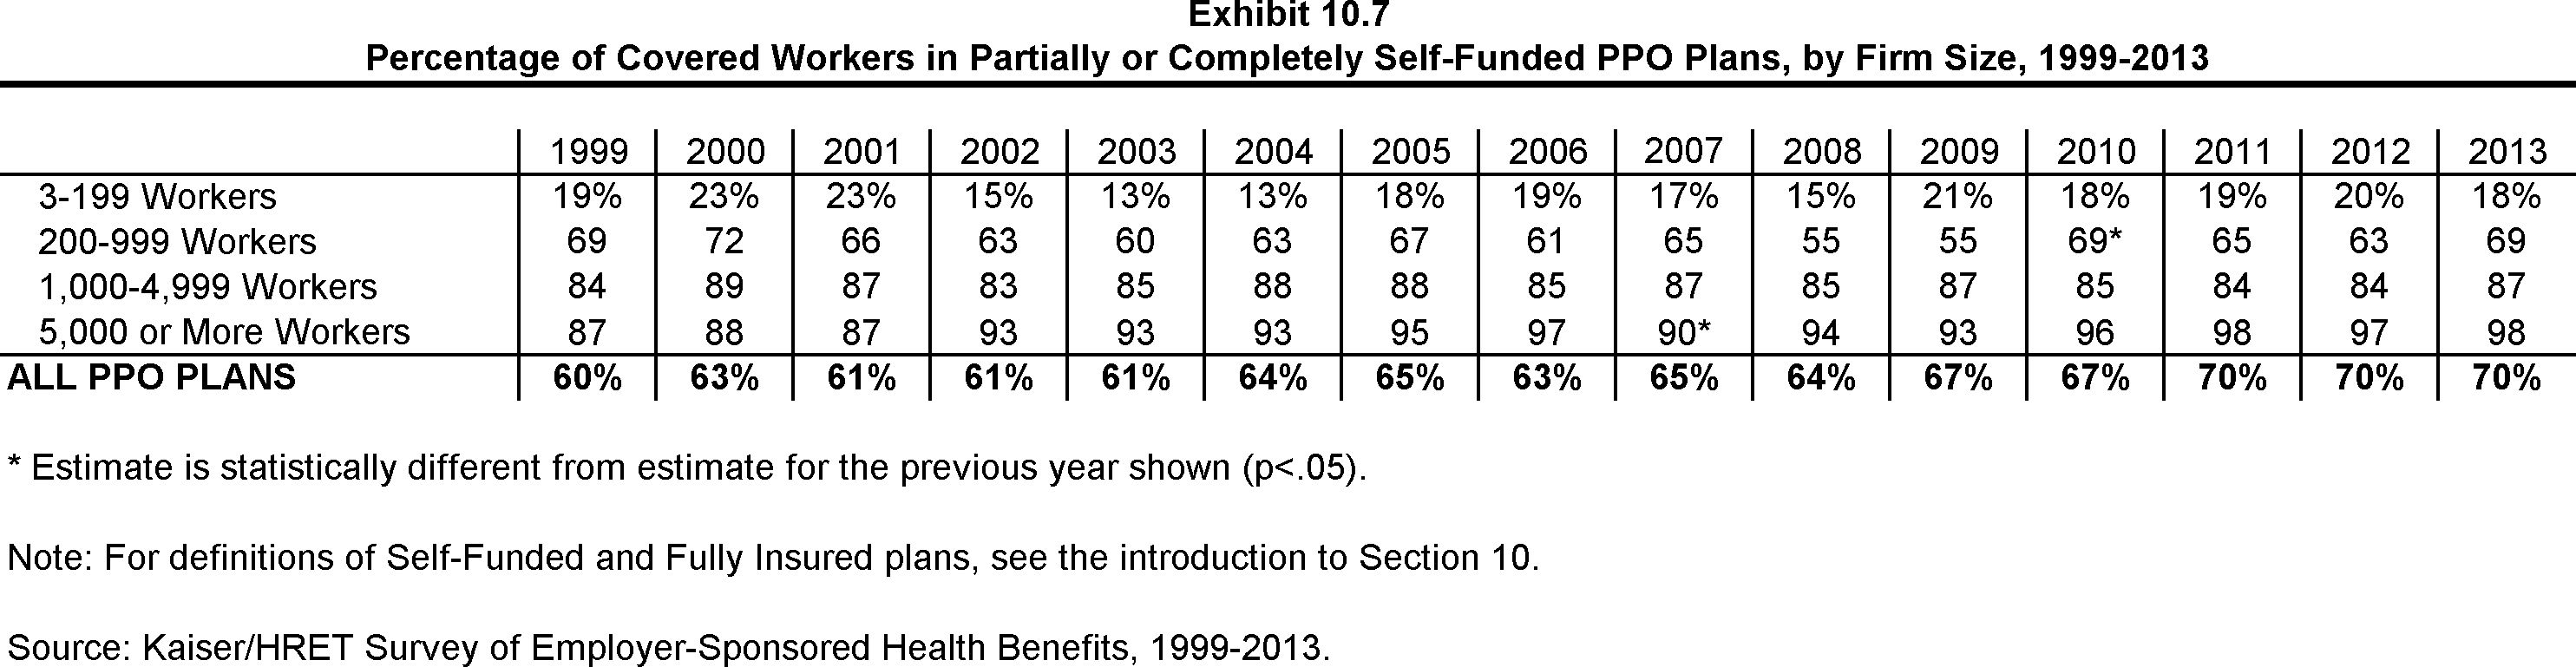
Percentage of Covered Workers in Partially or Completely Self-Funded PPO Plans, by Firm Size, 1999-2013
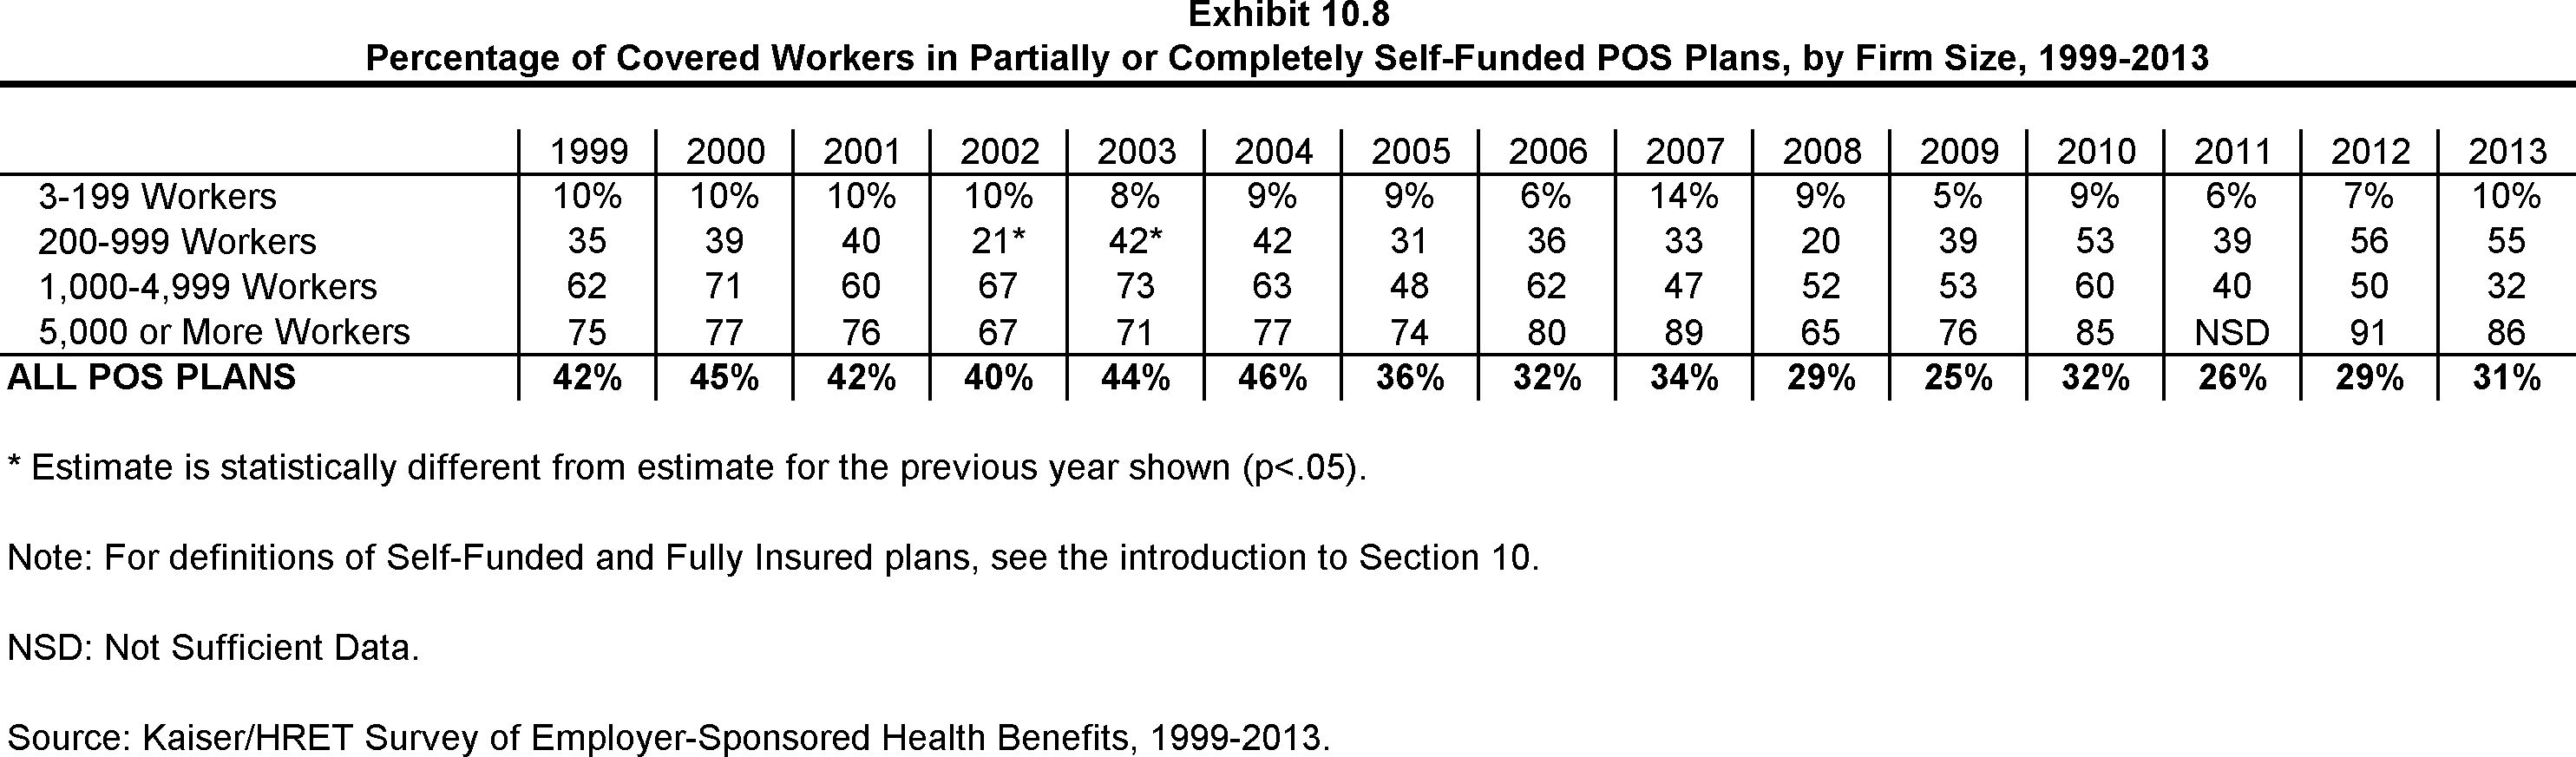
Percentage of Covered Workers in Partially or Completely Self-Funded POS Plans, by Firm Size, 1999-2013
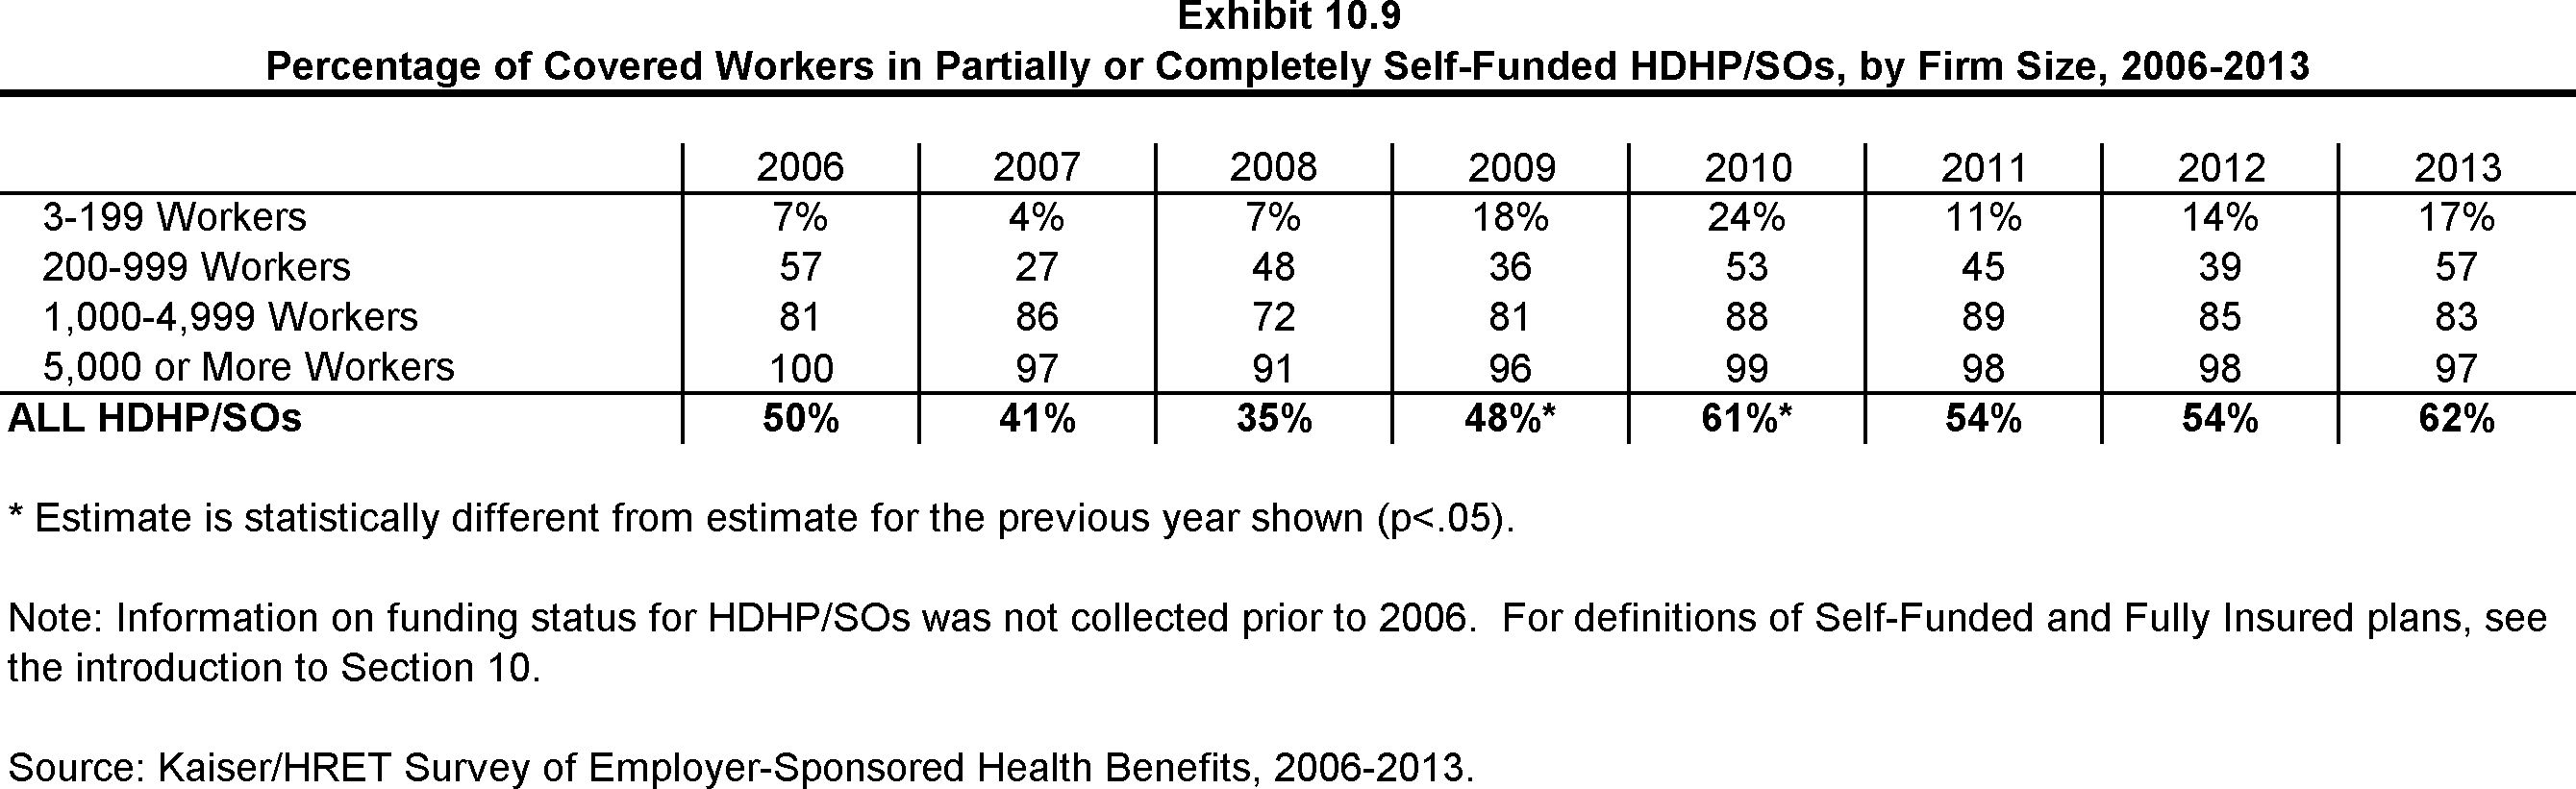
Percentage of Covered Workers in Partially or Completely Self-Funded HDHP/SOs, by Firm Size, 2006-2013
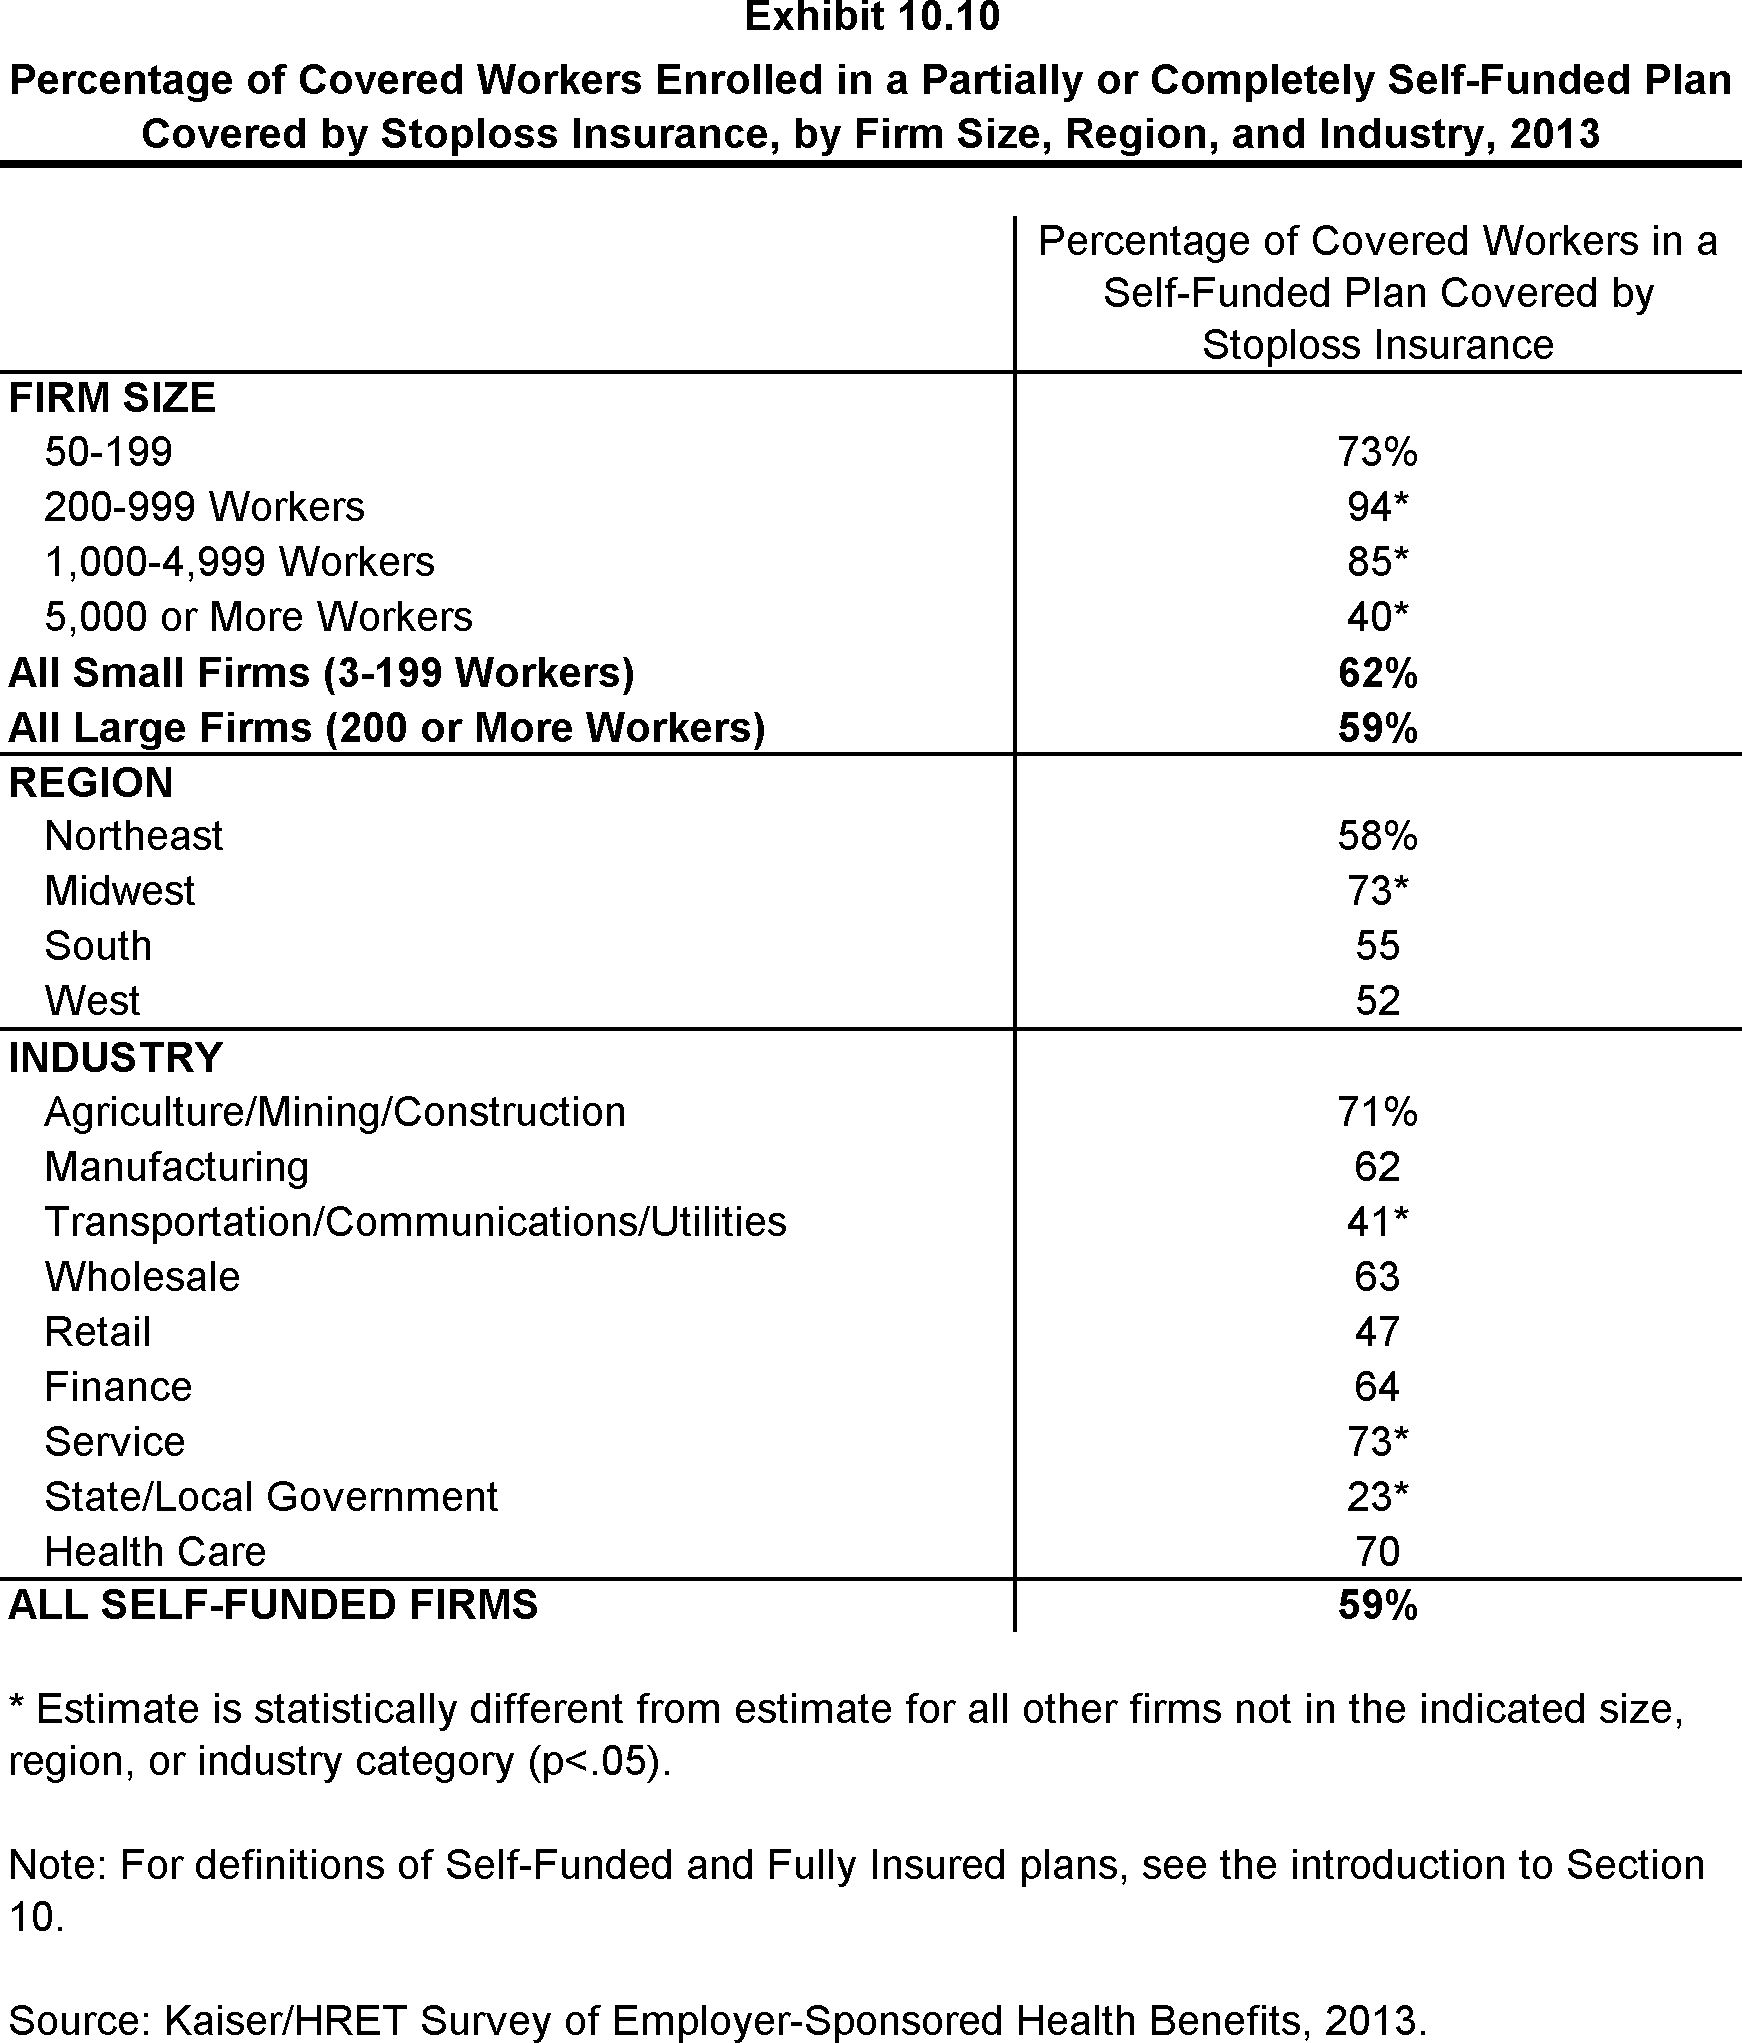
Percentage of Covered Workers Enrolled in a Partially or Completely Self-Funded Plan Covered by Stoploss Insurance, by Firm Size, Region, and Industry, 2013
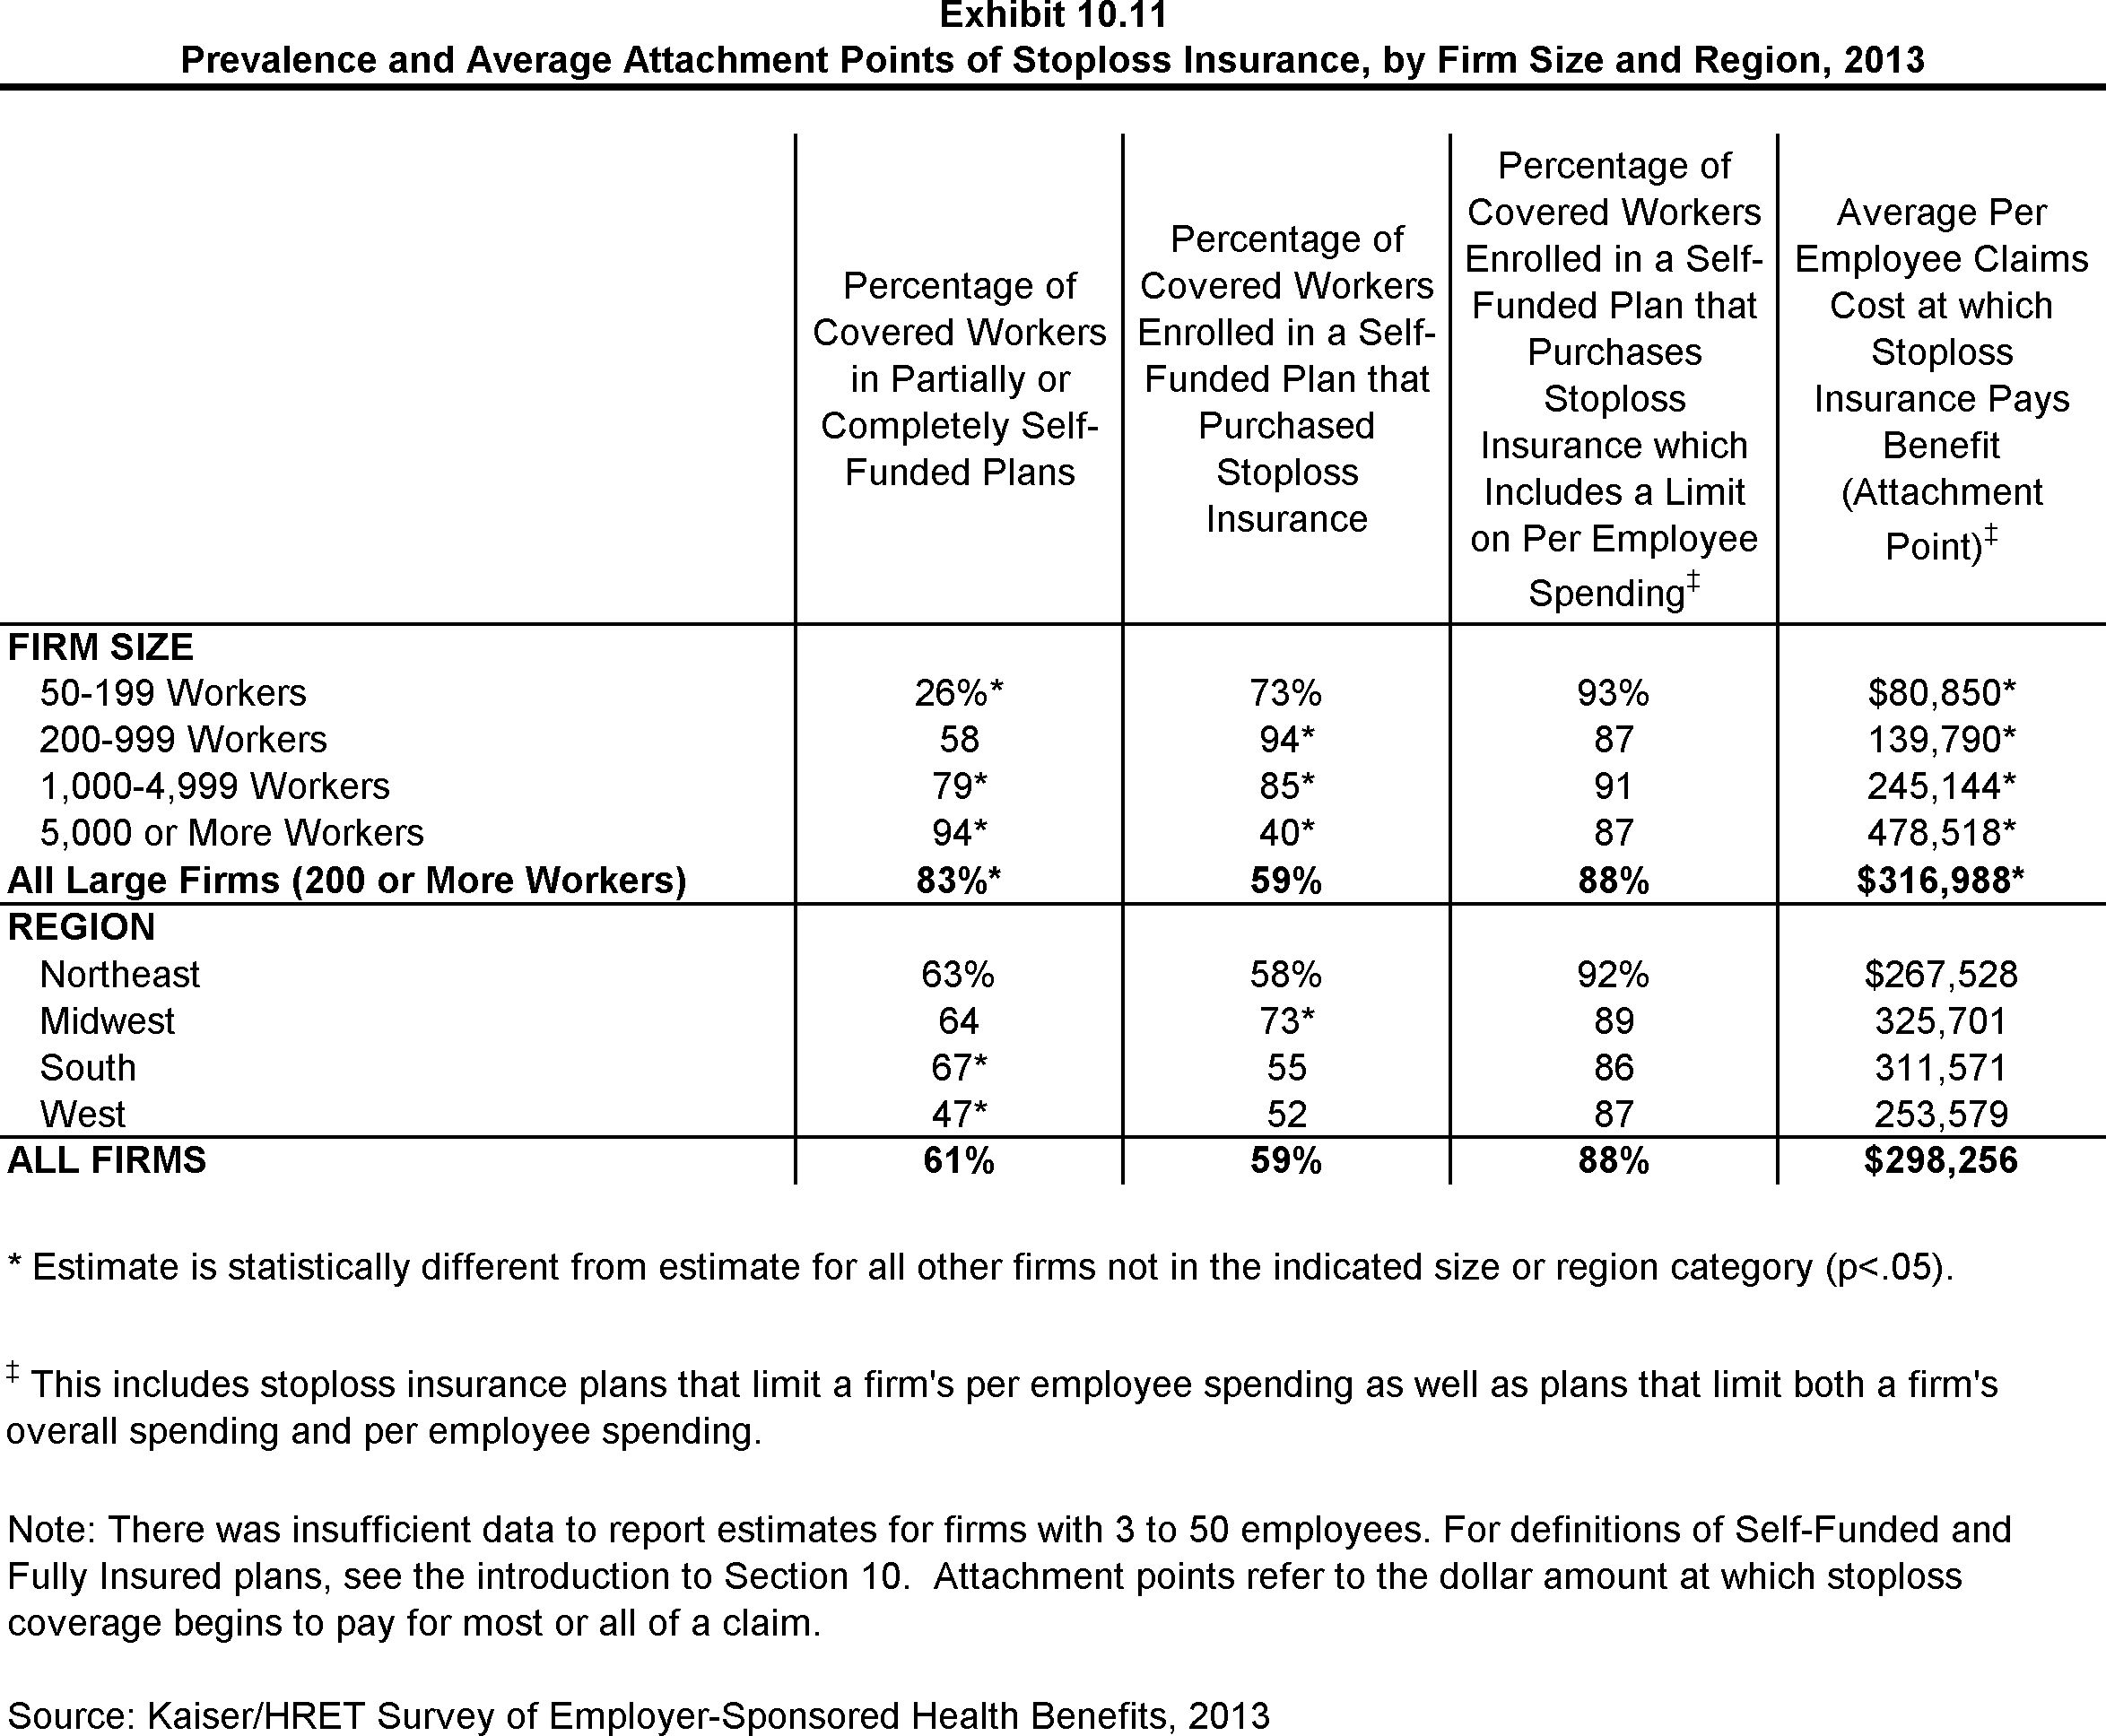
Prevalence and Average Attachment Points of Stoploss Insurance, by Firm Size and Region, 2013
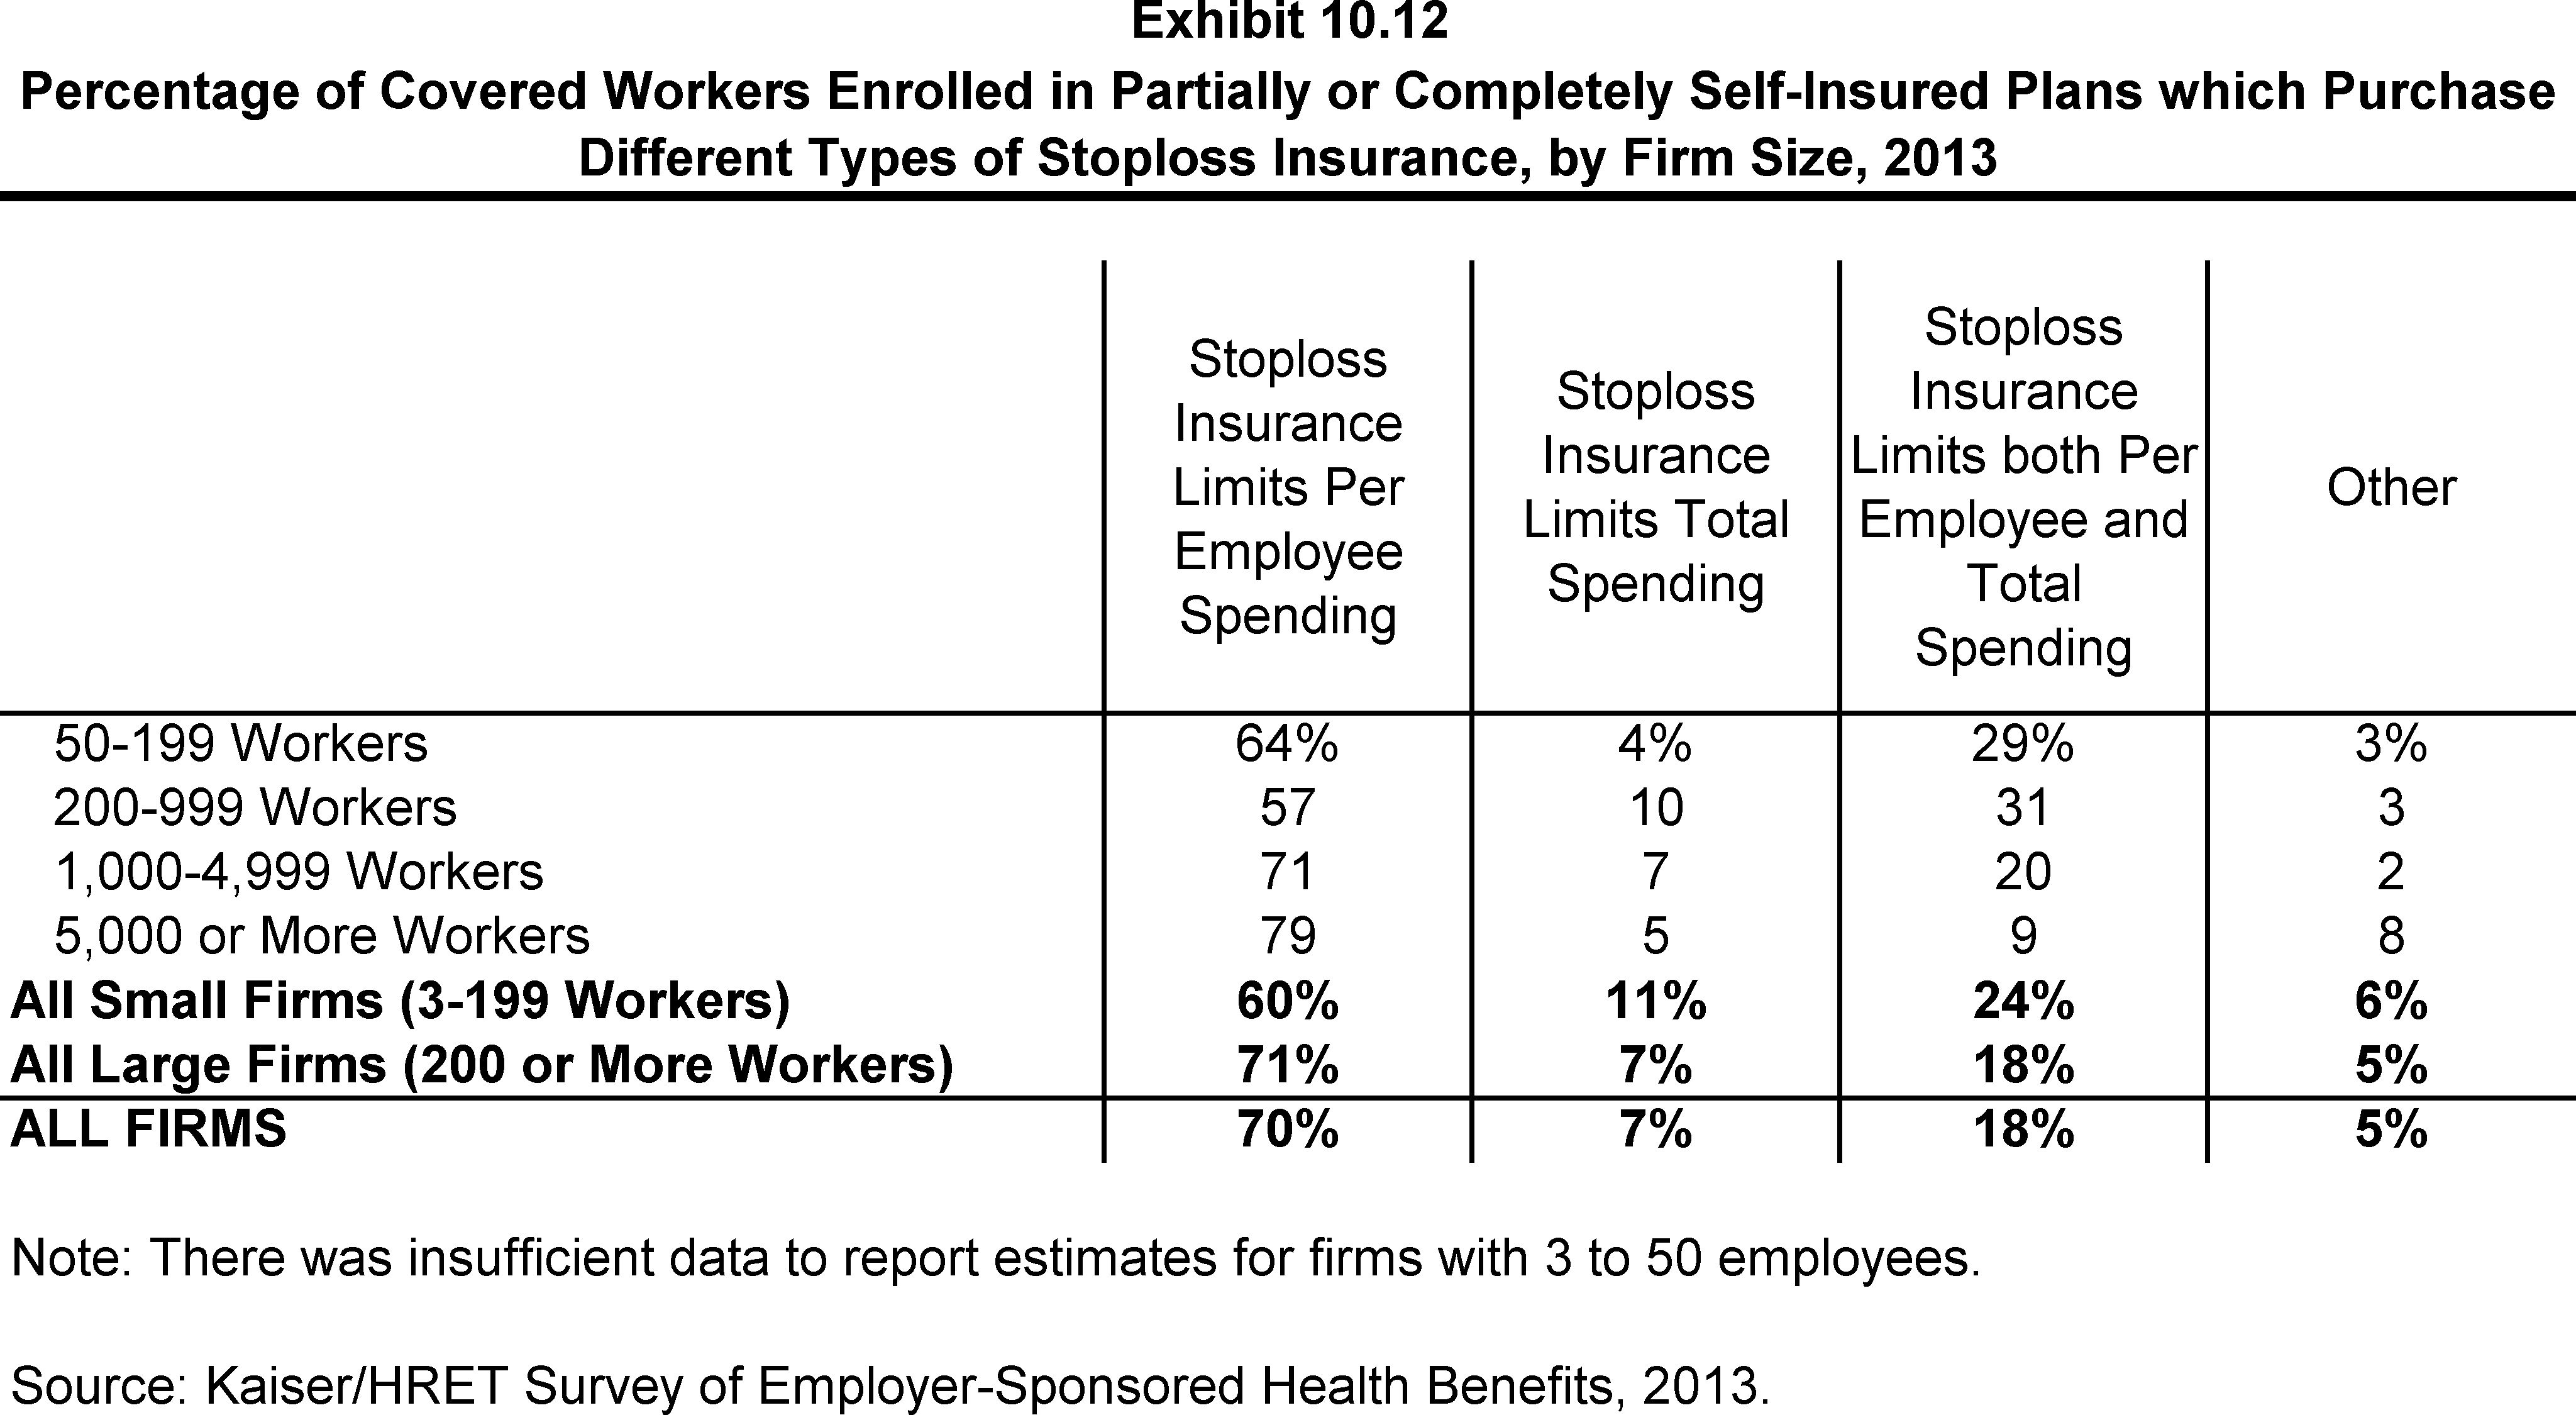
Percentage of Covered Workers Enrolled in Partially or Completely Self-Insured Plans which Purchase Different Types of Stoploss Insurance, by Firm Size, 2013
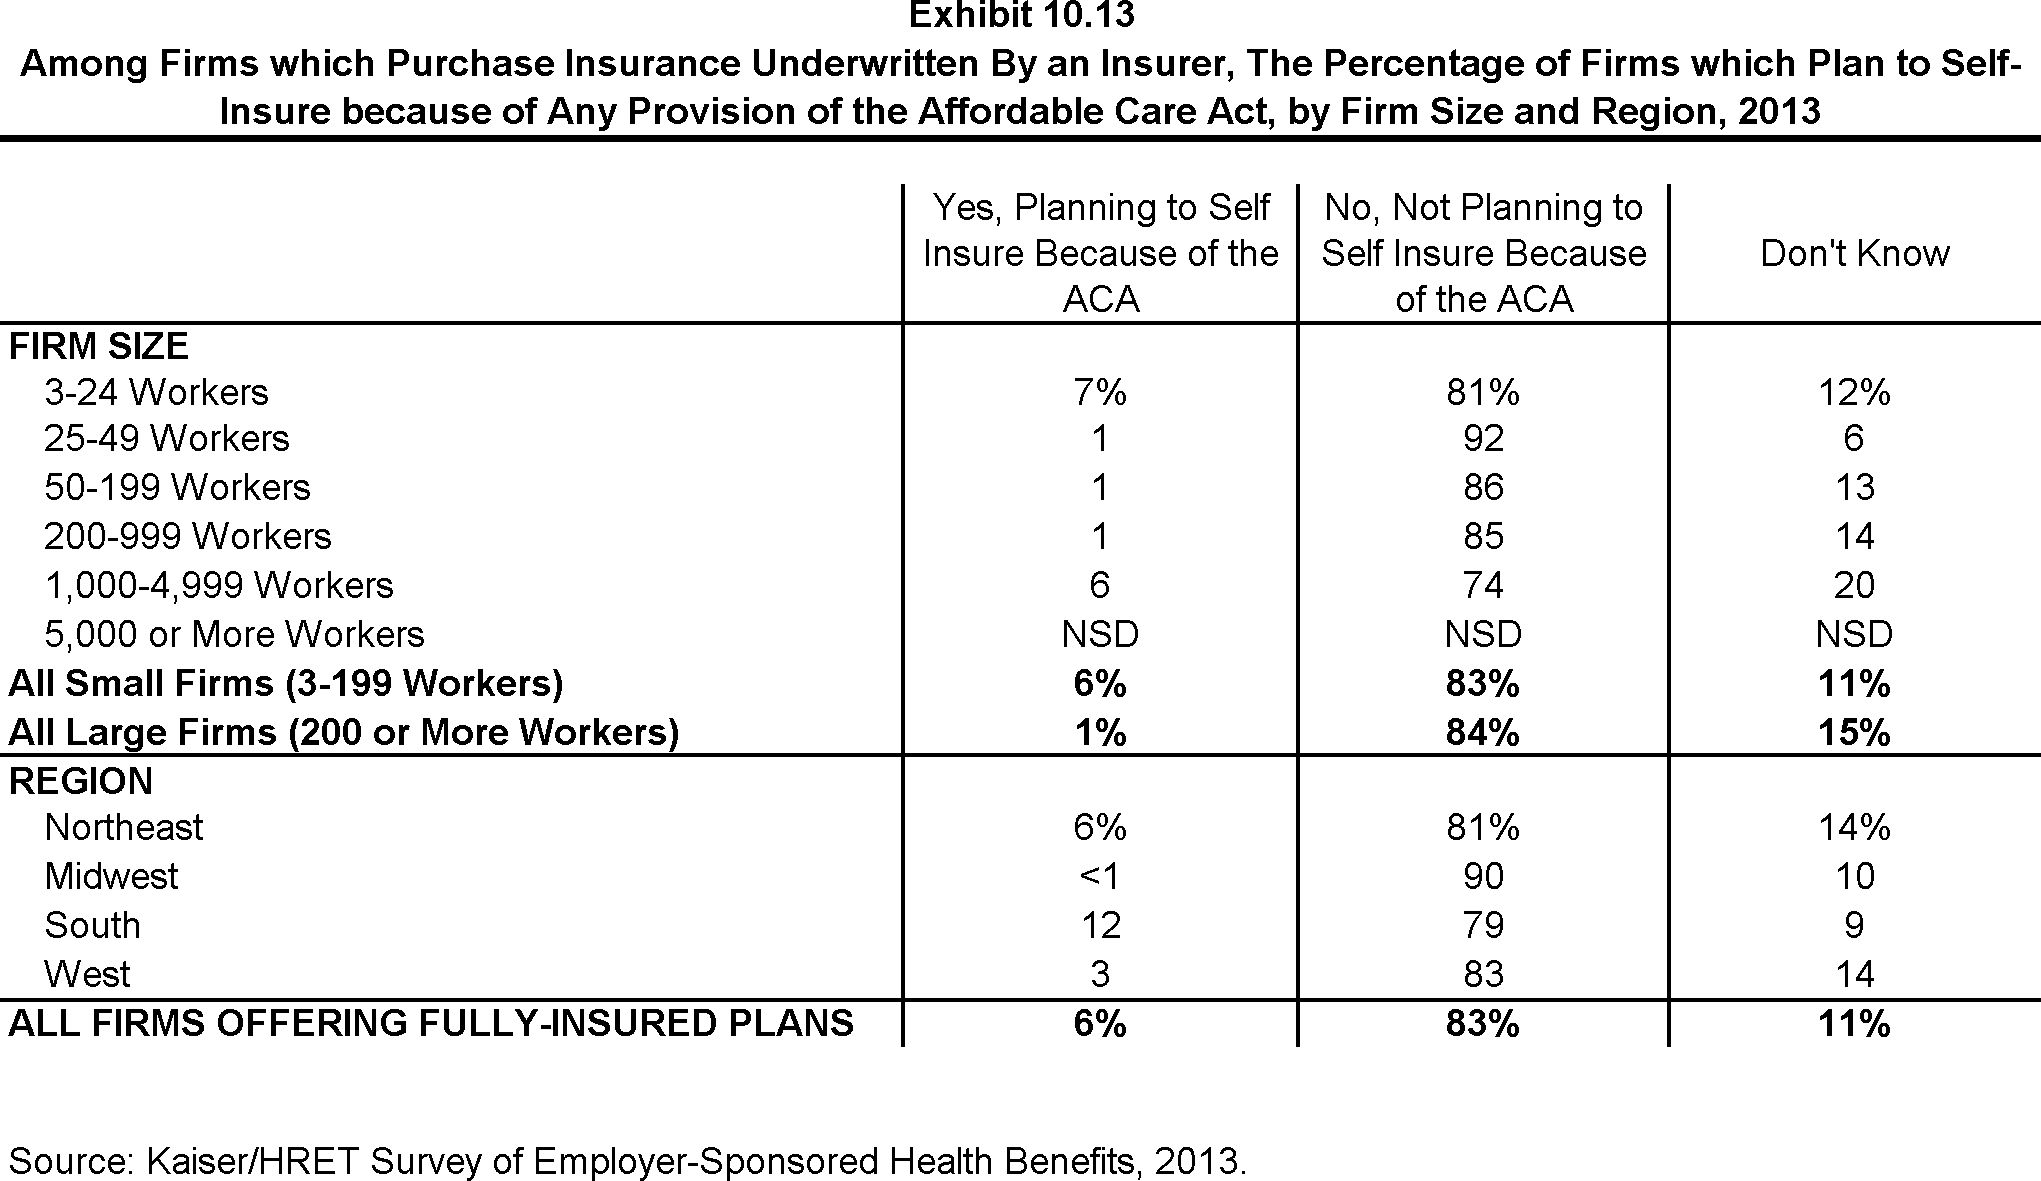
Among Firms which Purchase Insurance Underwritten By an Insurer, The Percentage of Firms which Plan to Self-Insure because of Any Provision of the Affordable Care Act, by Firm Size and Region, 2013
Section Eleven: Retiree Health Benefits
Retiree health benefits are an important consideration for older workers making decisions about their retirement. Health benefits for retirees provide an important supplement to Medicare for retirees age 65 or older. Among firms offering health benefits to their workers, large firms (200 or more workers) are much more likely than small firms (3-199 workers) to offer retiree health benefits to at least some of their former employees.
- Twenty-eight percent of large firms (200 or more workers) that offer health benefits to their employees offer retiree coverage in 2013, similar to 25% in 2012. There has been a downward trend in the percentage of firms offering retirees coverage, from 34% in 2006 and 66% in 1988 (Exhibit 11.1).
- The offering of retiree health benefits varies considerably by firm characteristics.
- Large firms are much more likely to offer retiree health benefits than small firms – 28% vs. 5% (Exhibit 11.2).
- Among large firms that offer health benefits, state and local governments (78%) and firms in the finance (52%) industry are more likely than large firms in other industries to offer retiree health benefits. In contrast, large firms in the wholesale industry are less likely (6%) to offer retiree health benefits when compared to large firms in other industries (Exhibit 11.2).
- Large firms with fewer lower-wage workers (less than 35% of workers earn $23,000 or less annually) are more likely to offer retiree health benefits than large firms with many lower-wage workers (35% or more of workers earn $23,000 or less annually) (32% vs. 6%). A comparable pattern exists in firms with a larger proportion of higher-wage workers (35% or more earn $56,000 or more annually) (Exhibit 11.3).
- Large firms with union workers are more likely to offer retiree health benefits than large firms without union workers – 45% vs. 22% (Exhibit 11.3).
- Large, publicly owned employers are more likely to offer retiree benefits than large private for-profits firms or private not-for-profits employers. (61% vs. 24% and 20%, respectively) (Exhibit 11.3).
- Among all large firms (200 or more workers) offering retiree health benefits, most firms offer them to early retirees under the age of 65 (90%). A lower percentage (67%) of large firms offering retiree health benefits offer them to Medicare-age retirees (Exhibit 11.4). These percentages are similar to 2012 and have remained stable over time.
- Among all large firms (200 or more workers) offering retiree health benefits, 4% offer coverage which exclusively covers prescription drugs (Exhibit 11.6).
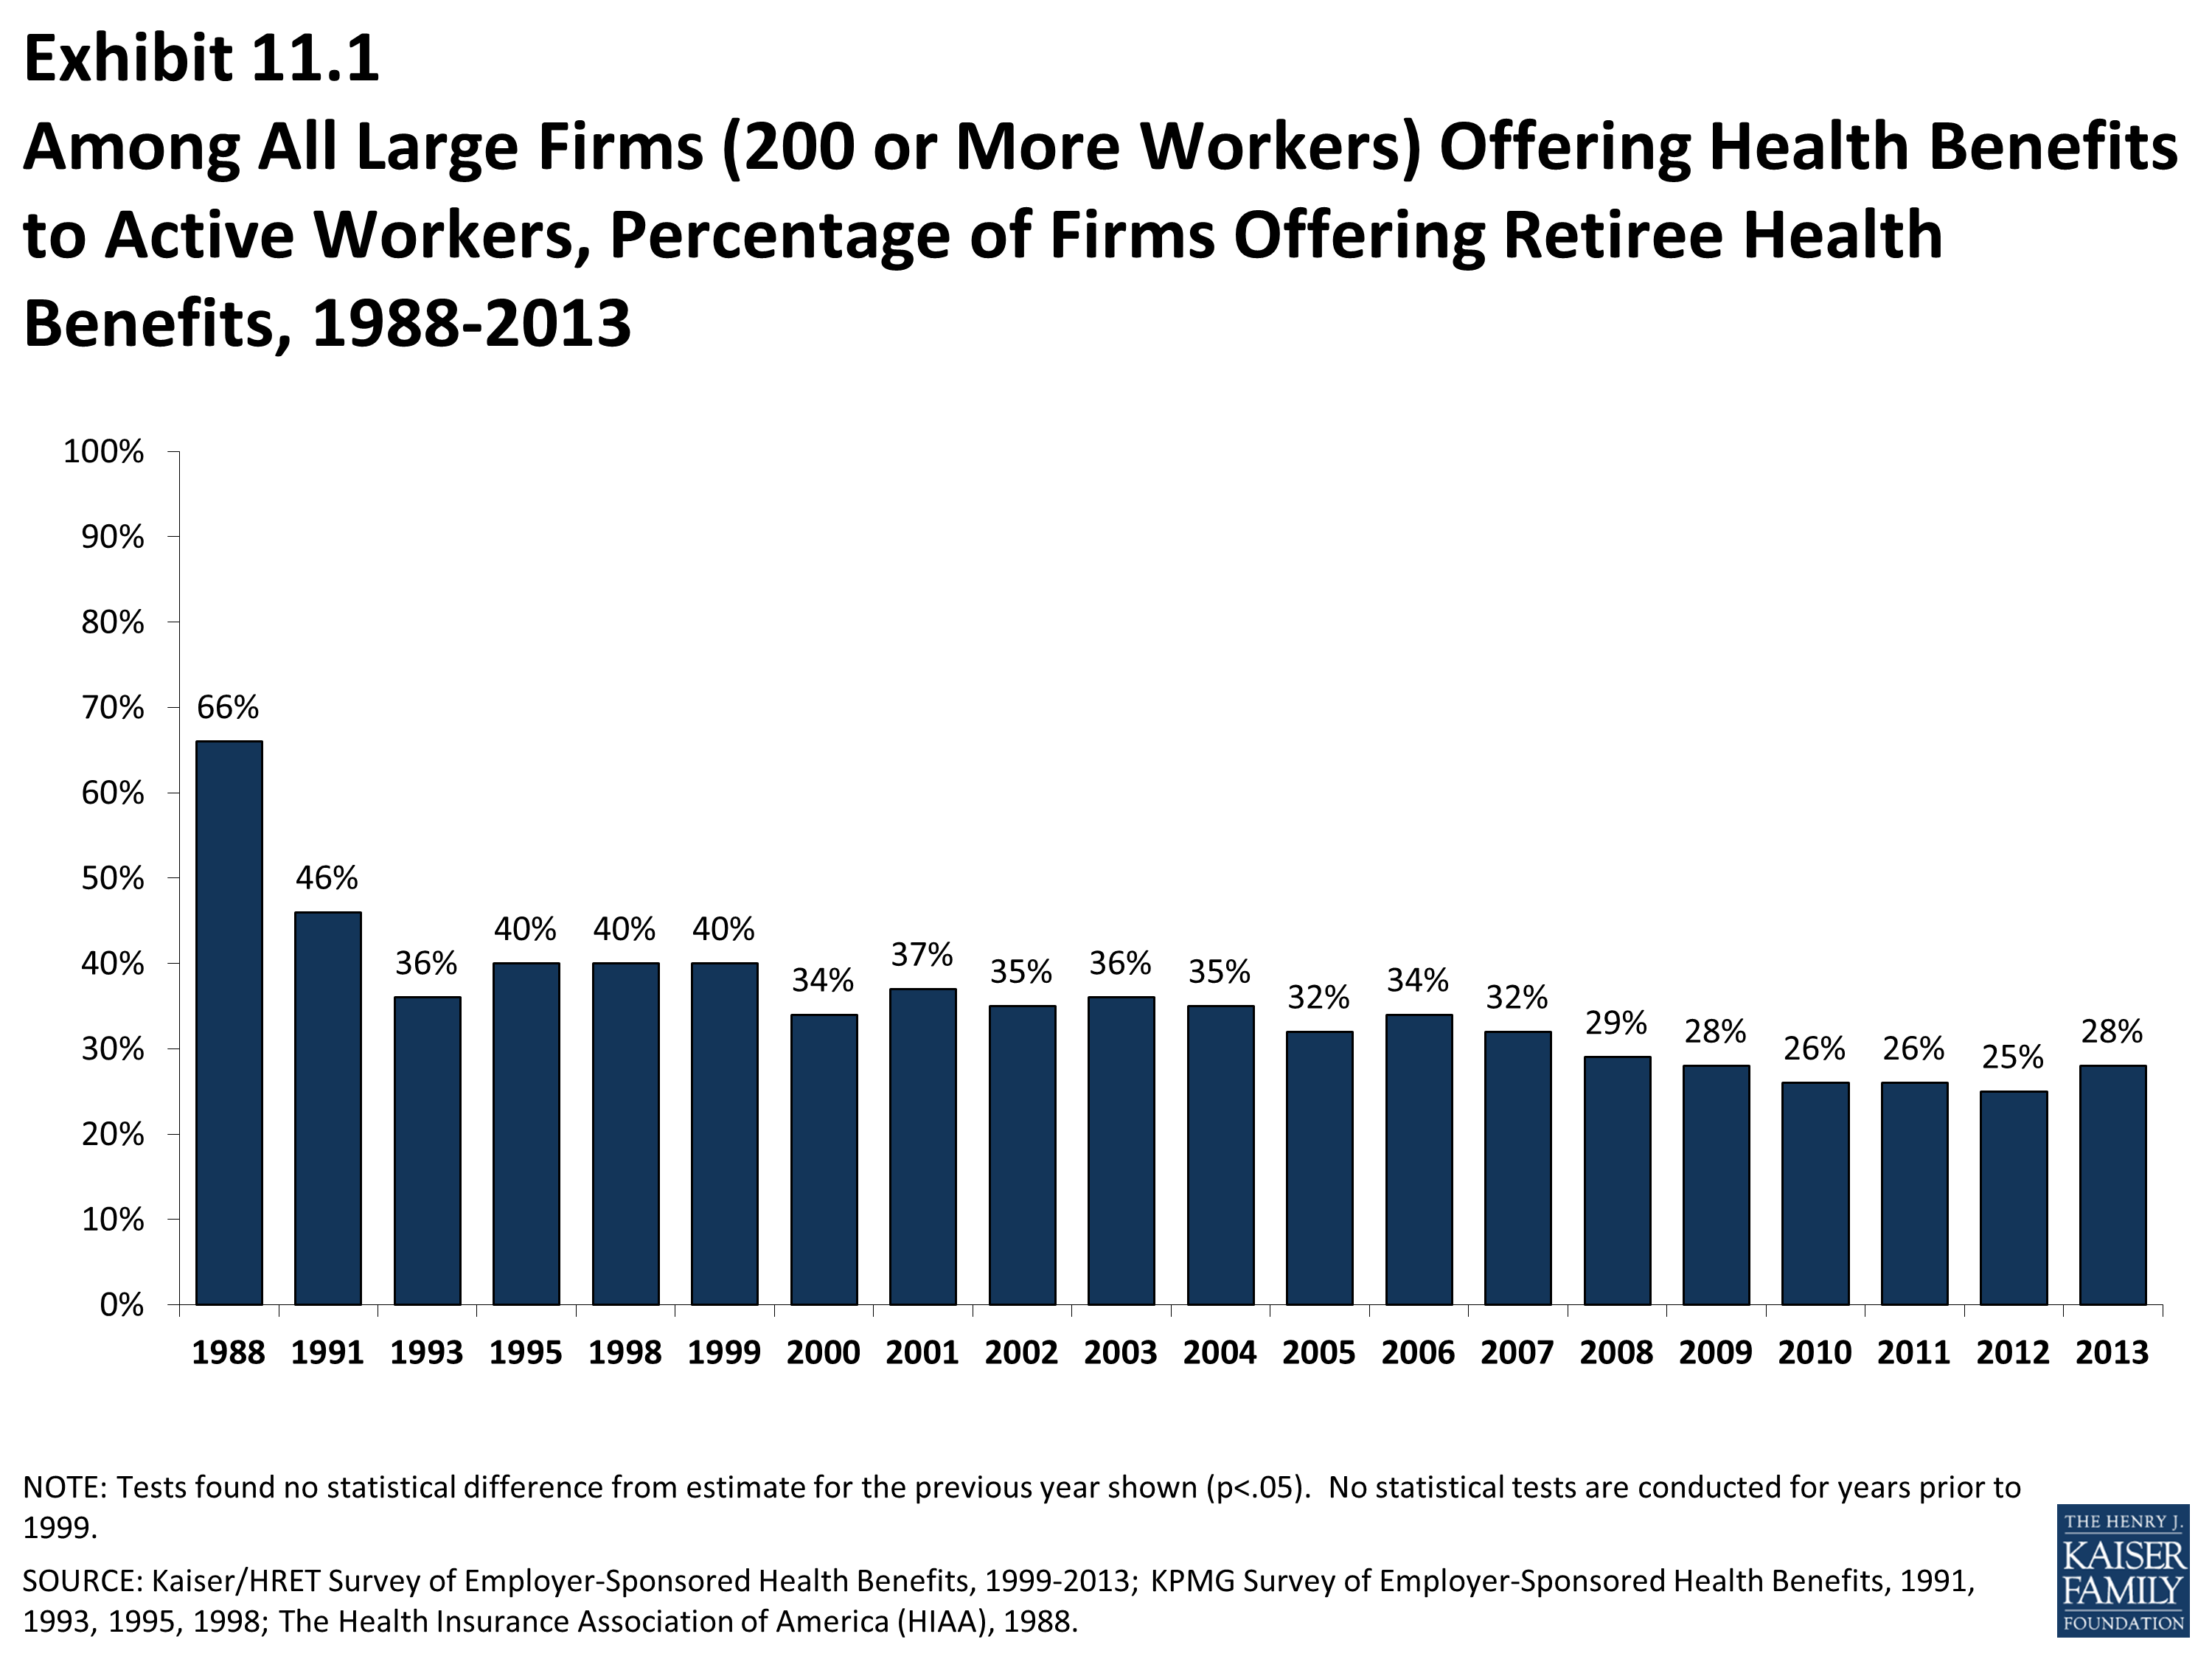
Among All Large Firms (200 or More Workers) Offering Health Benefits to Active Workers, Percentage of Firms Offering Retiree Health Benefits, 1988-2013
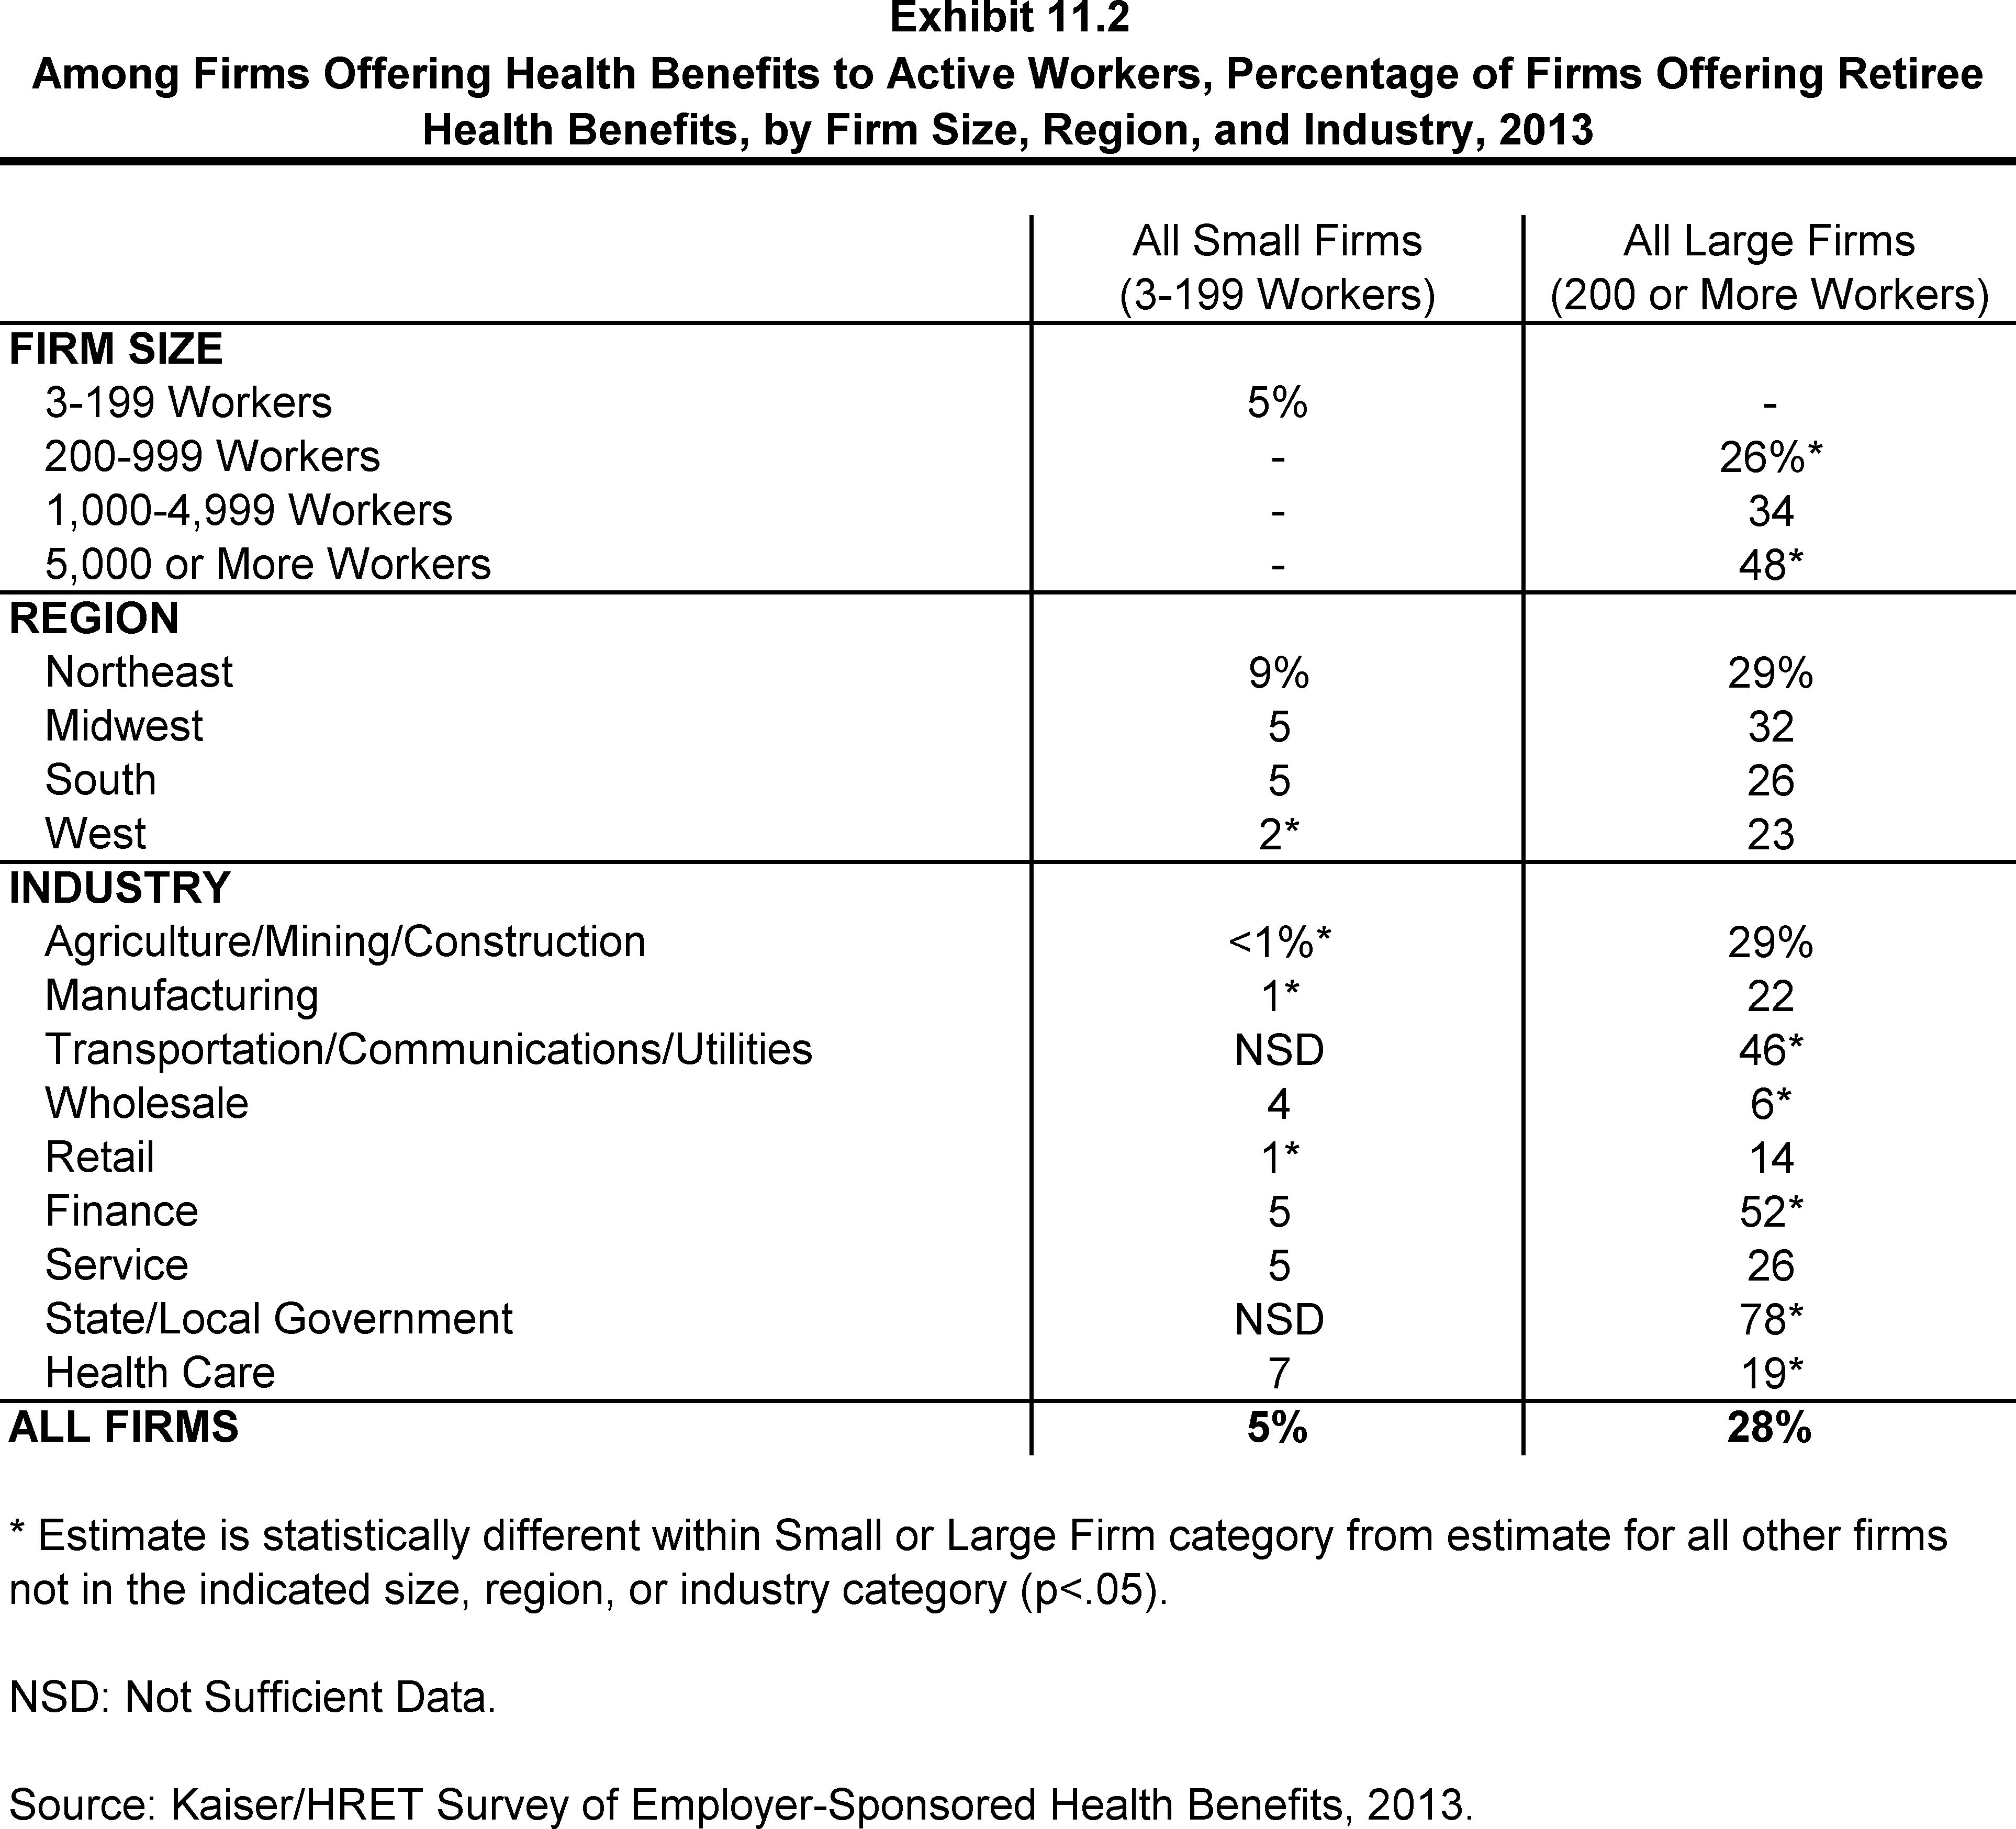
Among Firms Offering Health Benefits to Active Workers, Percentage of Firms Offering Retiree Health Benefits, by Firm Size, Region, and Industry, 2013
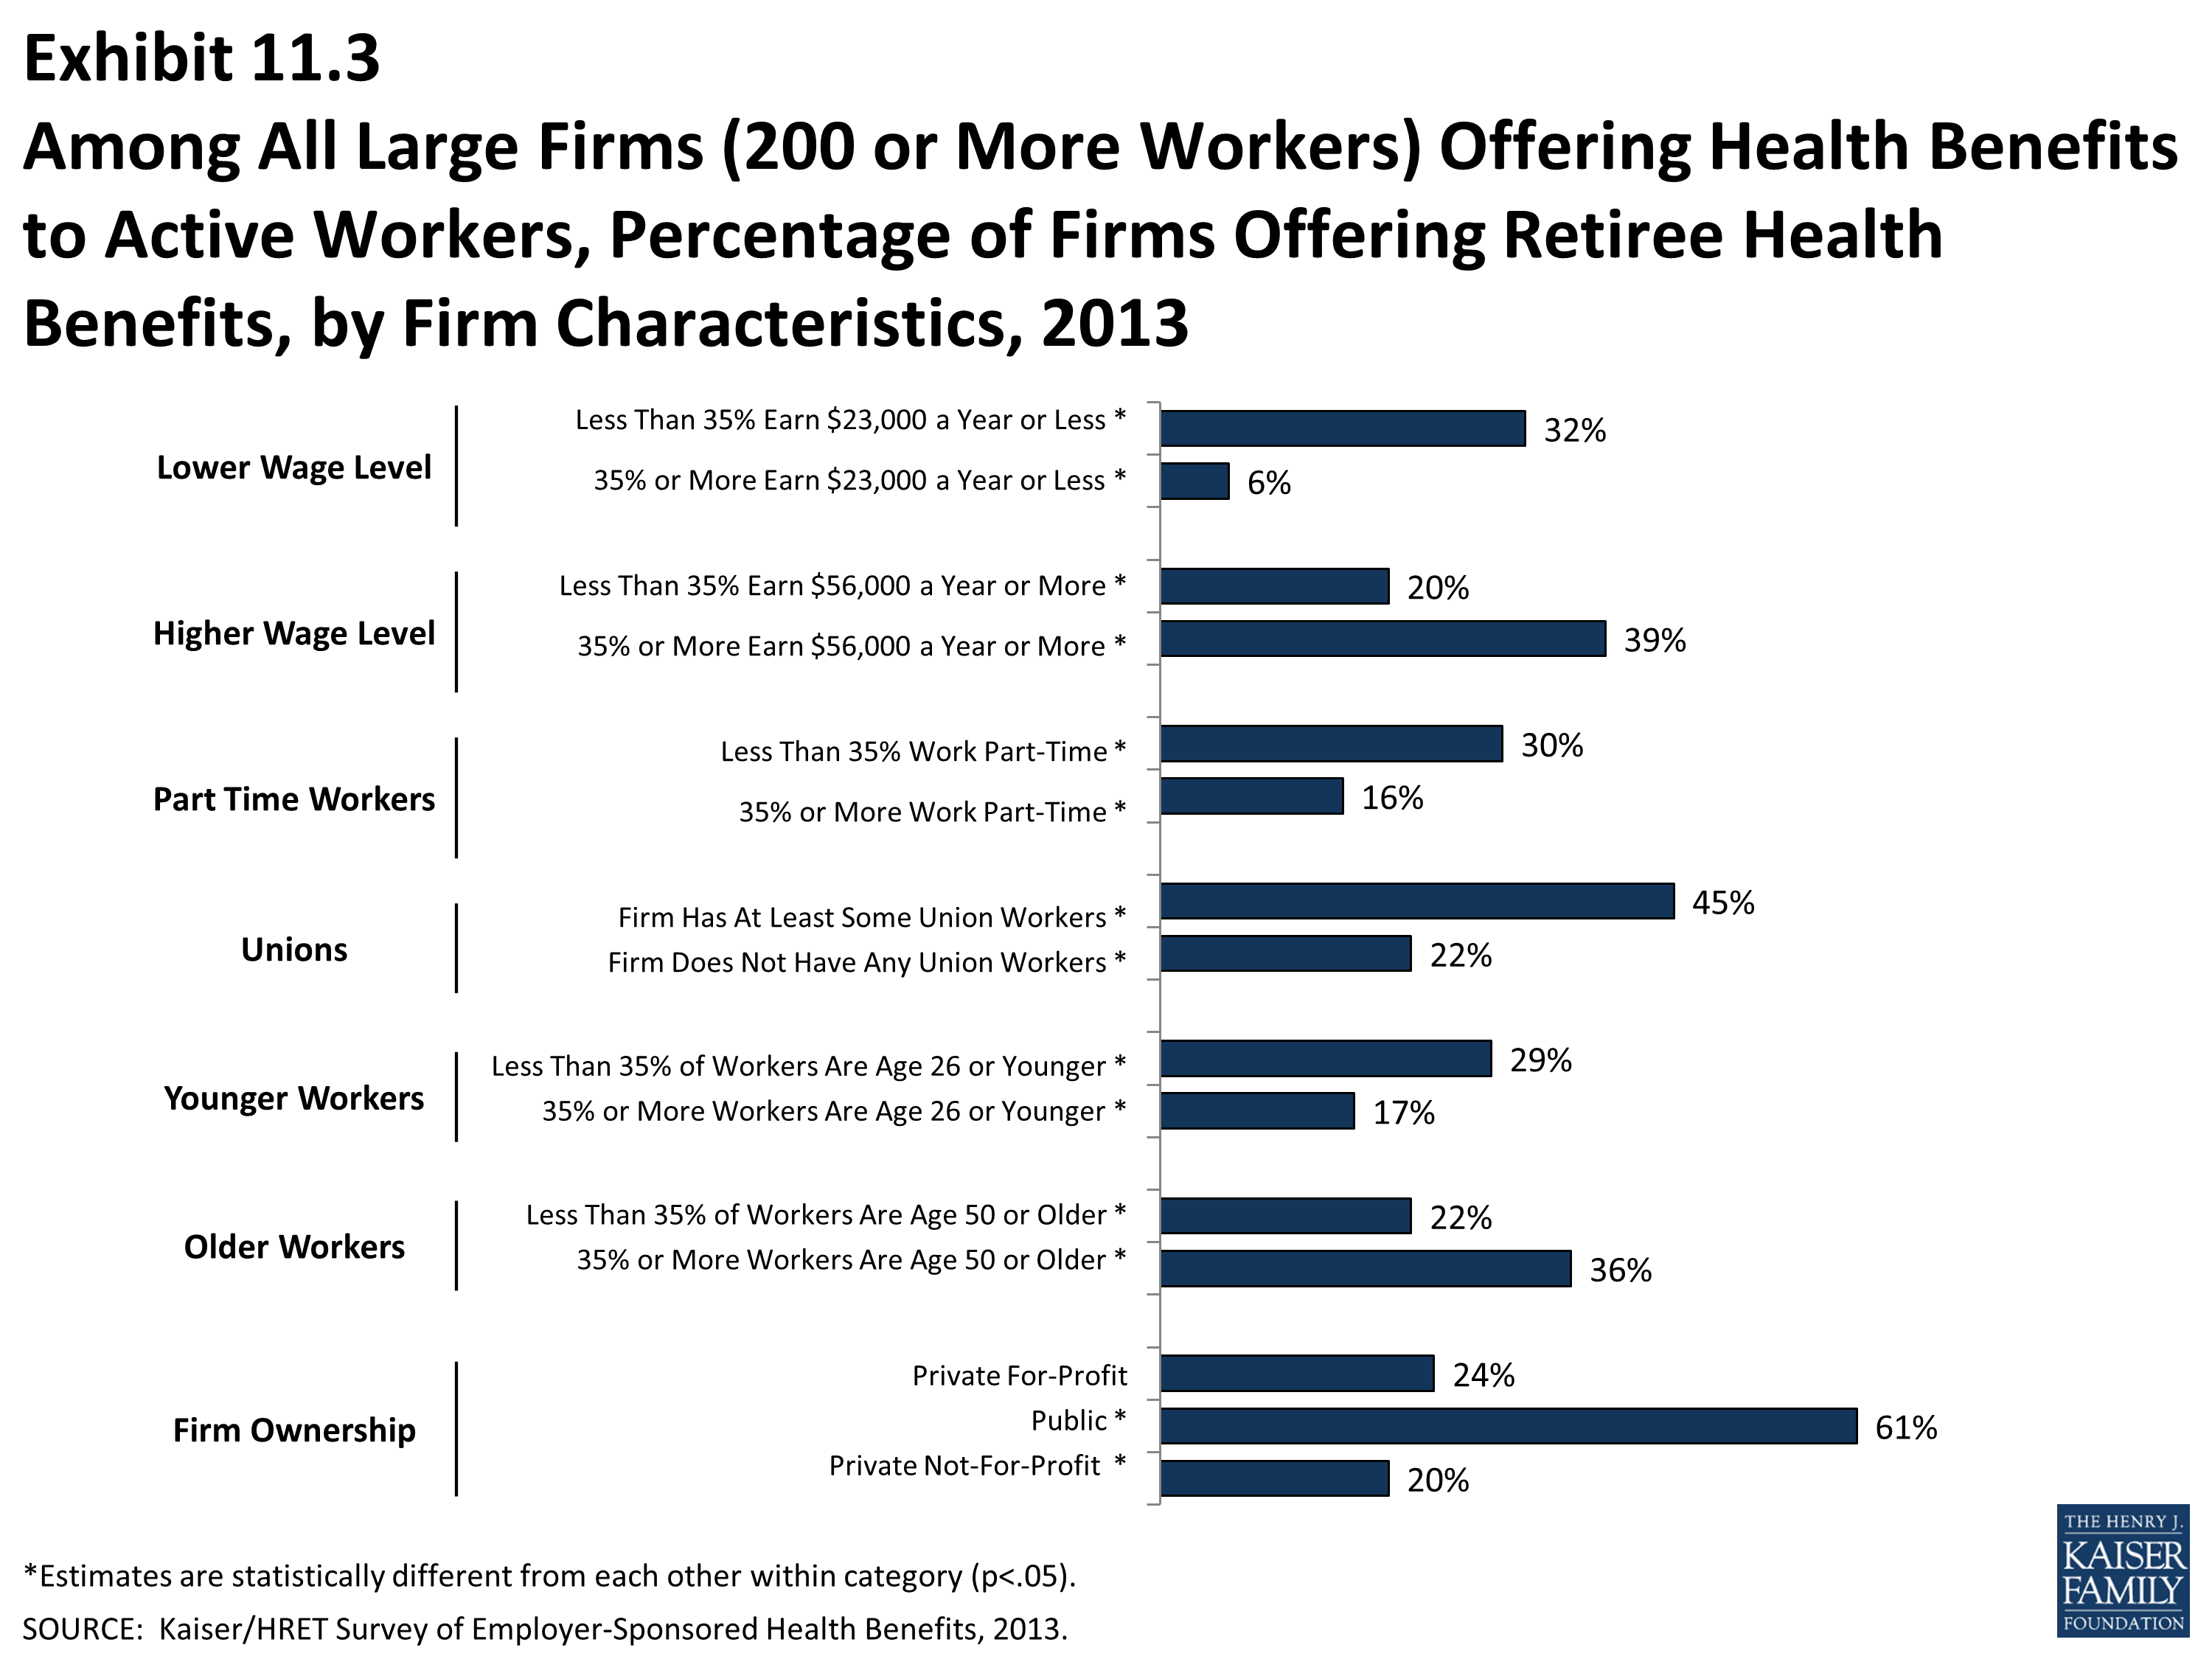
Among All Large Firms (200 or More Workers) Offering Health Benefits to Active Workers, Percentage of Firms Offering Retiree Health Benefits, by Firm Characteristics, 2013
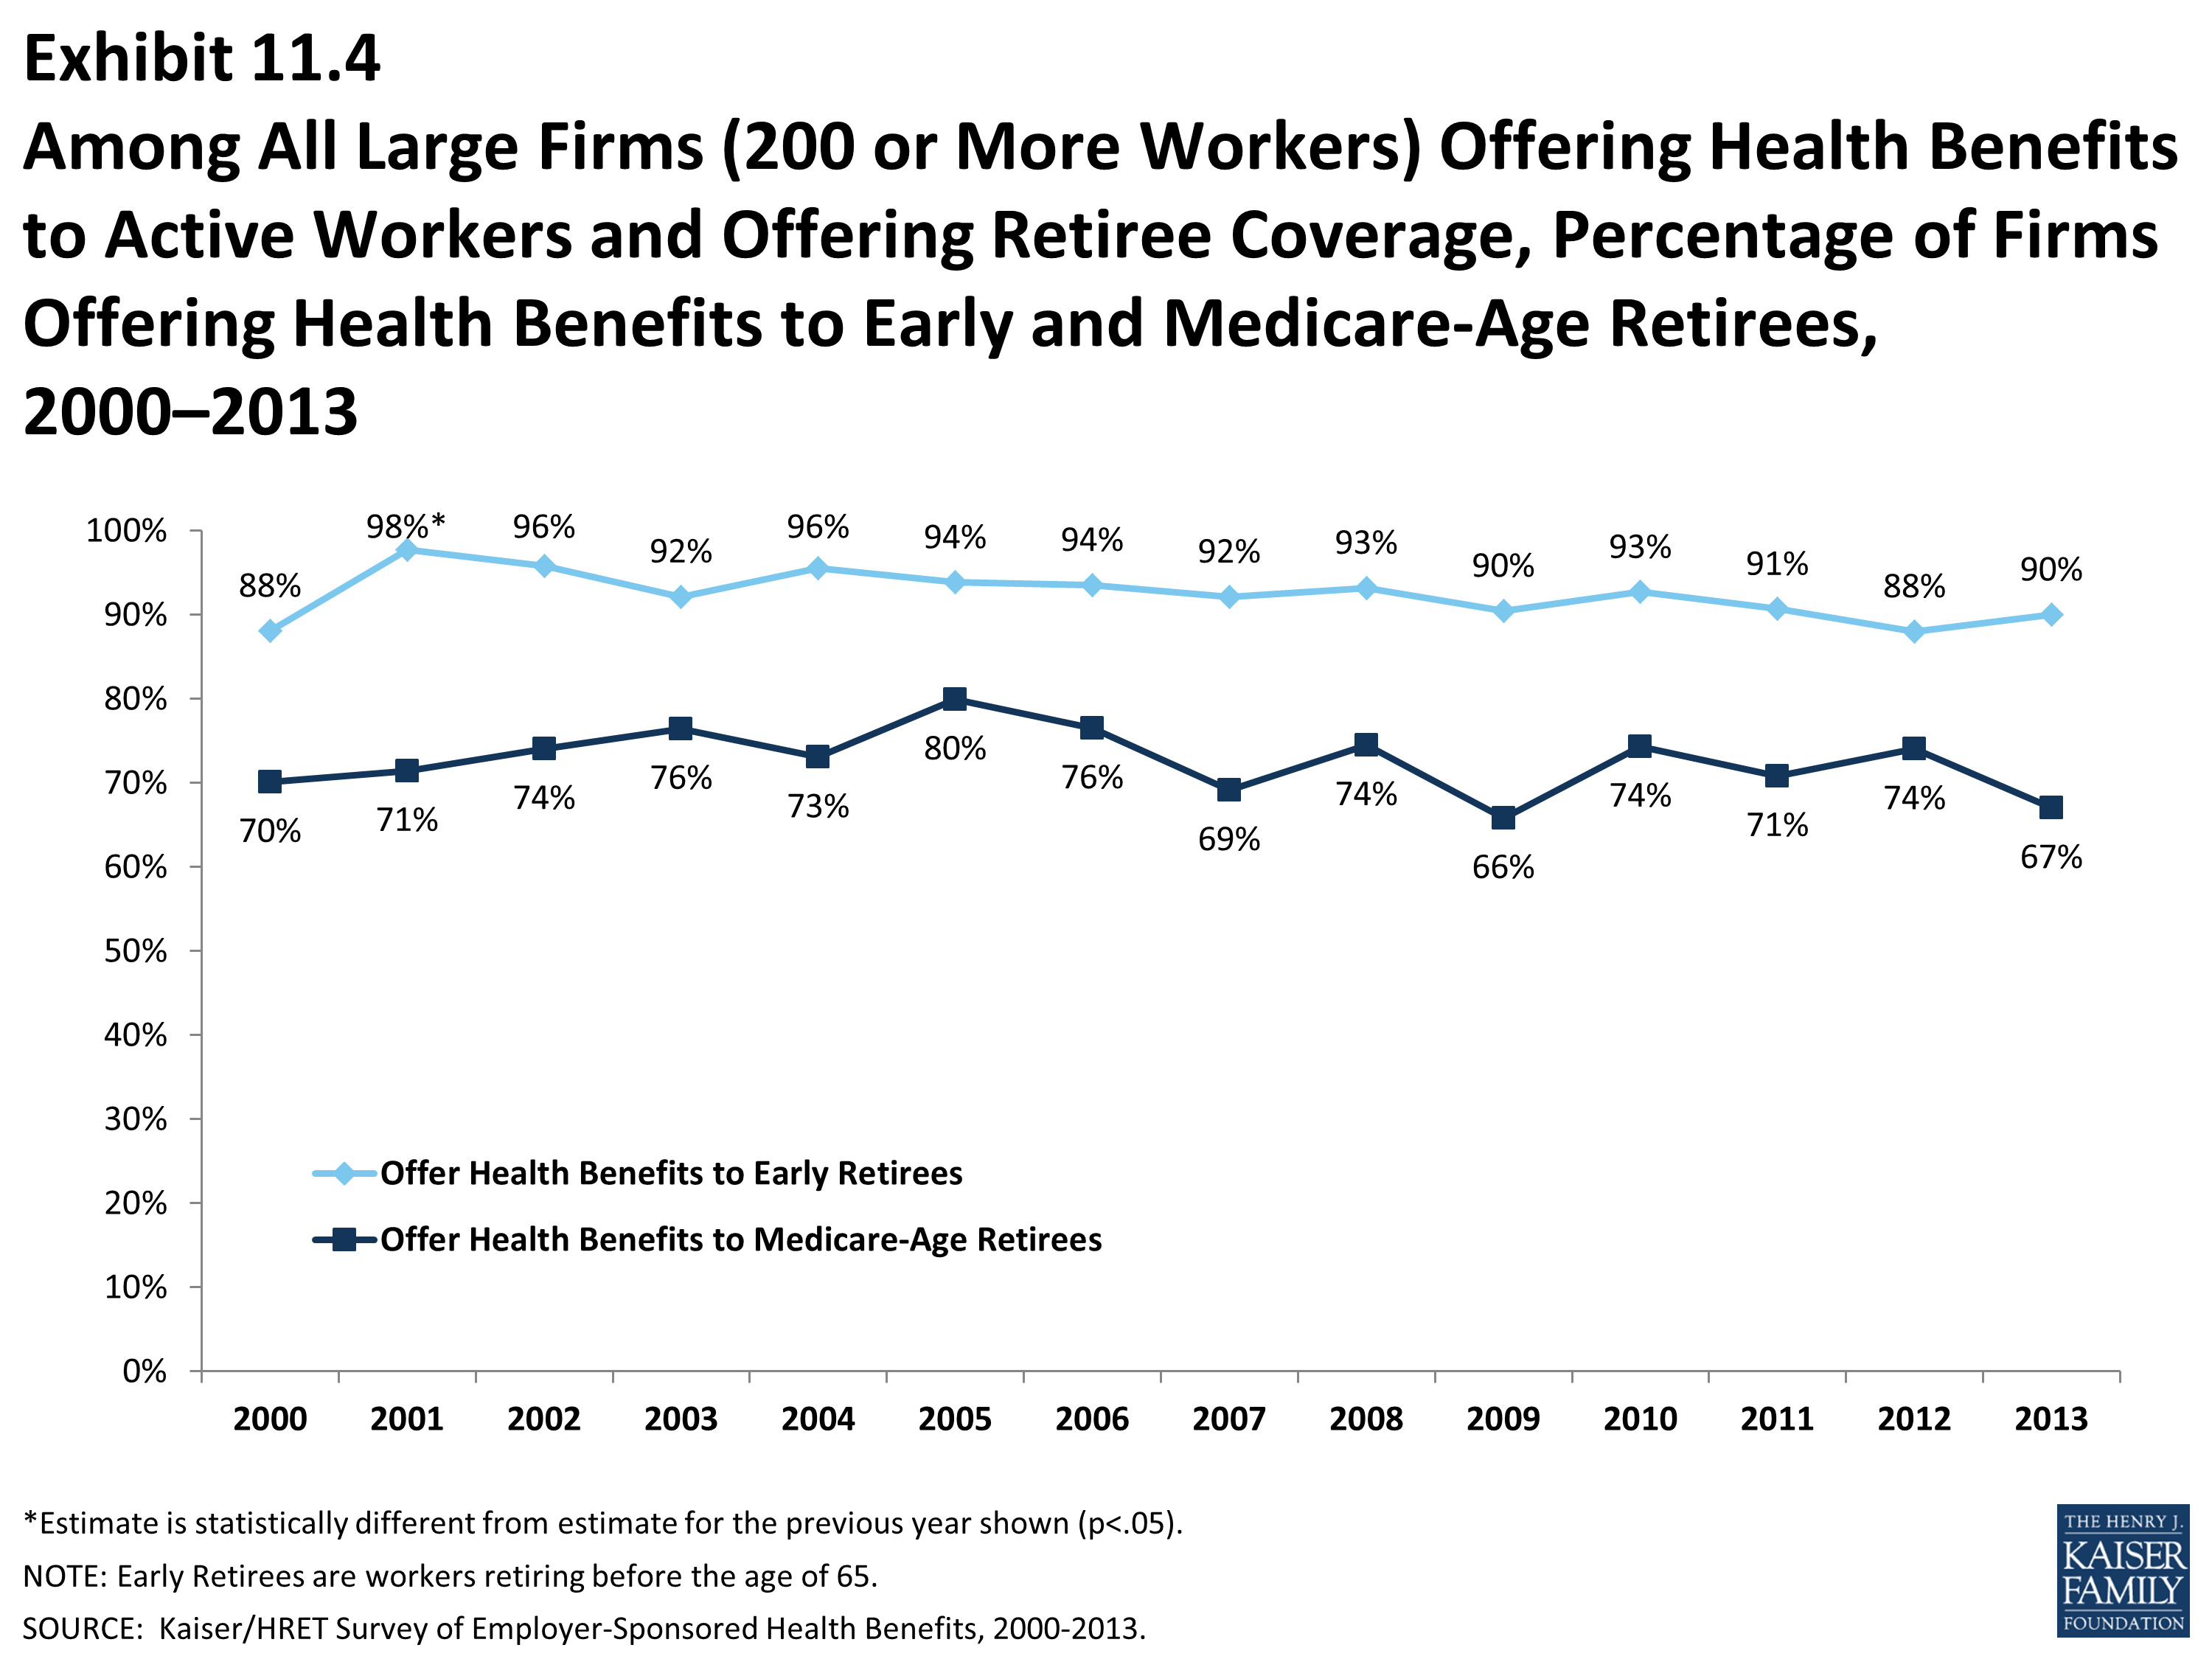
Among All Large Firms (200 or More Workers) Offering Health Benefits to Active Workers and Offering Retiree Coverage, Percentage of Firms Offering Health Benefits to Early and Medicare-Age Retirees, 2000-2013
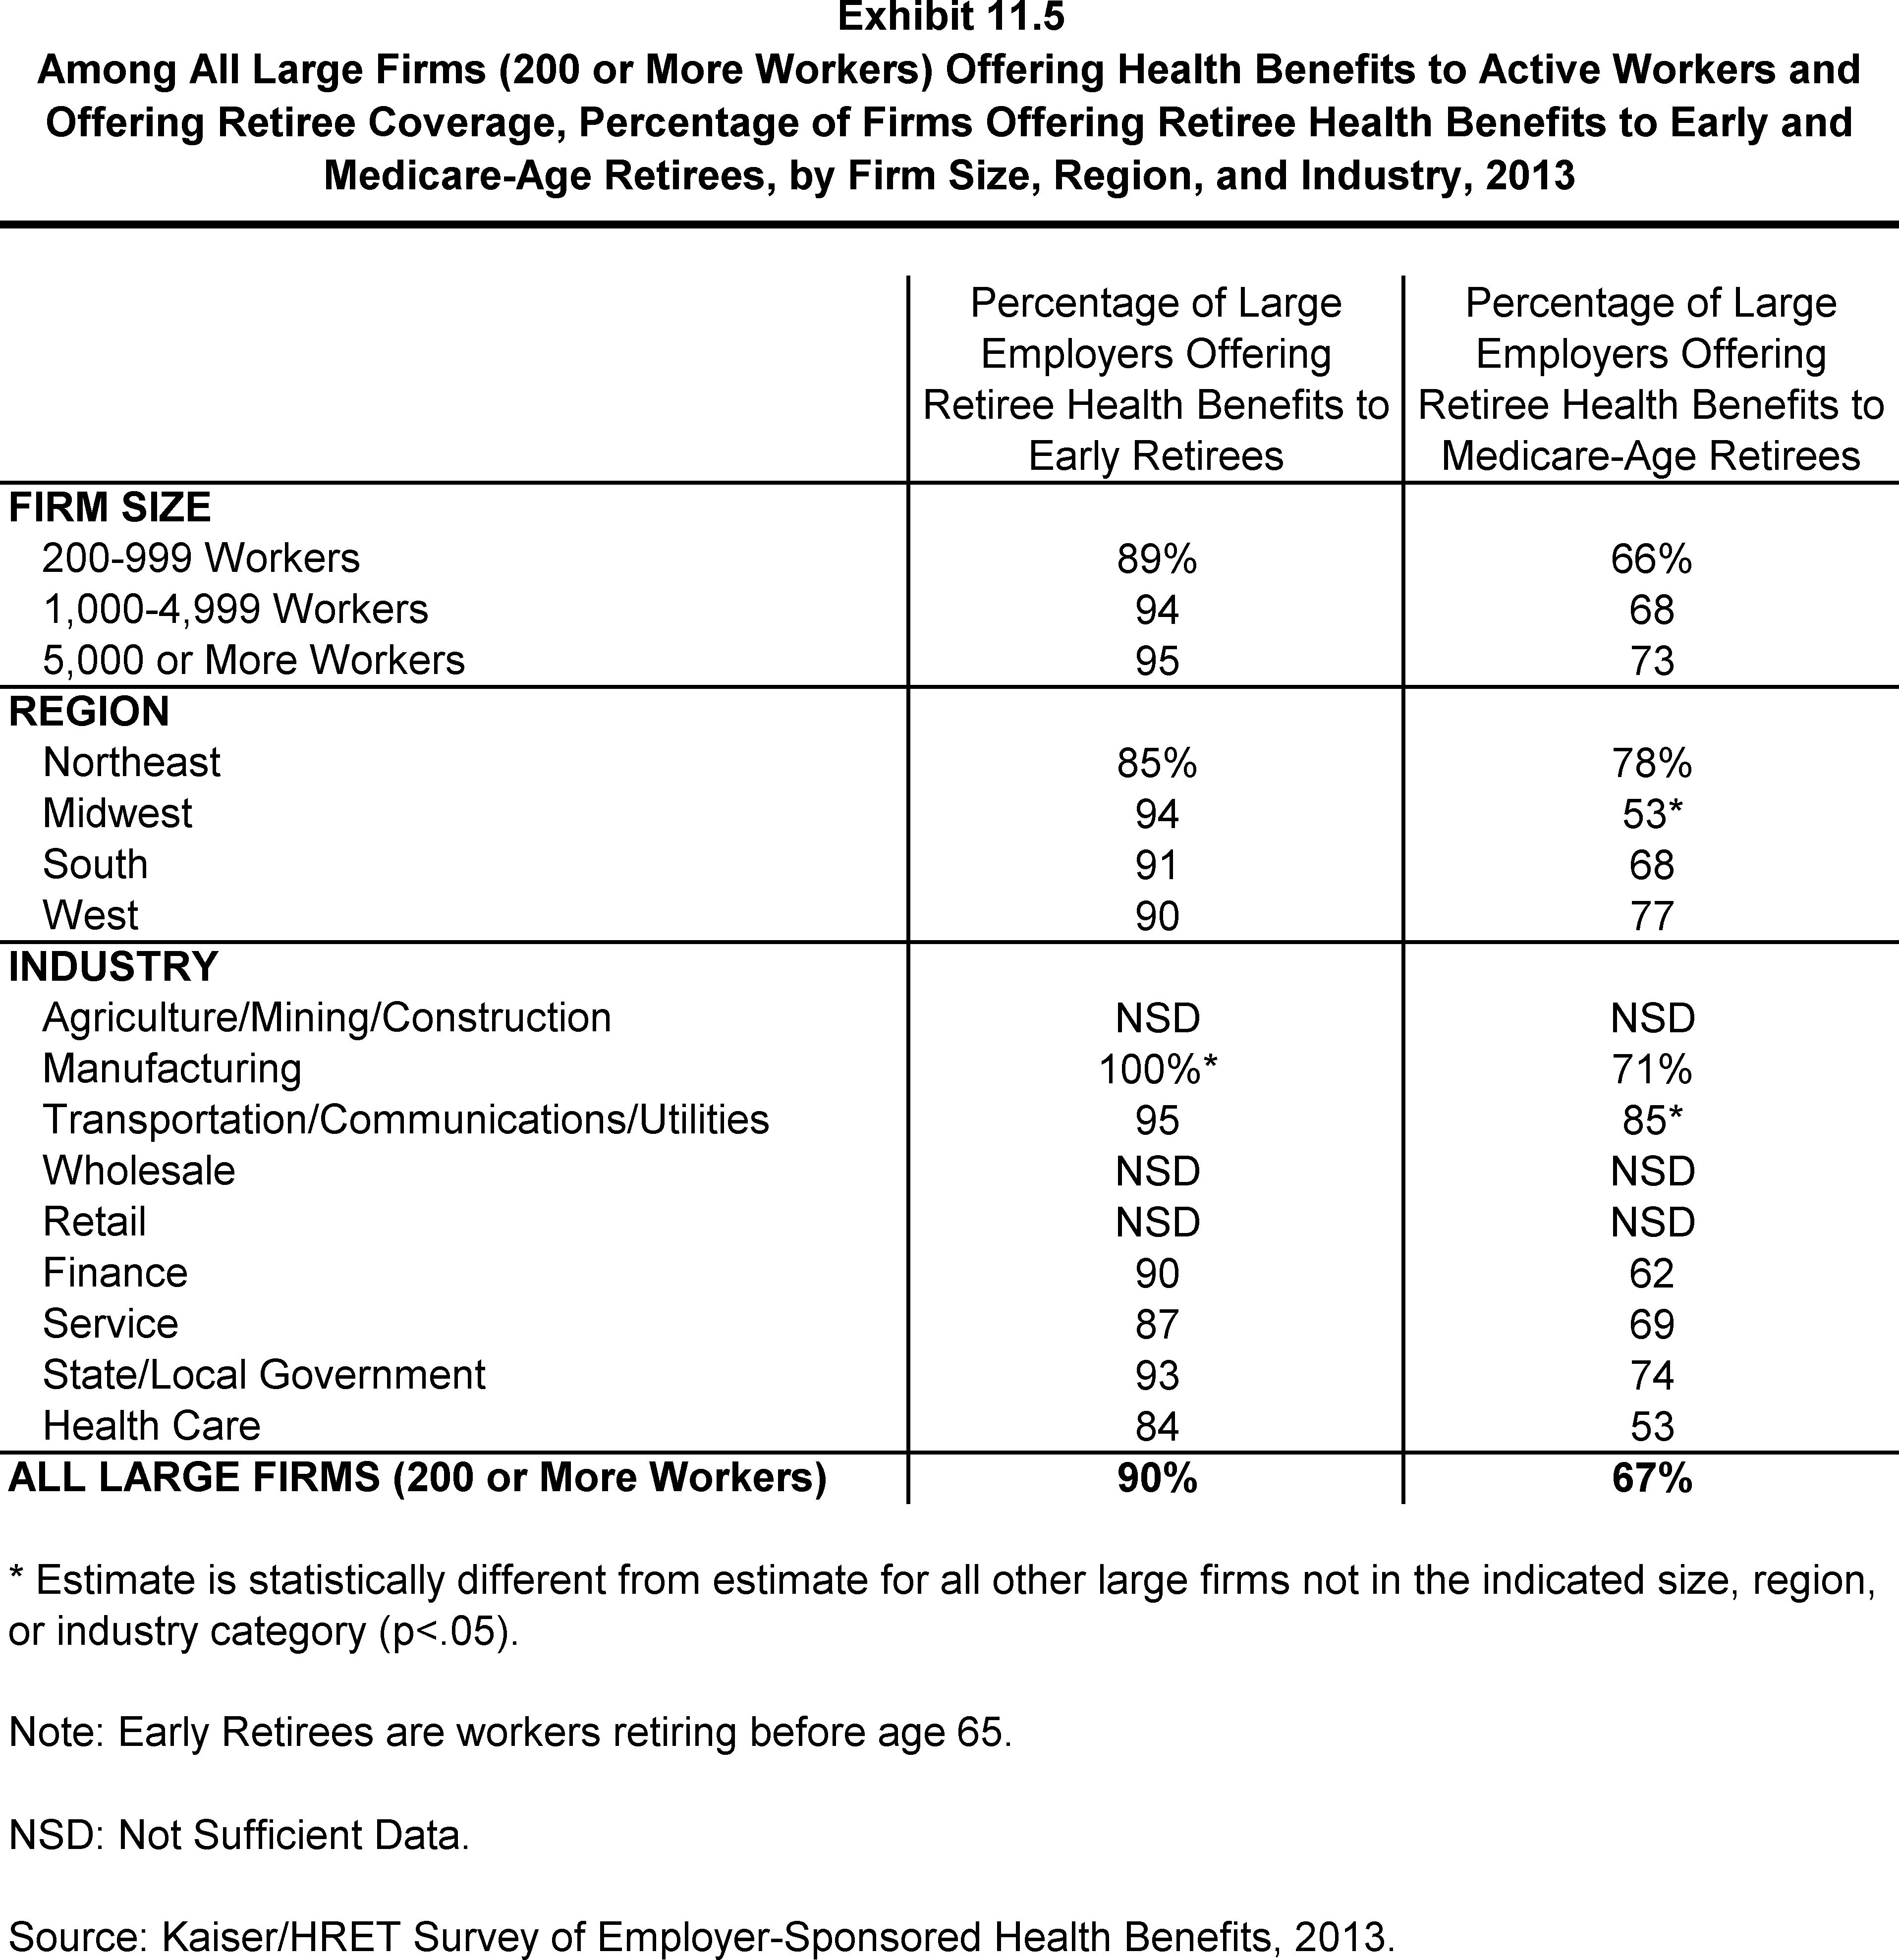
Among All Large Firms (200 or More Workers) Offering Health Benefits to Active Workers and Offering Retiree Coverage, Percentage of Firms Offering Retiree Health Benefits to Early and Medicare-Age Retirees, by Firm Size, Region, and Industry, 2013
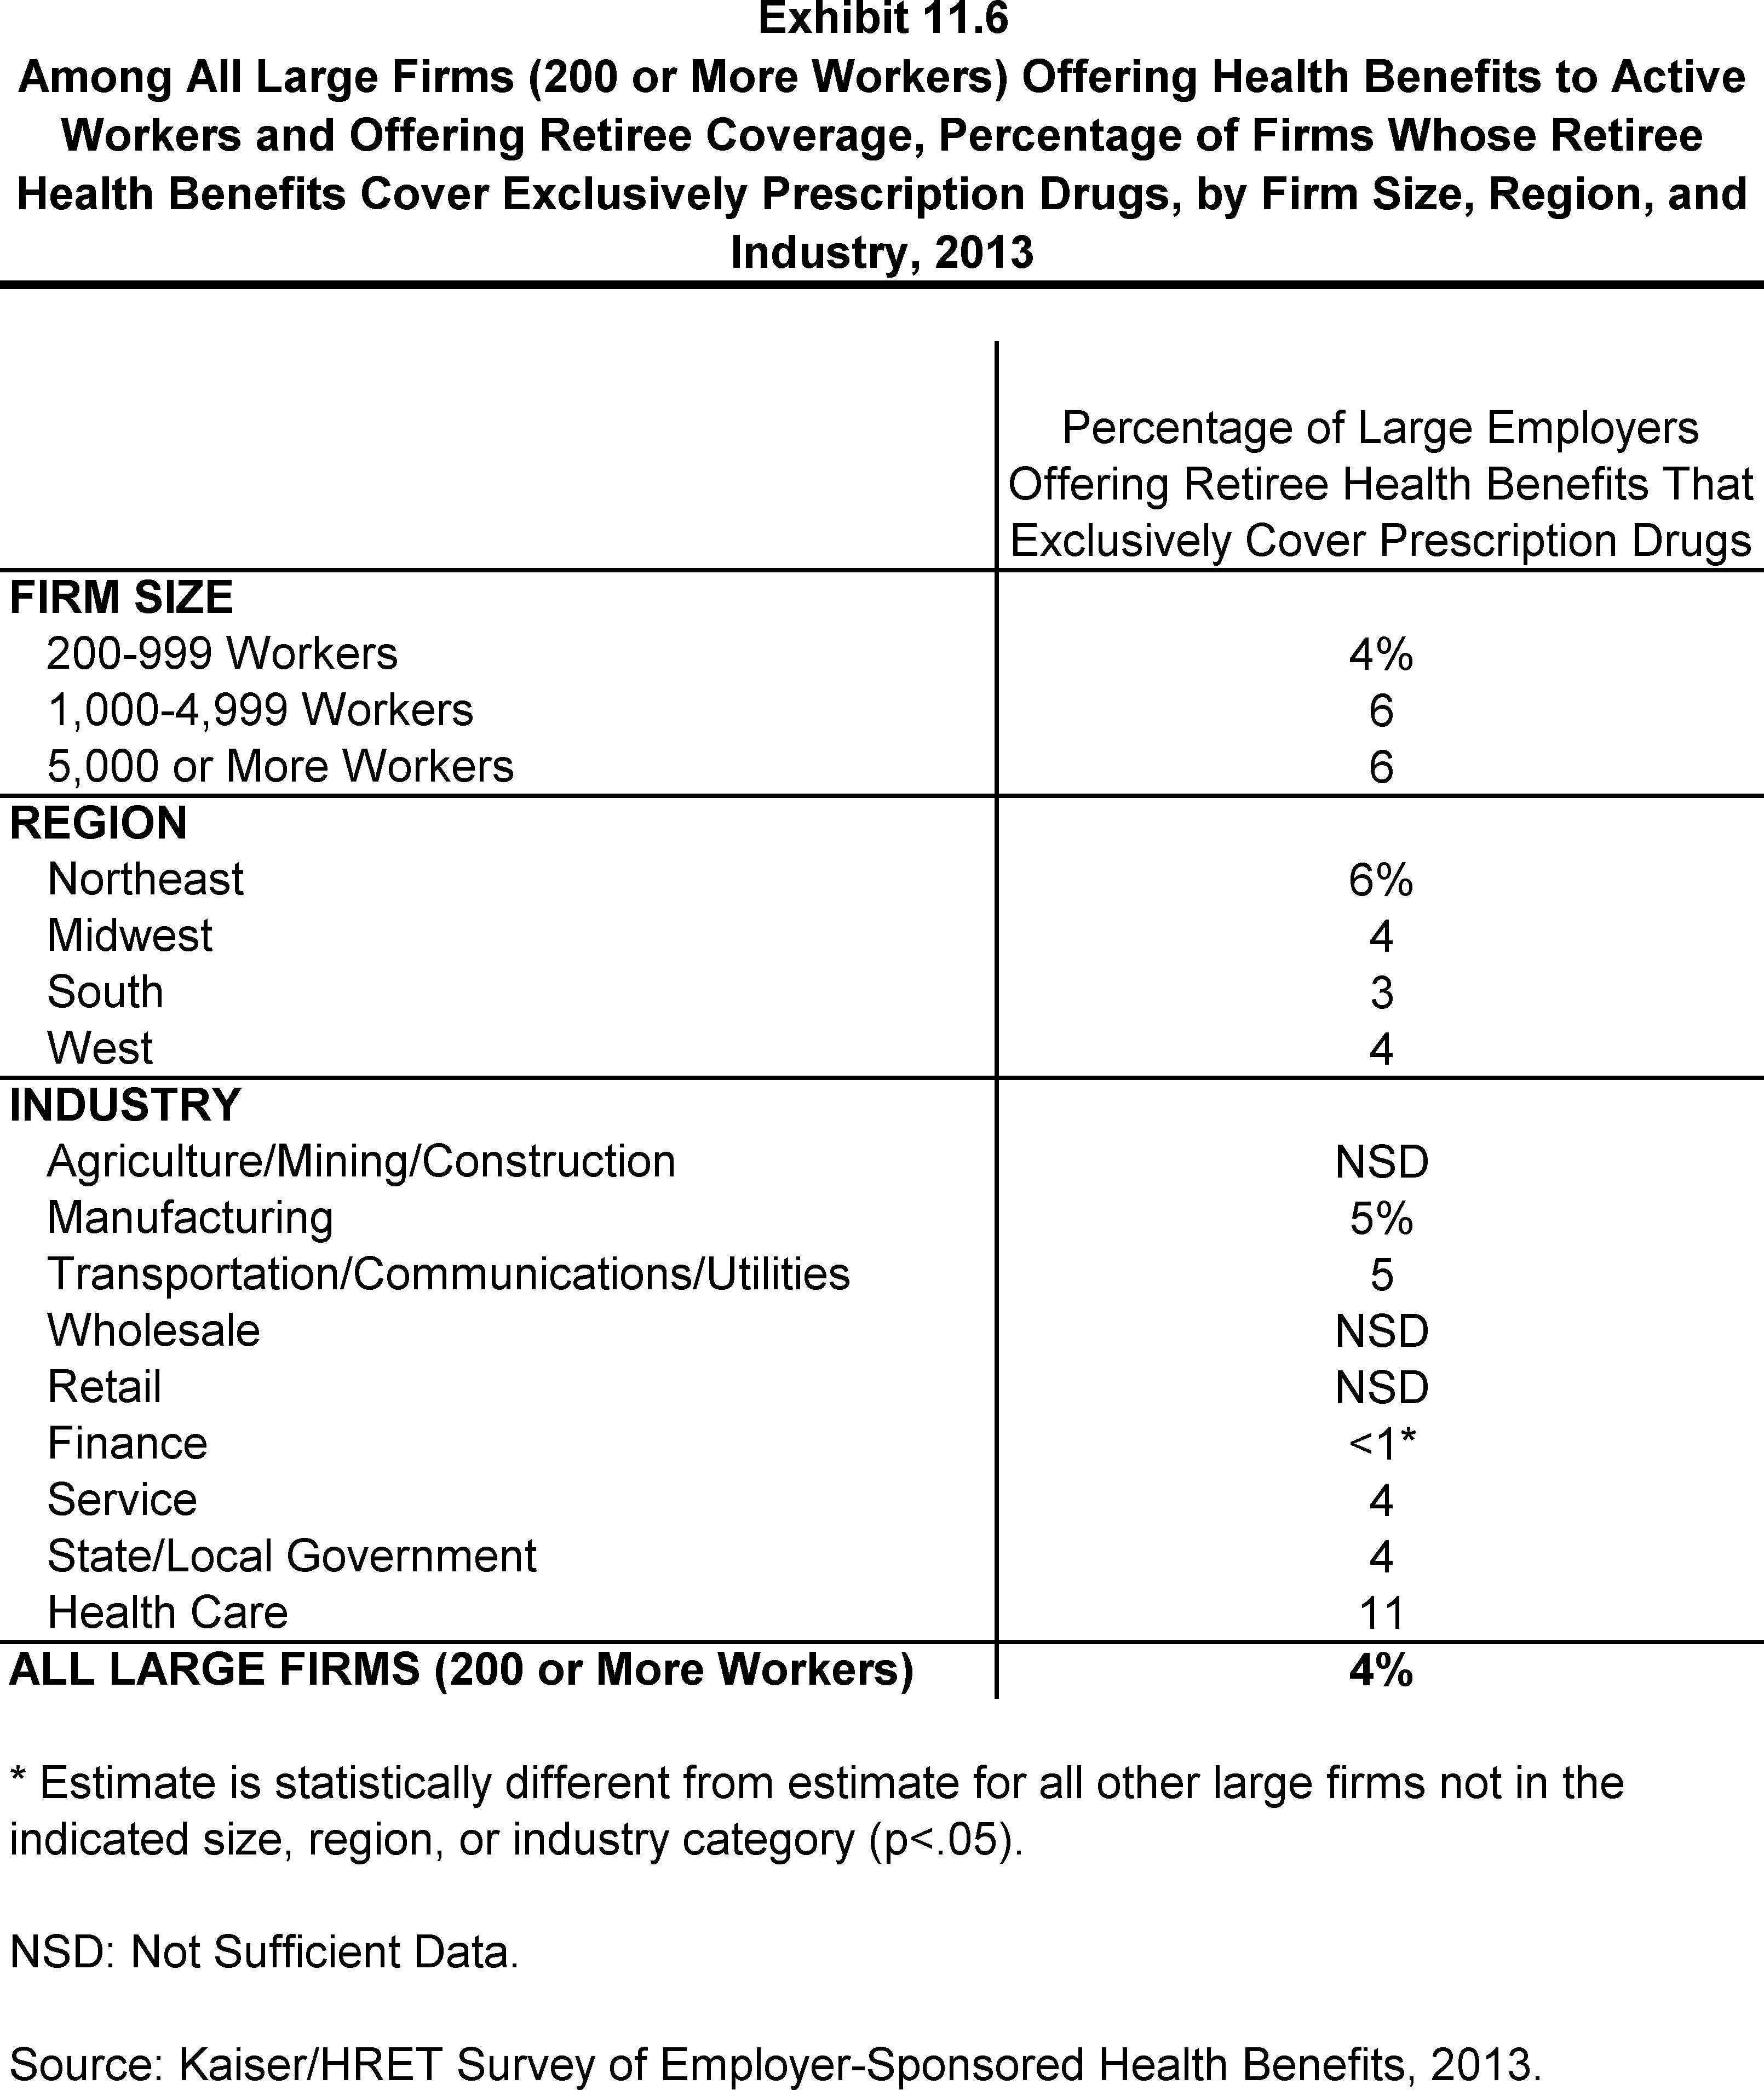
Among All Large Firms (200 or More Workers) Offering Health Benefits to Active Workers and Offering Retiree Coverage, Percentage of Firms Whose Retiree Health Benefits Cover Exclusively Prescription Drugs, by Firm Size, Region, and Industry, 2013
Section Twelve: Wellness Programs and Health Risk Assessments
A majority of firms offering health benefits offers some type of wellness program, with large firms (200 or more workers) being more likely than smaller firms (3-199 workers) to do so. Thirty-six percent of large firms and 8% of small firms offering at least one wellness benefit offer financial incentives to employees who participate in wellness programs. Twenty-four percent of firms offer employees the opportunity to complete health risk assessments, with some of these firms tying financial penalties or rewards to employees who do so. Disease management programs remain common among firms offering health benefits with over half of these firms and more than three-quarters of large firms (200 or more workers) having at least one of the specified programs.
Wellness Benefits
- For a variety of reasons, including efforts to improve health and lower costs, many employers and health plans offer wellness programs. Wellness programs may range from classes in nutrition or healthy living to a wellness newsletter.
- Seventy-seven percent of firms offering health benefits offer at least one of the following wellness programs:
- Weight loss programs
- Biometric screenings
- Gym membership discounts or on-site exercise facilities
- Smoking cessation program
- Lifestyle or behavioral coaching, classes in nutrition or healthy living
- Web-based resources for healthy living
- Flu shot or vaccinations
- Employee assistance program (EAP)
- Wellness newsletter
- In the 2012 survey, offering firms were not asked if they offered an “EAP” or “flu shots and vaccinations”. Excluding these two categories, 69% of all firms offering health benefits also offered one of the listed wellness programs in 2013, similar to the amount in 2012 (63%).
- Large firms (200 or more workers) offering health benefits are more likely to offer each of the listed wellness programs than smaller firms. In addition, large firms (200 or more workers) offering health benefits are more likely to offer at least one of the listed wellness programs than smaller firms (99% vs. 76%) (Exhibit 12.2).
- About half of firms offering health benefits offer flu shots or vaccinations (54%), a wellness newsletter (48%) or web-based resources for healthy living (47%). The offer rate for each type of wellness benefit included in the survey is presented in (Exhibit 12.1), (Exhibit 12.2), and (Exhibit 12.3).
- Forty-eight percent of firms offering health benefits and at least one wellness benefit offer wellness benefits to spouses or dependents. Large firms (200 or more workers) offering at least one wellness benefit are more likely than smaller firms to offer wellness benefits to spouses or dependents (65% vs. 47%) (Exhibit 12.4).
- Among firms offering health benefits and at least one wellness program, 80% report that most of the wellness benefits they offer are provided by the health plan (Exhibit 12.4).1 Small firms (3 to 199 workers) are more likely than larger firms to report that most wellness programs are provided by the health plan (81% vs. 56%) (Exhibit 12.4).
Incentives for Wellness Benefits:
- In order to encourage participation in wellness programs, firms may offer financial incentives to employees who participate.2
- Eight percent of firms offering health benefits and at least one of the listed wellness programs offer gift cards, travel, merchandise, or cash to workers who participate in wellness programs. Large firms (200 or more workers) are more likely to offer these incentives than smaller firms (26% vs. 7%) (Exhibit 12.5).
- A small percentage of firms offering health benefits and at least one of the listed wellness programs offers lower worker premium contributions (3%) or cost sharing (such as lower deductibles) (1%) as an incentive to encourage employees to participate. Among firms that offer a high-deductible health plan paired with a HRA or HSA, one percent offers workers who participate in wellness programs higher HSA or HRA contributions (Exhibit 12.5).
- Employers use a variety of strategies to promote wellness programs. Large employers (200 or more employees) offering health benefits and at least one wellness program are more likely than smaller employers to use one of the following strategies to promote wellness (79% vs. 55%) (Exhibit 12.11):
- Assigning an employee to promote wellness
- Access to a benefits counselor
- Incentives
- Personalized communication
- Team competitions
- Social media tools
- Nearly half of large firms (200 or more workers) offering health benefits and at least one wellness program use personalized communication (49%) or assign an employee (45%) to promote wellness programs.
- Employers use a range of strategies to evaluate wellness programs. Seventy-two percent of large firms (200 or more workers) offering health benefits and at least one wellness program and 34% of smaller firms use at least one of the following evaluation methods (Exhibit 12.12):
- Return on investment
- Health outcomes
- Employee retention
- Employee participation
- Employee satisfaction
- For large firms (200 or more workers) offering health benefits and at least one wellness benefit, employee participation is the most common metric (65%) (Exhibit 12.12).
Health Risk Assessments
- Some firms give their employees the opportunity to complete a health risk assessment to identify potential health issues. Health risk assessments generally include questions about medical history, health status, and lifestyle.
- Overall, 24% of firms offering health benefits ask their employees to complete a health risk assessment. Large firms (200 or more workers) are more likely than smaller firms to offer employees this option (55% vs. 23%) (Exhibit 12.6).
- Some firms offer financial incentives to encourage employees to complete health risk assessments.
- Fifty-four percent of large firms (200 or more workers) offering health benefits and health risk assessments give financial incentives to employees who complete a health risk assessment.
- Five percent of large firms (200 or more workers) who offer health benefits and health risk assessments require employees to complete a health risk assessment in order to enroll in a health plan.
- Nine percent of large firms (200 or more workers) that offer health benefits and provide employees the opportunity to complete a health risk assessment penalize employees with identified health risks factors who do not complete a wellness program (9%) (Exhibit 12.7).
Biometric Screening
- Biometric screening is a health examination that measures an employee’s risk factors, such as cholesterol, blood pressure, stress, and nutrition. Biometric outcomes may include meeting a target body mass index (BMI) or cholesterol level. Twenty-six percent of small firms (3 to 199 workers) and 55% of larger firms offering health benefits offer biometric screenings as a wellness benefit (Exhibit 12.1).
- Firms which offer their employees biometric screenings may include additional incentives for those employees who complete screenings. Among large firms (200 or more workers) offering health benefits and biometric screenings, eleven percent reward or penalize employees for meeting biometric outcomes and eleven percent require employees to complete biometric screenings in order to enroll in a health plan (Exhibit 12.14).
Disease Management
- Disease management programs try to improve the health of and reduce the associated costs of people with chronic illnesses by teaching patients about their disease, suggesting treatment options, and assessing the treatment process and outcomes.
- Fifty-seven percent of firms offering health benefits offers one or more of the following disease management programs in their largest plan3 (Exhibit 12.8):
- Diabetes
- Asthma
- Hypertension
- High cholesterol
- Lower back pain
- Depression
- Obesity
- Large firms (200 or more workers) offering health benefits are more likely than smaller firms to have a disease management program (77% vs. 57%) (Exhibit 12.9). Seventy-three percent of large firms offering health benefits have a disease management program for diabetes.
- To encourage participation, two percent of firms offering health benefits and at least one of the specified disease management programs also offer financial incentives to employees who participate in these programs (Exhibit 12.10). Large, offering firms (200 or more workers) that offer disease management programs are more likely than smaller firms to have an incentive for participating in a disease management program (8% vs. 2%).
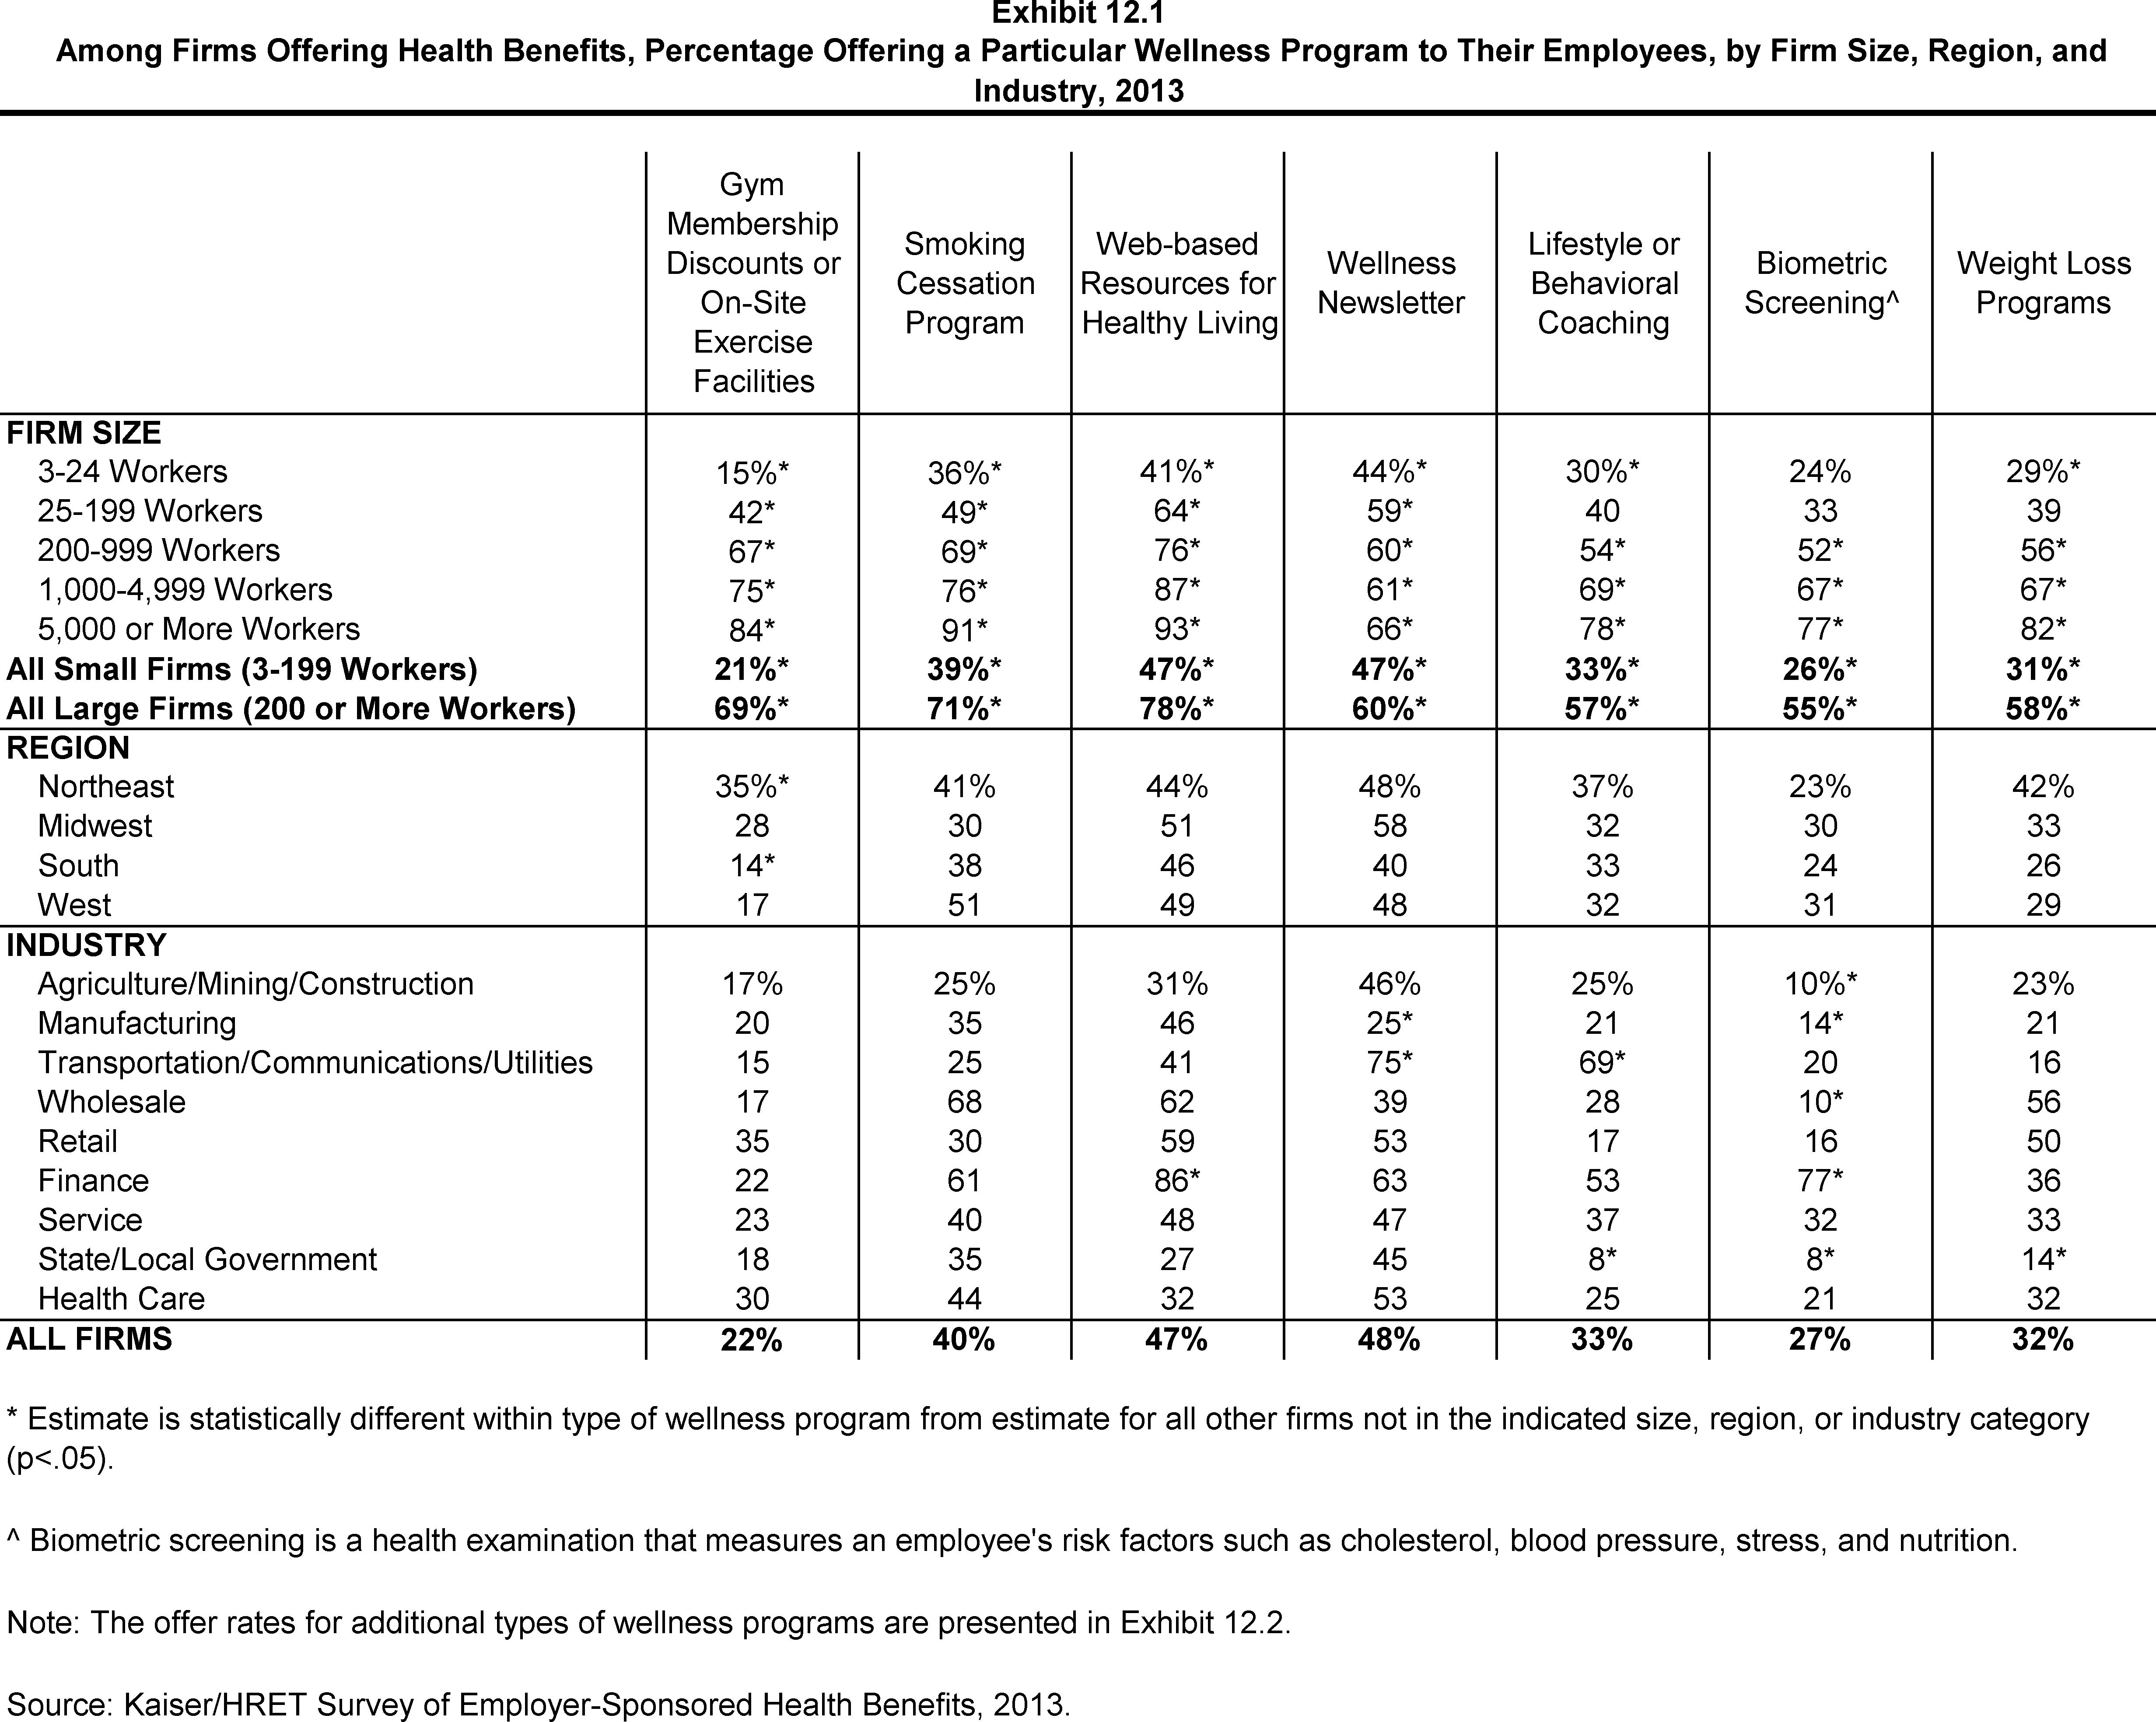
Among Firms Offering Health Benefits, Percentage Offering a Particular Wellness Program to Their Employees, by Firm Size, Region, and Industry, 2013
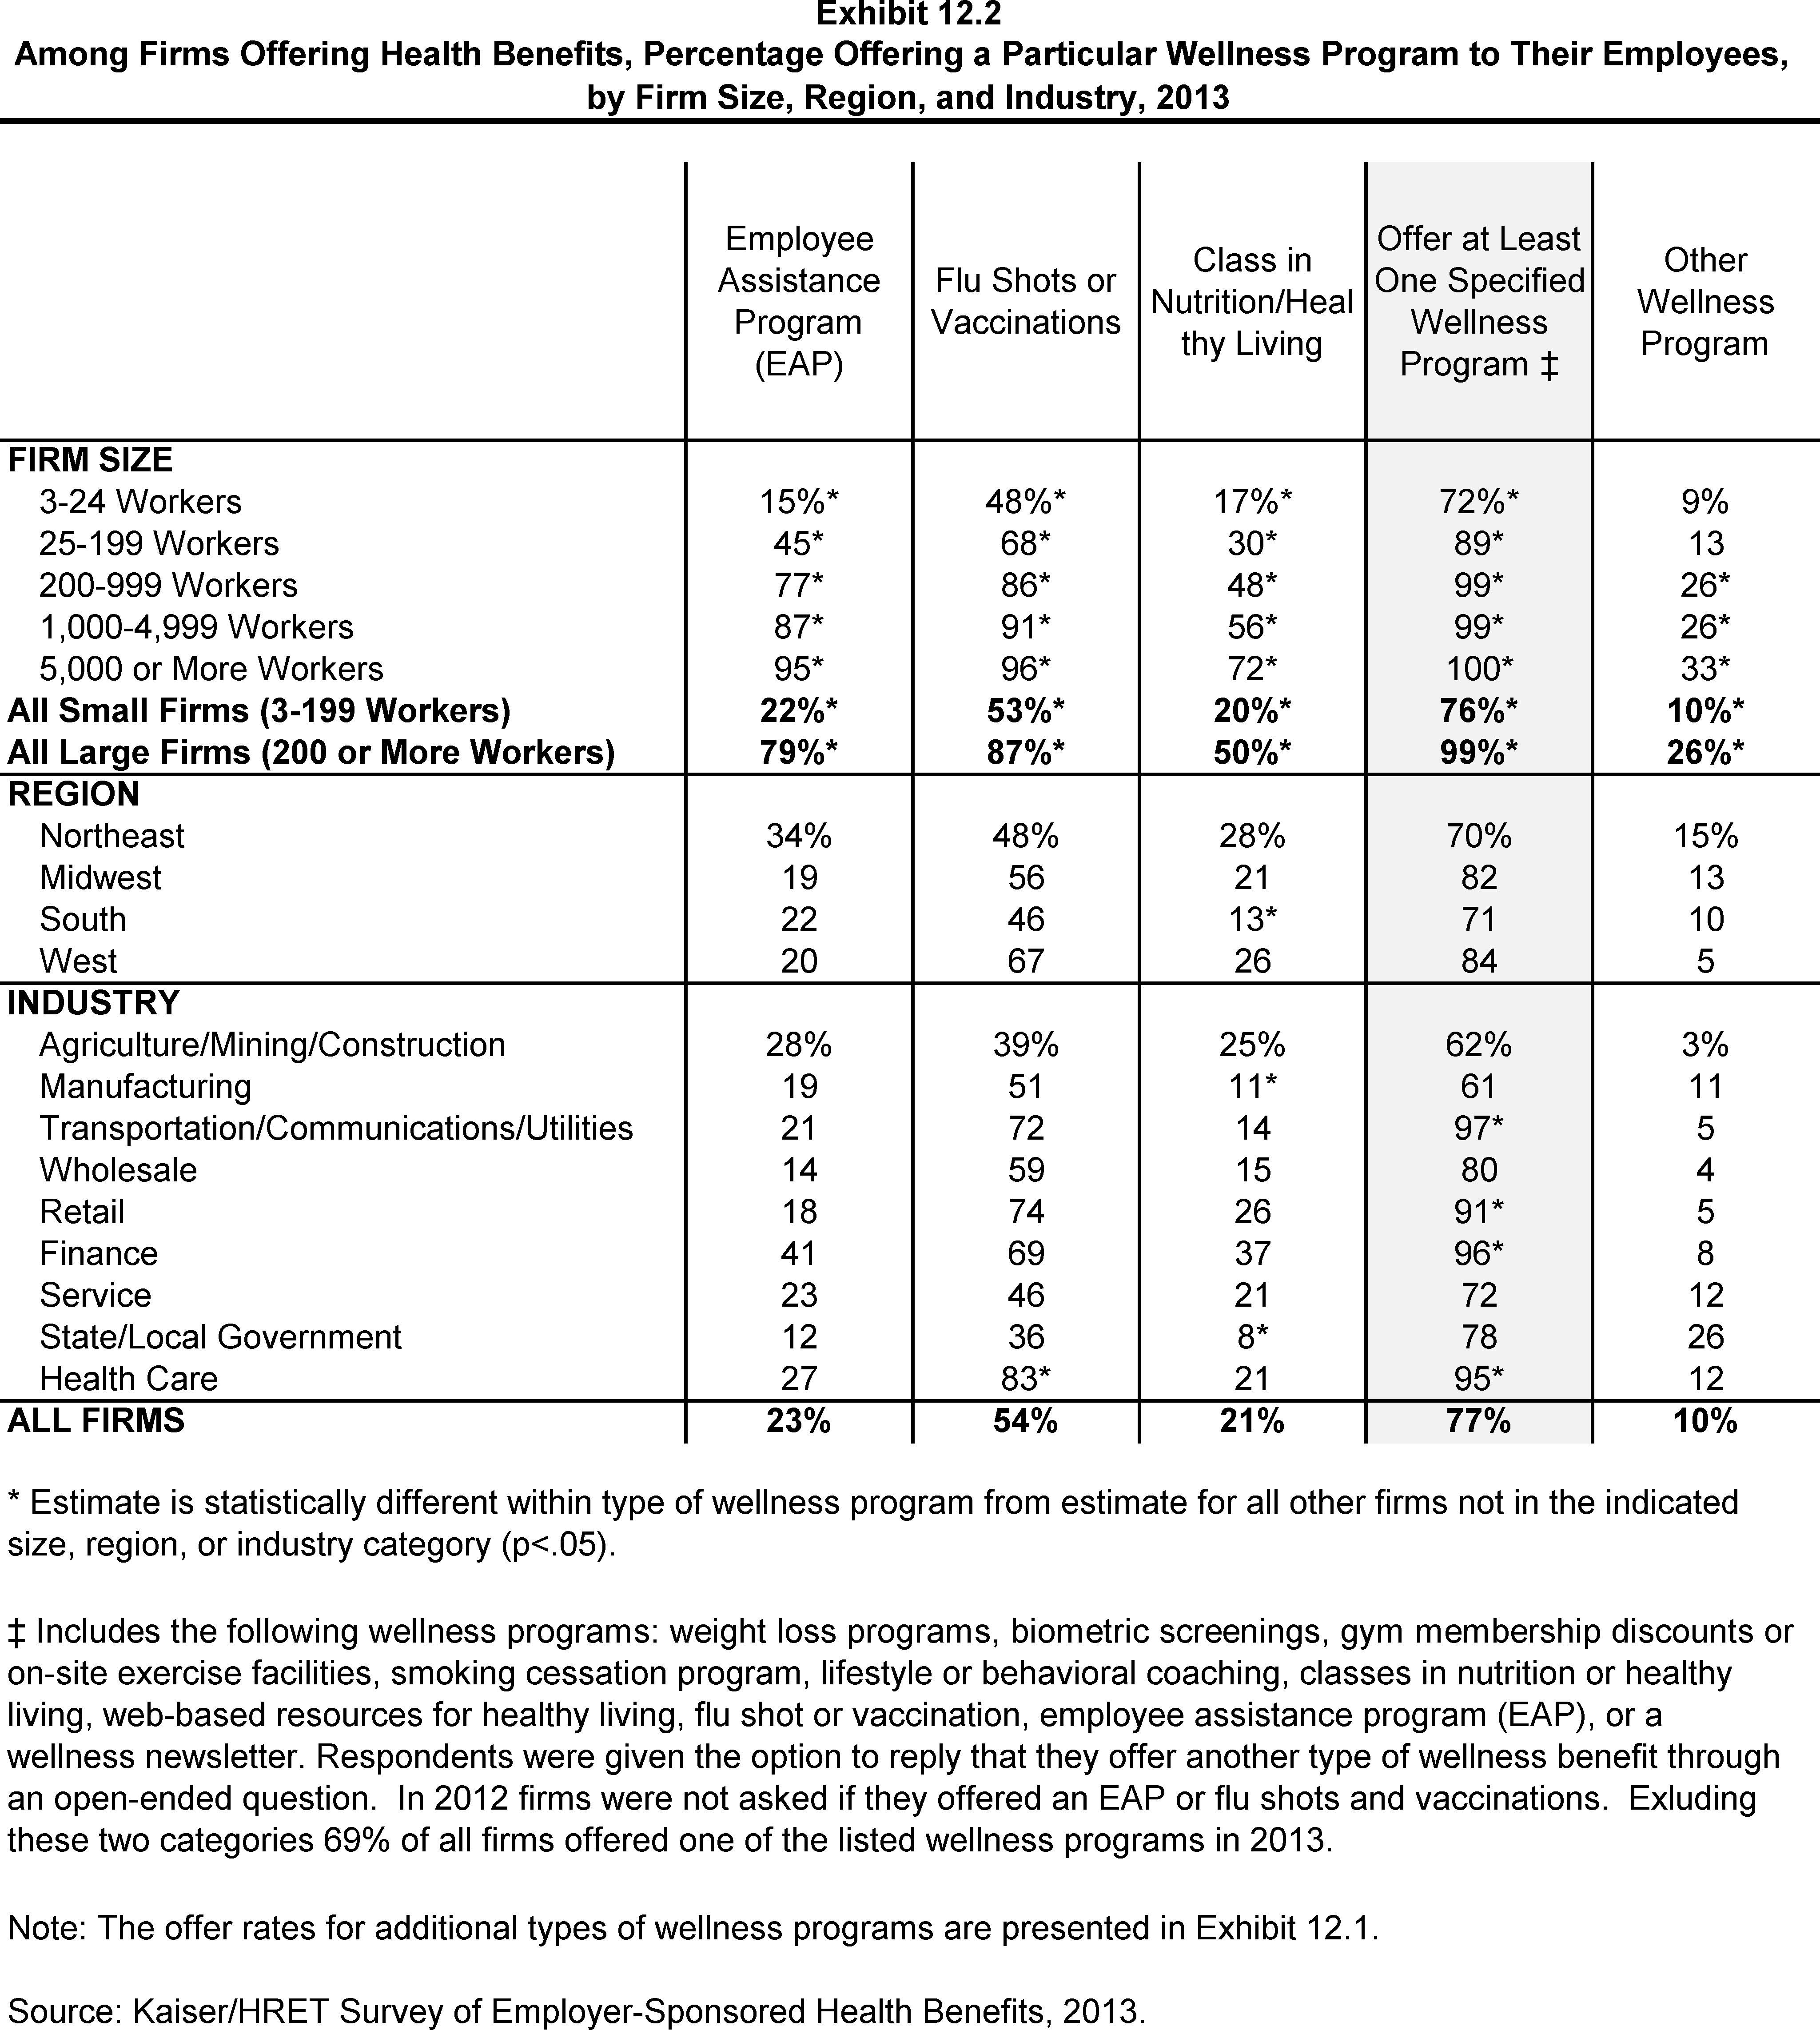
Among Firms Offering Health Benefits, Percentage Offering a Particular Wellness Program to Their Employees, by Firm Size, Region, and Industry, 2013
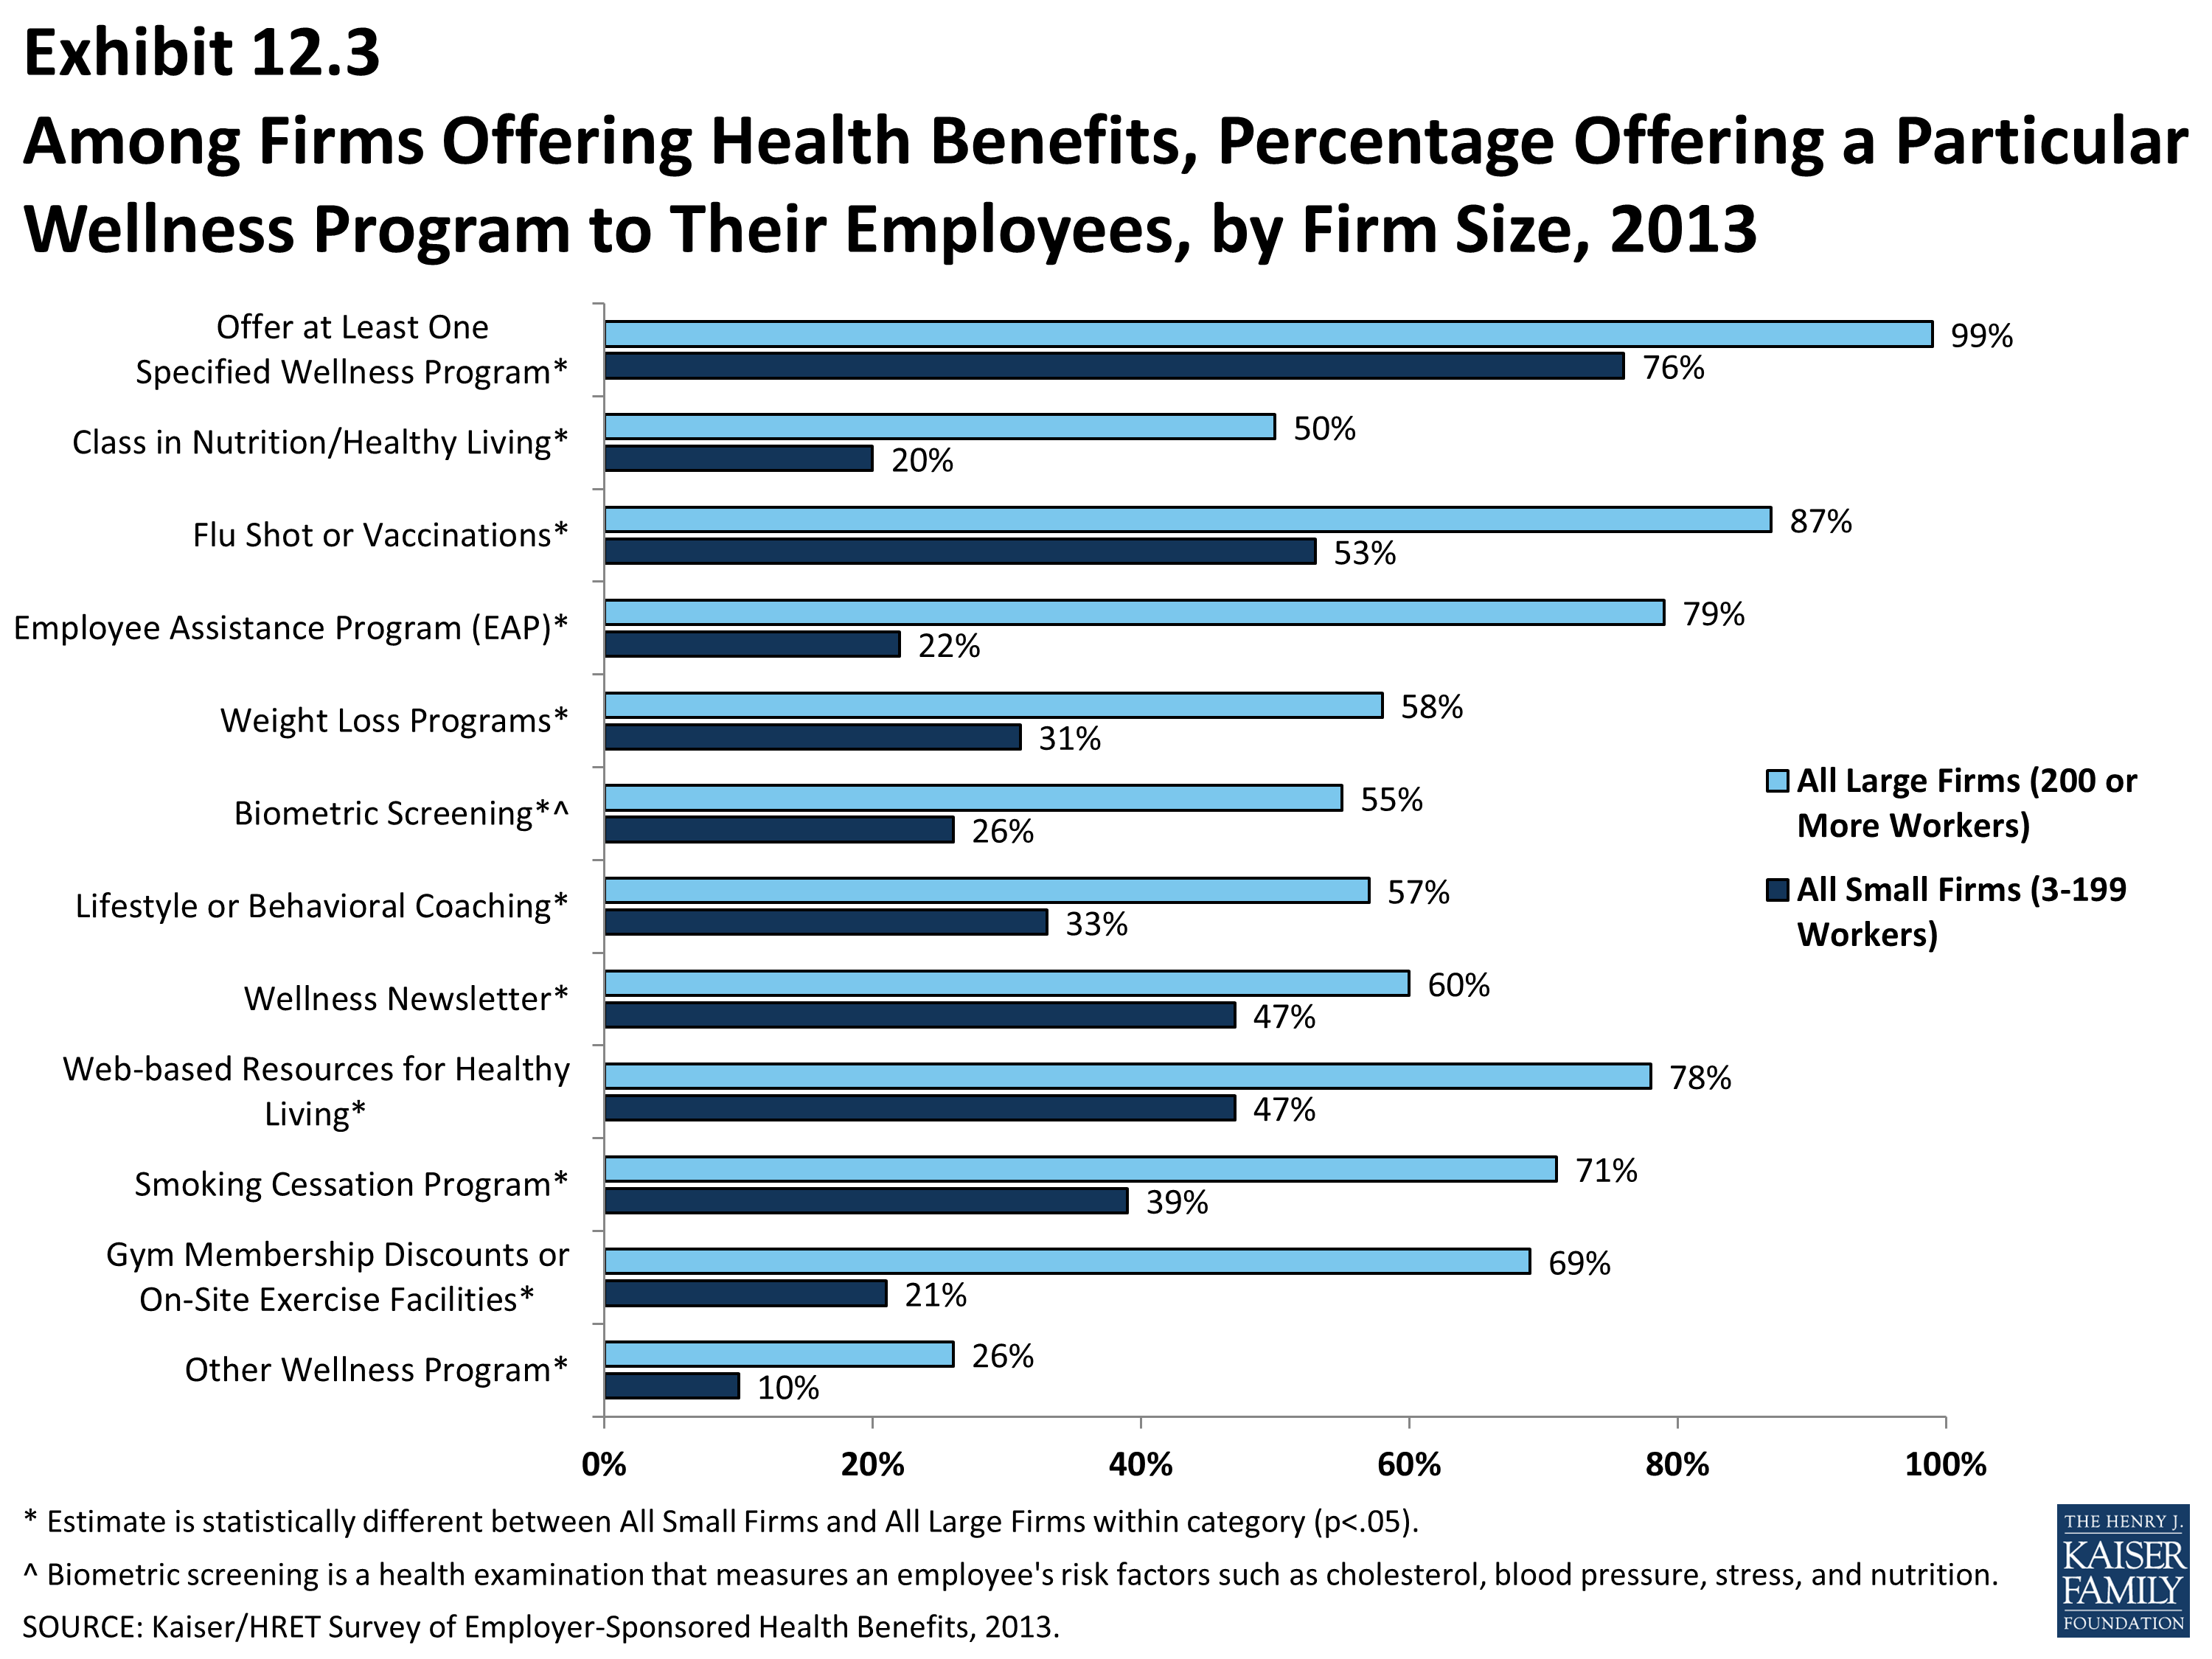
Among Firms Offering Health Benefits, Percentage Offering a Particular Wellness Program to Their Employees, by Firm Size, 2013
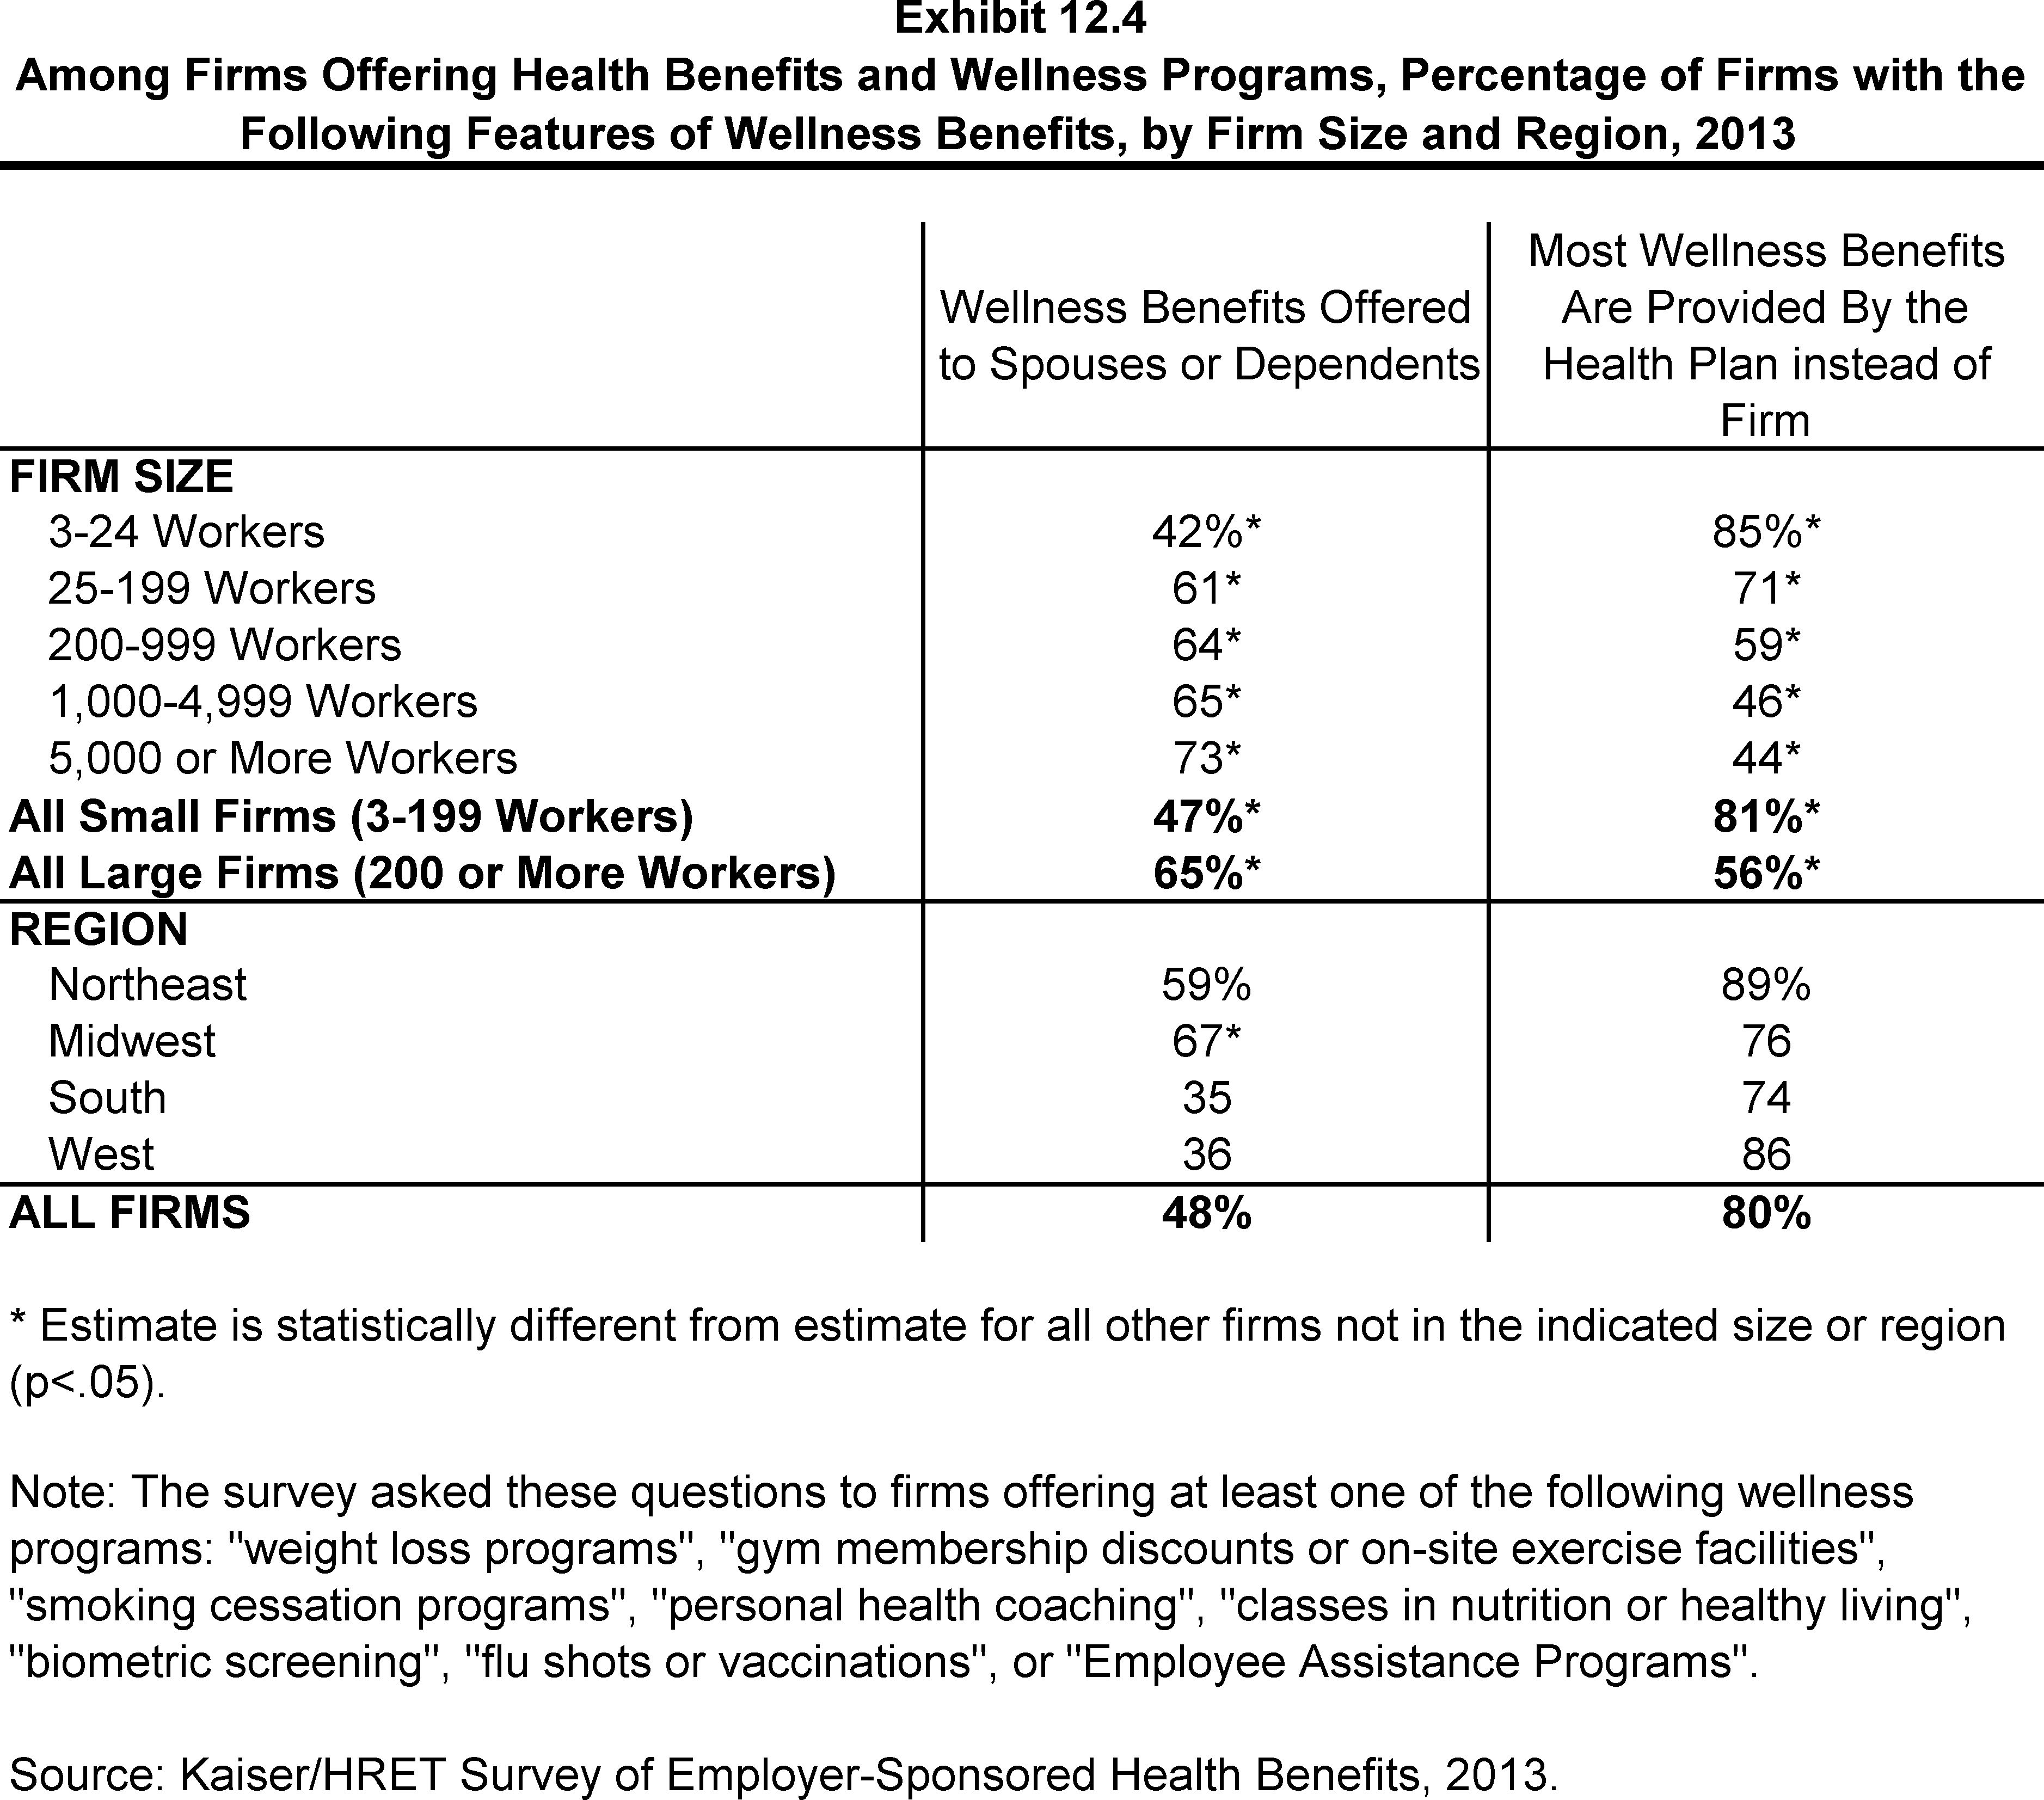
Among Firms Offering Health Benefits and Wellness Programs, Percentage of Firms with the Following Features of Wellness Benefits, by Firm Size and Region, 2013
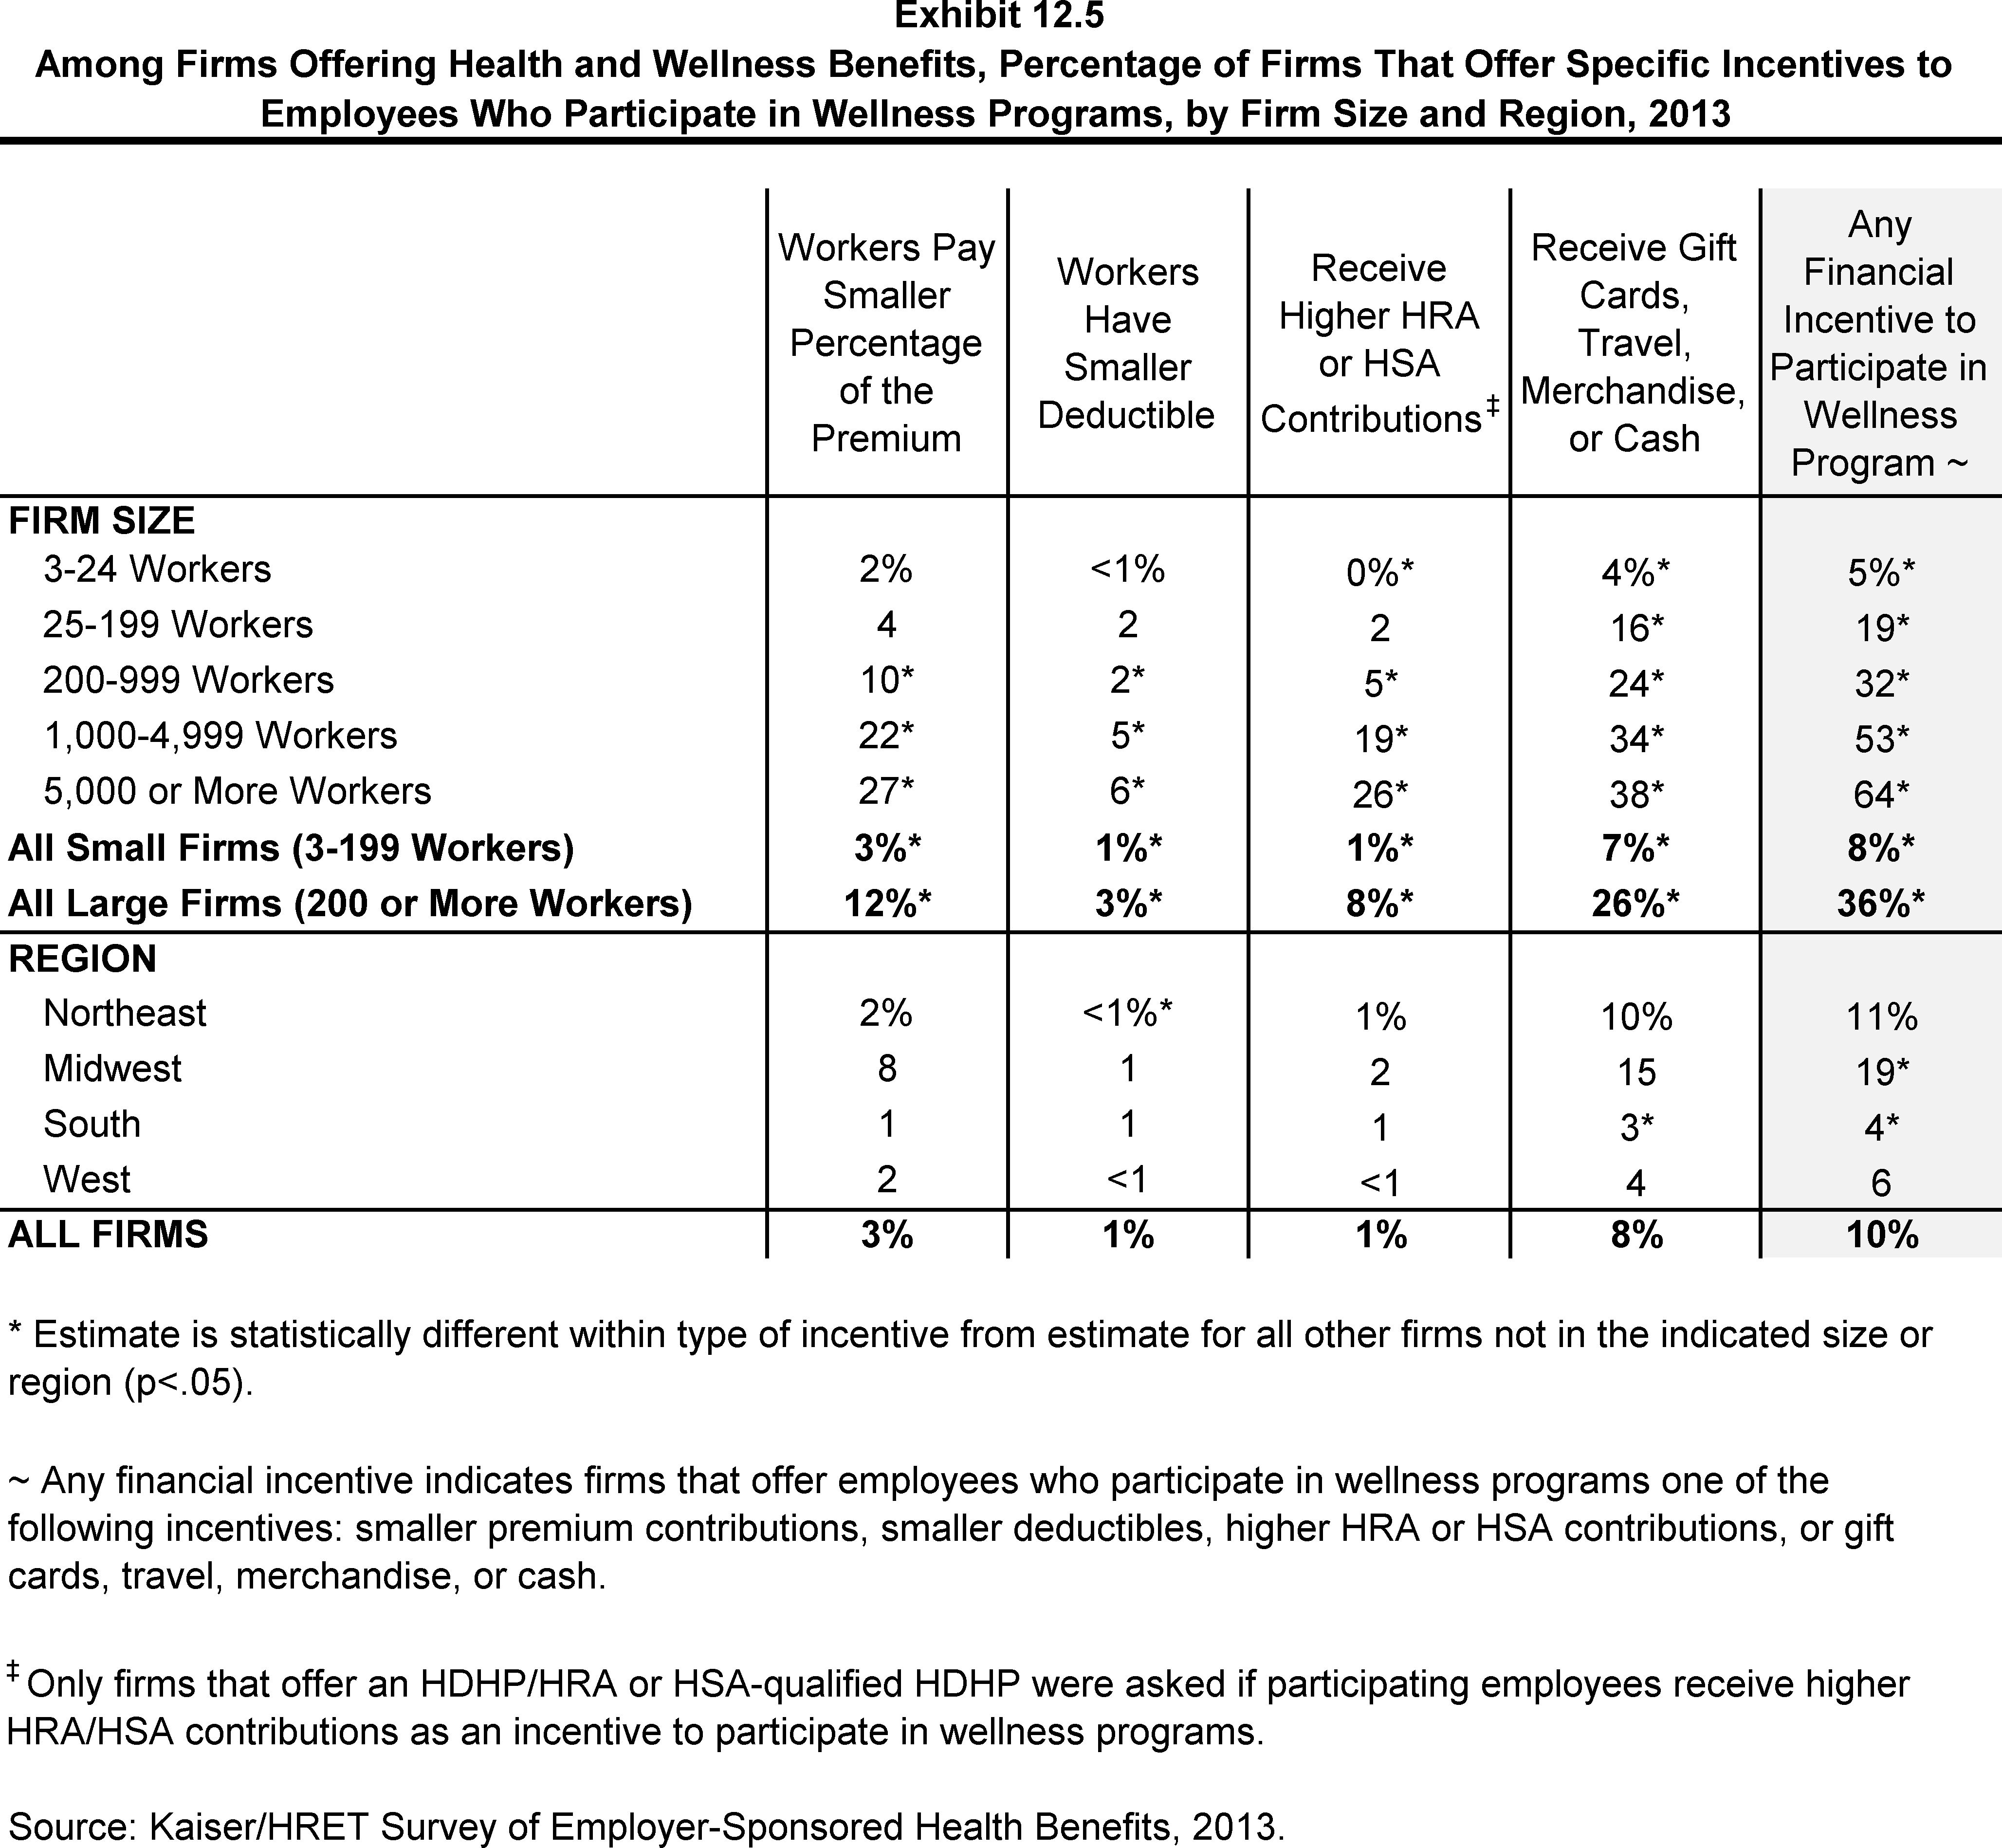
Among Firms Offering Health and Wellness Benefits, Percentage of Firms That Offer Specific Incentives to Employees Who Participate in Wellness Programs, by Firm Size and Region, 2013
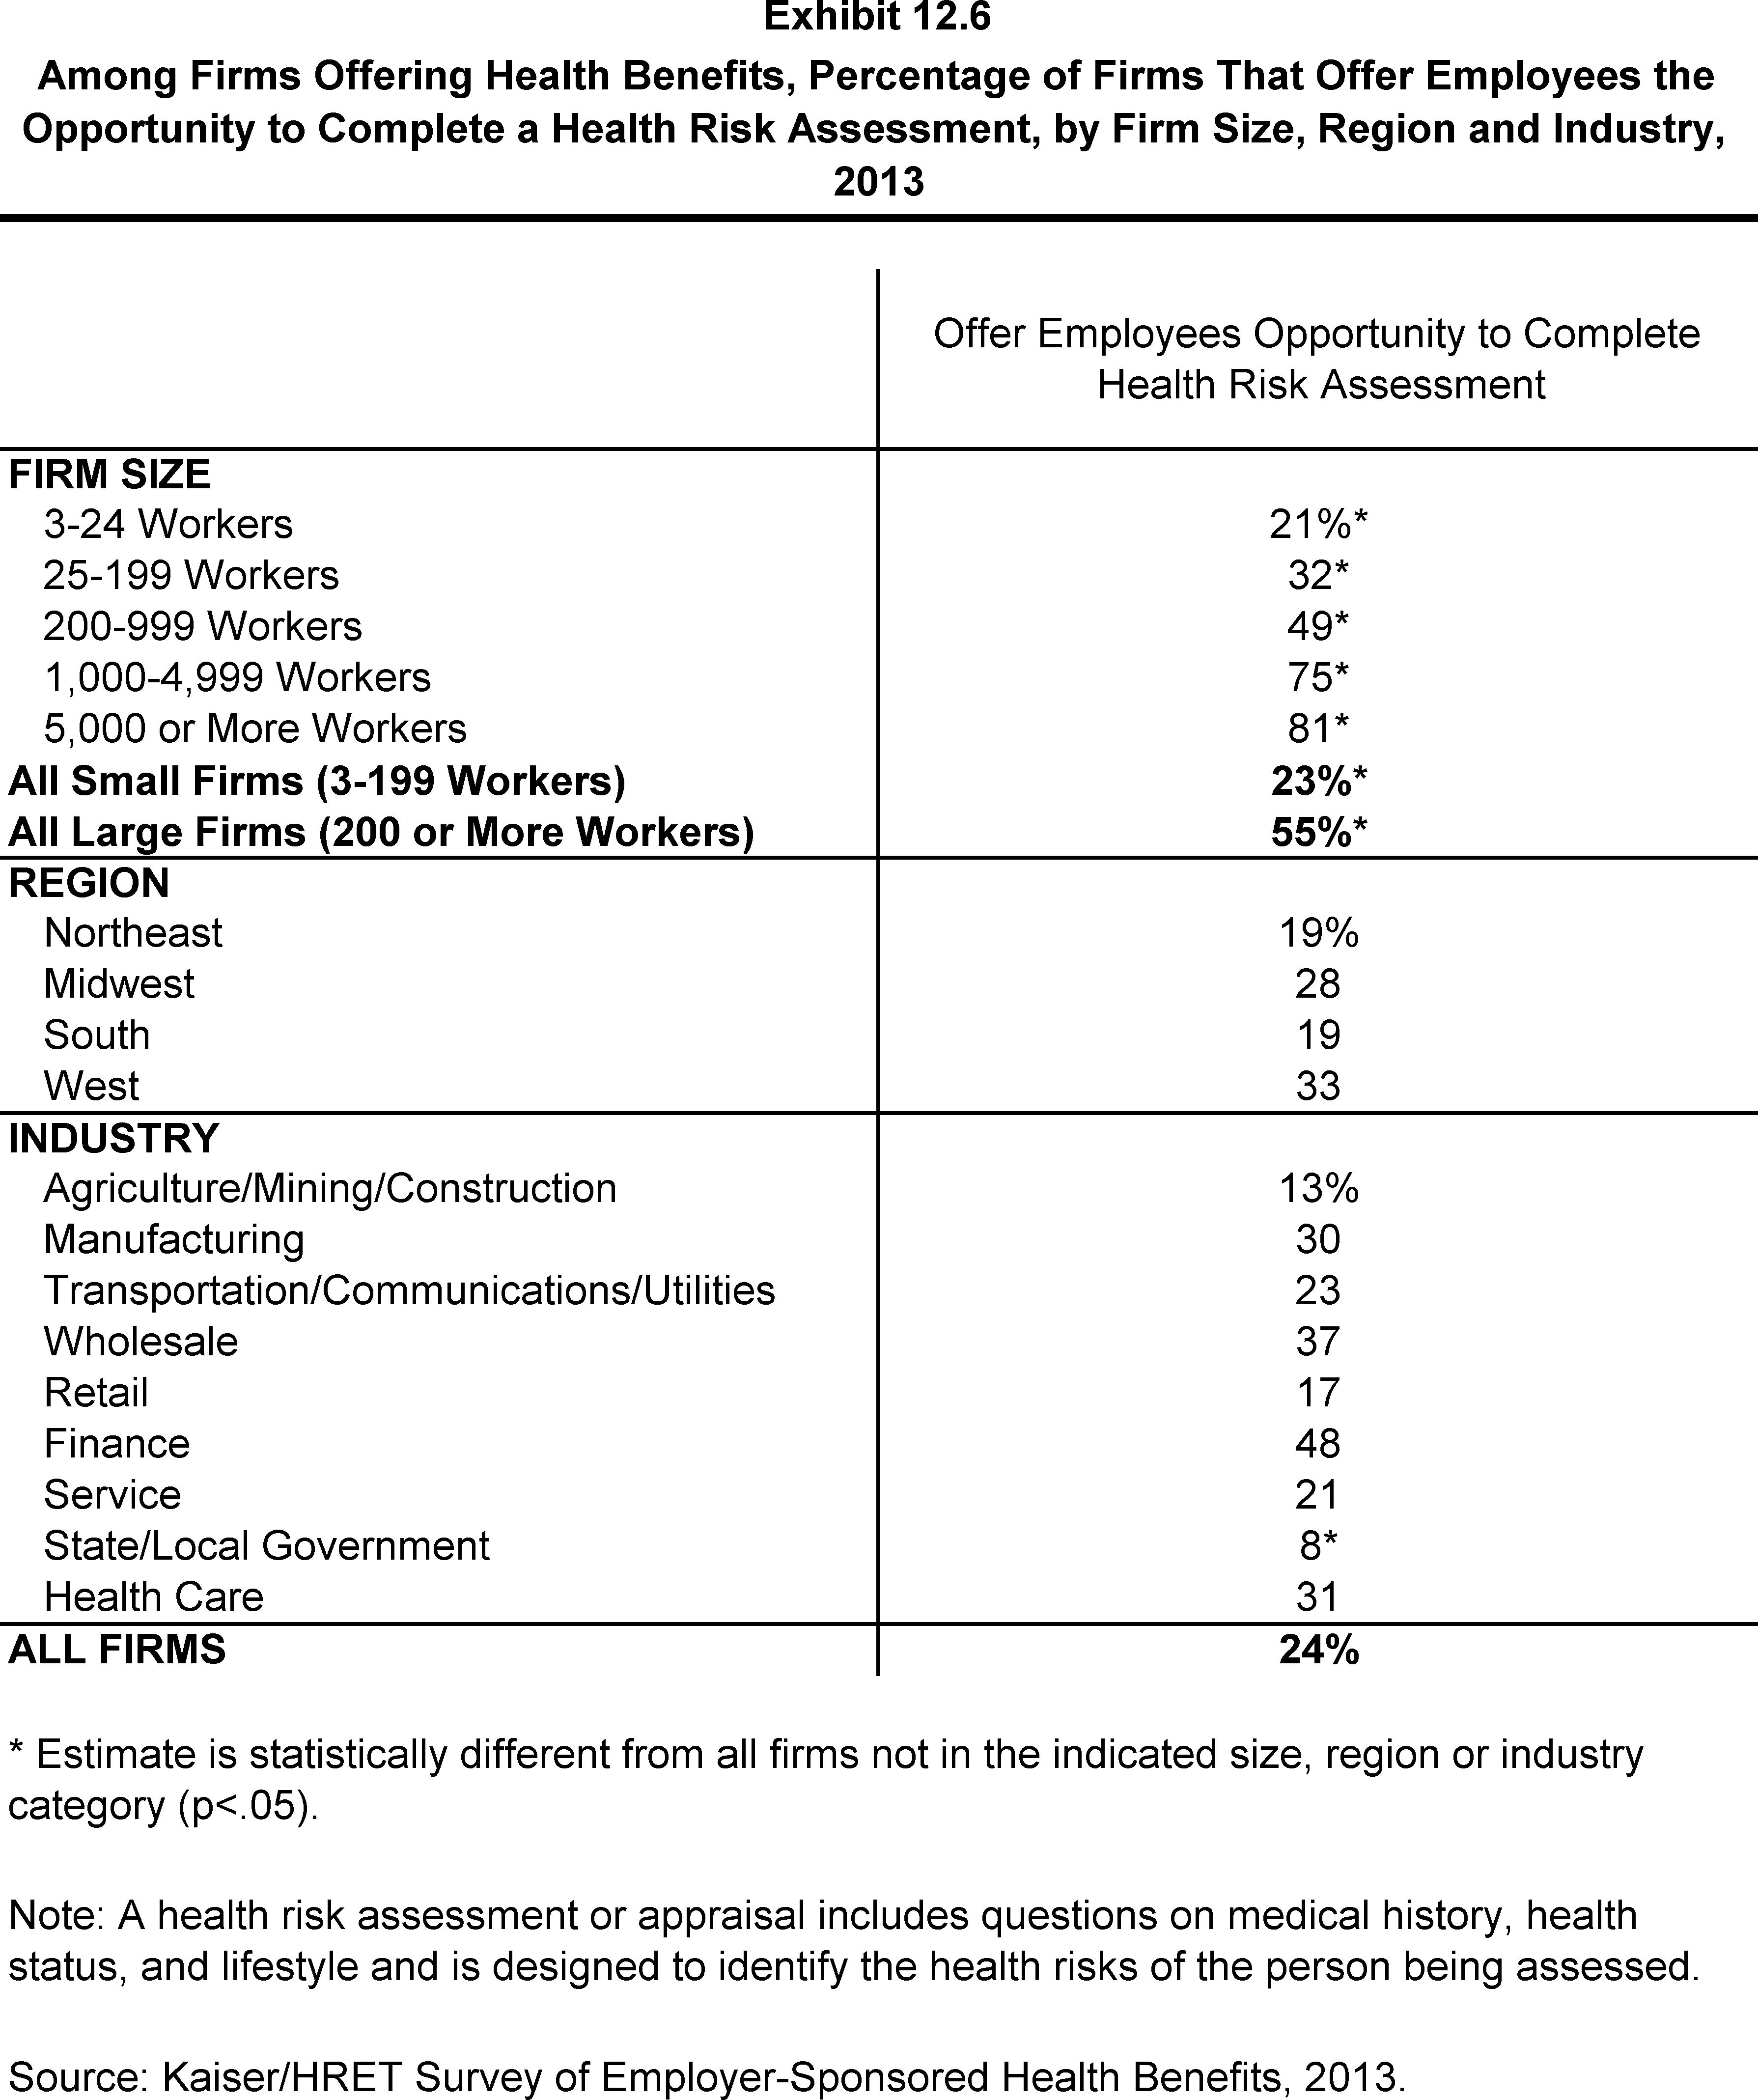
Among Firms Offering Health Benefits, Percentage of Firms That Offer Employees the Opportunity to Complete a Health Risk Assessment, by Firm Size, Region and Industry, 2013
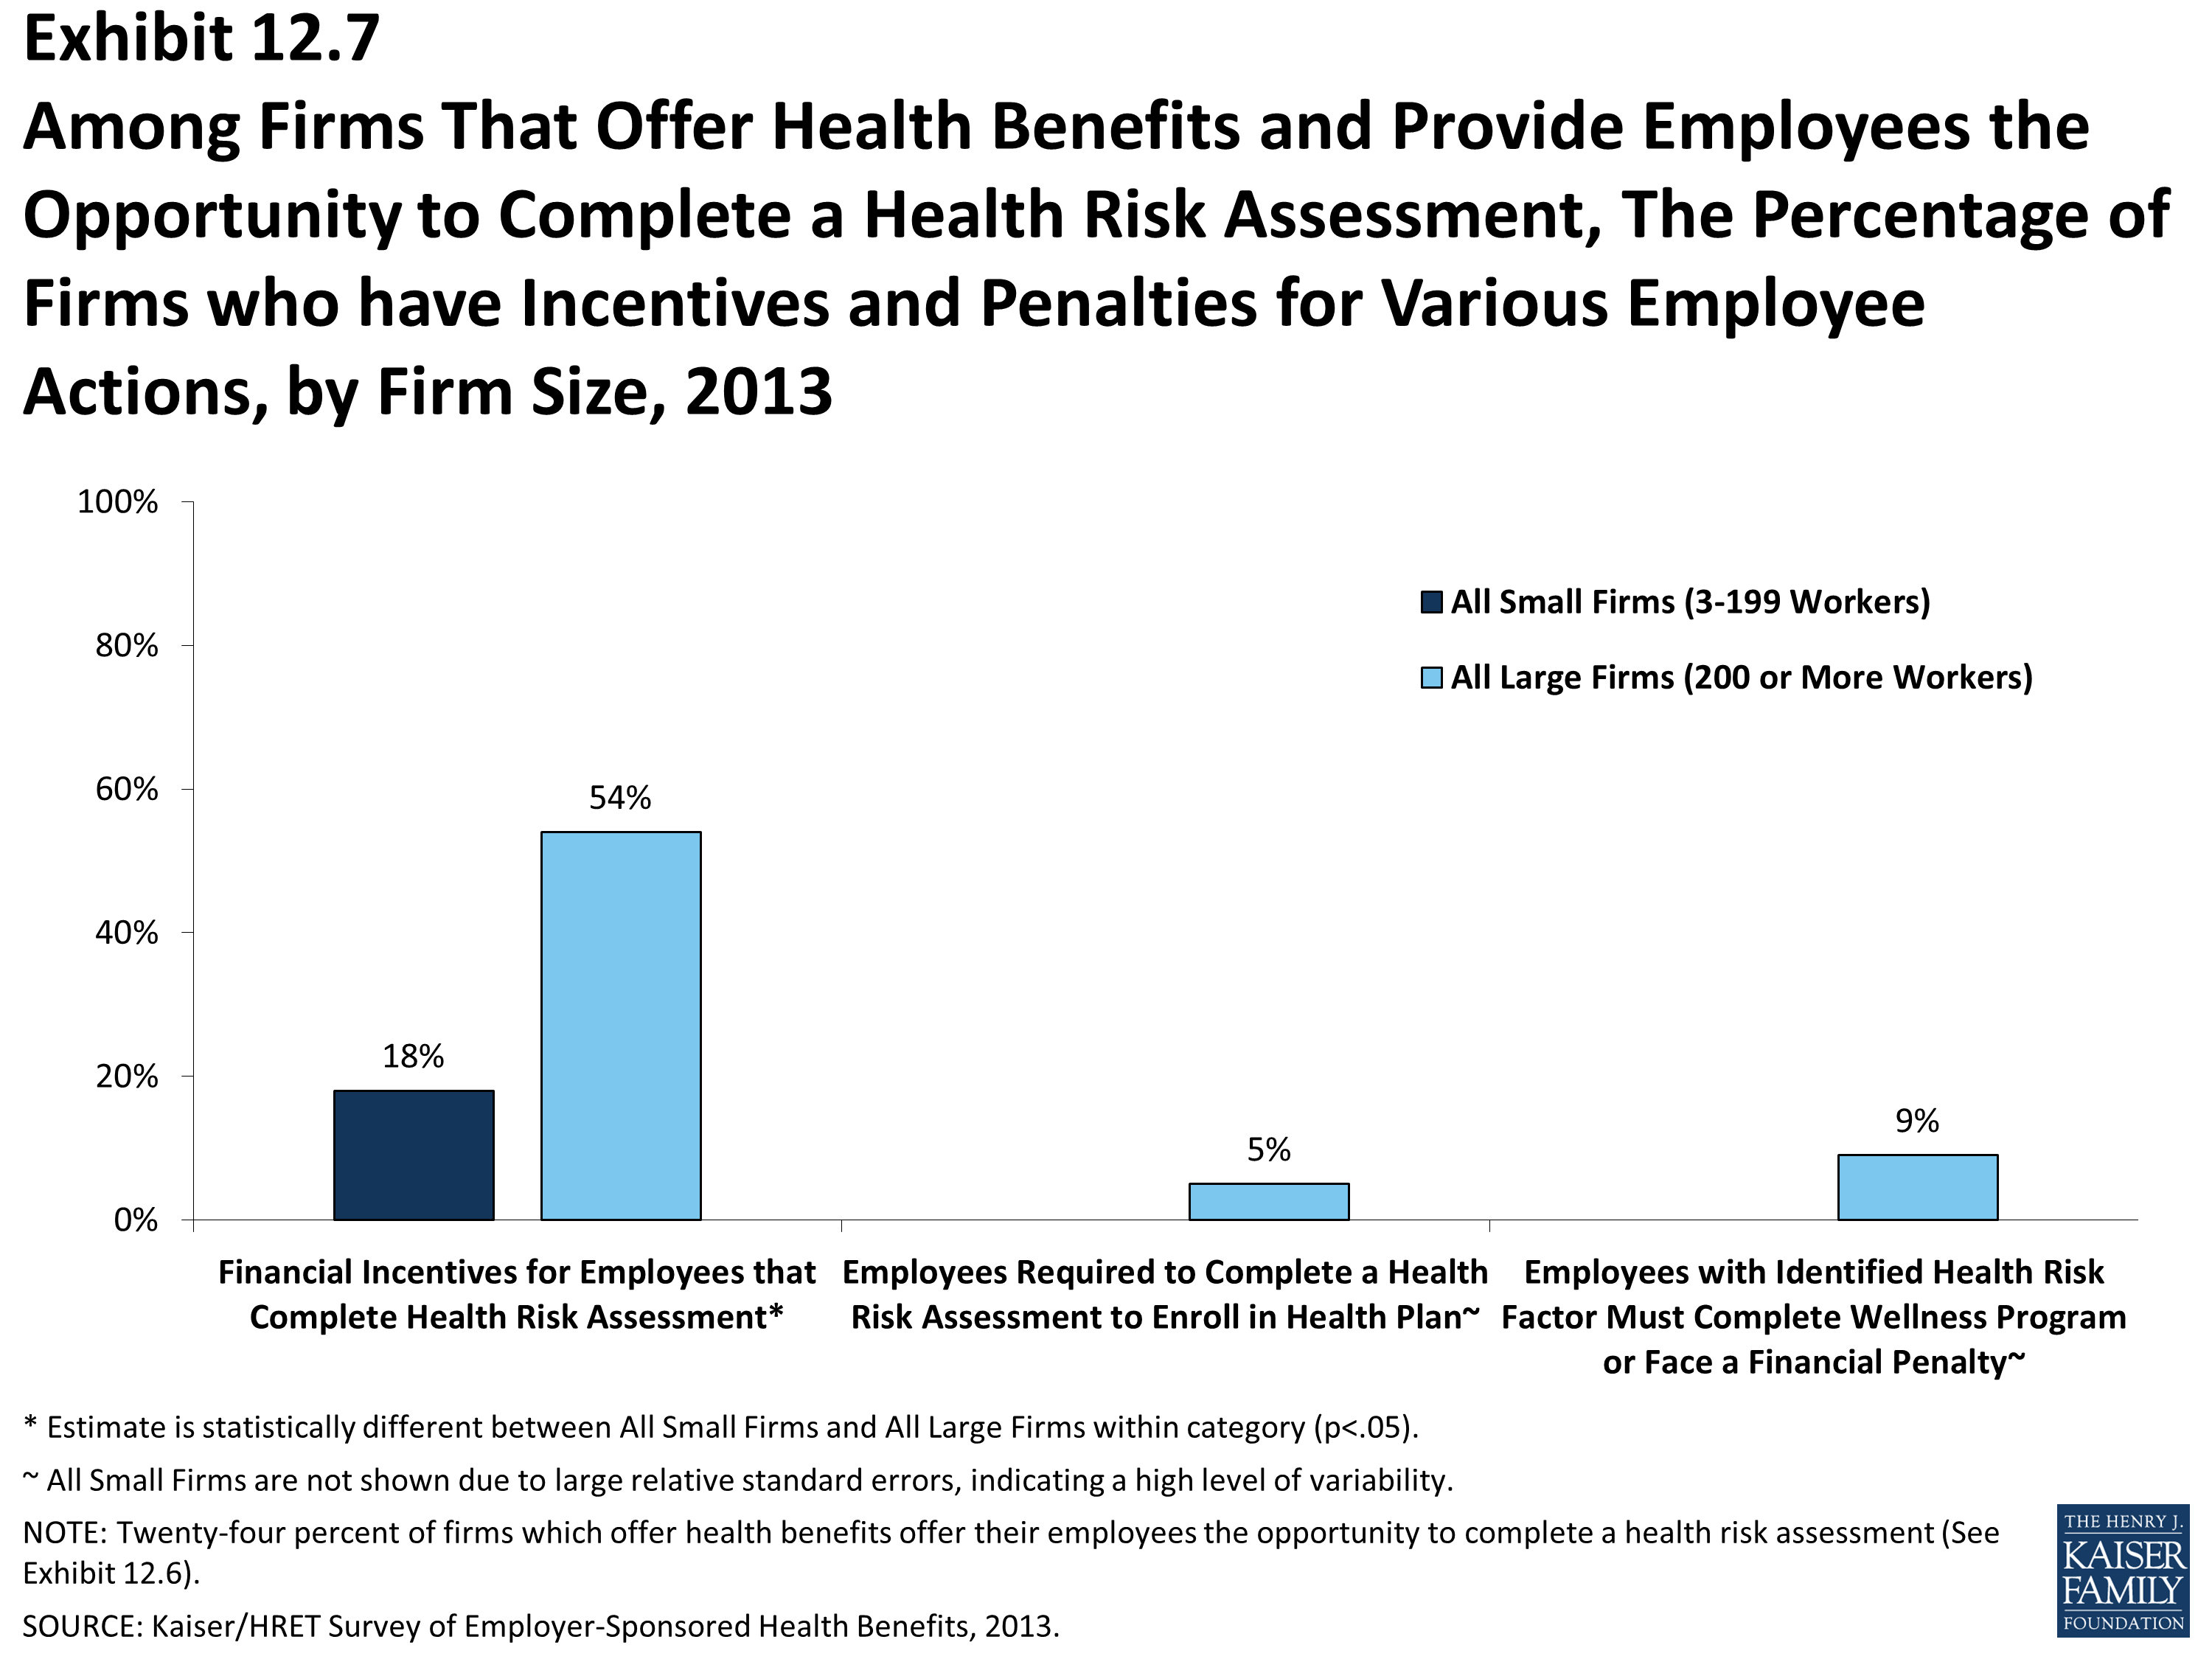
Among Firms That Offer Health Benefits and Provide Employees the Opportunity to Complete a Health Risk Assessment, The Percentage of Firms who have Incentives and Penalties for Various Employee Actions, by Firm Size, 2013
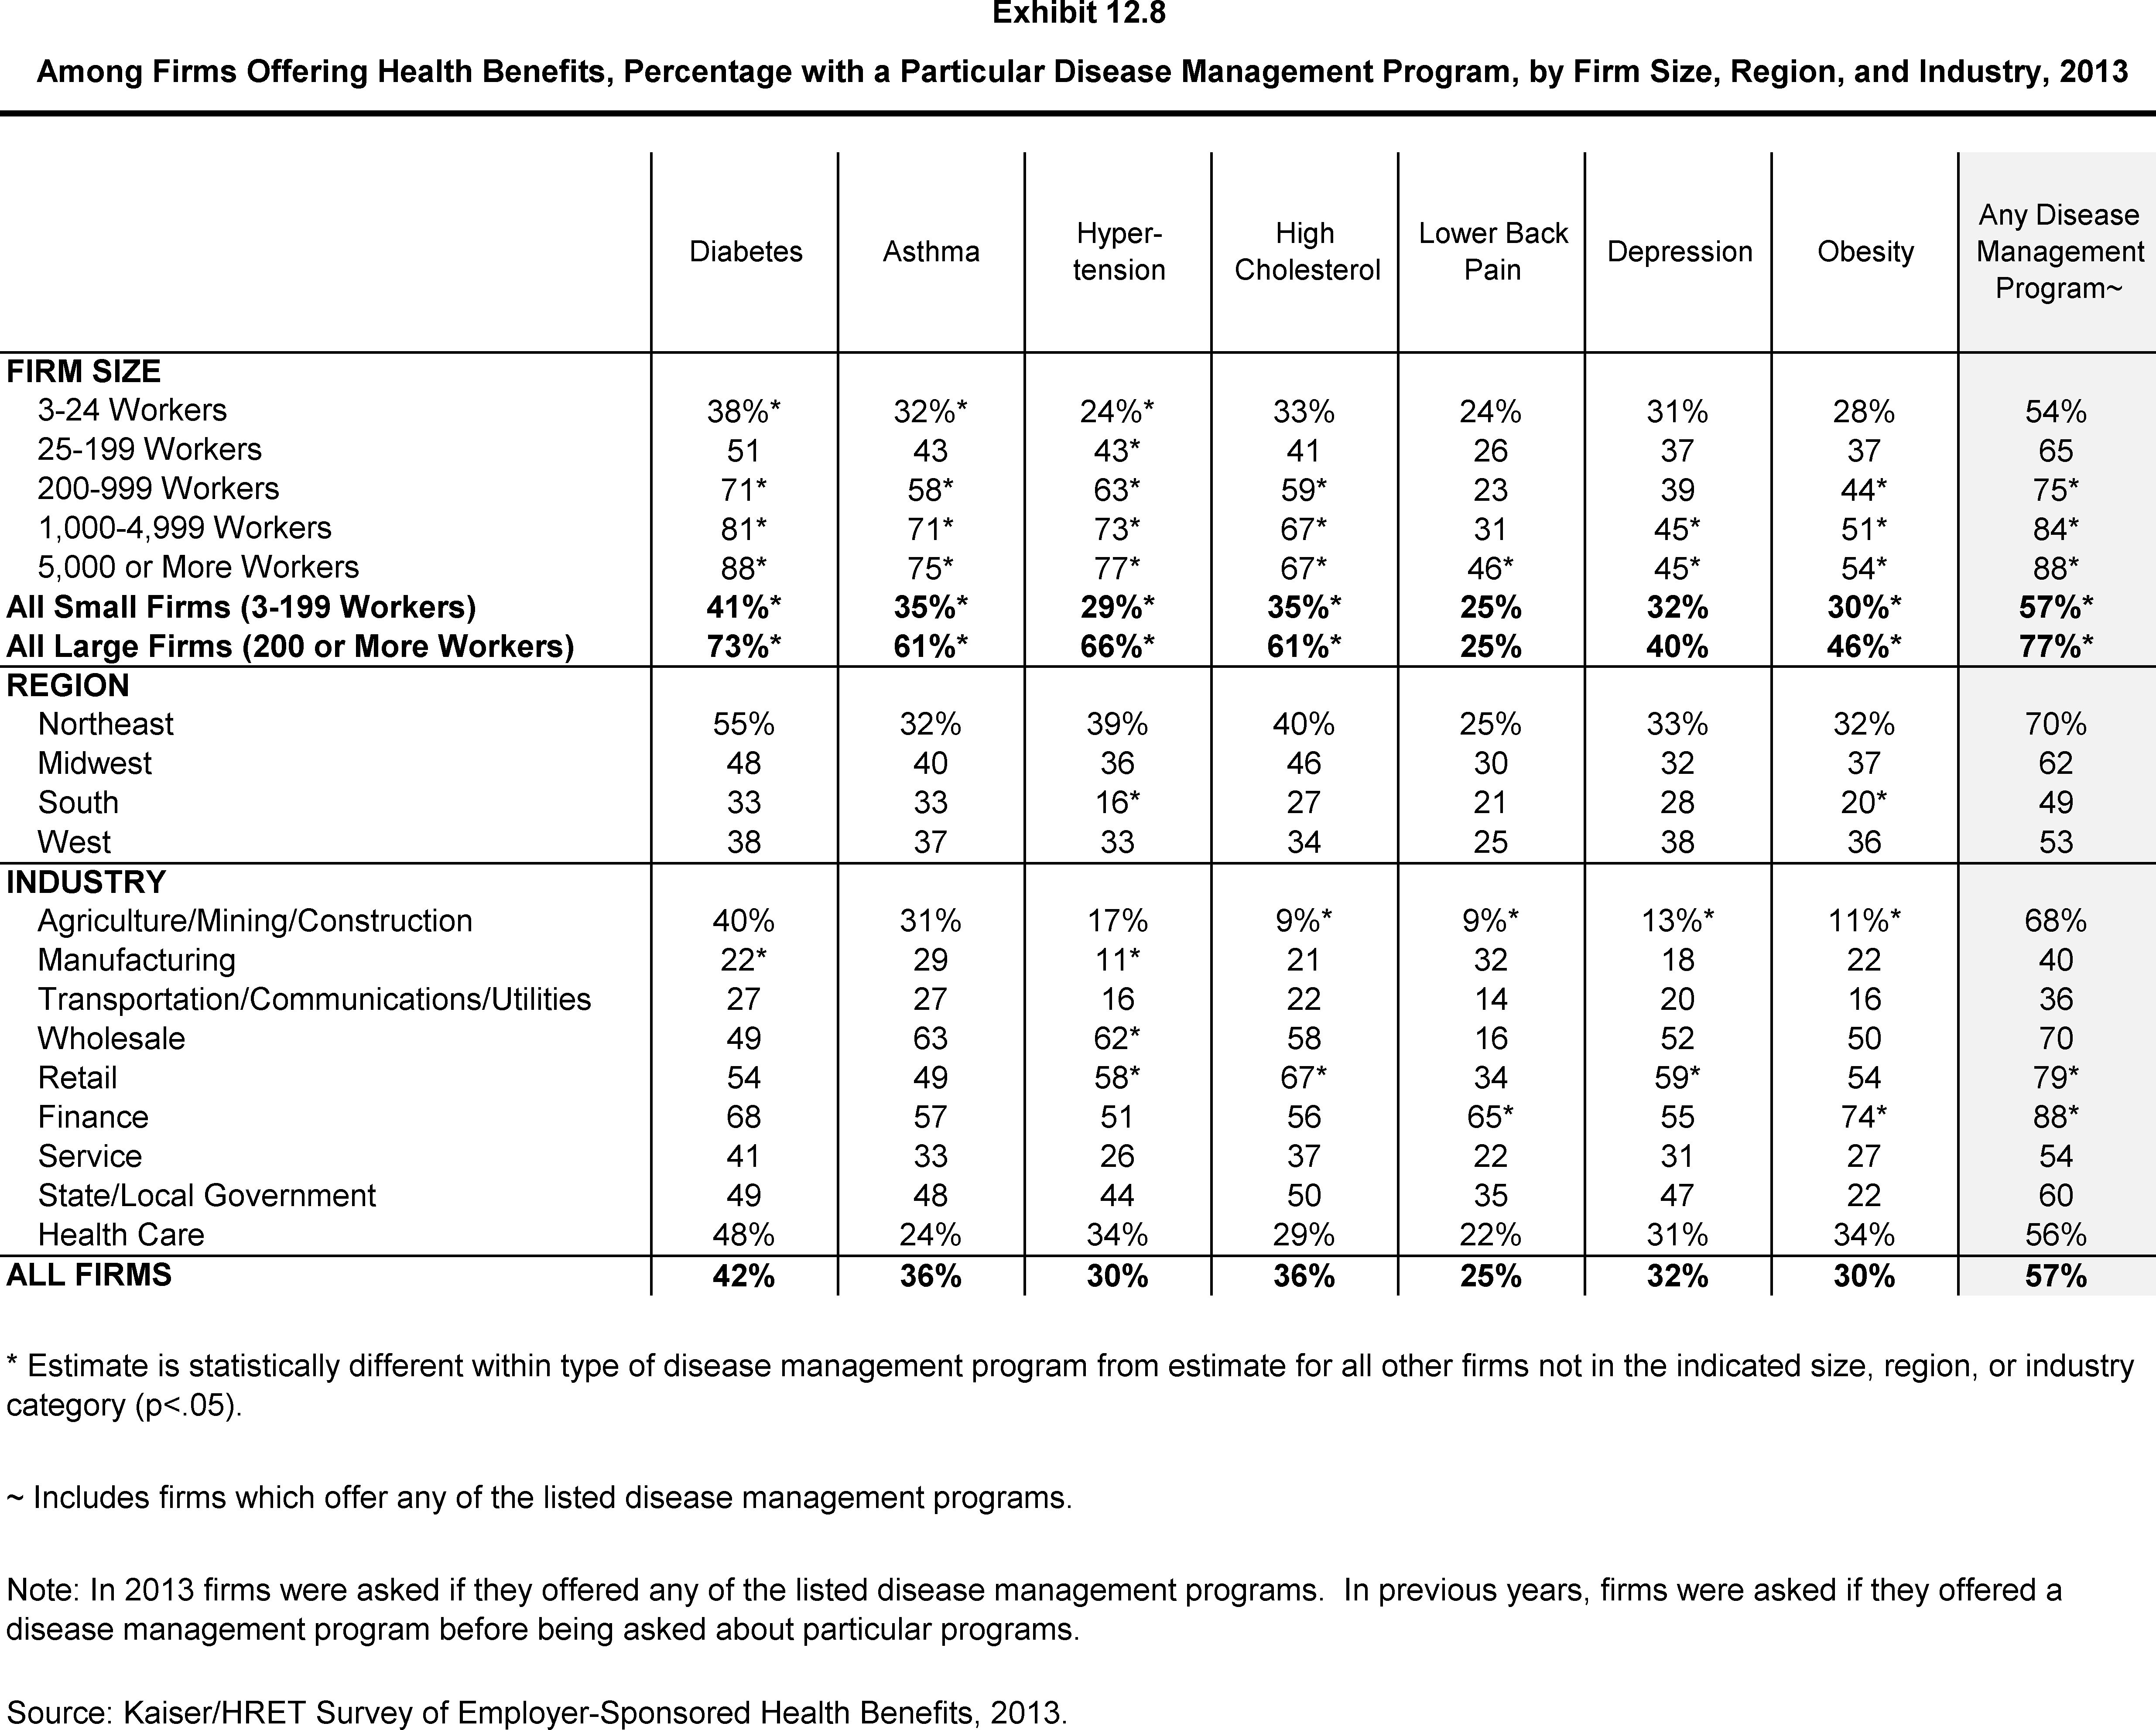
Among Firms Offering Health Benefits, Percentage with a Particular Disease Management Program, by Firm Size, Region, and Industry, 2013
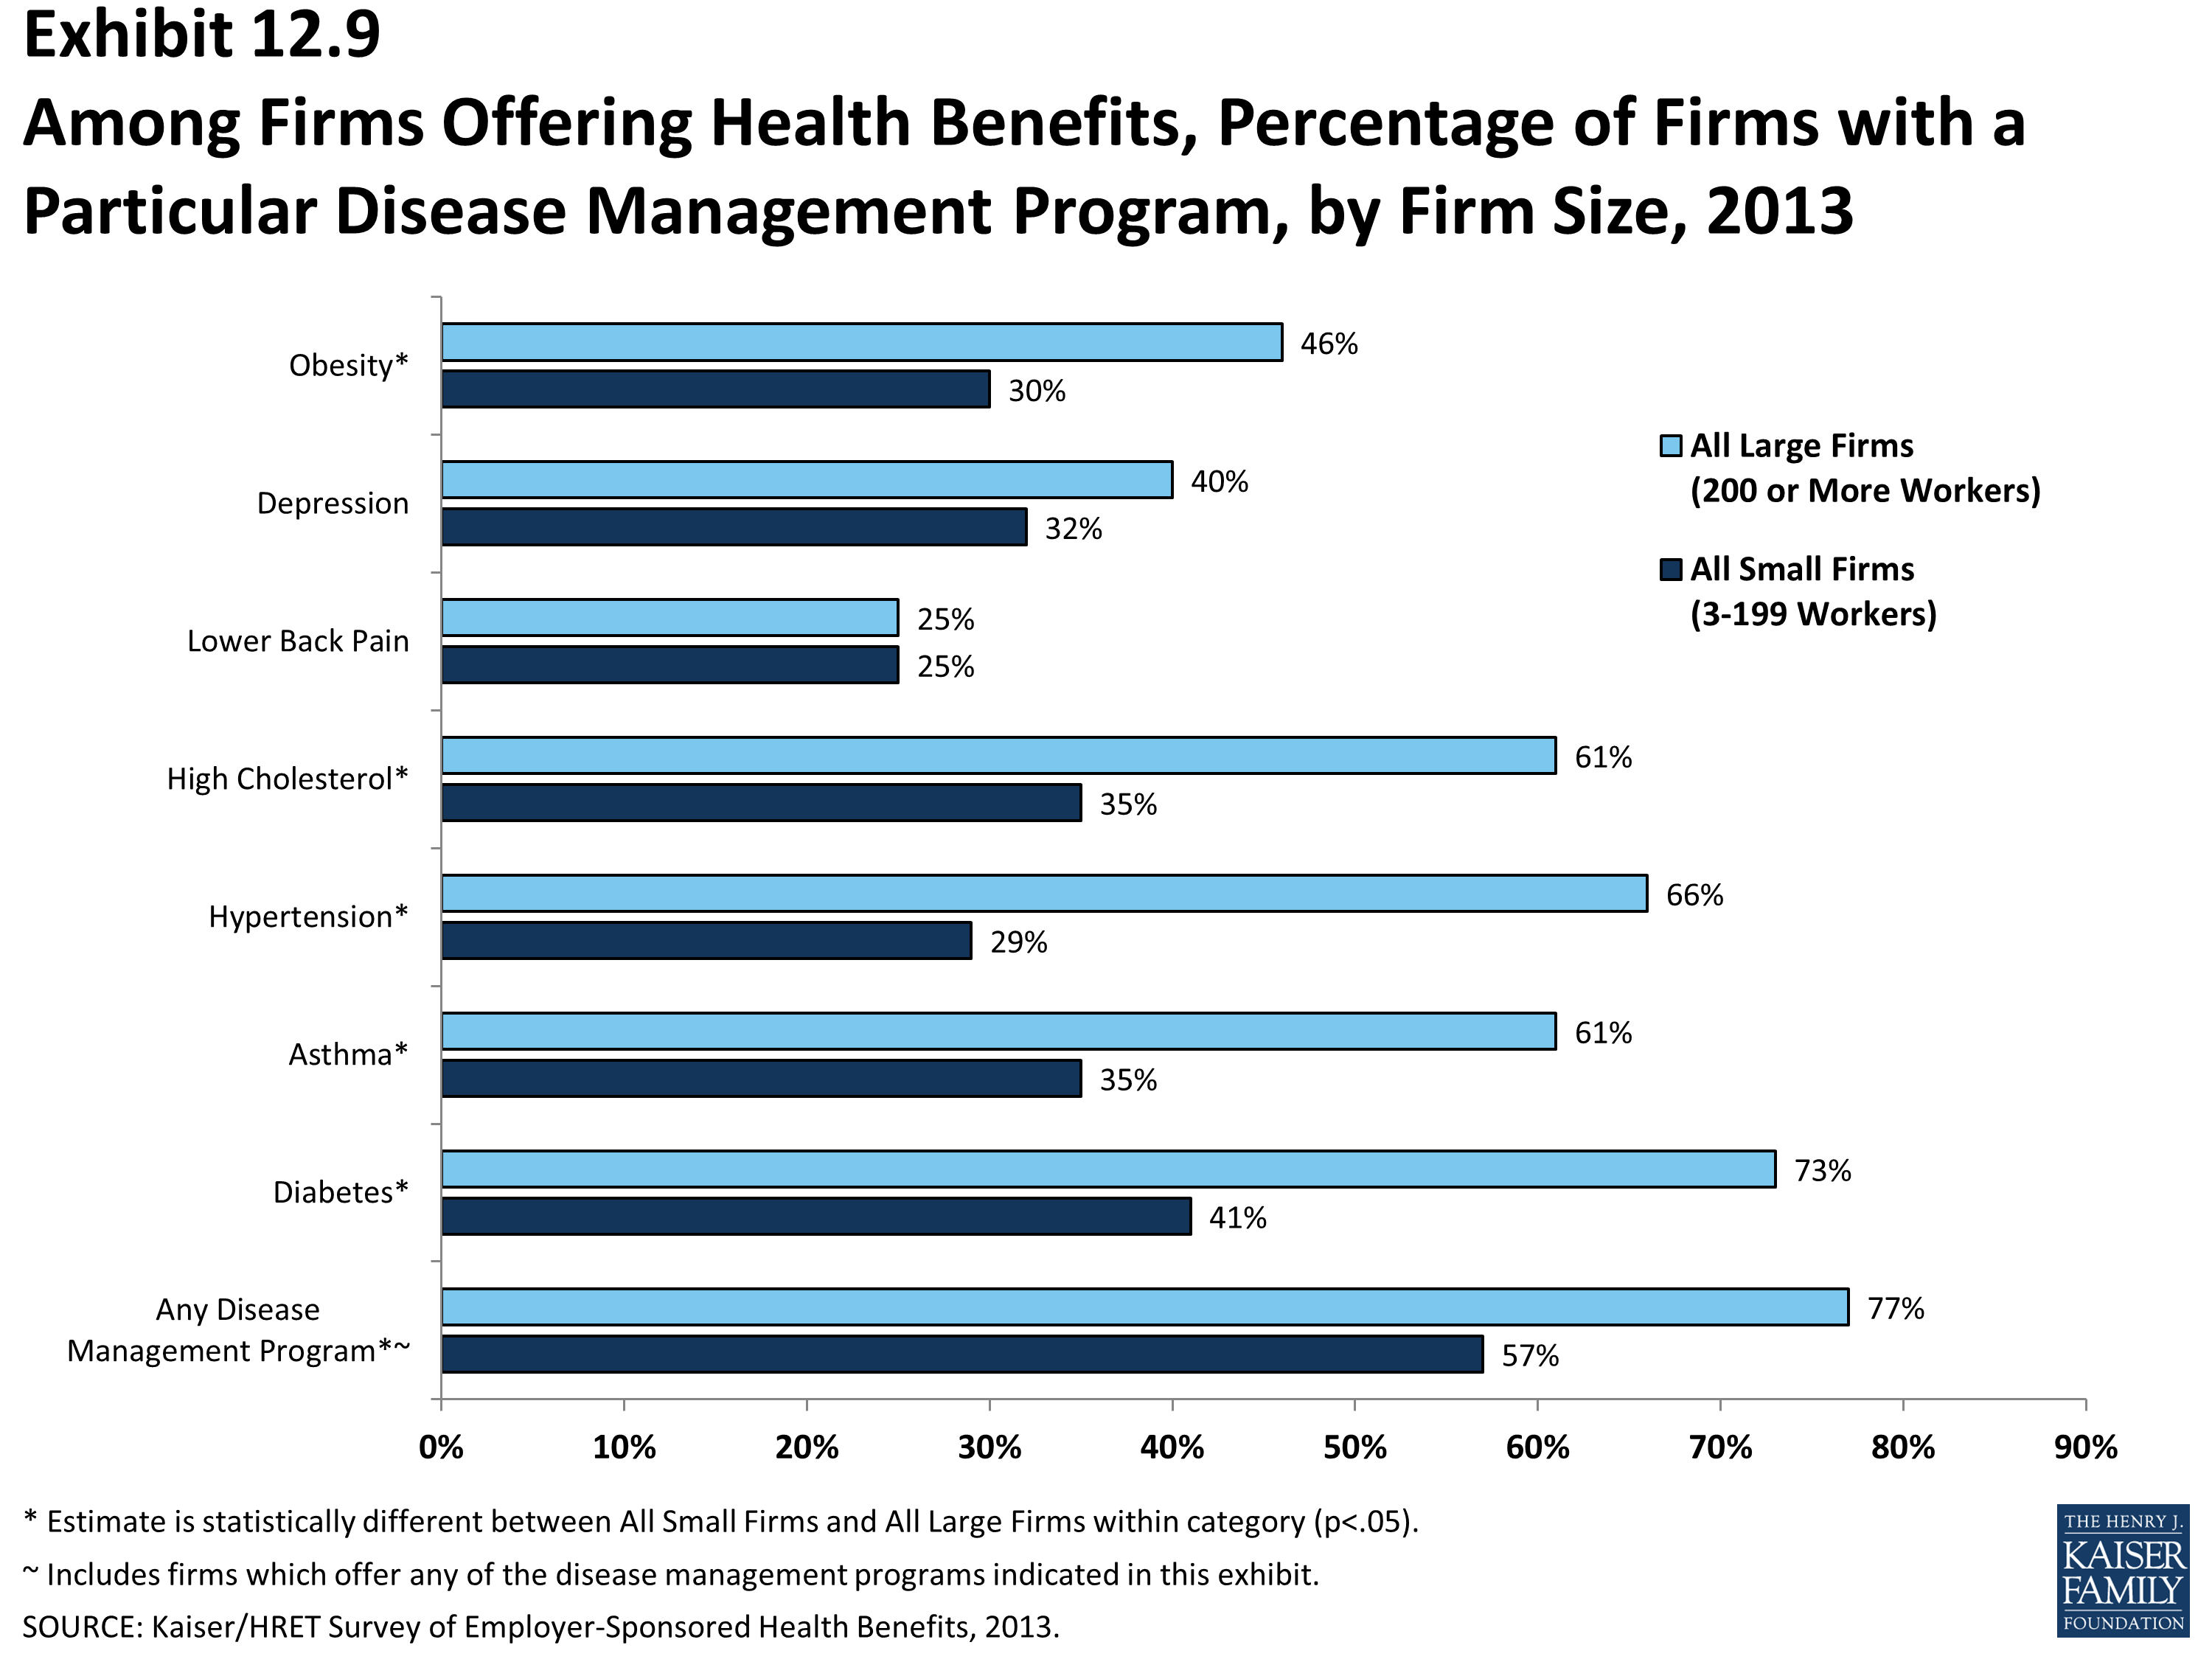
Among Firms Offering Health Benefits, Percentage of Firms with a Particular Disease Management Program, by Firm Size, 2013
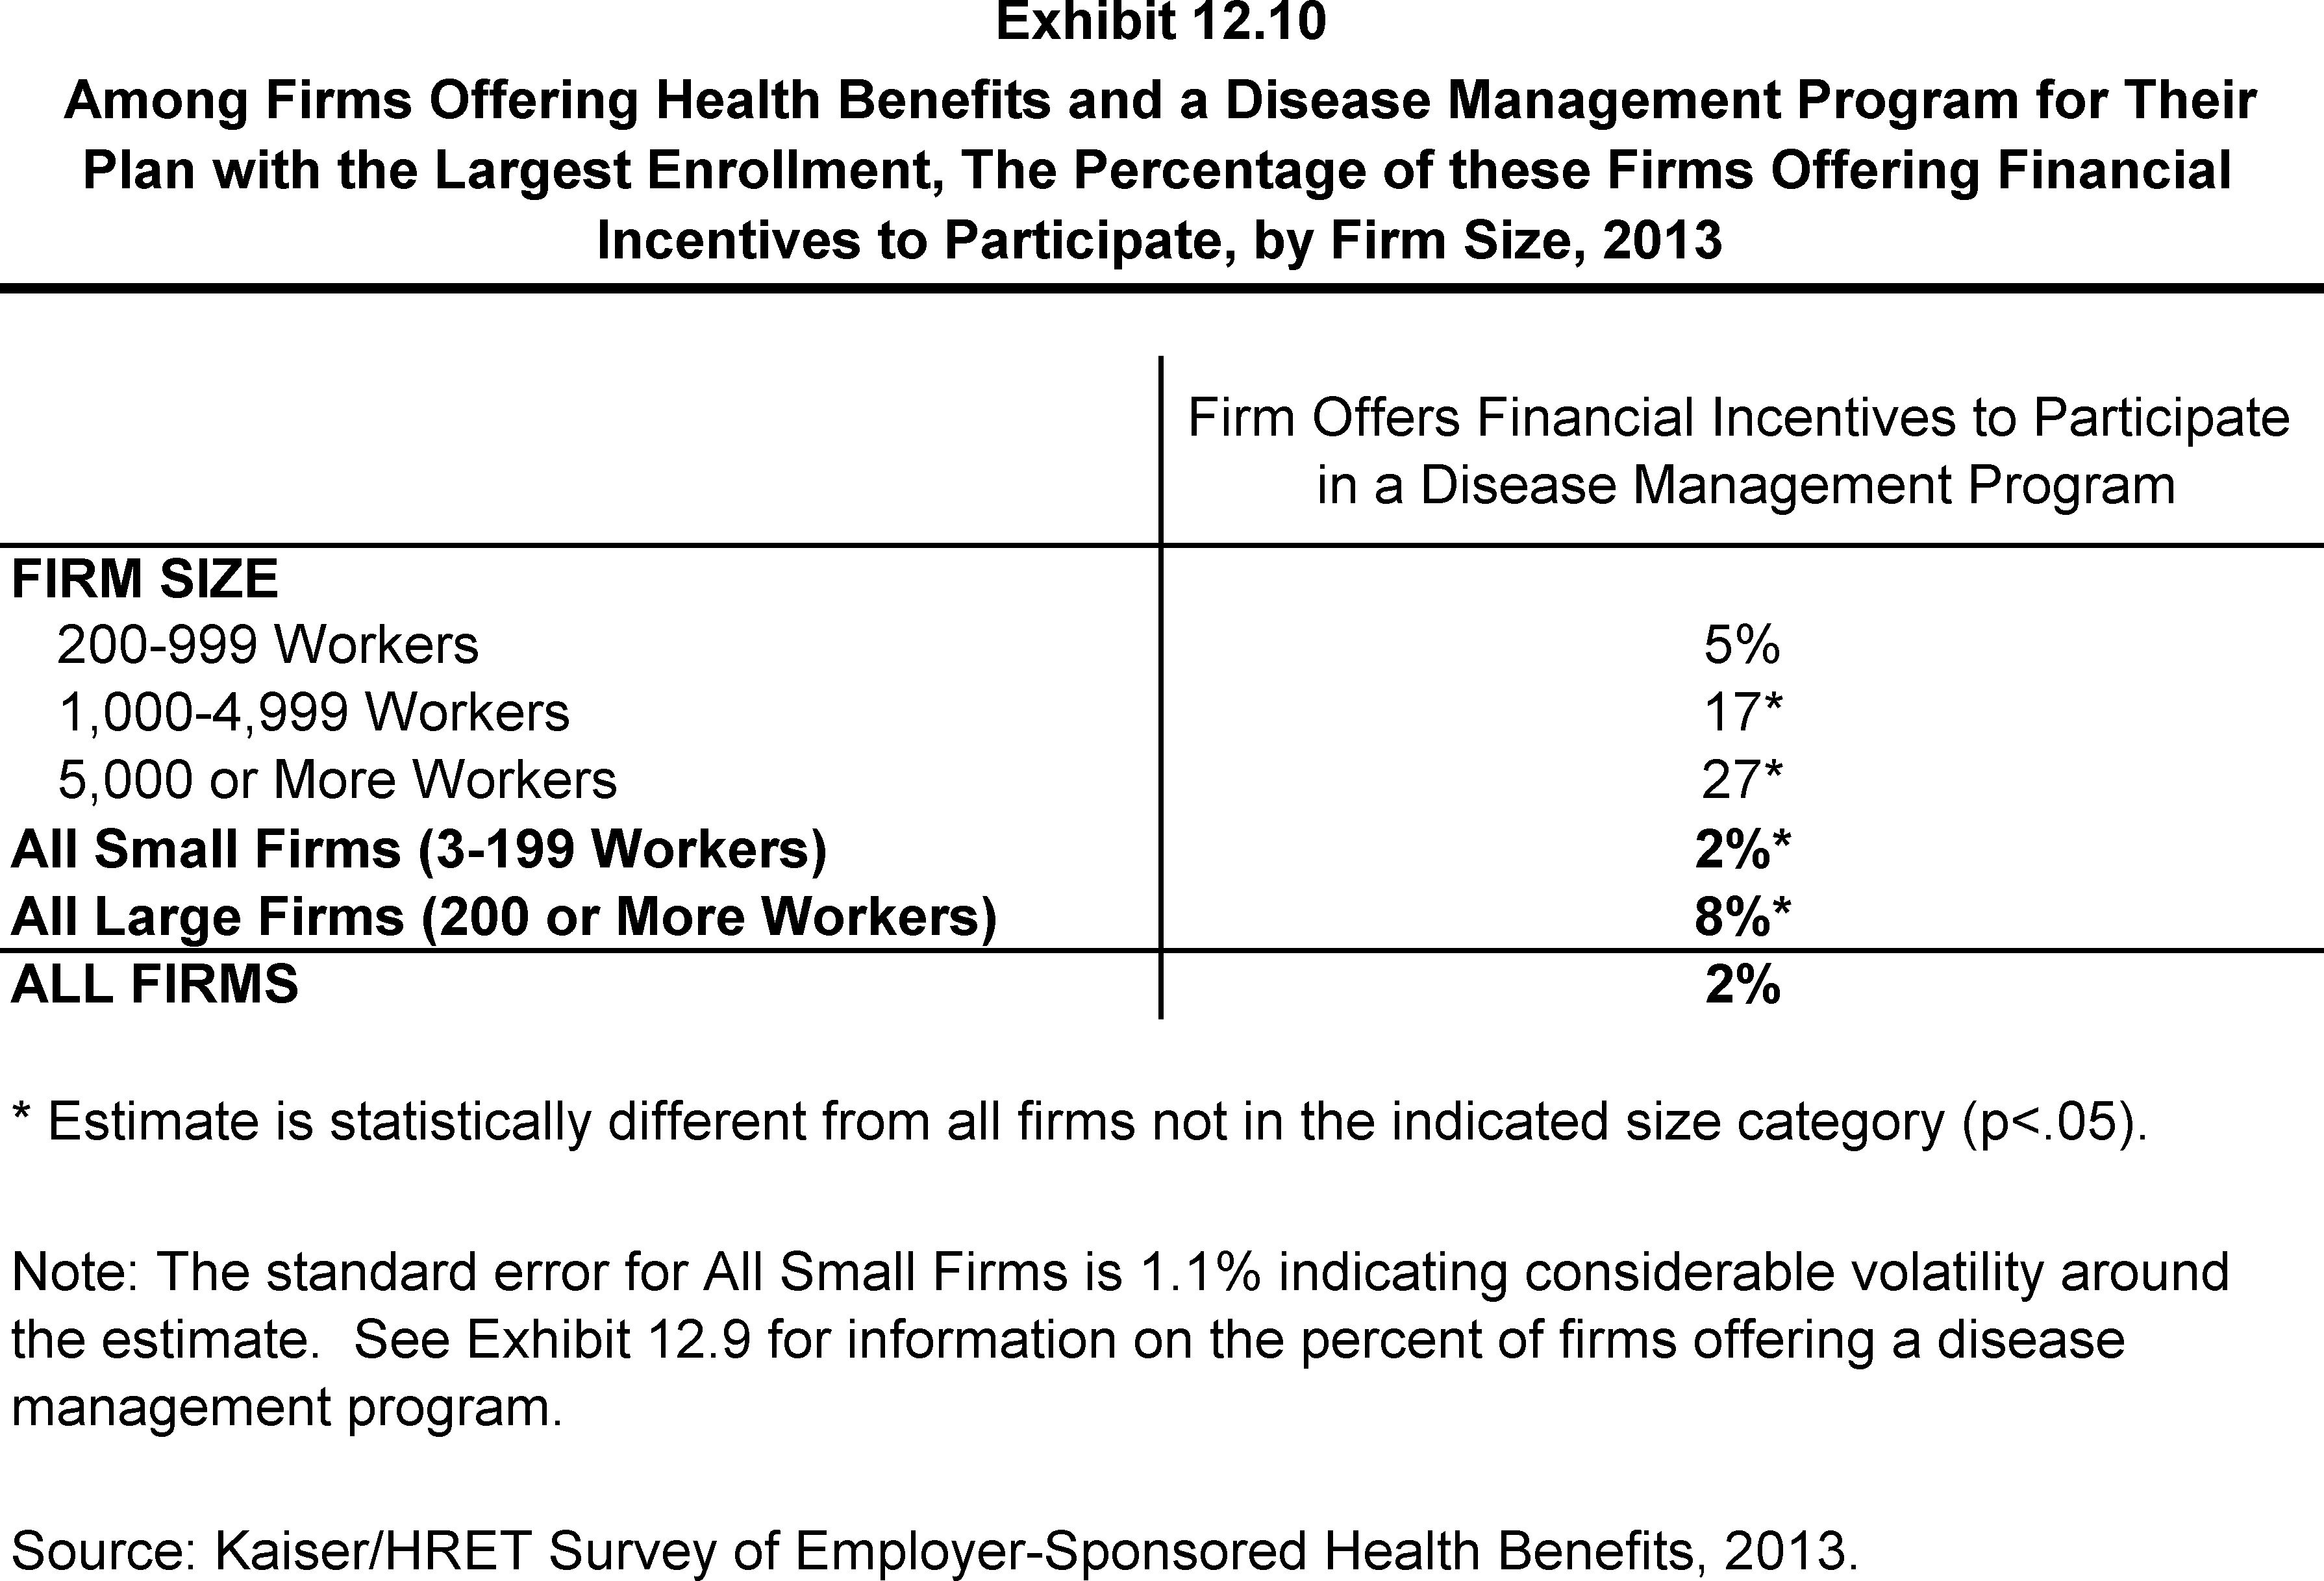
Among Firms Offering Health Benefits and a Disease Management Program for Their Plan with the Largest Enrollment, The Percentage of these Firms Offering Financial Incentives to Participate, by Firm Size, 2013
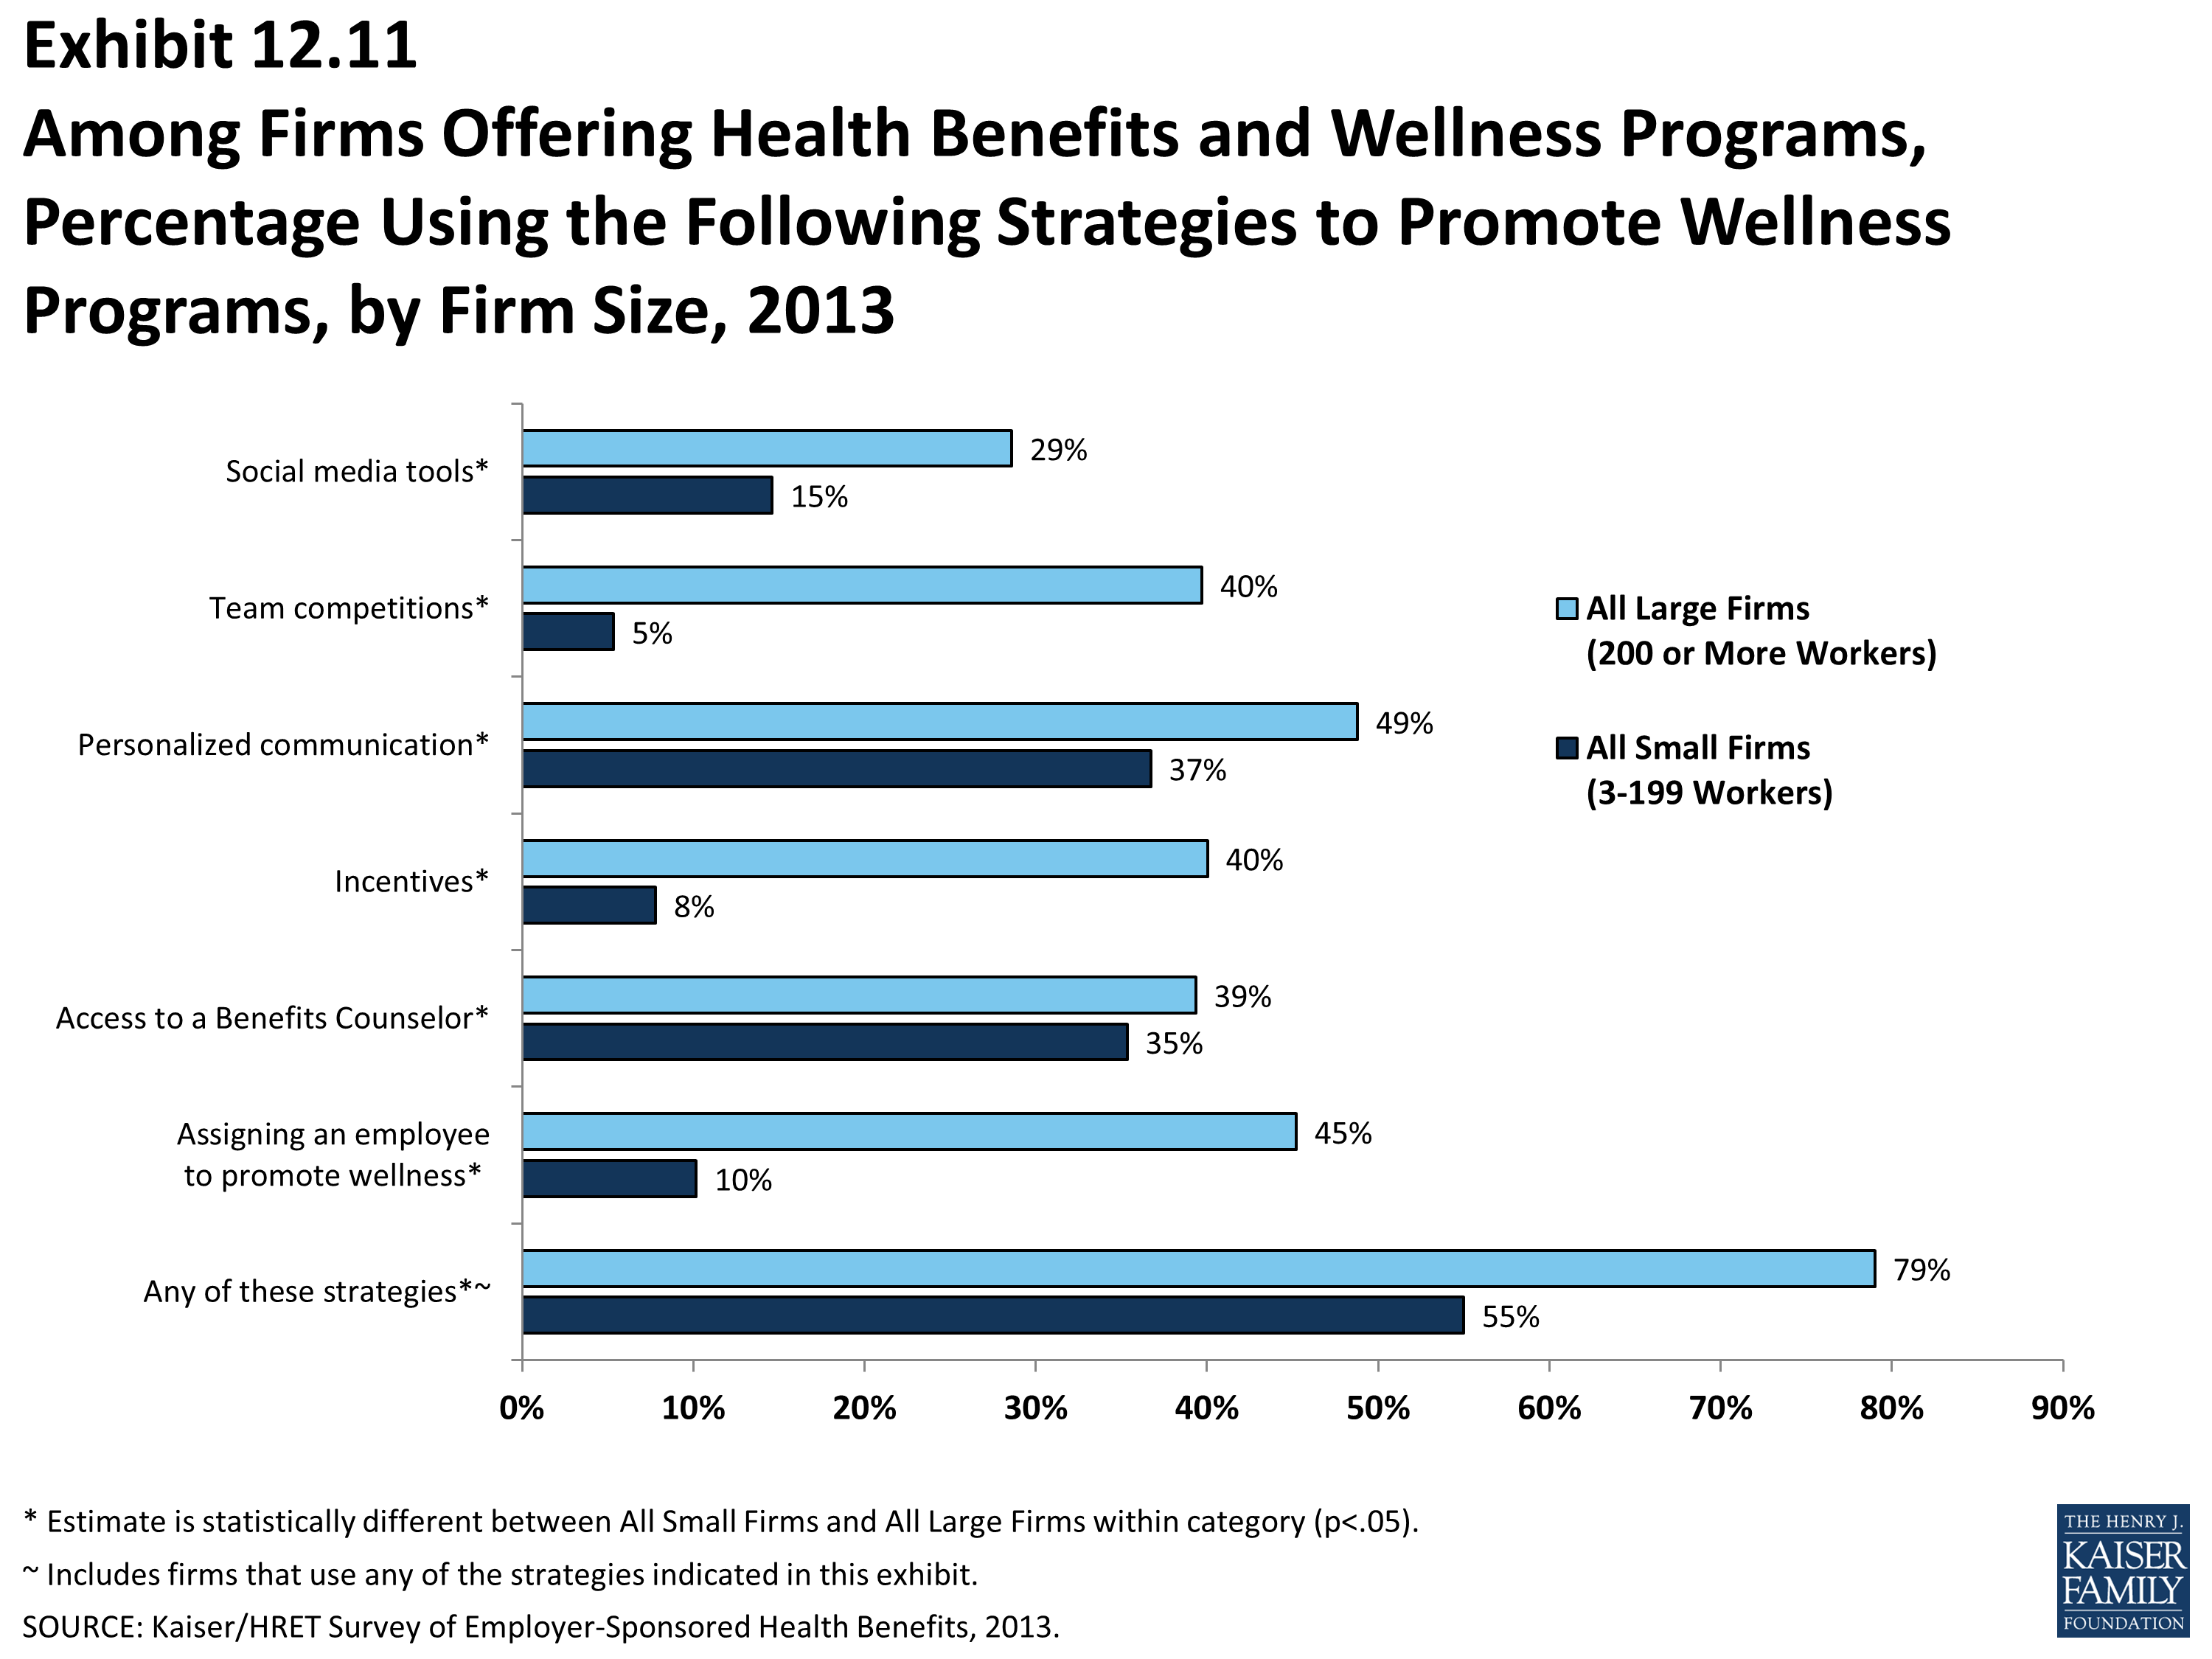
Among Firms Offering Health Benefits and Wellness Programs, Percentage Using the Following Strategies to Promote Wellness Programs, by Firm Size, 2013
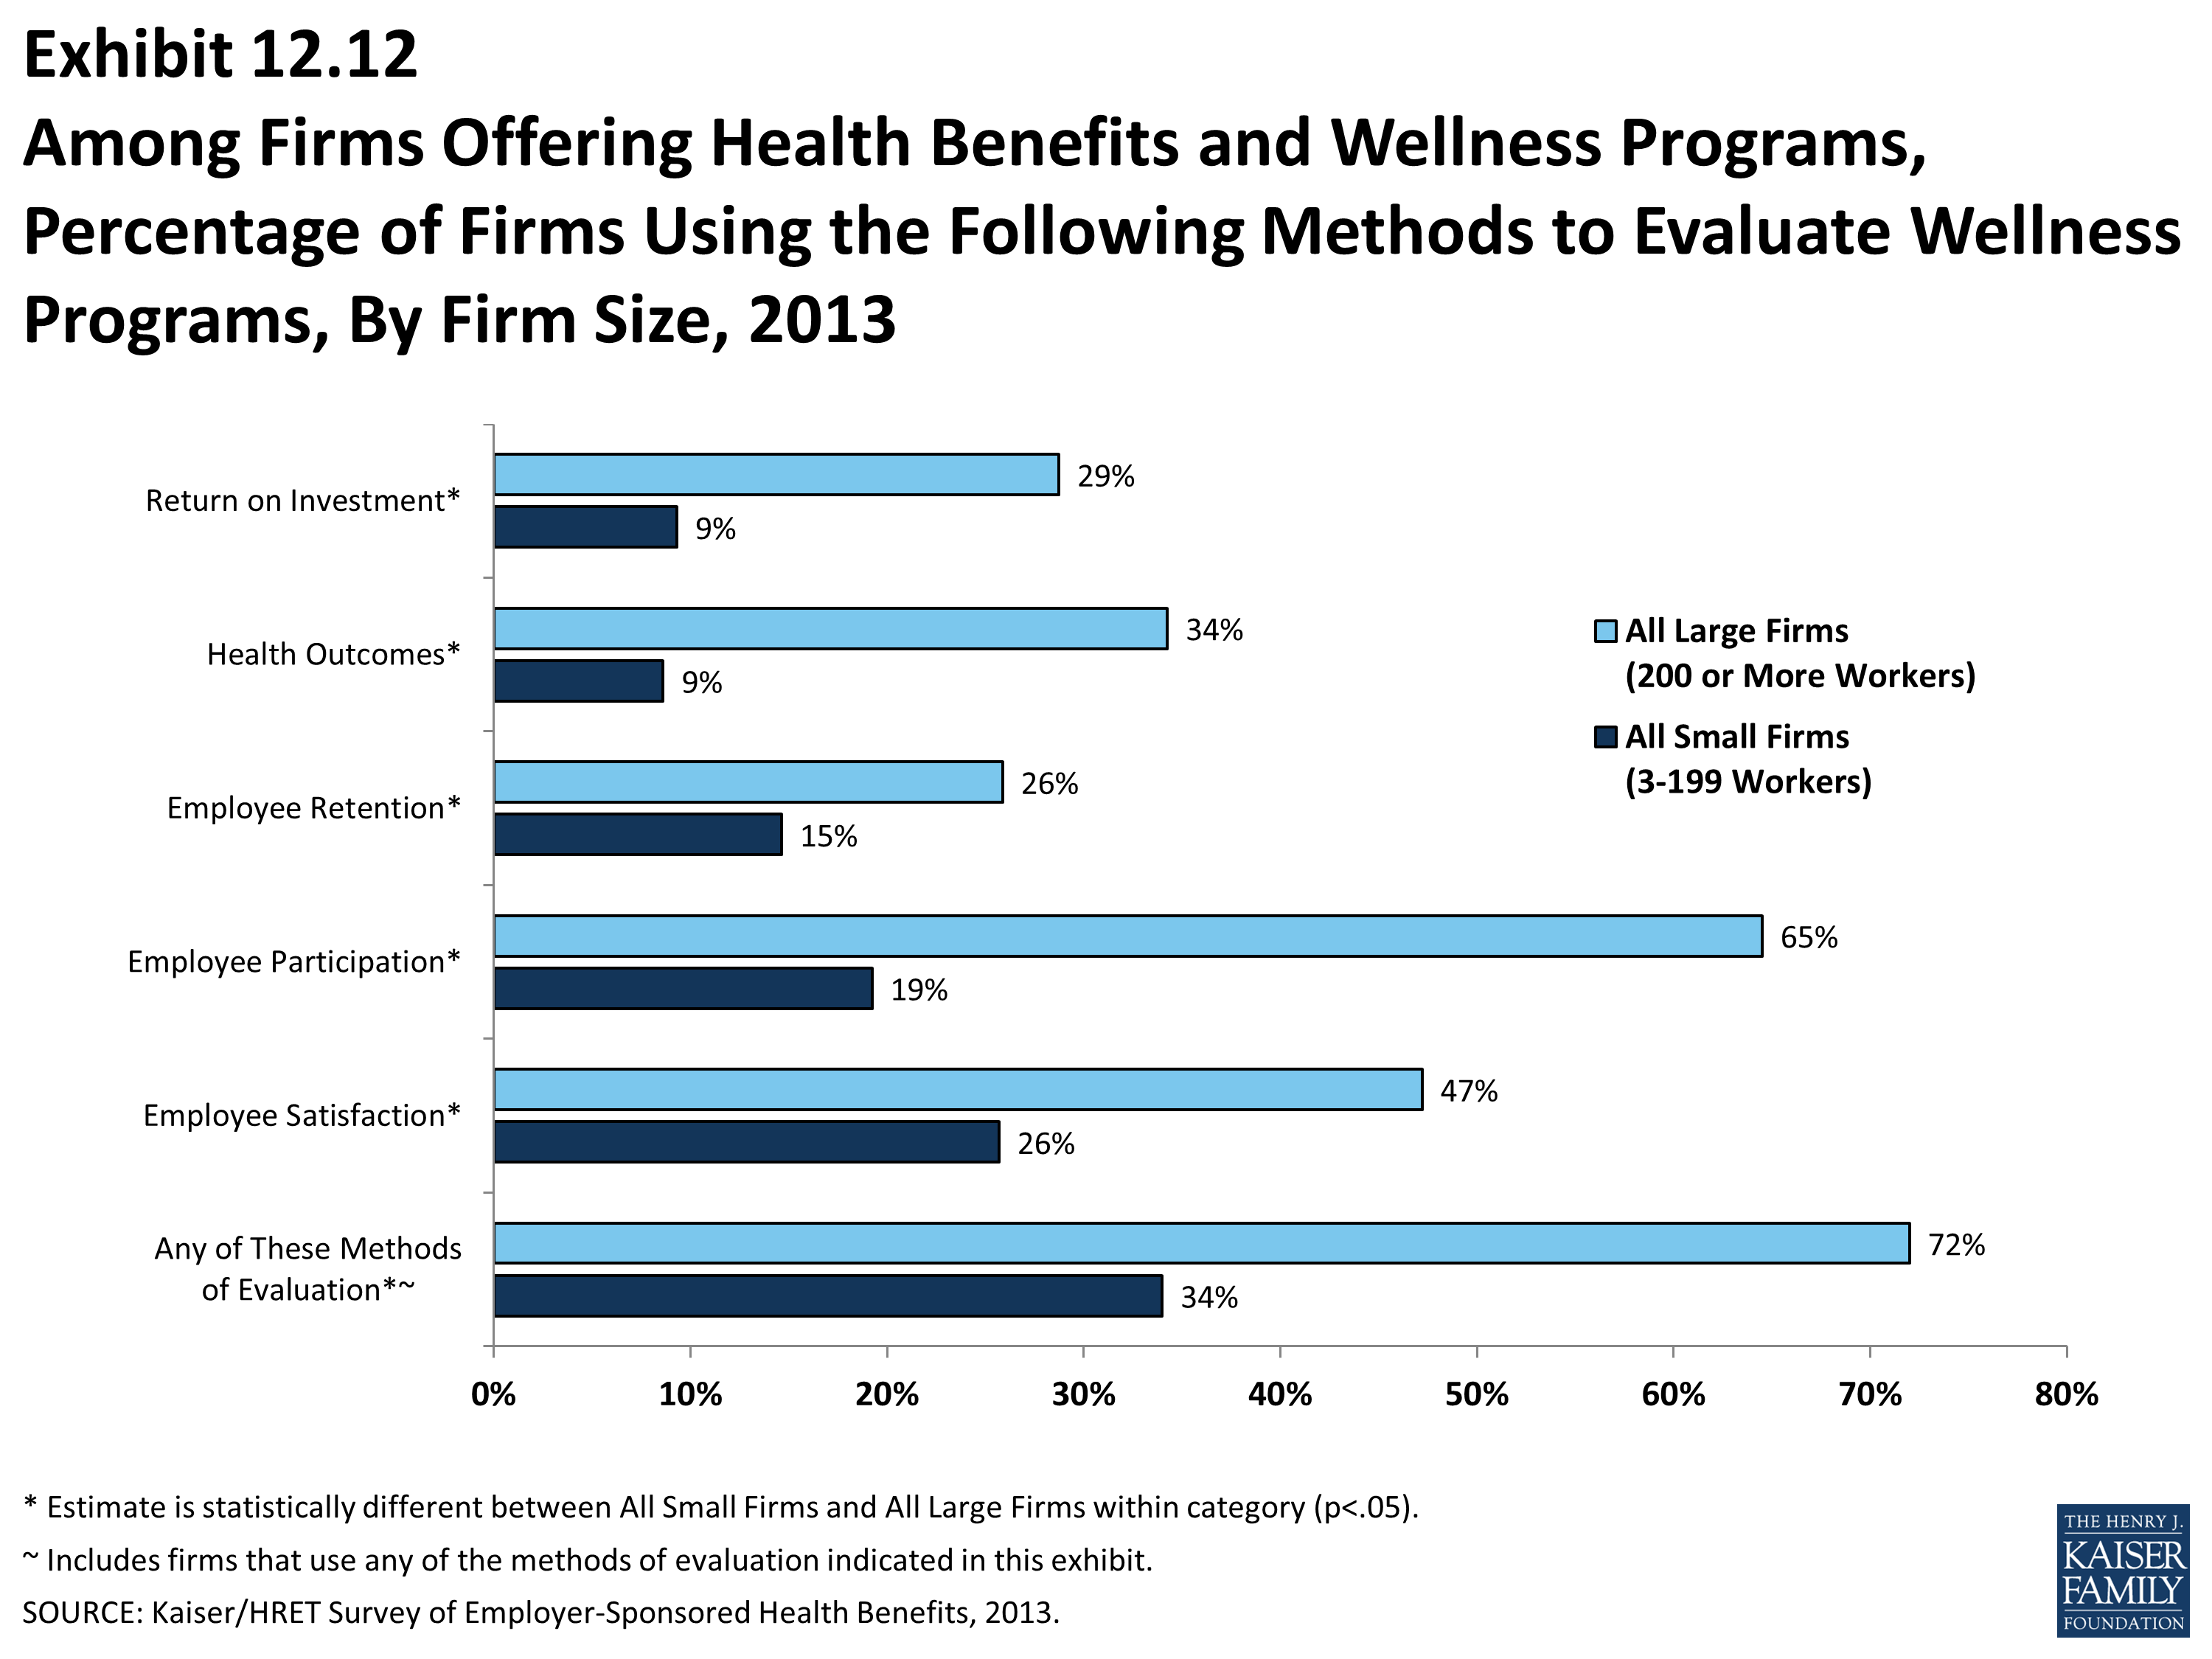
Among Firms Offering Health Benefits and Wellness Programs, Percentage of Firms Using the Following Methods to Evaluate Wellness Programs, By Firm Size, 2013
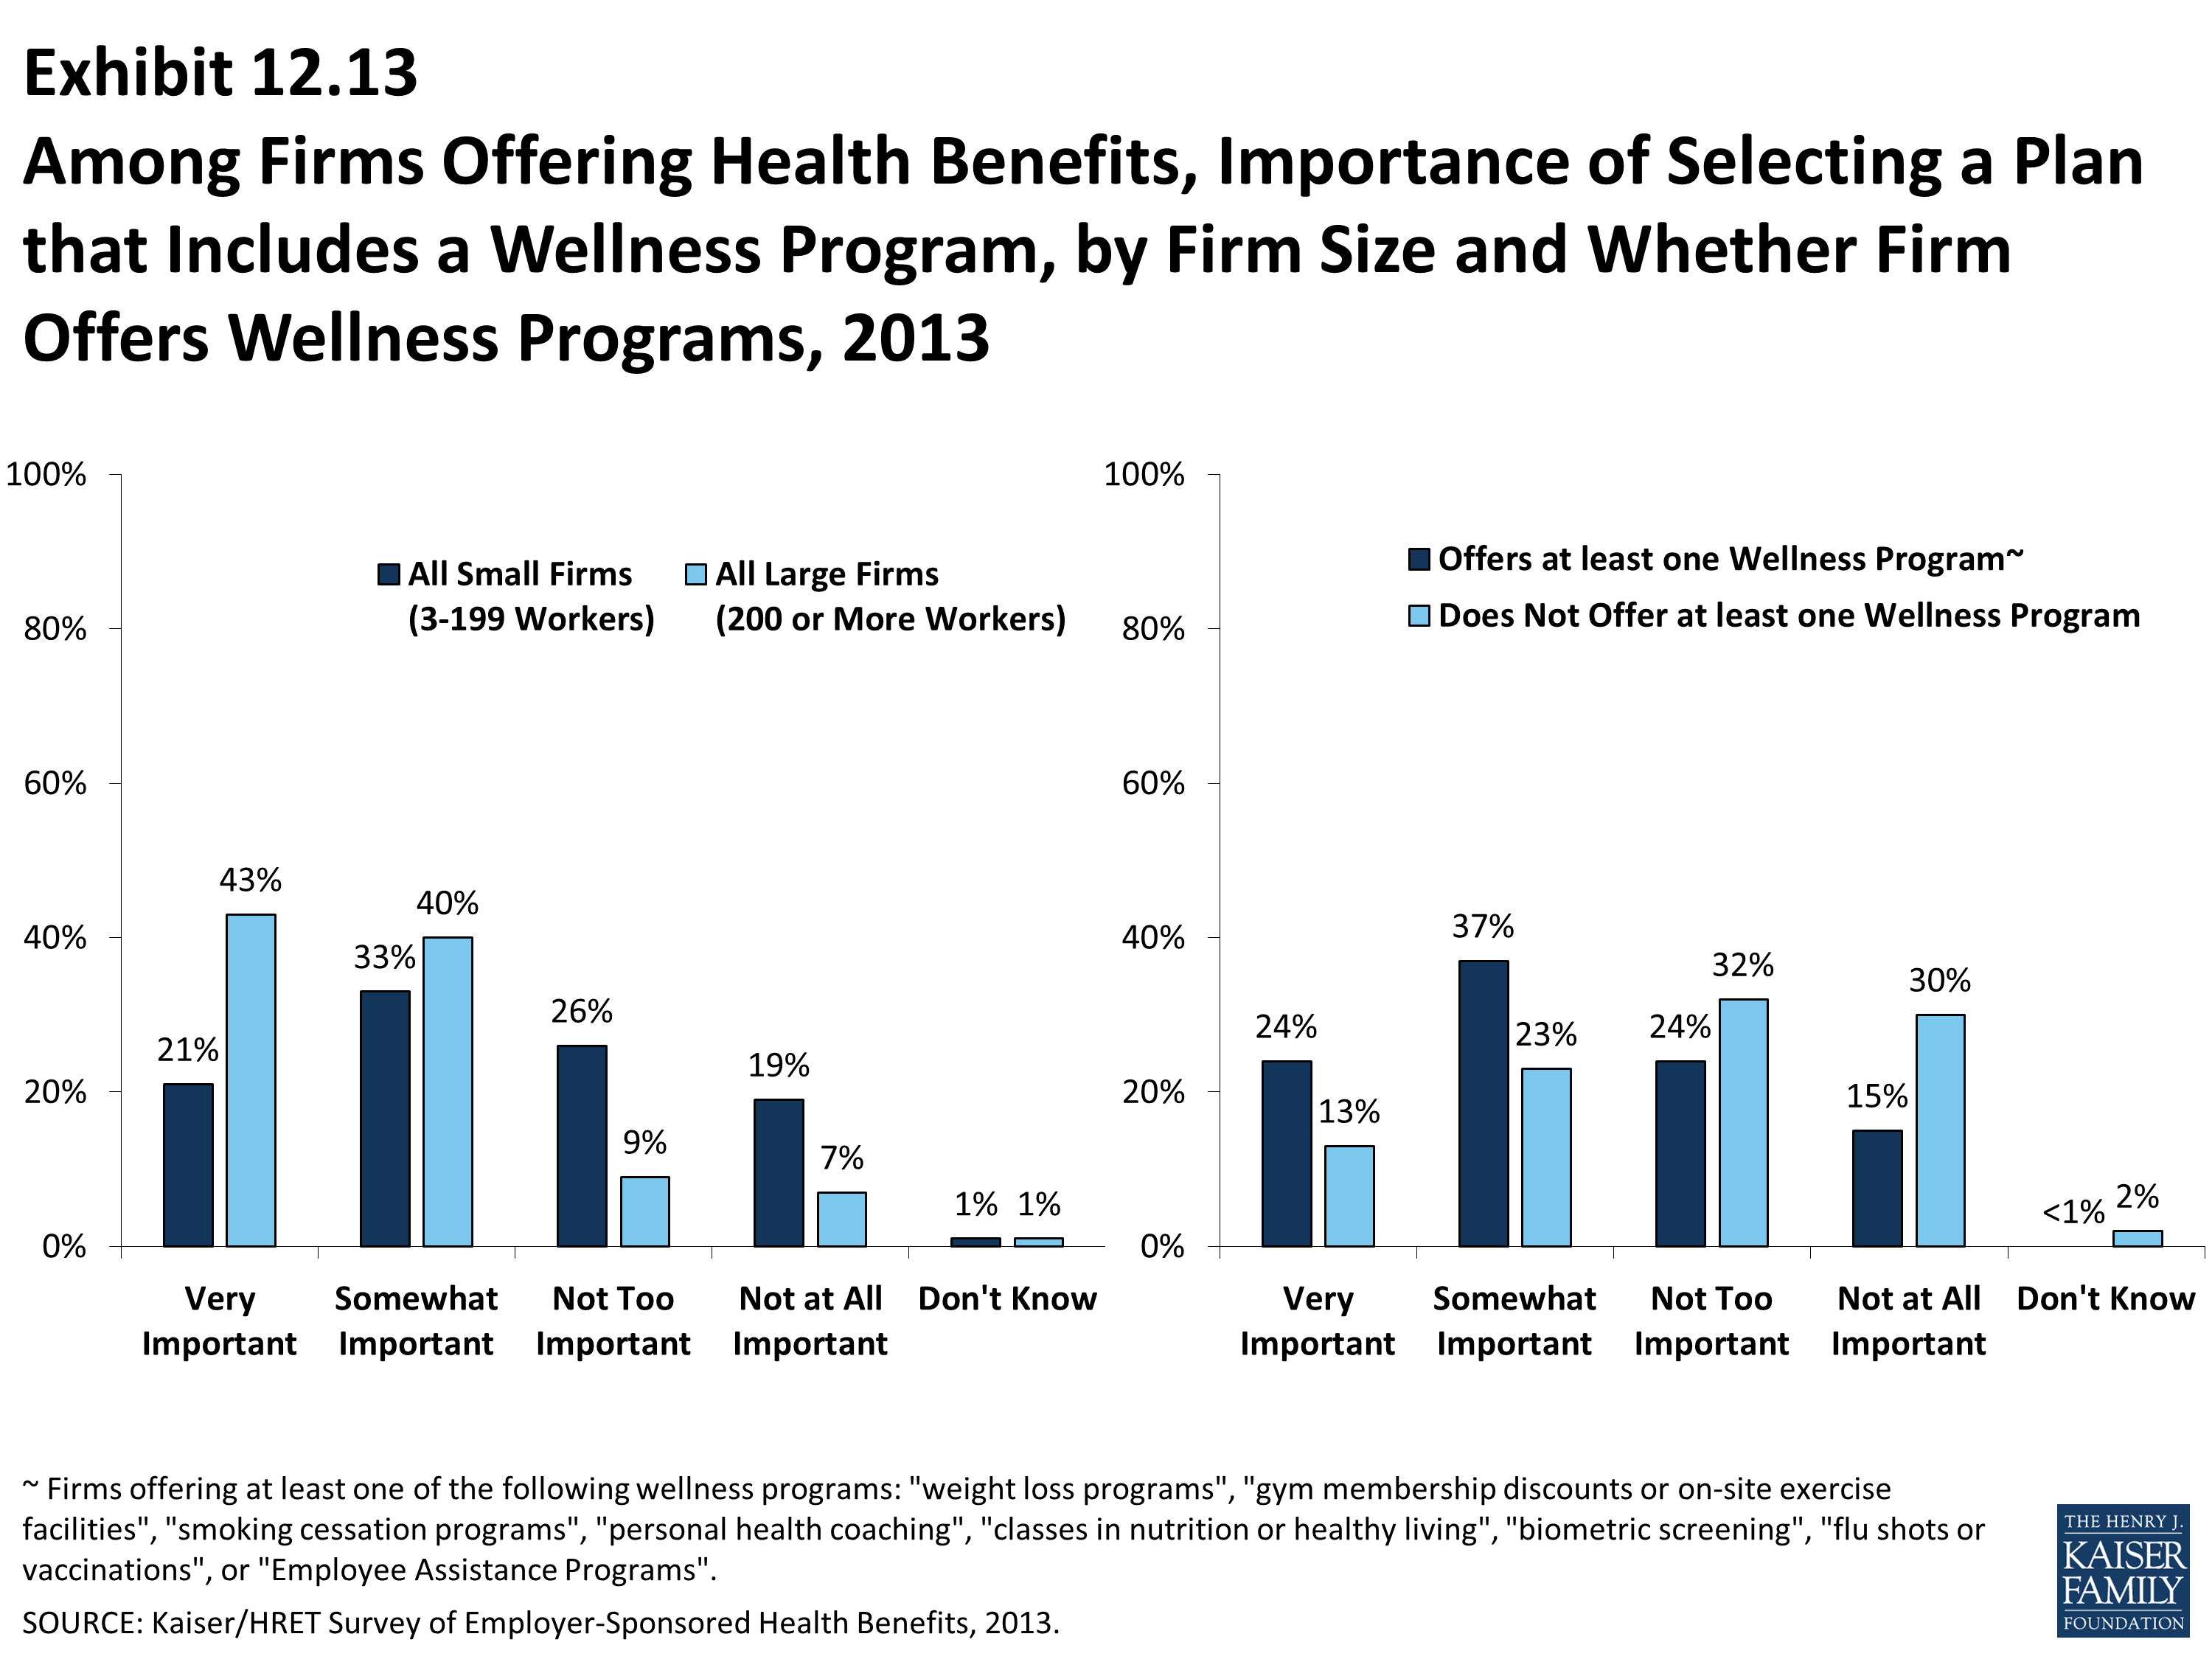
Among Firms Offering Health Benefits, Importance of Selecting a Plan that Includes a Wellness Program, by Firm Size and Whether Firm Offers Wellness Programs, 2013
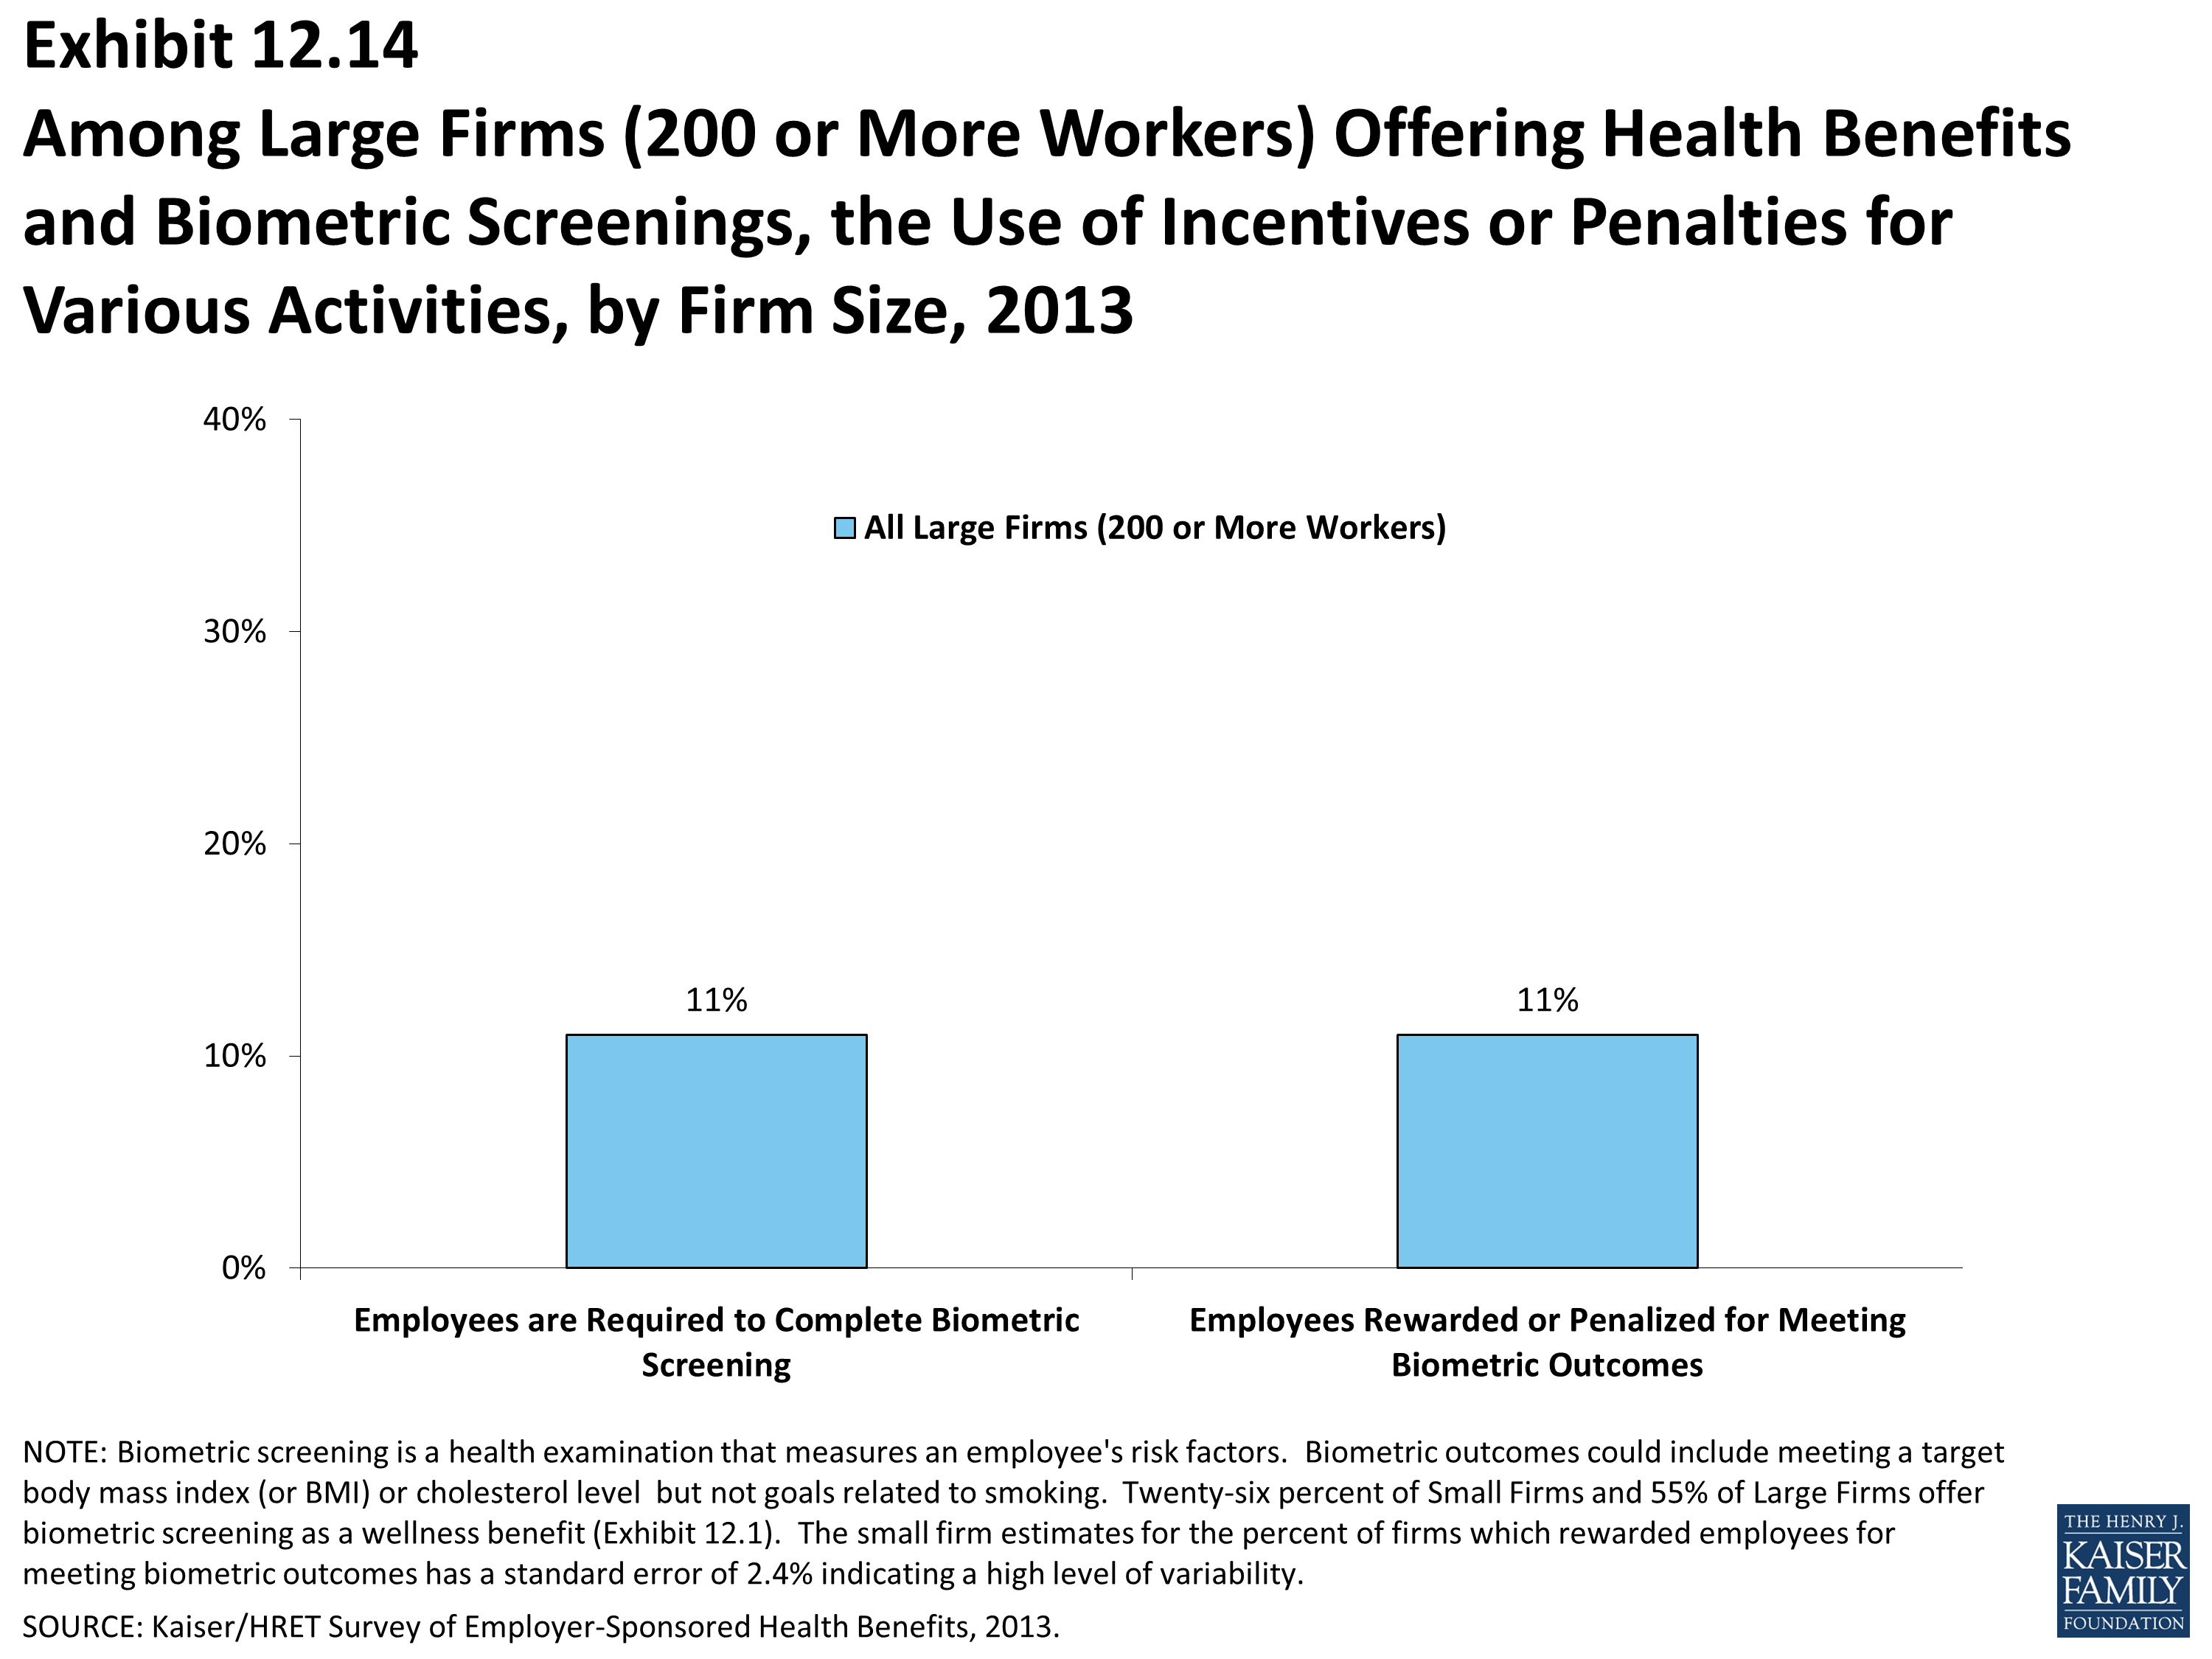
Among Large Firms (200 or More Workers) Offering Health Benefits and Biometric Screenings, the Use of Incentives or Penalties for Various Activities, by Firm Size, 2013
Section Thirteen: Grandfathered Health Plans
The Affordable Care Act (ACA) is bringing about a number of meaningful changes for the American health care system, including for the employer-sponsored health insurance market. While many of the most significant provisions of the ACA will begin in 2014, some are already in effect (for more information, see the health reform implementation timeline at http://www.kff.org/interactive/implementation-timeline/). The ACA exempts certain health plans that were in effect when the law was passed, referred to as grandfathered plans, from some of the new standards in the law; these include requirements to cover preventive benefits without cost sharing, have an external appeals process, or comply with the new benefit and rating provisions in the small group market. Overall, 54% of firms offering health benefits have at least one health plan that is a grandfathered plan in 2013.
Although some important provisions of the ACA will become effective sometime in 2014, we generally did not ask employers in the 2013 survey how they planned to respond to the new requirements. In many cases, rules were not finalized until after the interview process began, so employers did not have all the information necessary to formulate proper responses. We will track employer responses to changes in the market in future surveys.
Grandfathering
For the employer-sponsored market, health plans that were in place when the ACA was enacted (March 2010) can be grandfathered health plans. Interim final rules released by the Department of Health and Human Services on June 17, 2010, and amended on November 17, 2010, stipulate that firms cannot significantly change cost sharing, benefits, employer contributions, or access to coverage in grandfathered plans.1 New employees can enroll in a grandfathered plan as long as the firm has maintained consecutive enrollment in the plan.
While grandfathered plans are exempted from many of the ACA’s new requirements, they must comply with many provisions as they become effective, including: (1) provide a uniform explanation of coverage, (2) report medical loss ratios and provide premium rebates if medical loss ratios are not met, (3) prohibit lifetime and annual limits on essential health benefits, (4) extend dependent coverage to age 26, (5) prohibit health plan rescissions, (6) prohibit waiting periods greater than 90 days, and (7) prohibit coverage exclusions for pre-existing health conditions.2 Firms must decide whether to grandfather their insurance plans, which limits the changes they can make to their plans, or whether to comply with the full set of new health reform requirements.
- Fifty-four percent of firms offering health benefits have at least one health plan that is a grandfathered plan in 2013 (Exhibit 13.1), similar to the 58% of offering firms with at least one grandfathered plan in 2012, but lower than the 64% in 2011.
- Worker enrollment in grandfathered plans has decreased, with 36% of covered workers enrolled in a grandfathered health plan in 2013, down from 48% in 2012 and 56% in 2011 (Exhibit 13.3).
- There are differences in the percentage of covered workers enrolled in grandfathered plans by firm size and region.
- Fewer covered workers at large firms (200 or more workers) are enrolled in a grandfathered health plan than covered workers at smaller firms (30% vs. 49%).
- Fewer covered workers in the Northeast region (27%) are enrolled in grandfathered health plans than covered workers in other regions.
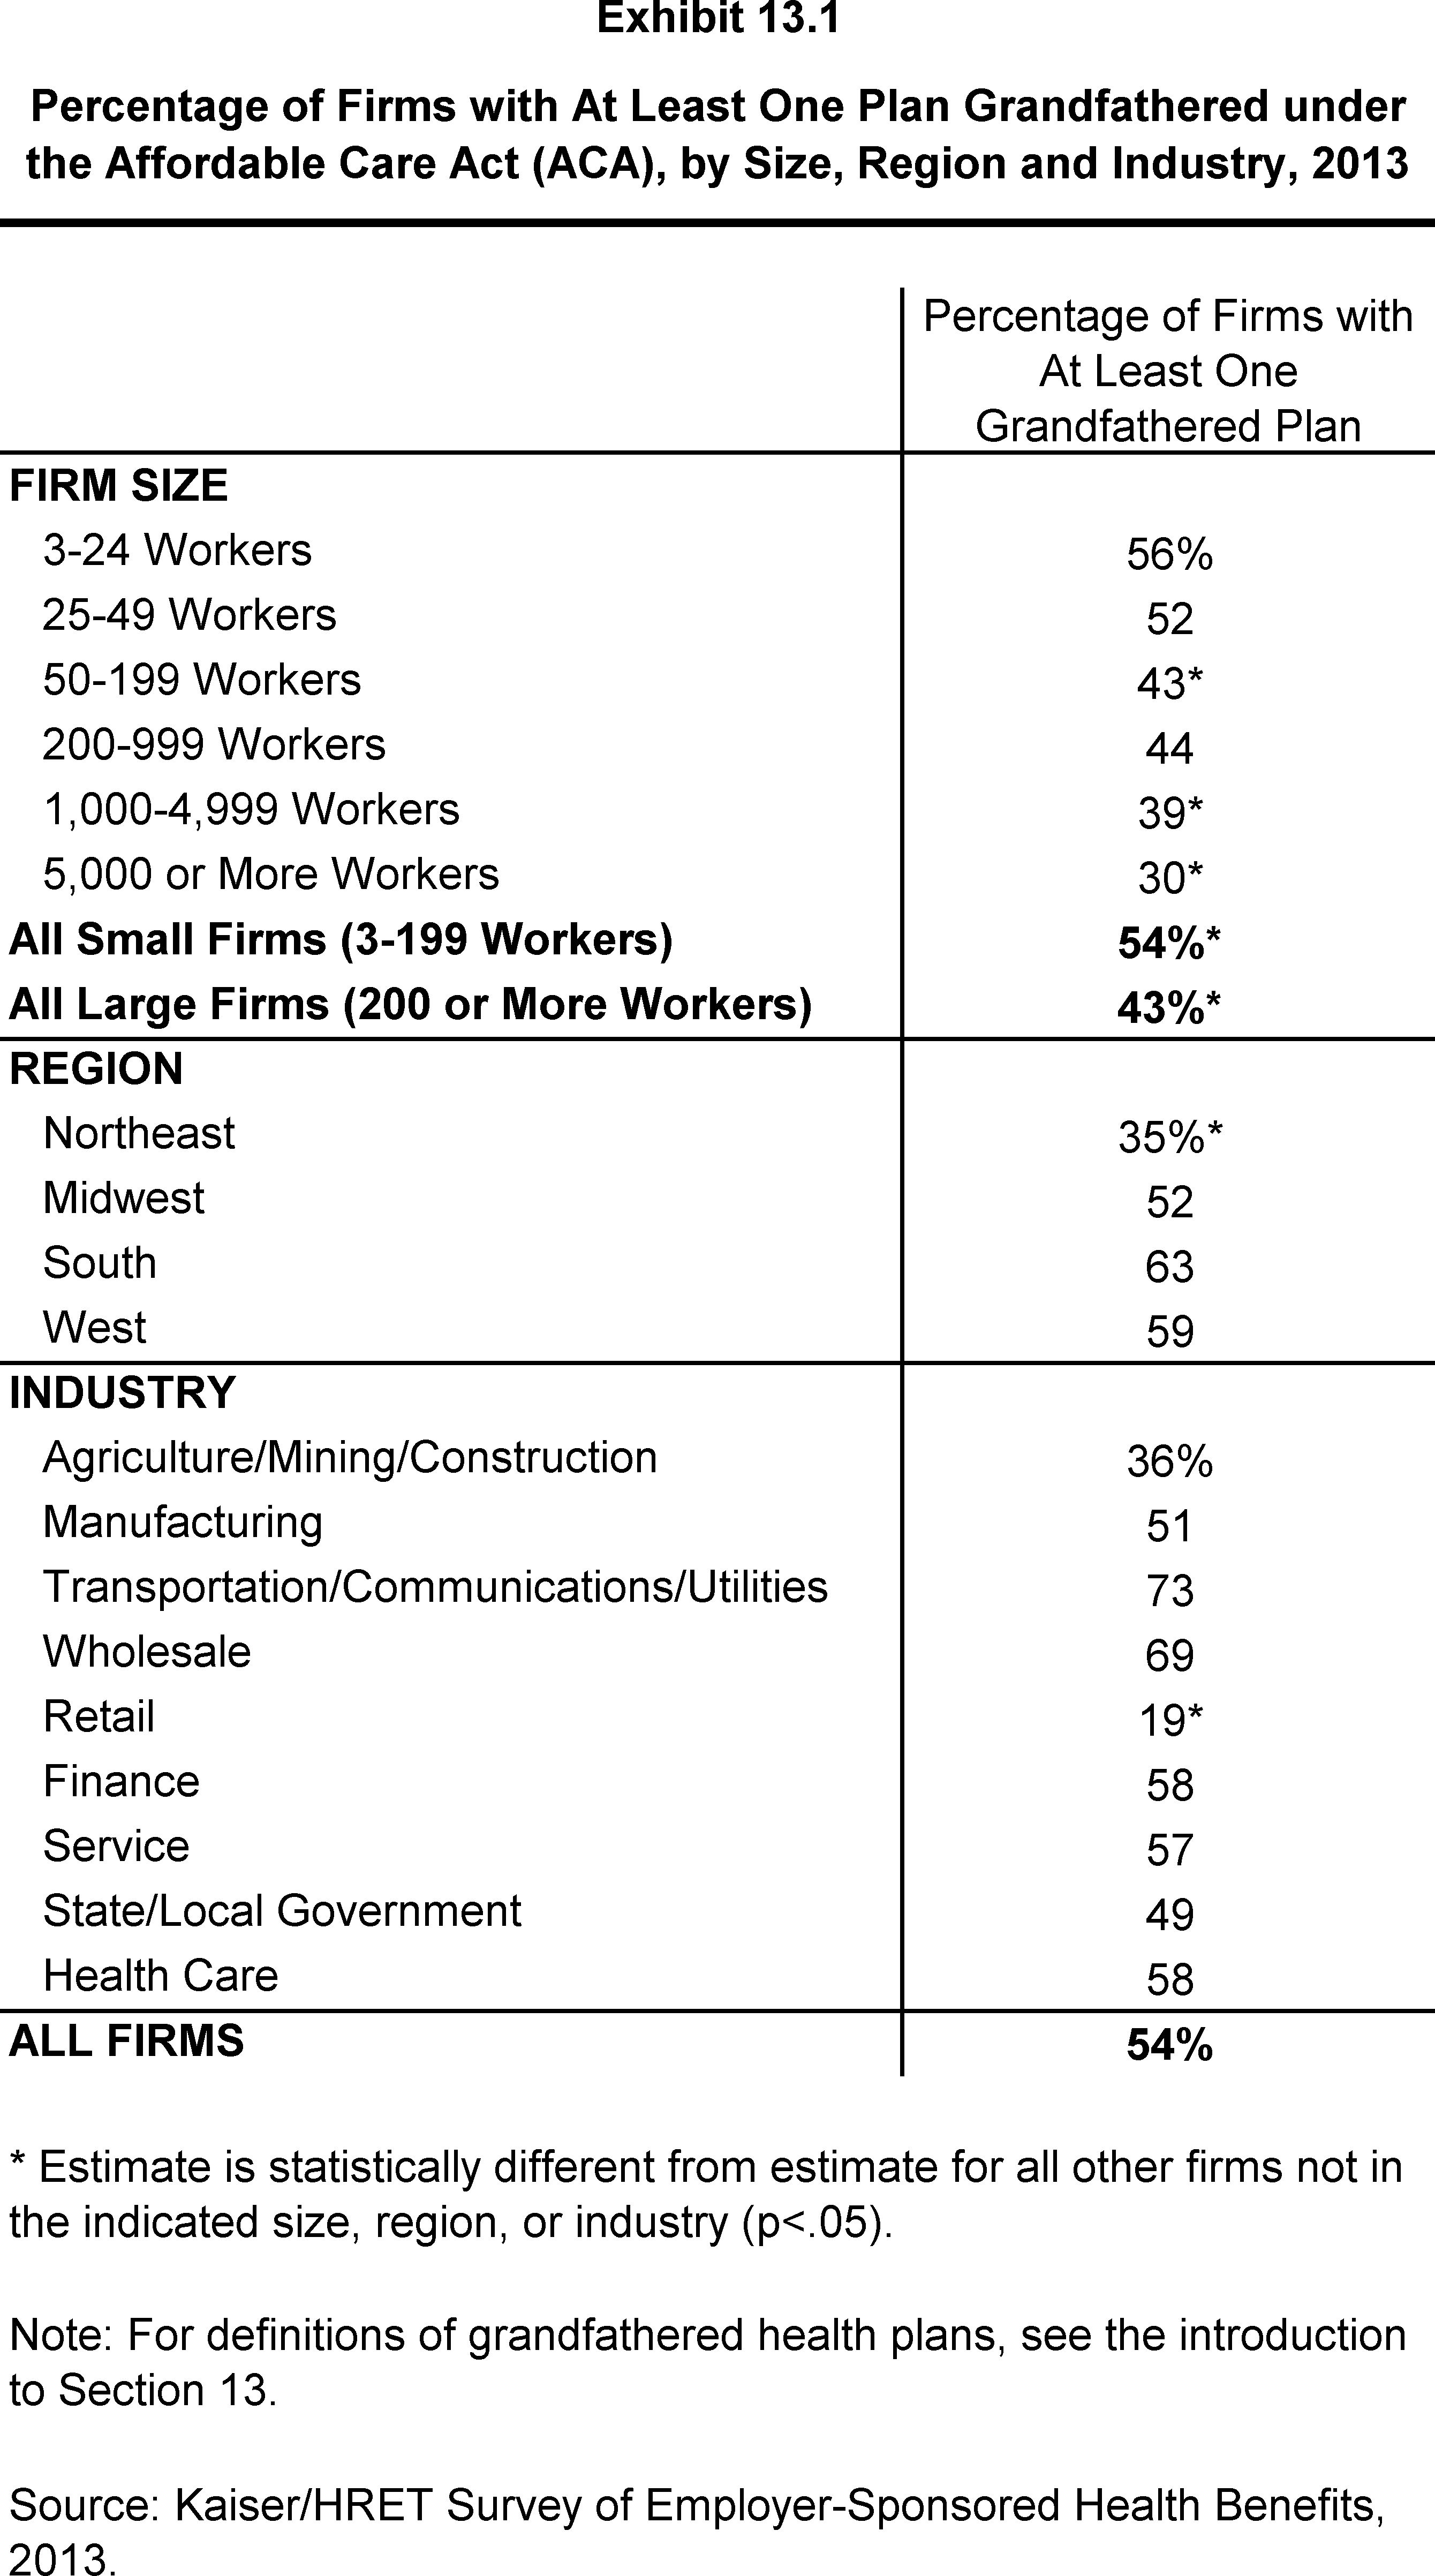
Percentage of Firms with At Least One Plan Grandfathered under the Affordable Care Act (ACA), by Size, Region and Industry, 2013
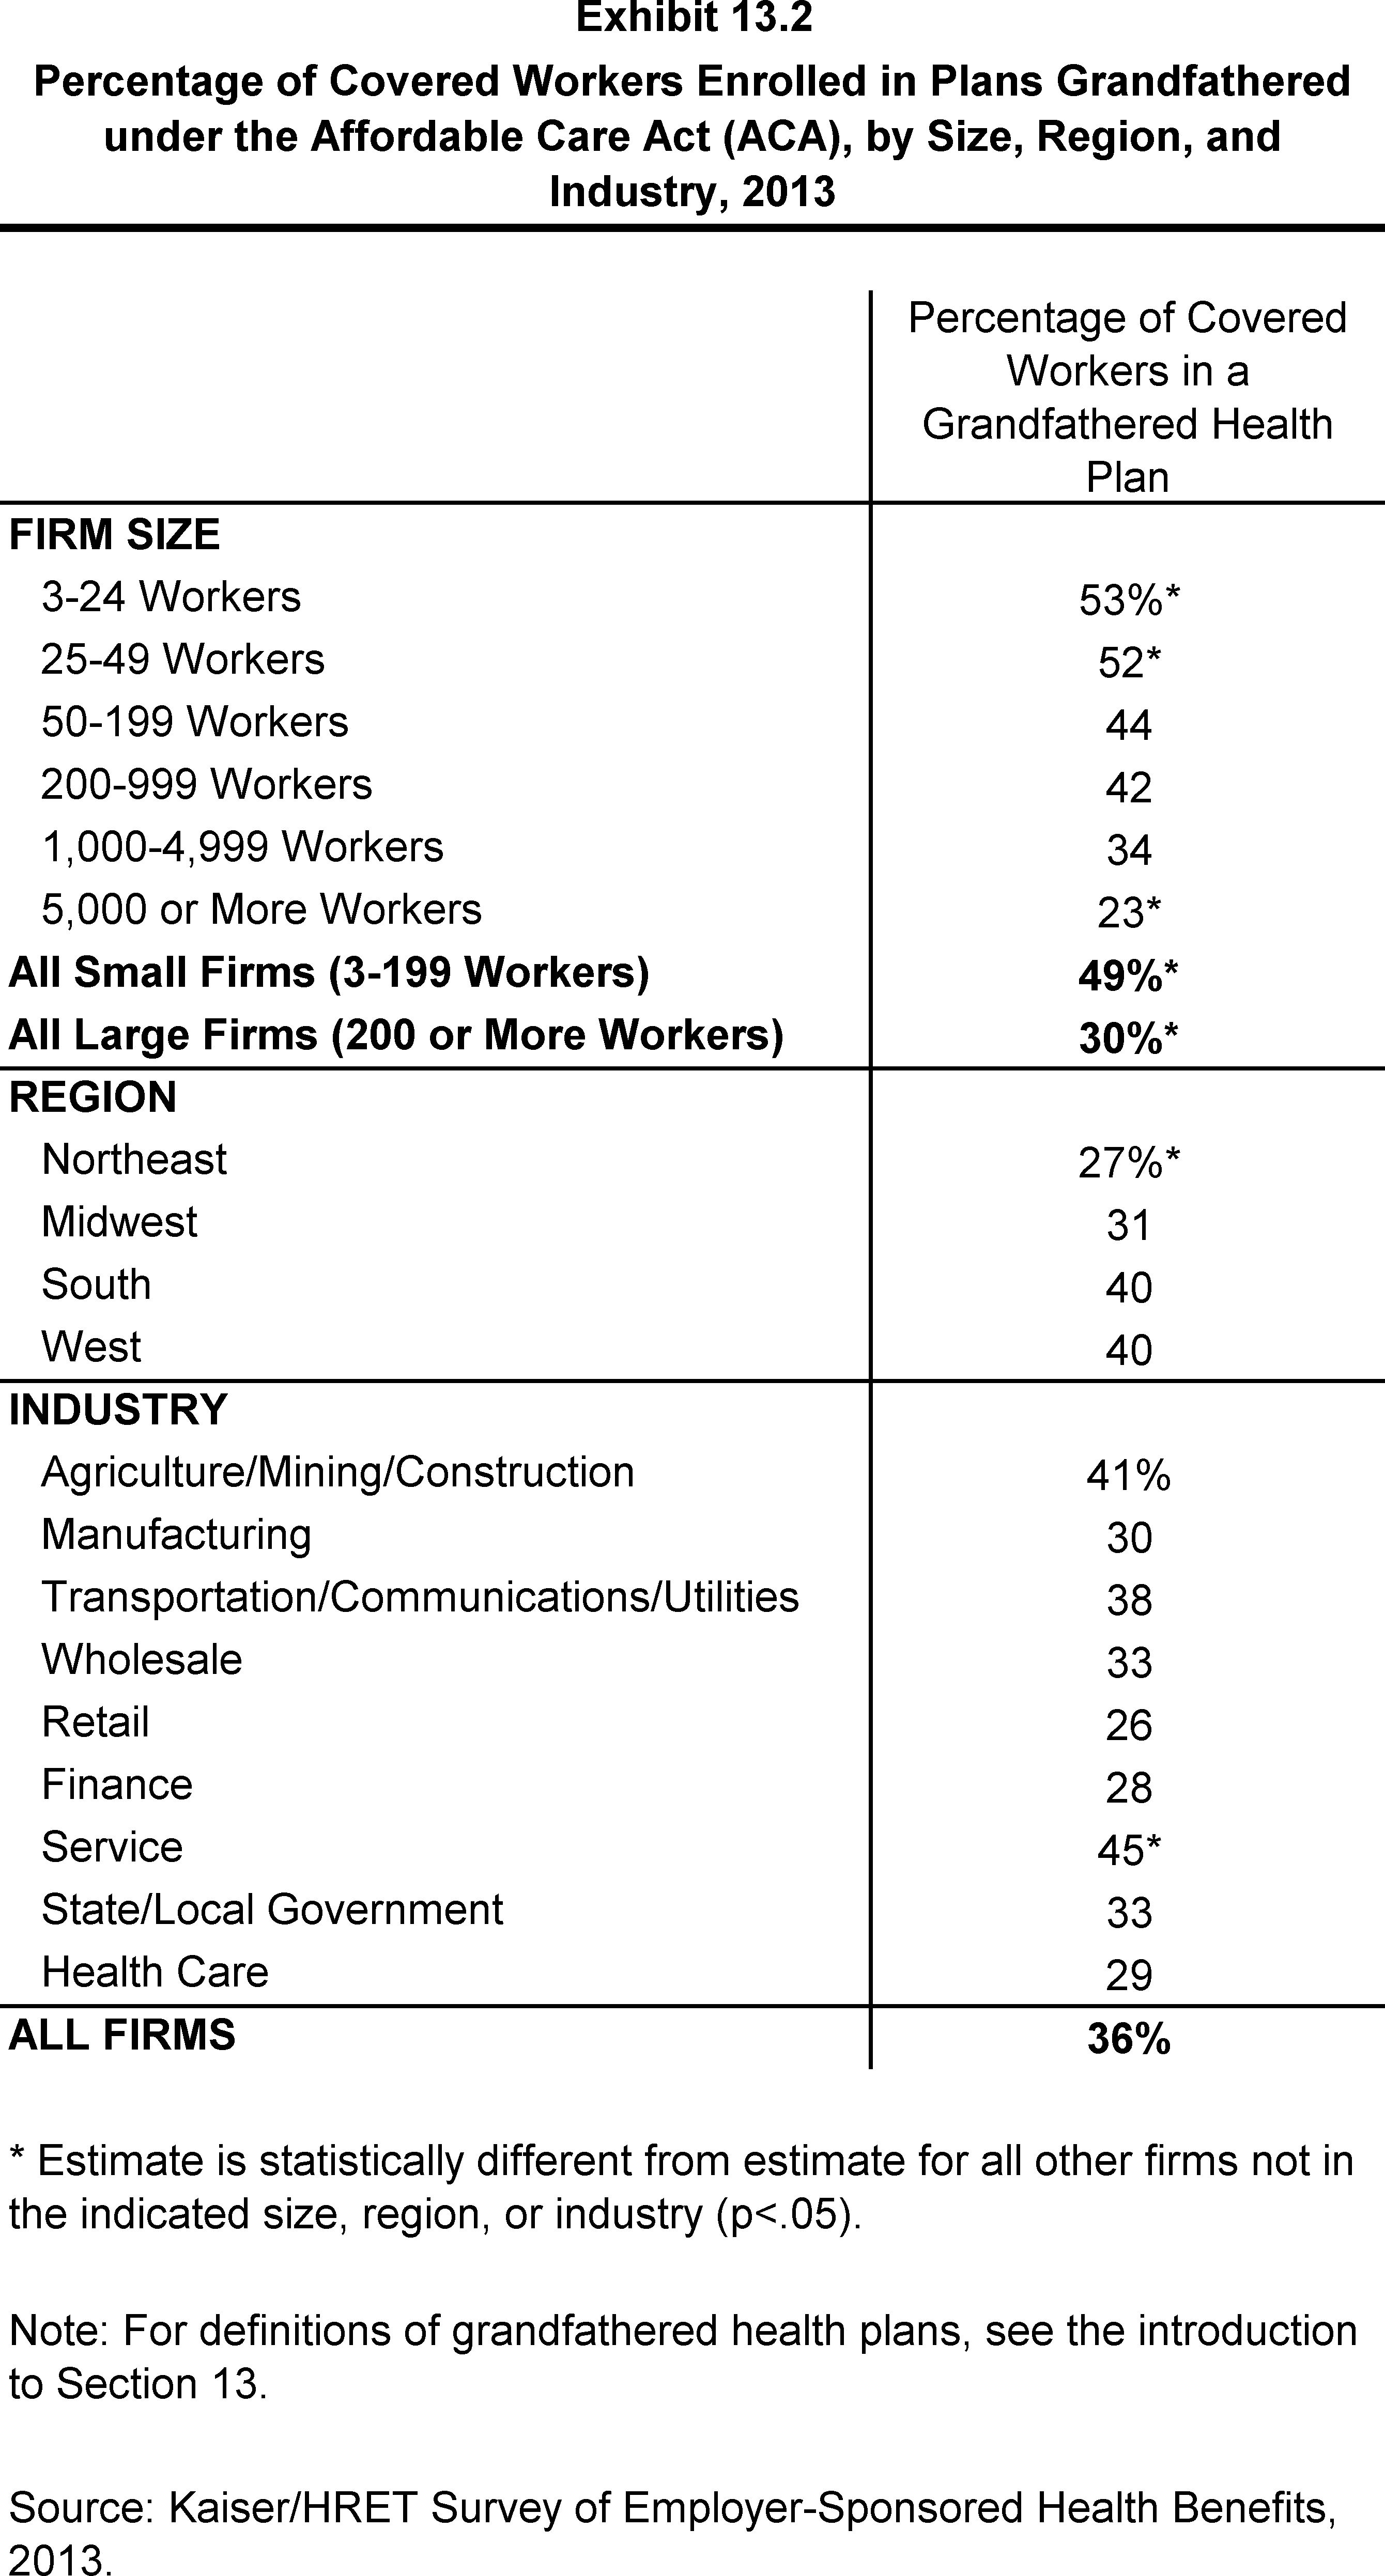
Percentage of Covered Workers Enrolled in Plans Grandfathered under the Affordable Care Act (ACA), by Size, Region, and Industry, 2013
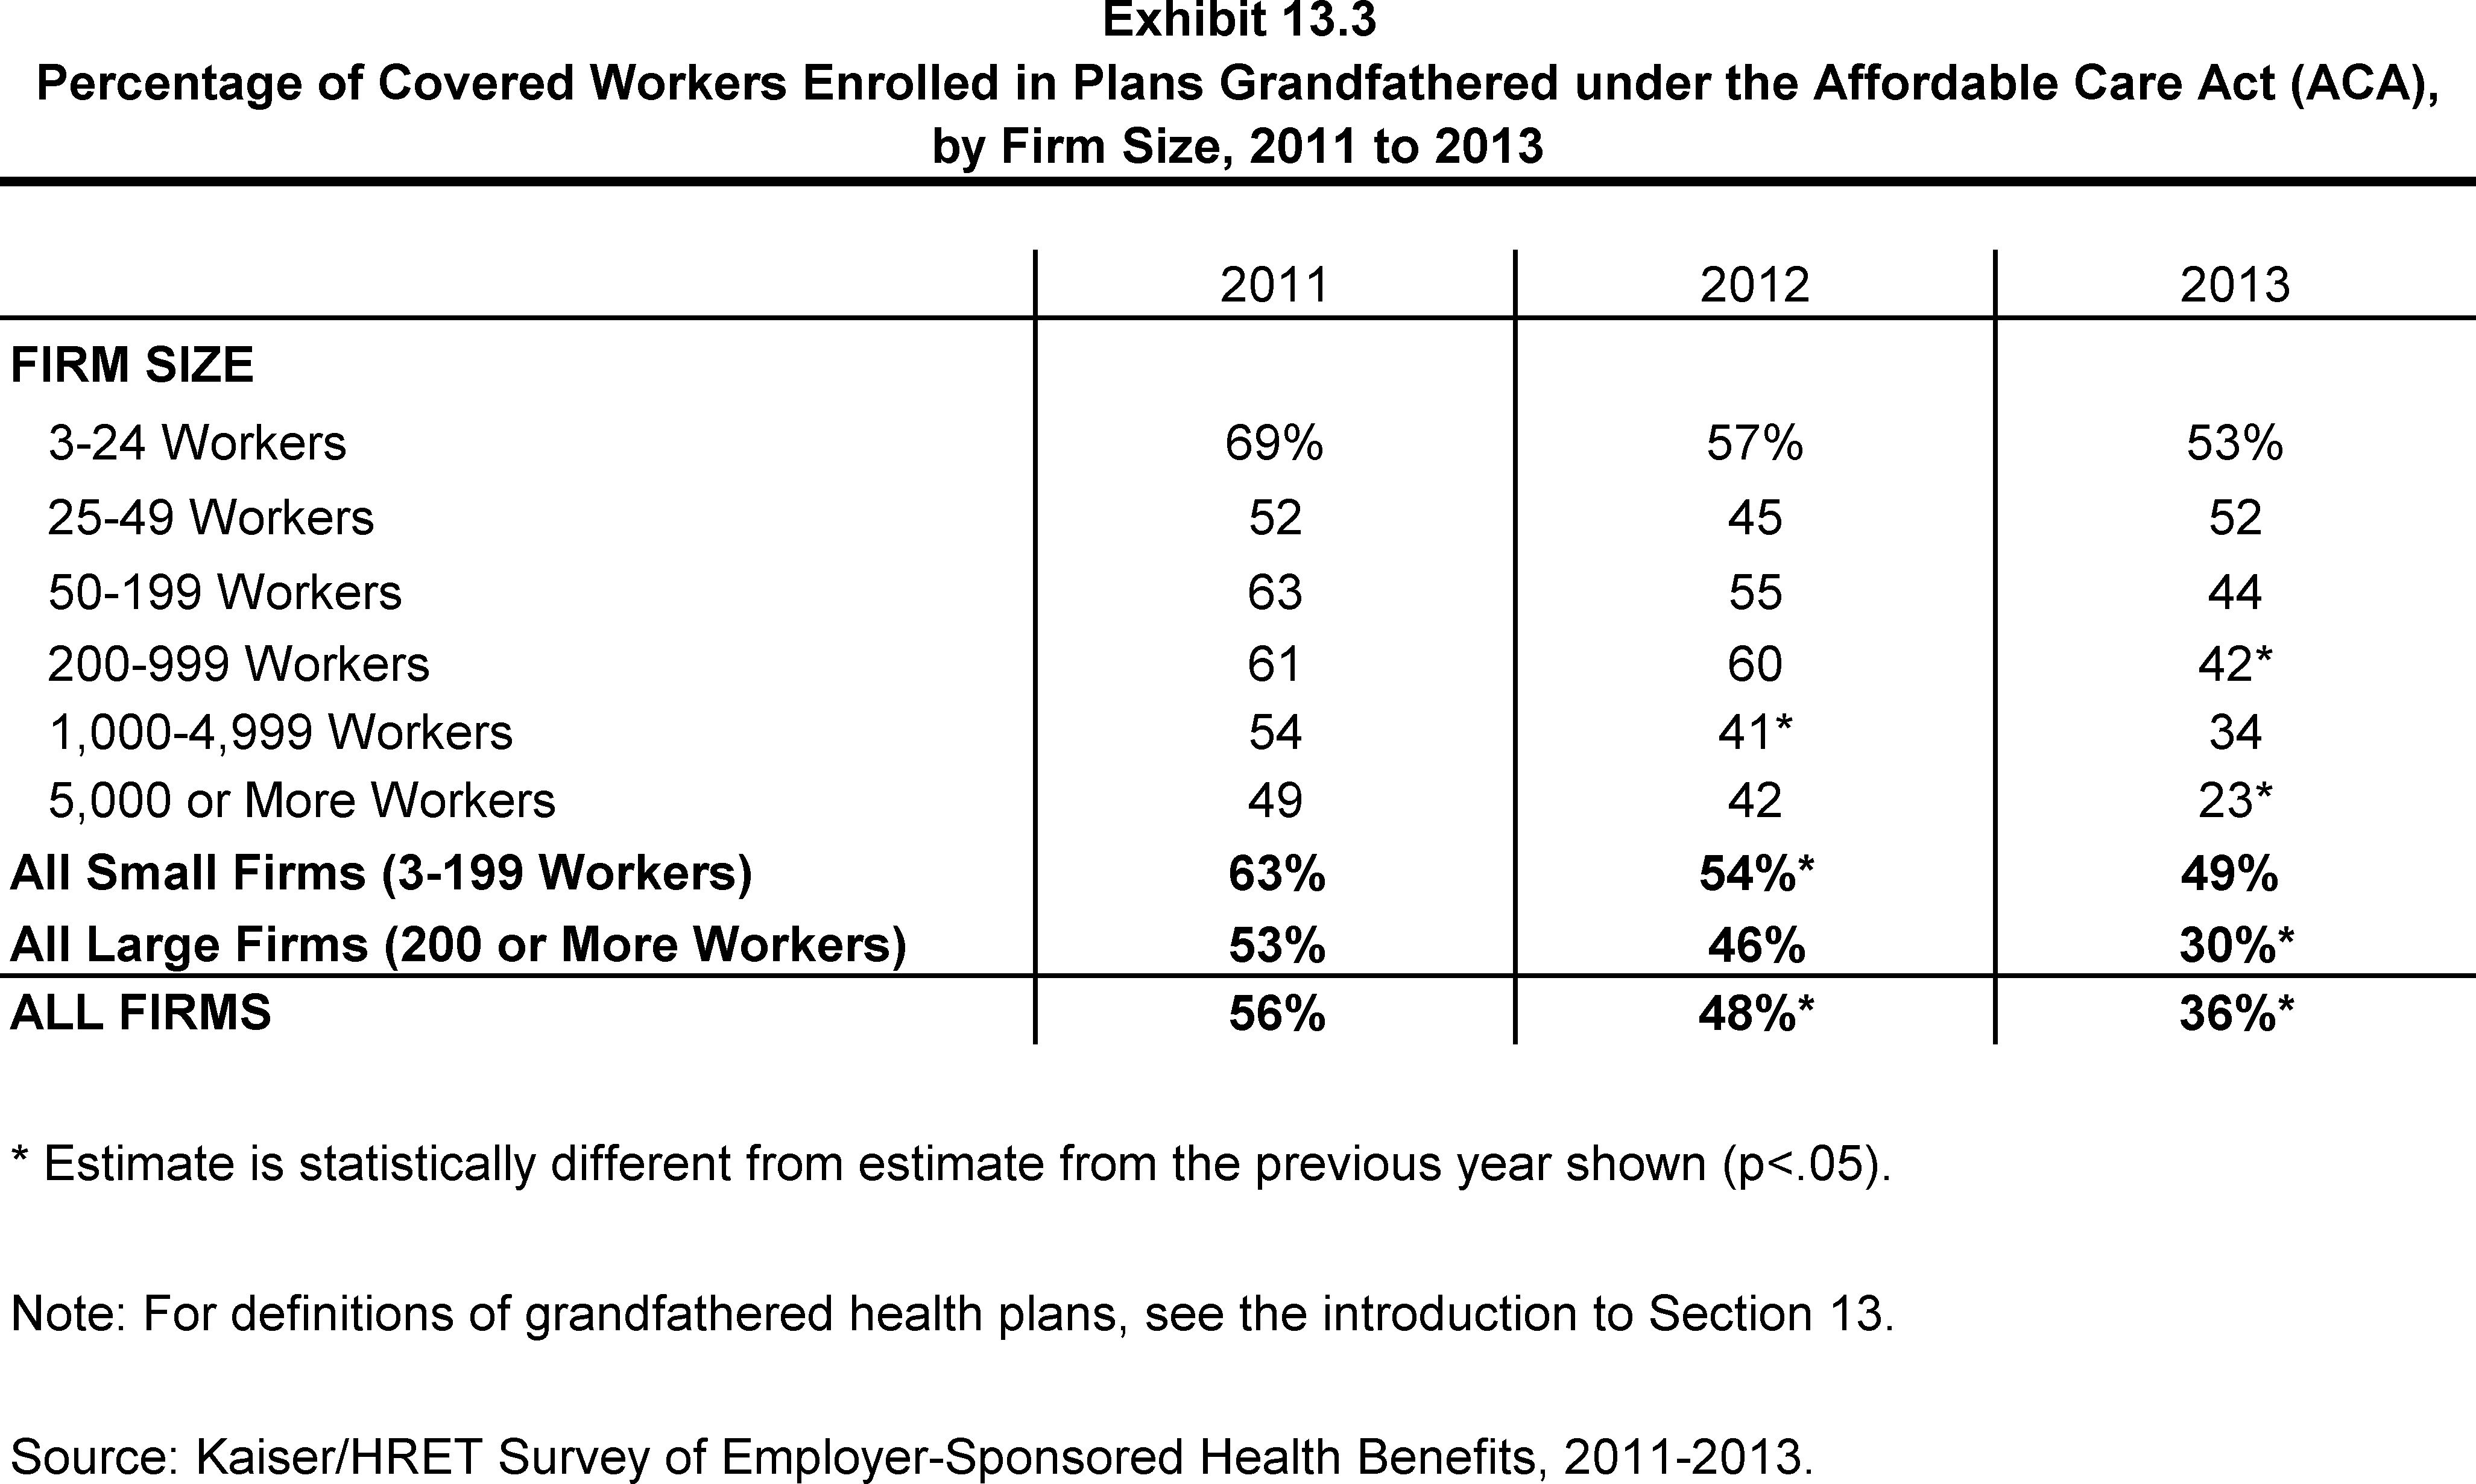
Percentage of Covered Workers Enrolled in Plans Grandfathered under the Affordable Care Act (ACA), by Firm Size, 2011 to 2013
Section Fourteen: Employer Opinions and Health Plan Practices
Employers play a significant role in health insurance coverage – so their opinions and experiences are important factors in health policy discussions.
Employer Opinions on Cost Containment
Firms offering health benefits were asked to rate how effective several different strategies, such as wellness programs, tighter managed care restrictions, consumer-driven health plans, higher employee cost sharing, and disease management programs, would be in reducing the growth of health insurance costs.
- Thirty-five percent of firms offering health benefits stated that wellness programs would be very effective at containing health insurance costs, more than any of the other strategies. There was no statistical difference in the distribution of opinions between small (3 to 199 workers) and larger firms towards the effectiveness of wellness programs (Exhibit 14.1).
- Eight percent of firms offering health benefits stated that tighter managed care restrictions would be “very effective” at containing health insurance costs, fewer than any of the other strategies (Exhibit 14.1). Larger firms were more likely than smaller firms to state that tighter managed care restrictions were “very effective”.
Shopping for Health Coverage
More than one-half (54%) of firms offering health benefits reported shopping for a new health plan or a new insurance carrier in the past year, suggesting that the market is quite dynamic (Exhibit 14.2). Among firms that offer health benefits and shopped for a new plan or carrier, 18% changed insurance carriers and 15% reported changing the type of health plan provided to employees. A firm is considered to have changed health plan types when they switch between conventional, HMO, PPO, POS or HDHP/SO plans. There were no significant differences between small firms (3 to 199 workers) and larger firms on either these measures (Exhibit 14.3).
The majority of firms offering health benefits use a broker or consultant to assist in choosing a health plan (82%) (Exhibit 14.8). Large firms offering health benefits (200 or more workers) are more likely than smaller firms to use a broker or consultant (90% versus 82%).
Retail Clinics and Nurse Hotlines
Among firms offering health benefits, over half (56%) cover care received at retail clinics in their plan with the largest enrollment. Retail clinics treat minor illness and provide preventive care at locations such as retail stores, pharmacies, and supermarkets. Among these firms covering care at retail clinics, 17% offer financial incentives to receive care at a retail clinic location rather than at a physician’s office. There is no significant difference between small firms (3 to 199 workers) and larger firms covering care received at a retail clinic or for offering financial incentives to do so (Exhibit 14.5).
Among plans with the largest enrollment in firms offering health benefits, over half include a nurse hotline (55%). Large firms offering health benefits (200 or more workers) are more likely than smaller firms to have a nurse hotline (74% vs. 54%) (Exhibit 14.7).
Tiered Networks
A tiered or high performance network is one that groups providers into the network based on quality, cost, and/or the efficiency of the care they deliver. These networks encourage patients to visit more efficient doctors by either restricting networks to efficient providers, or by having different copayments or coinsurance for providers in different tiers in the network.
- Twenty-three percent of firms that offer health benefits include a high performance or tiered provider network in the health plan with the largest enrollment (Exhibit 14.4). This is similar to the 20% reported in 2011 (the last time these questions were asked).
Offering Health Benefits through a Private Exchange
Recently, several large consulting firms have created private exchanges to offer health benefit options for mid-sized and larger employers. While models vary, the general idea is that the exchange contracts with different health plan vendors and offers a number of different health plan options to the employees of participating employers. This permits an employer to offer a larger variety of health plans to employees, and to structure contributions or other rules to encourage employees to choose more efficient plans.
- Nine percent of large firms (200 or more workers) offering health benefits are considering offering benefits through a private exchange. Among offering firms with at least 5,000 workers, 29% are considering offering benefits through the exchange (Exhibit 14.6).
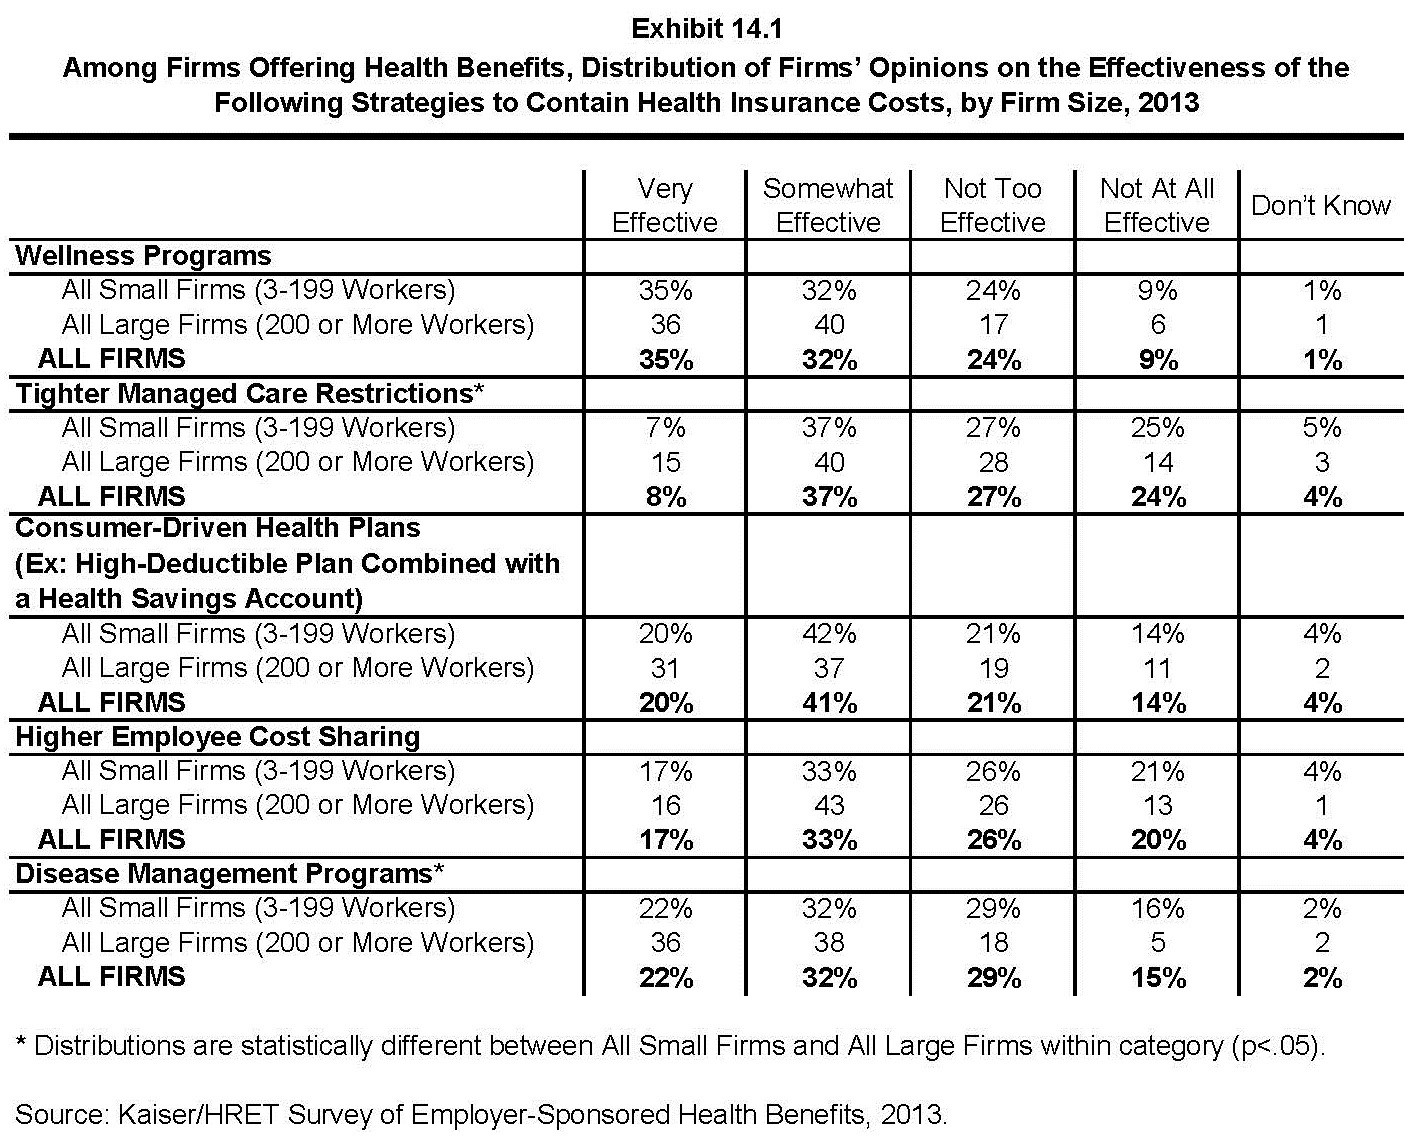
Among Firms Offering Health Benefits, Distribution of Firms’ Opinions on the Effectiveness of the Following Strategies to Contain Health Insurance Costs, by Firm Size, 2013
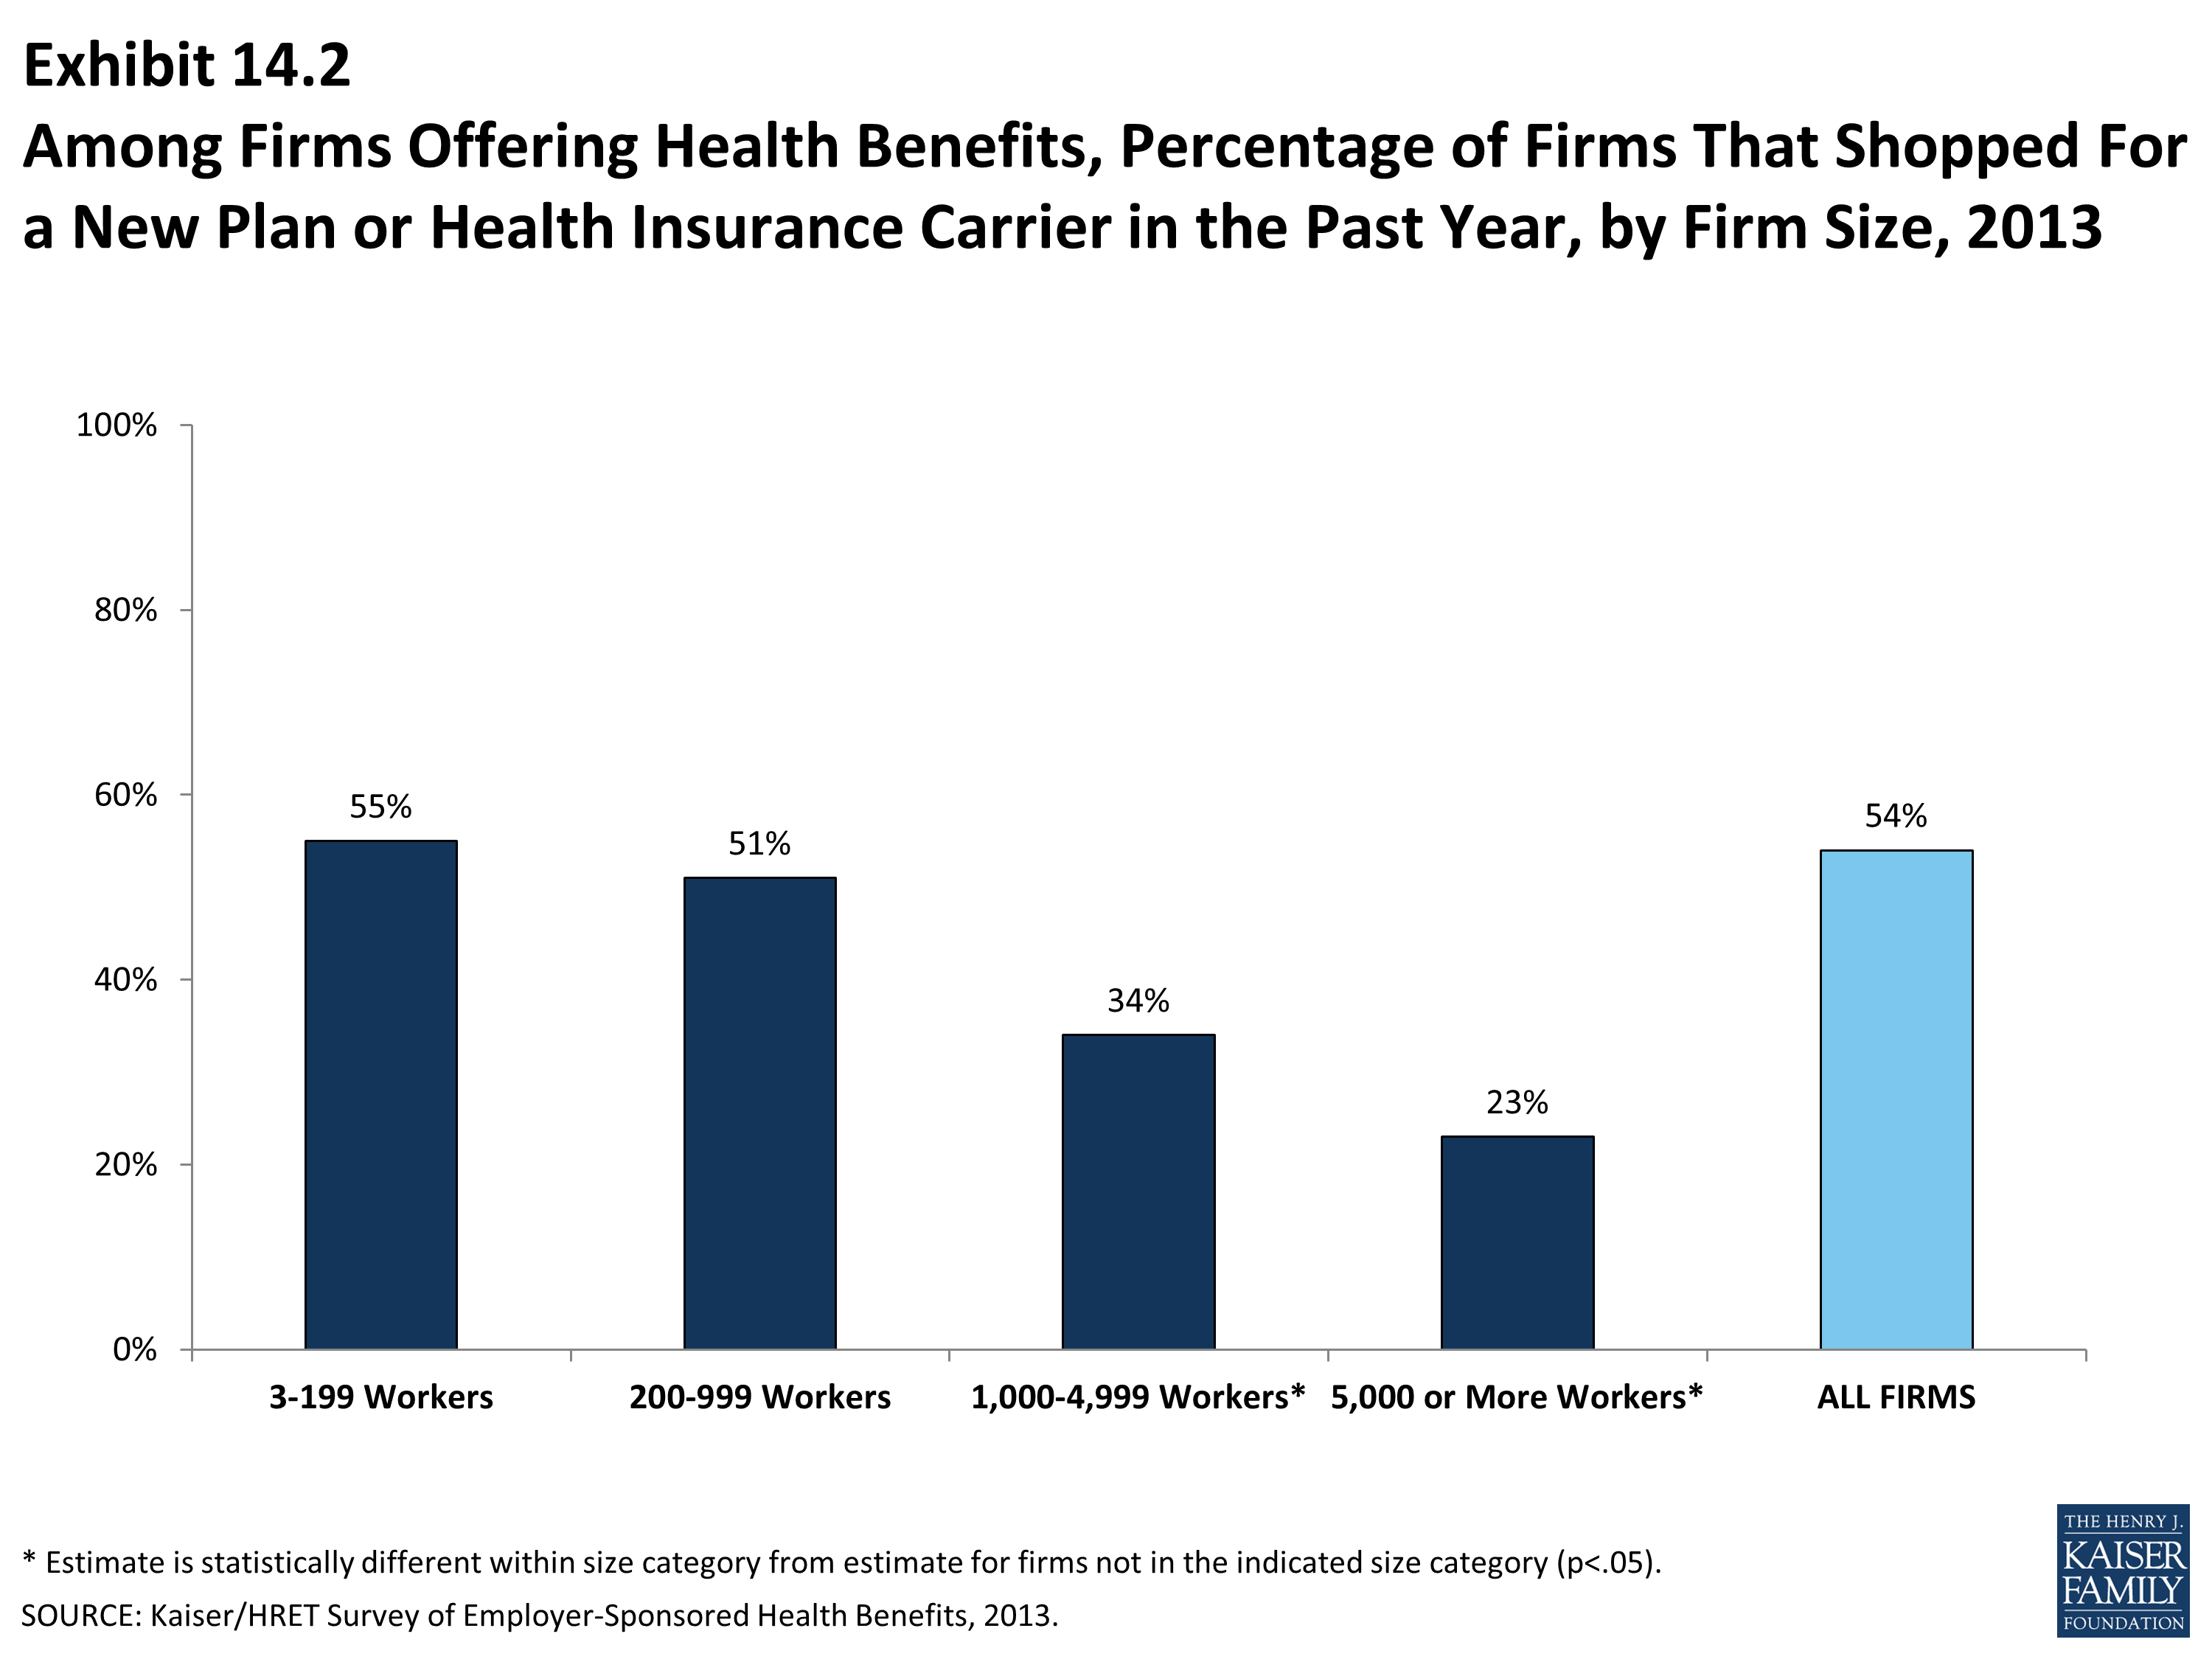
Among Firms Offering Health Benefits, Percentage of Firms That Shopped For a New Plan or Health Insurance Carrier in the Past Year, by Firm Size, 2013
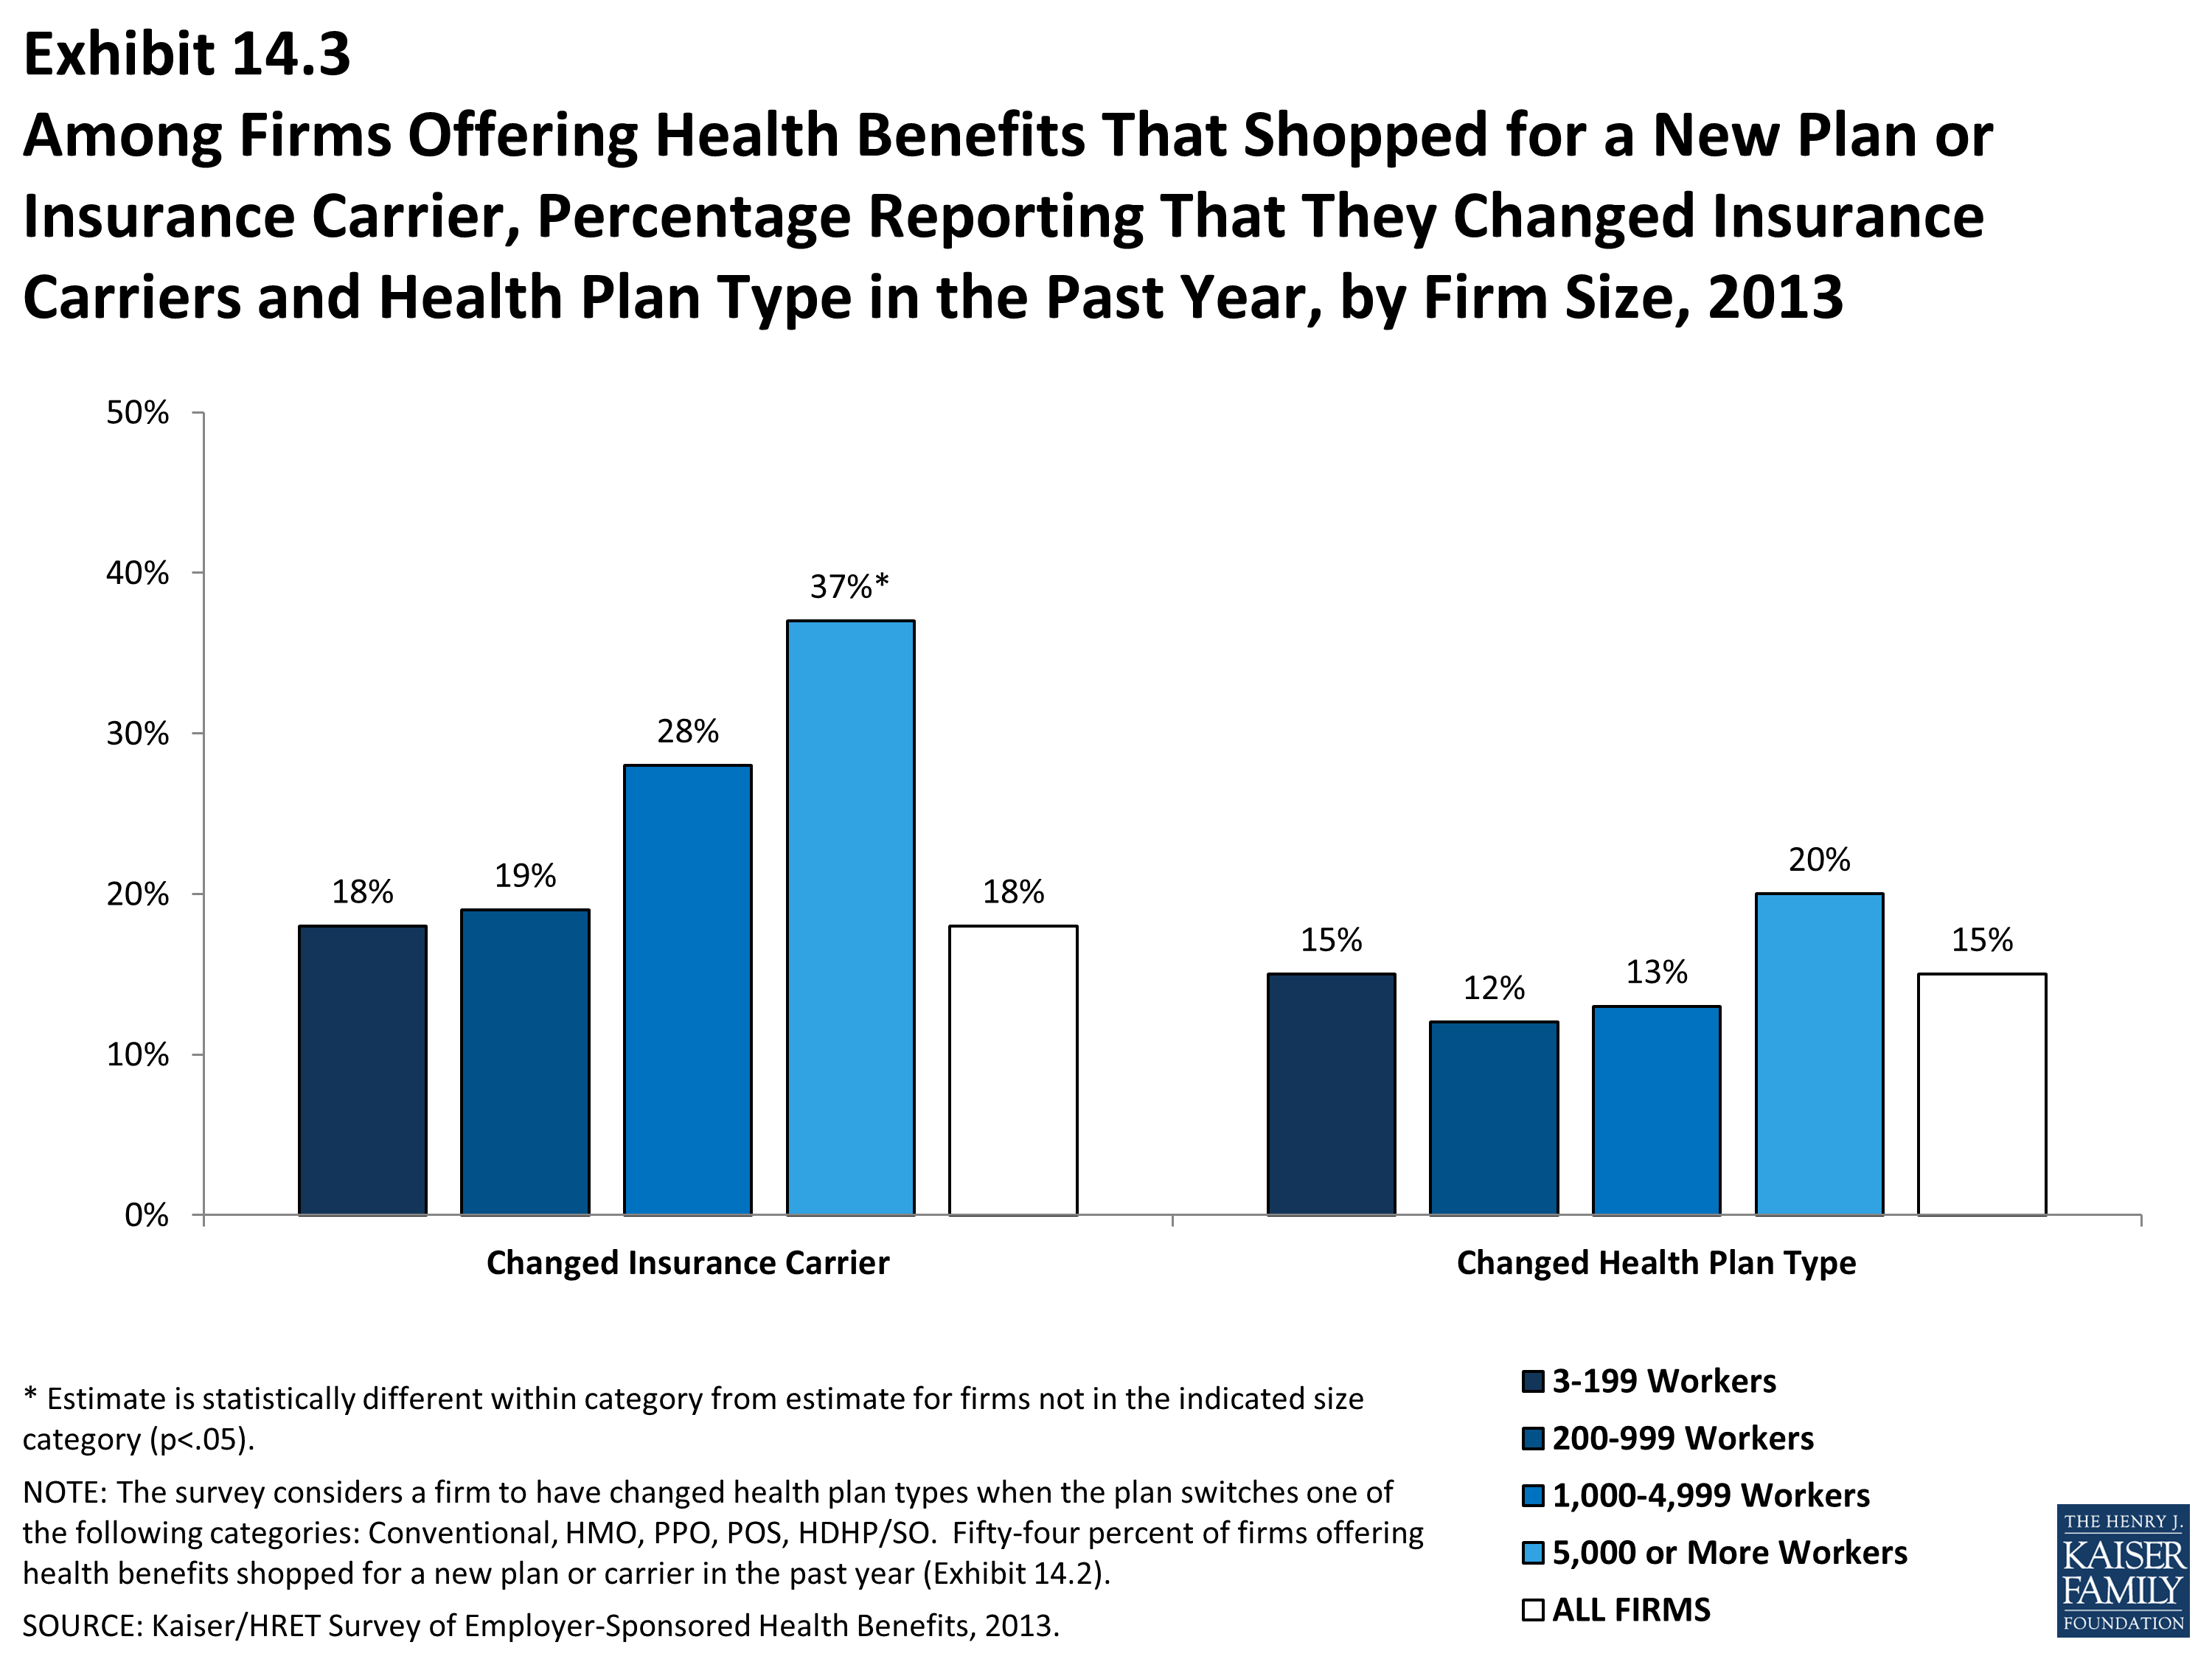
Among Firms Offering Health Benefits That Shopped for a New Plan or Insurance Carrier, Percentage Reporting That They Changed Insurance Carriers and Health Plan Type in the Past Year, by Firm Size, 2013
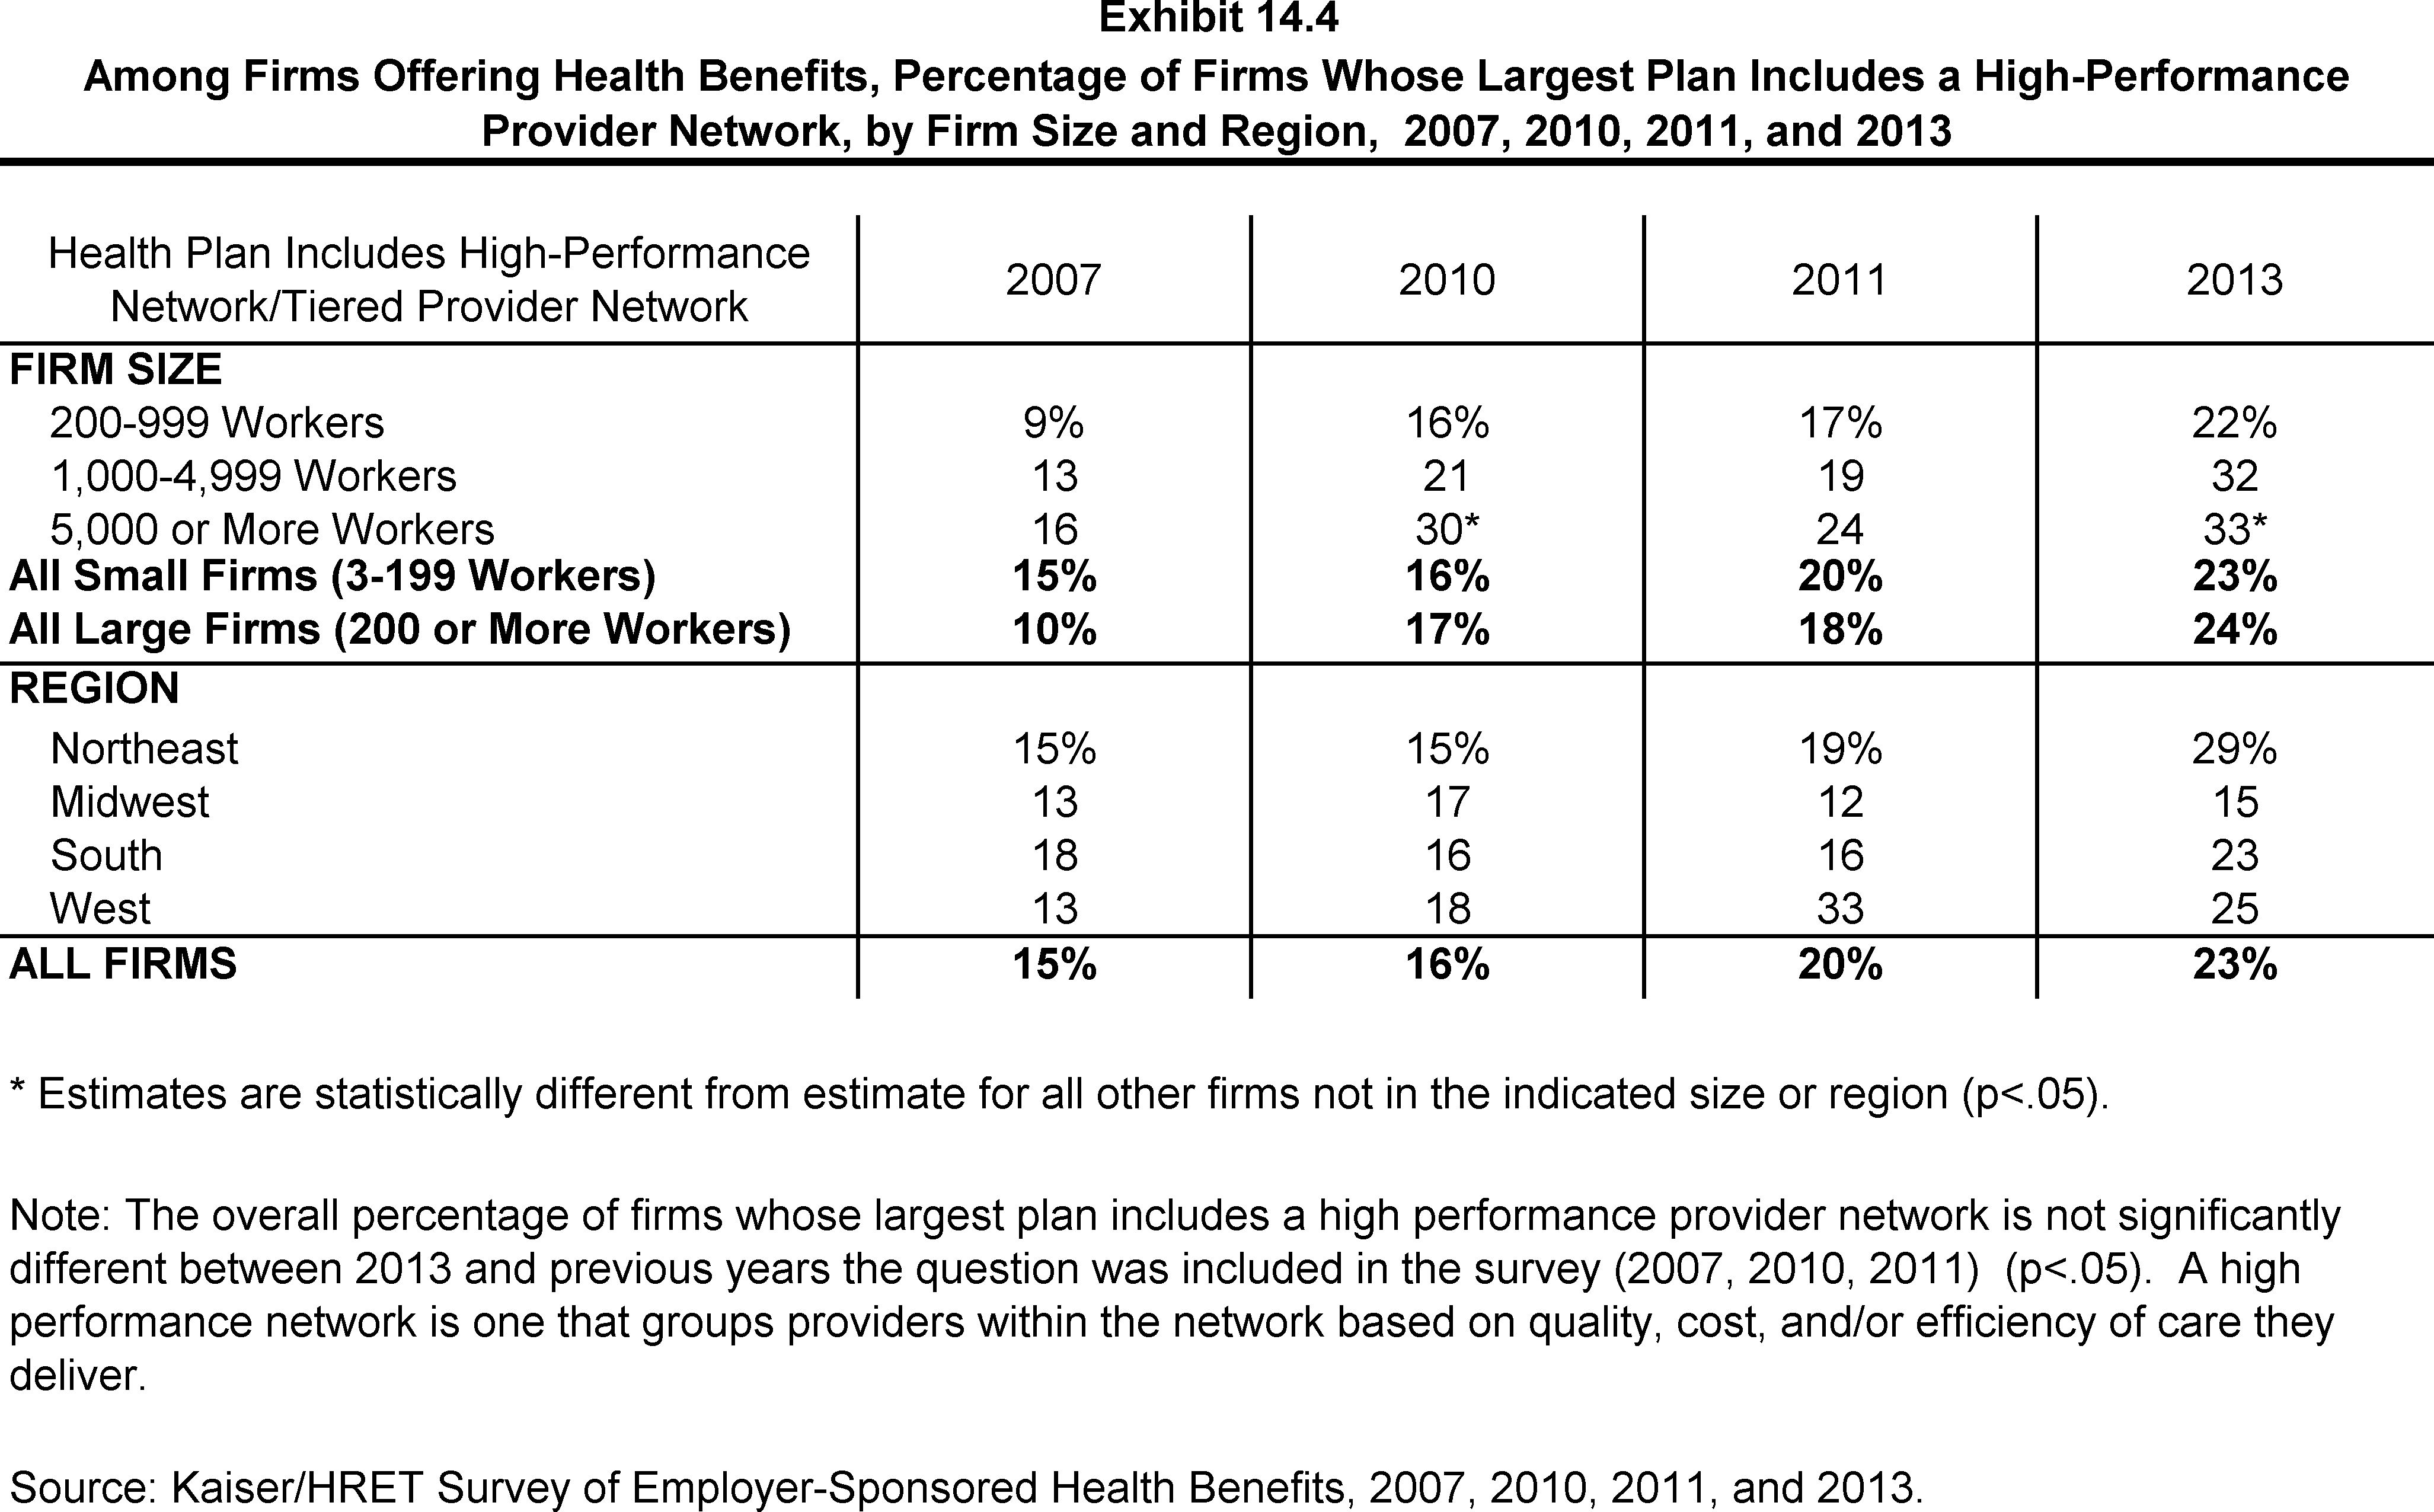
Among Firms Offering Health Benefits, Percentage of Firms Whose Largest Plan Includes a High-Performance Provider Network, by Firm Size and Region, 2007, 2010, 2011, and 2013
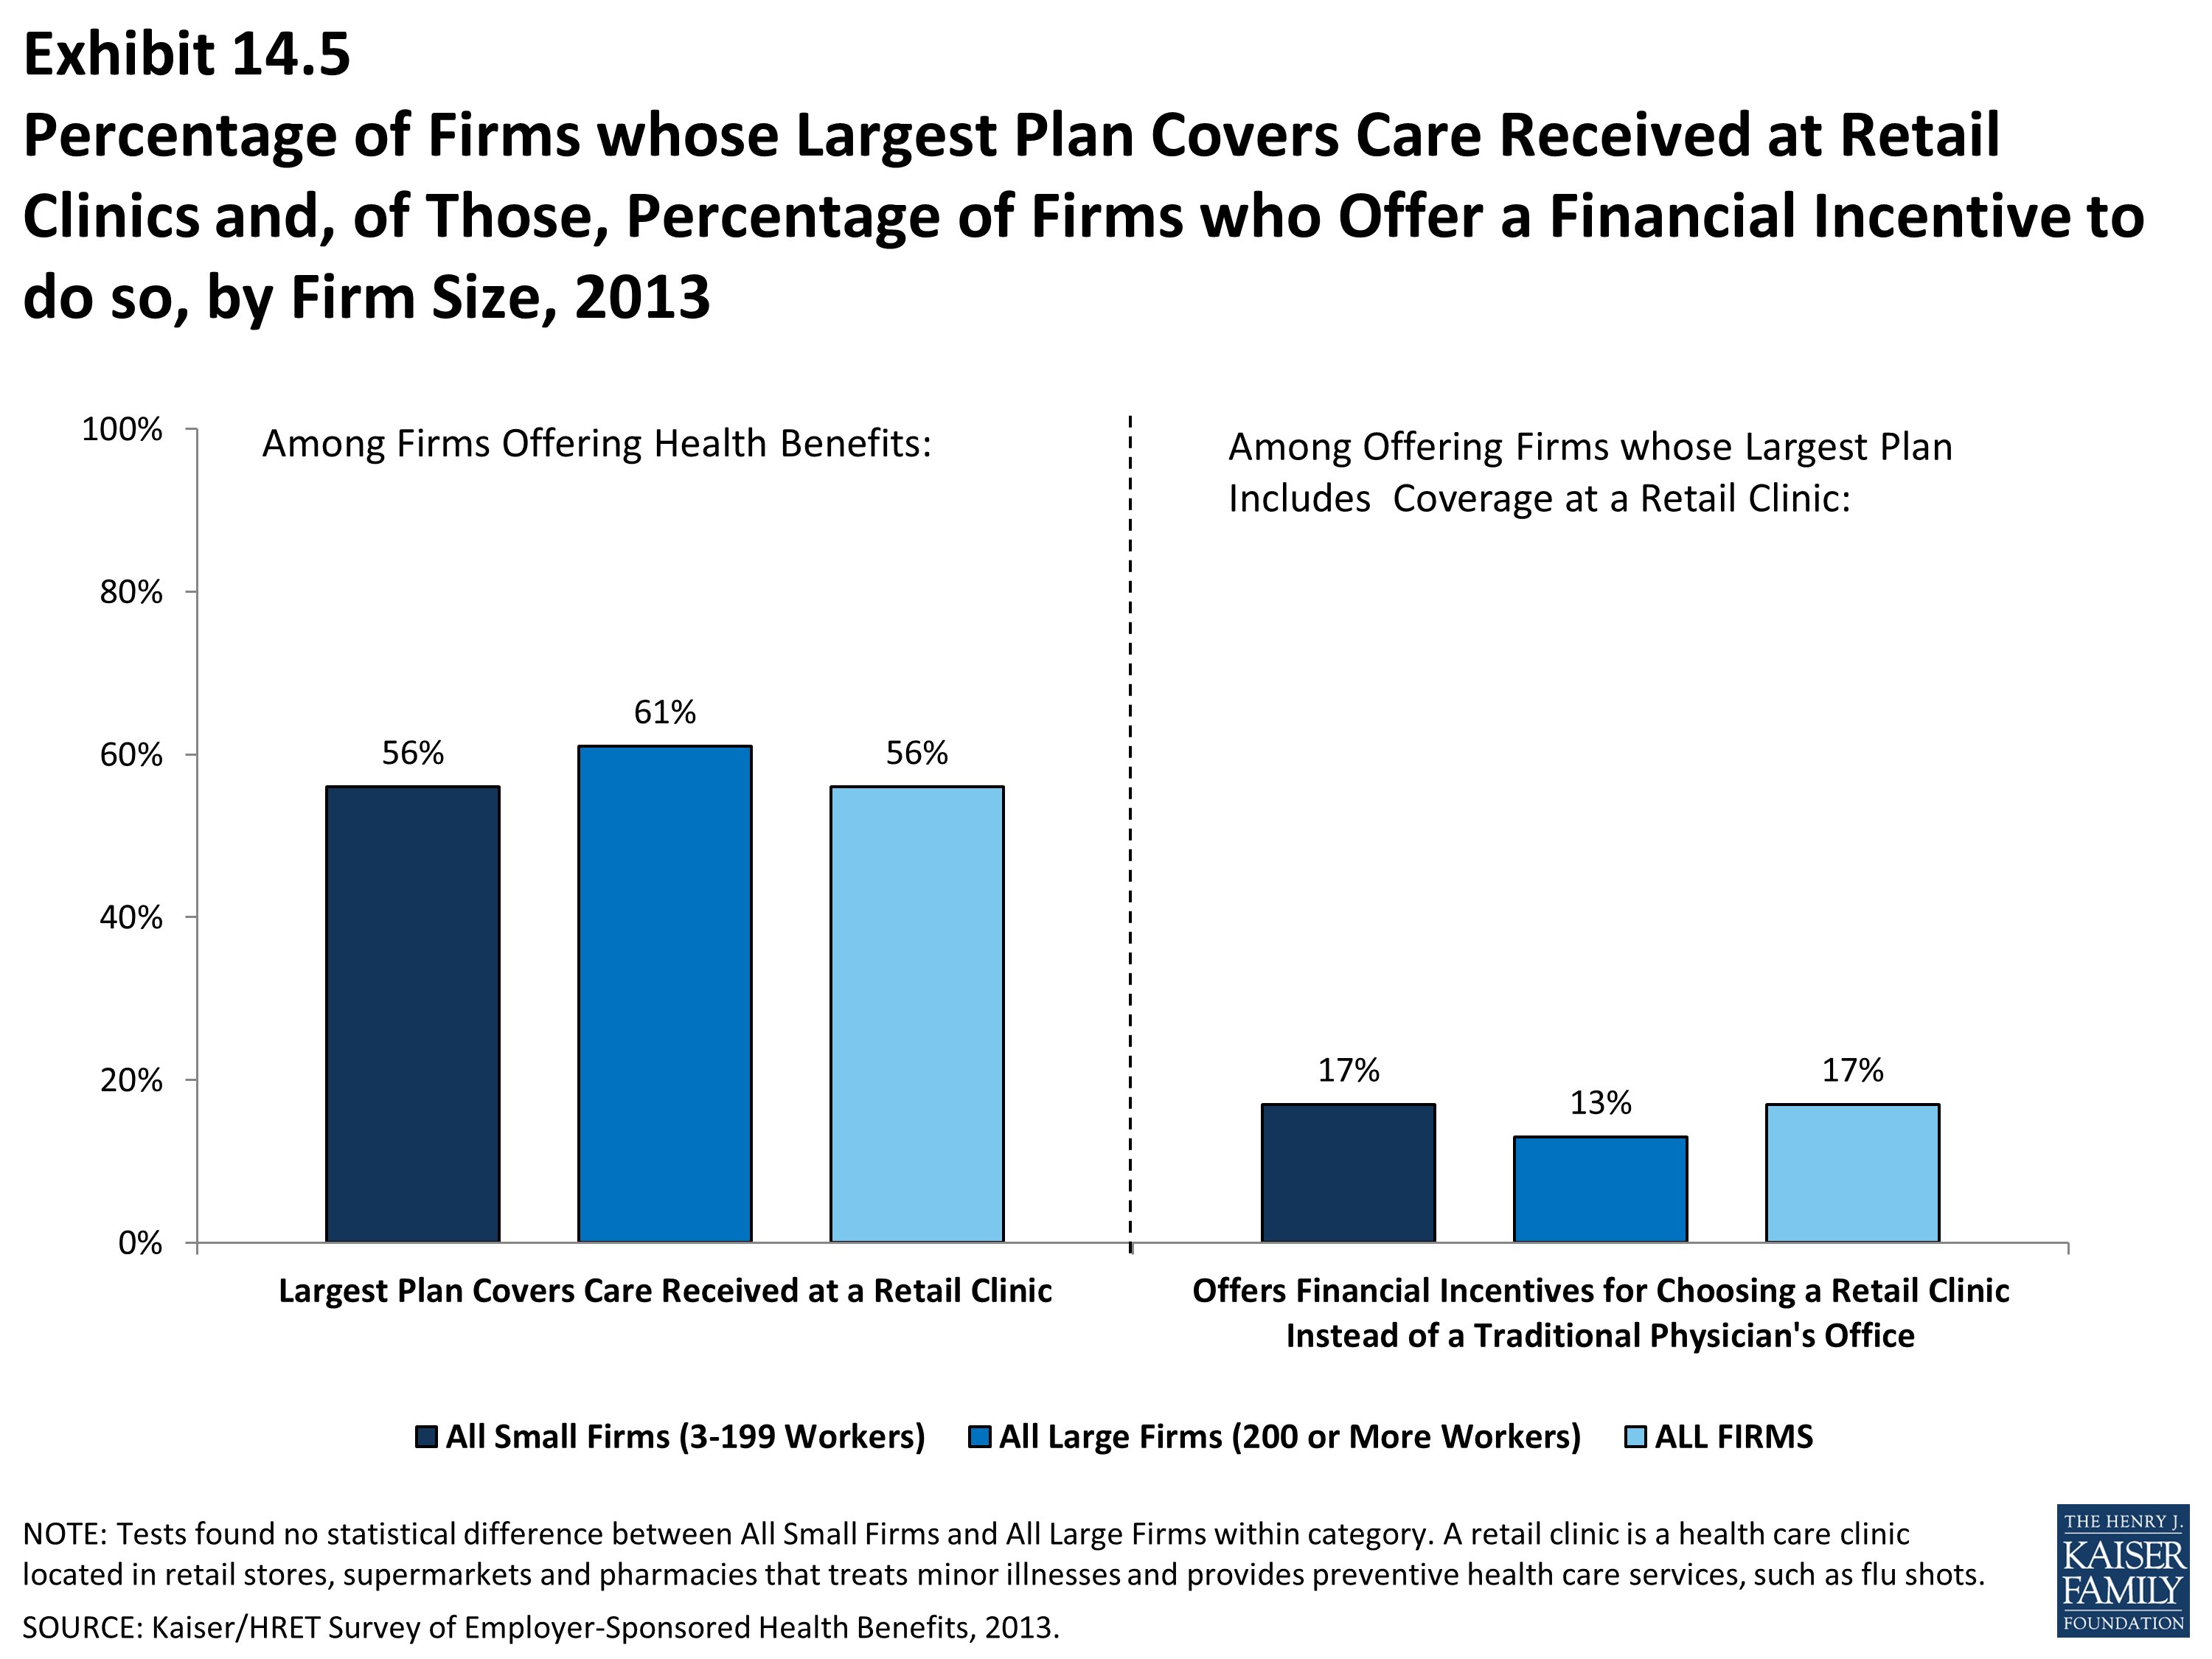
Percentage of Firms whose Largest Plan Covers Care Received at Retail Clinics and, of Those, Percentage of Firms who Offer a Financial Incentive to do so, by Firm Size, 2013
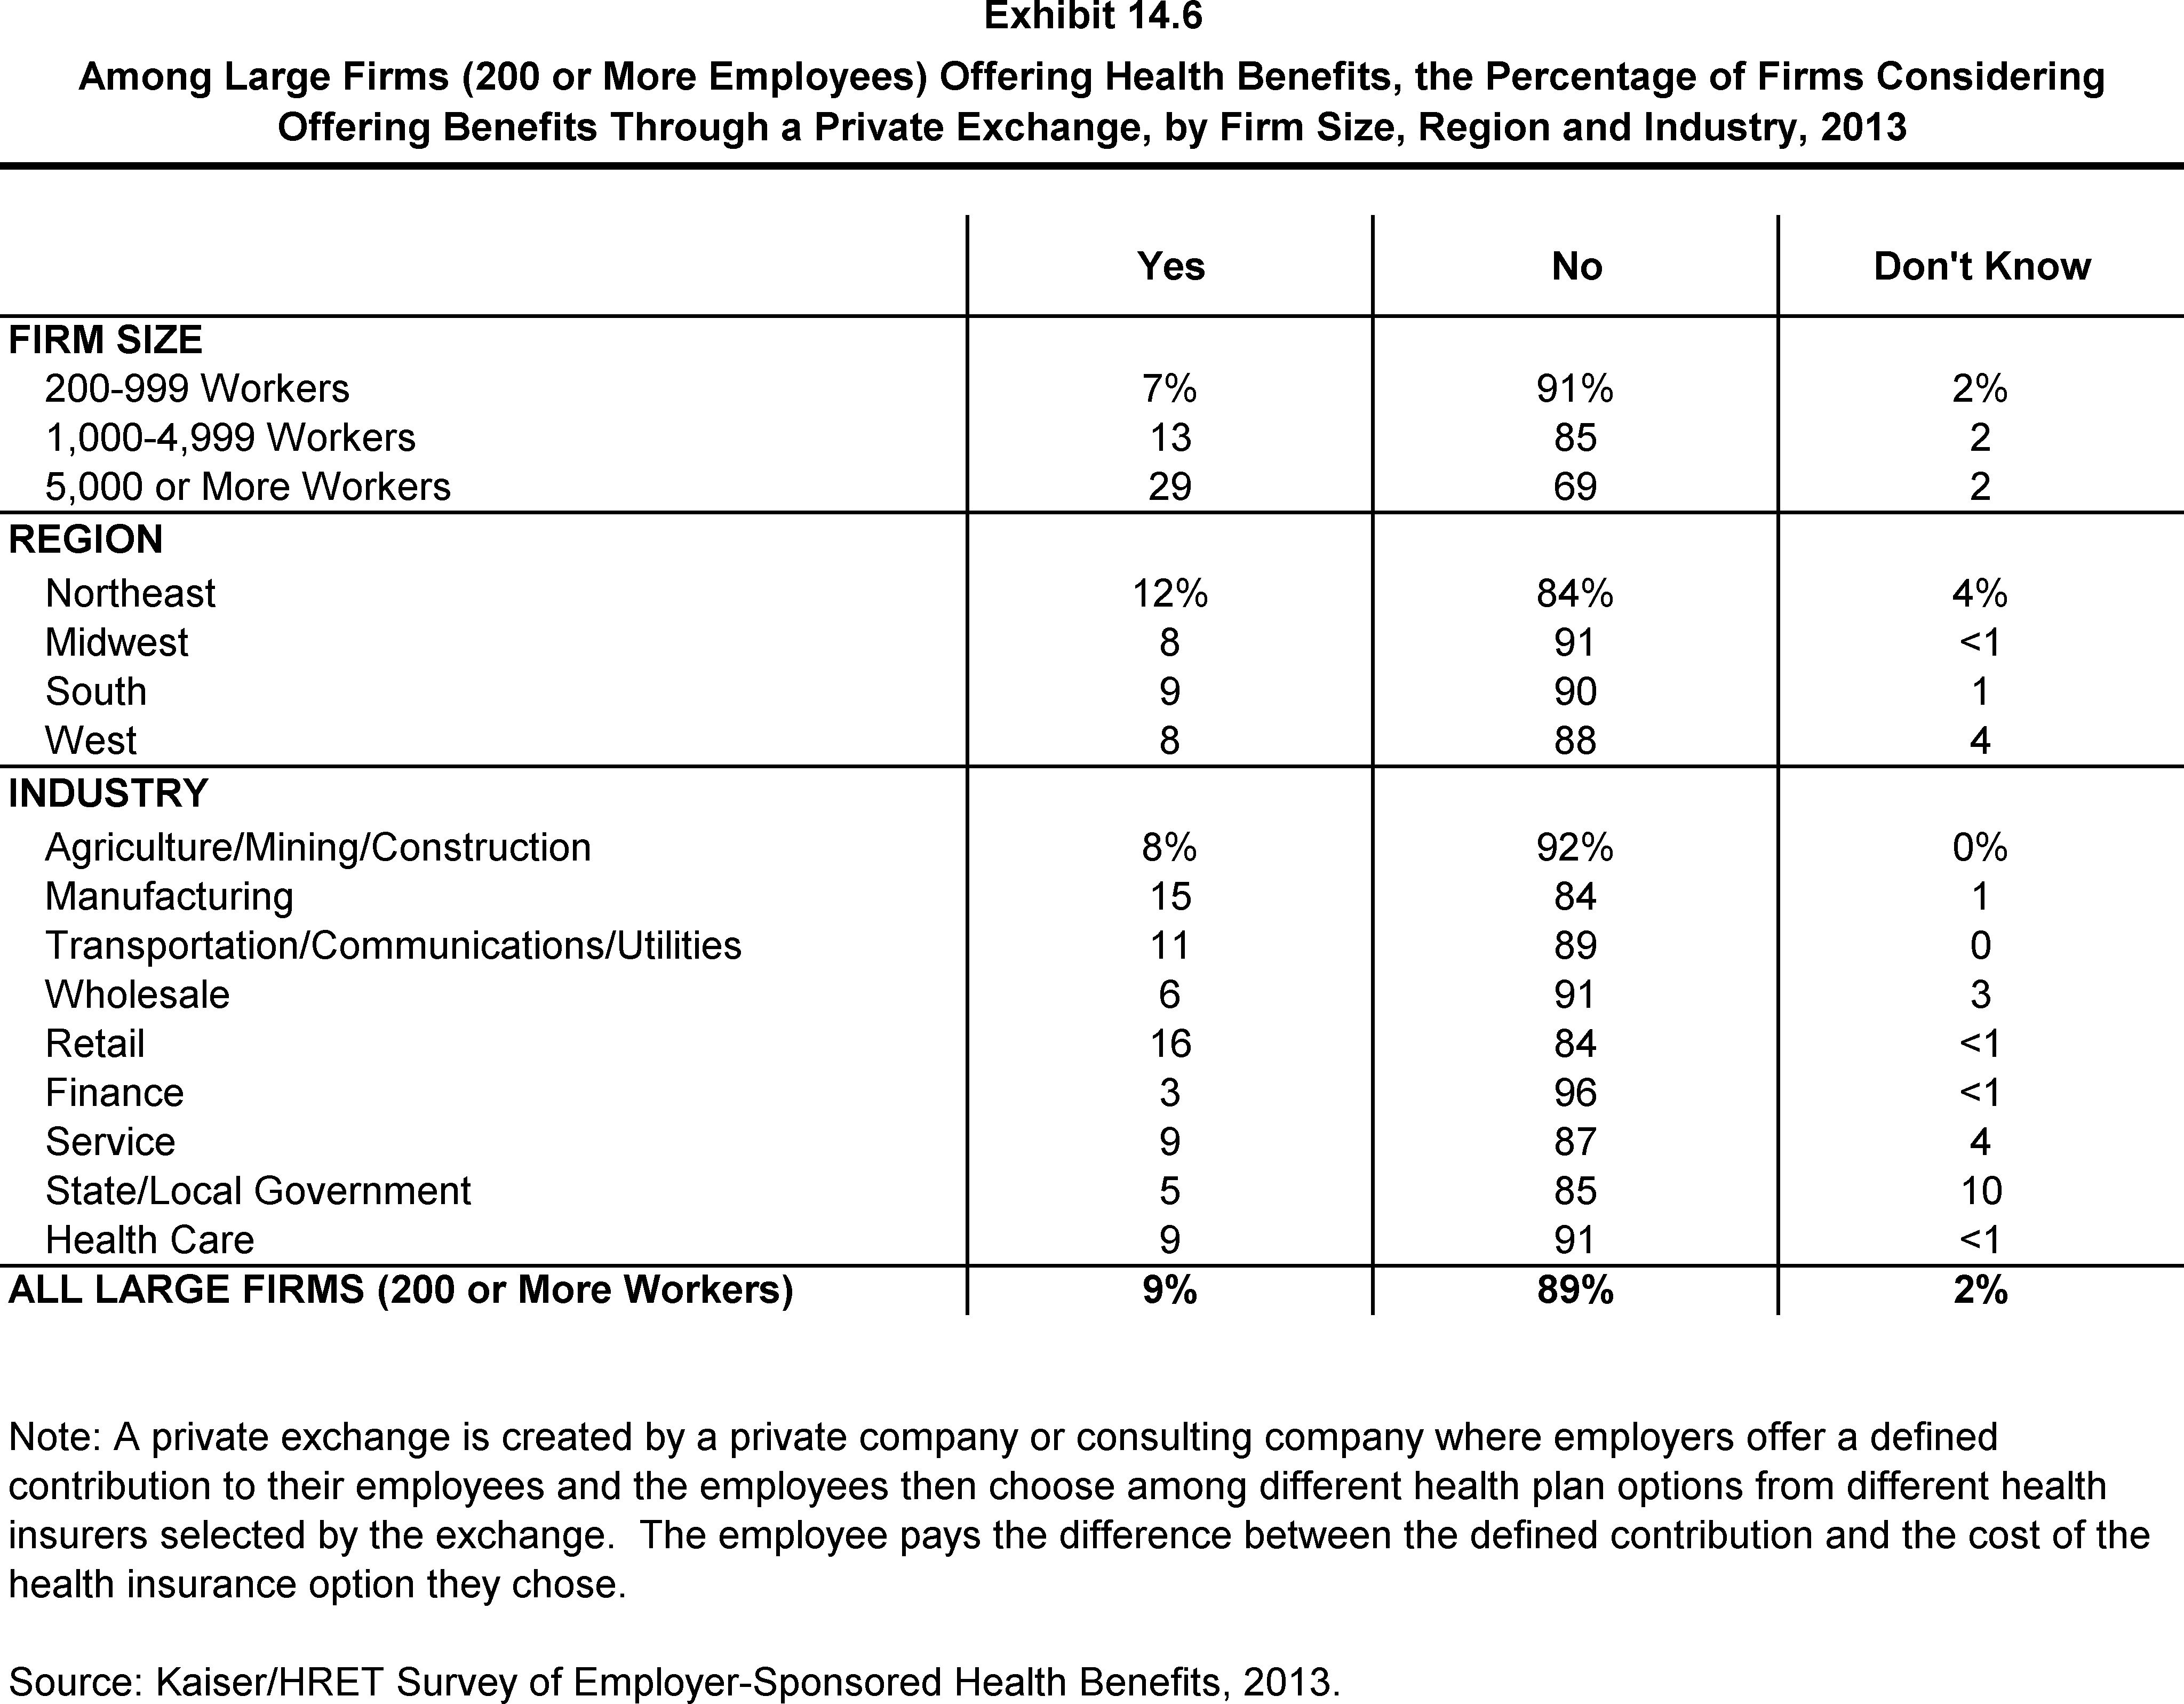
Among Large Firms (200 or More Employees) Offering Health Benefits, the Percentage of Firms Considering Offering Benefits Through a Private Exchange, by Firm Size, Region and Industry, 2013
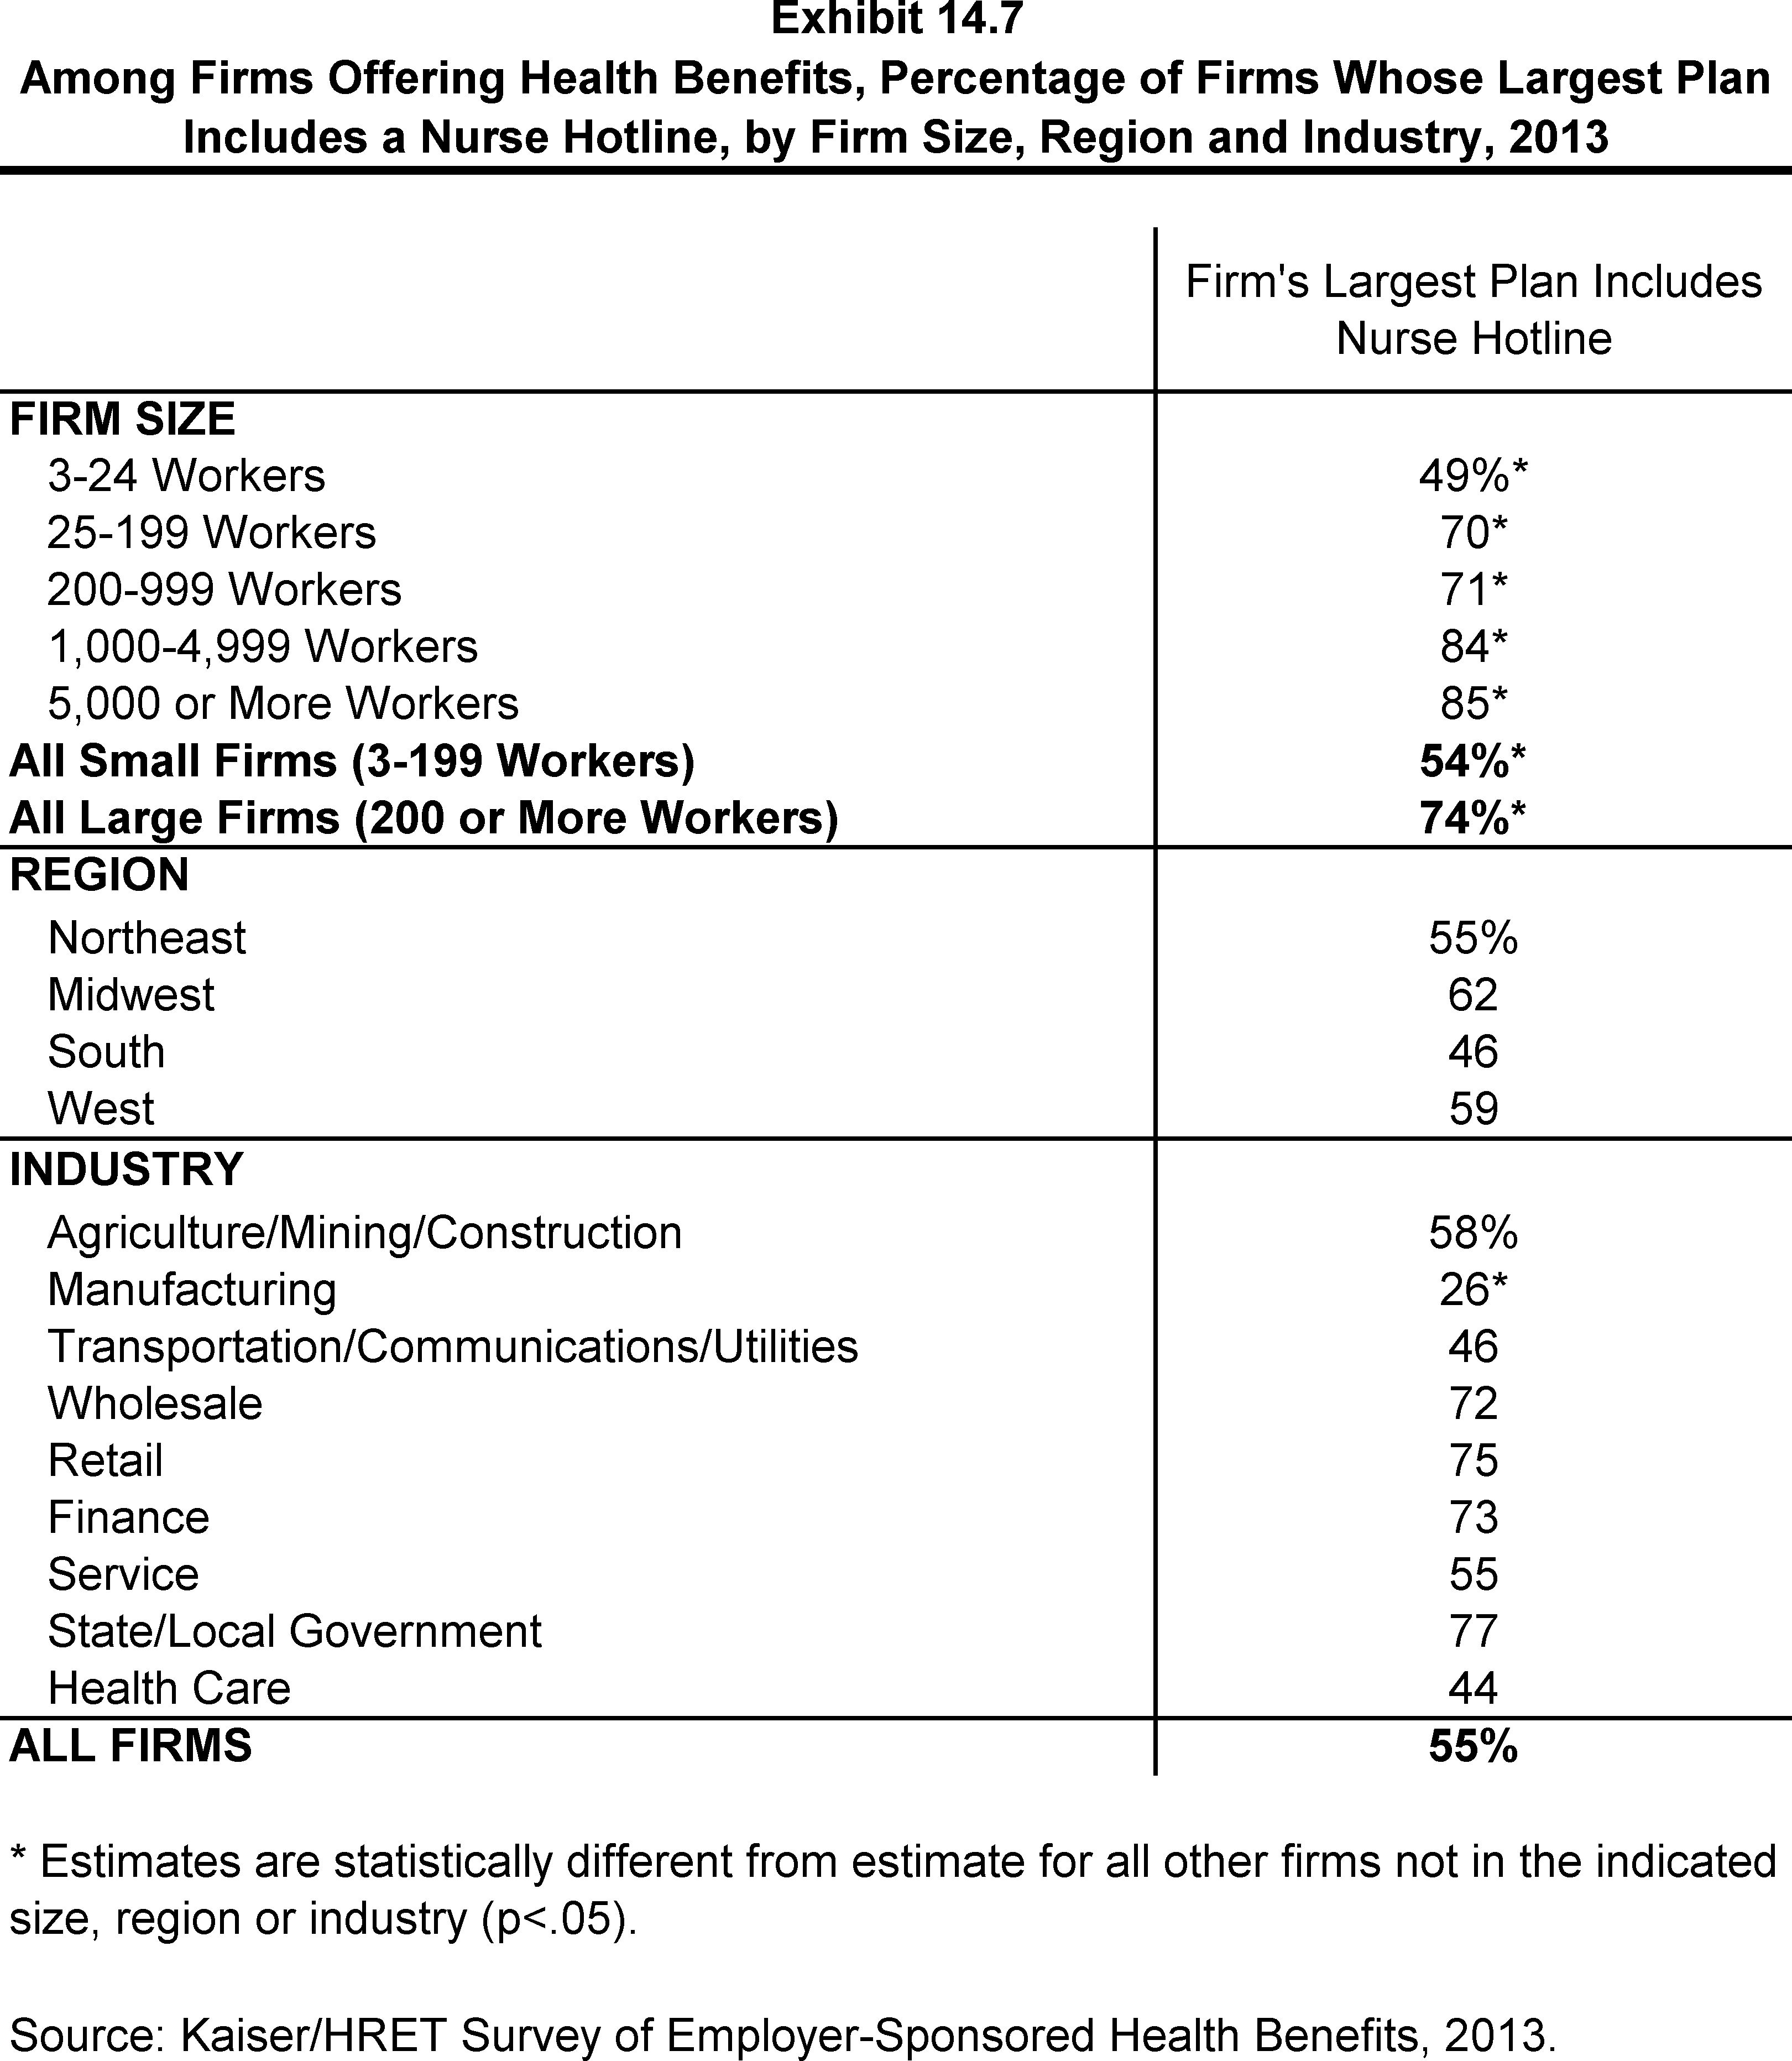
Among Firms Offering Health Benefits, Percentage of Firms Whose Largest Plan Includes a Nurse Hotline, by Firm Size, Region and Industry, 2013
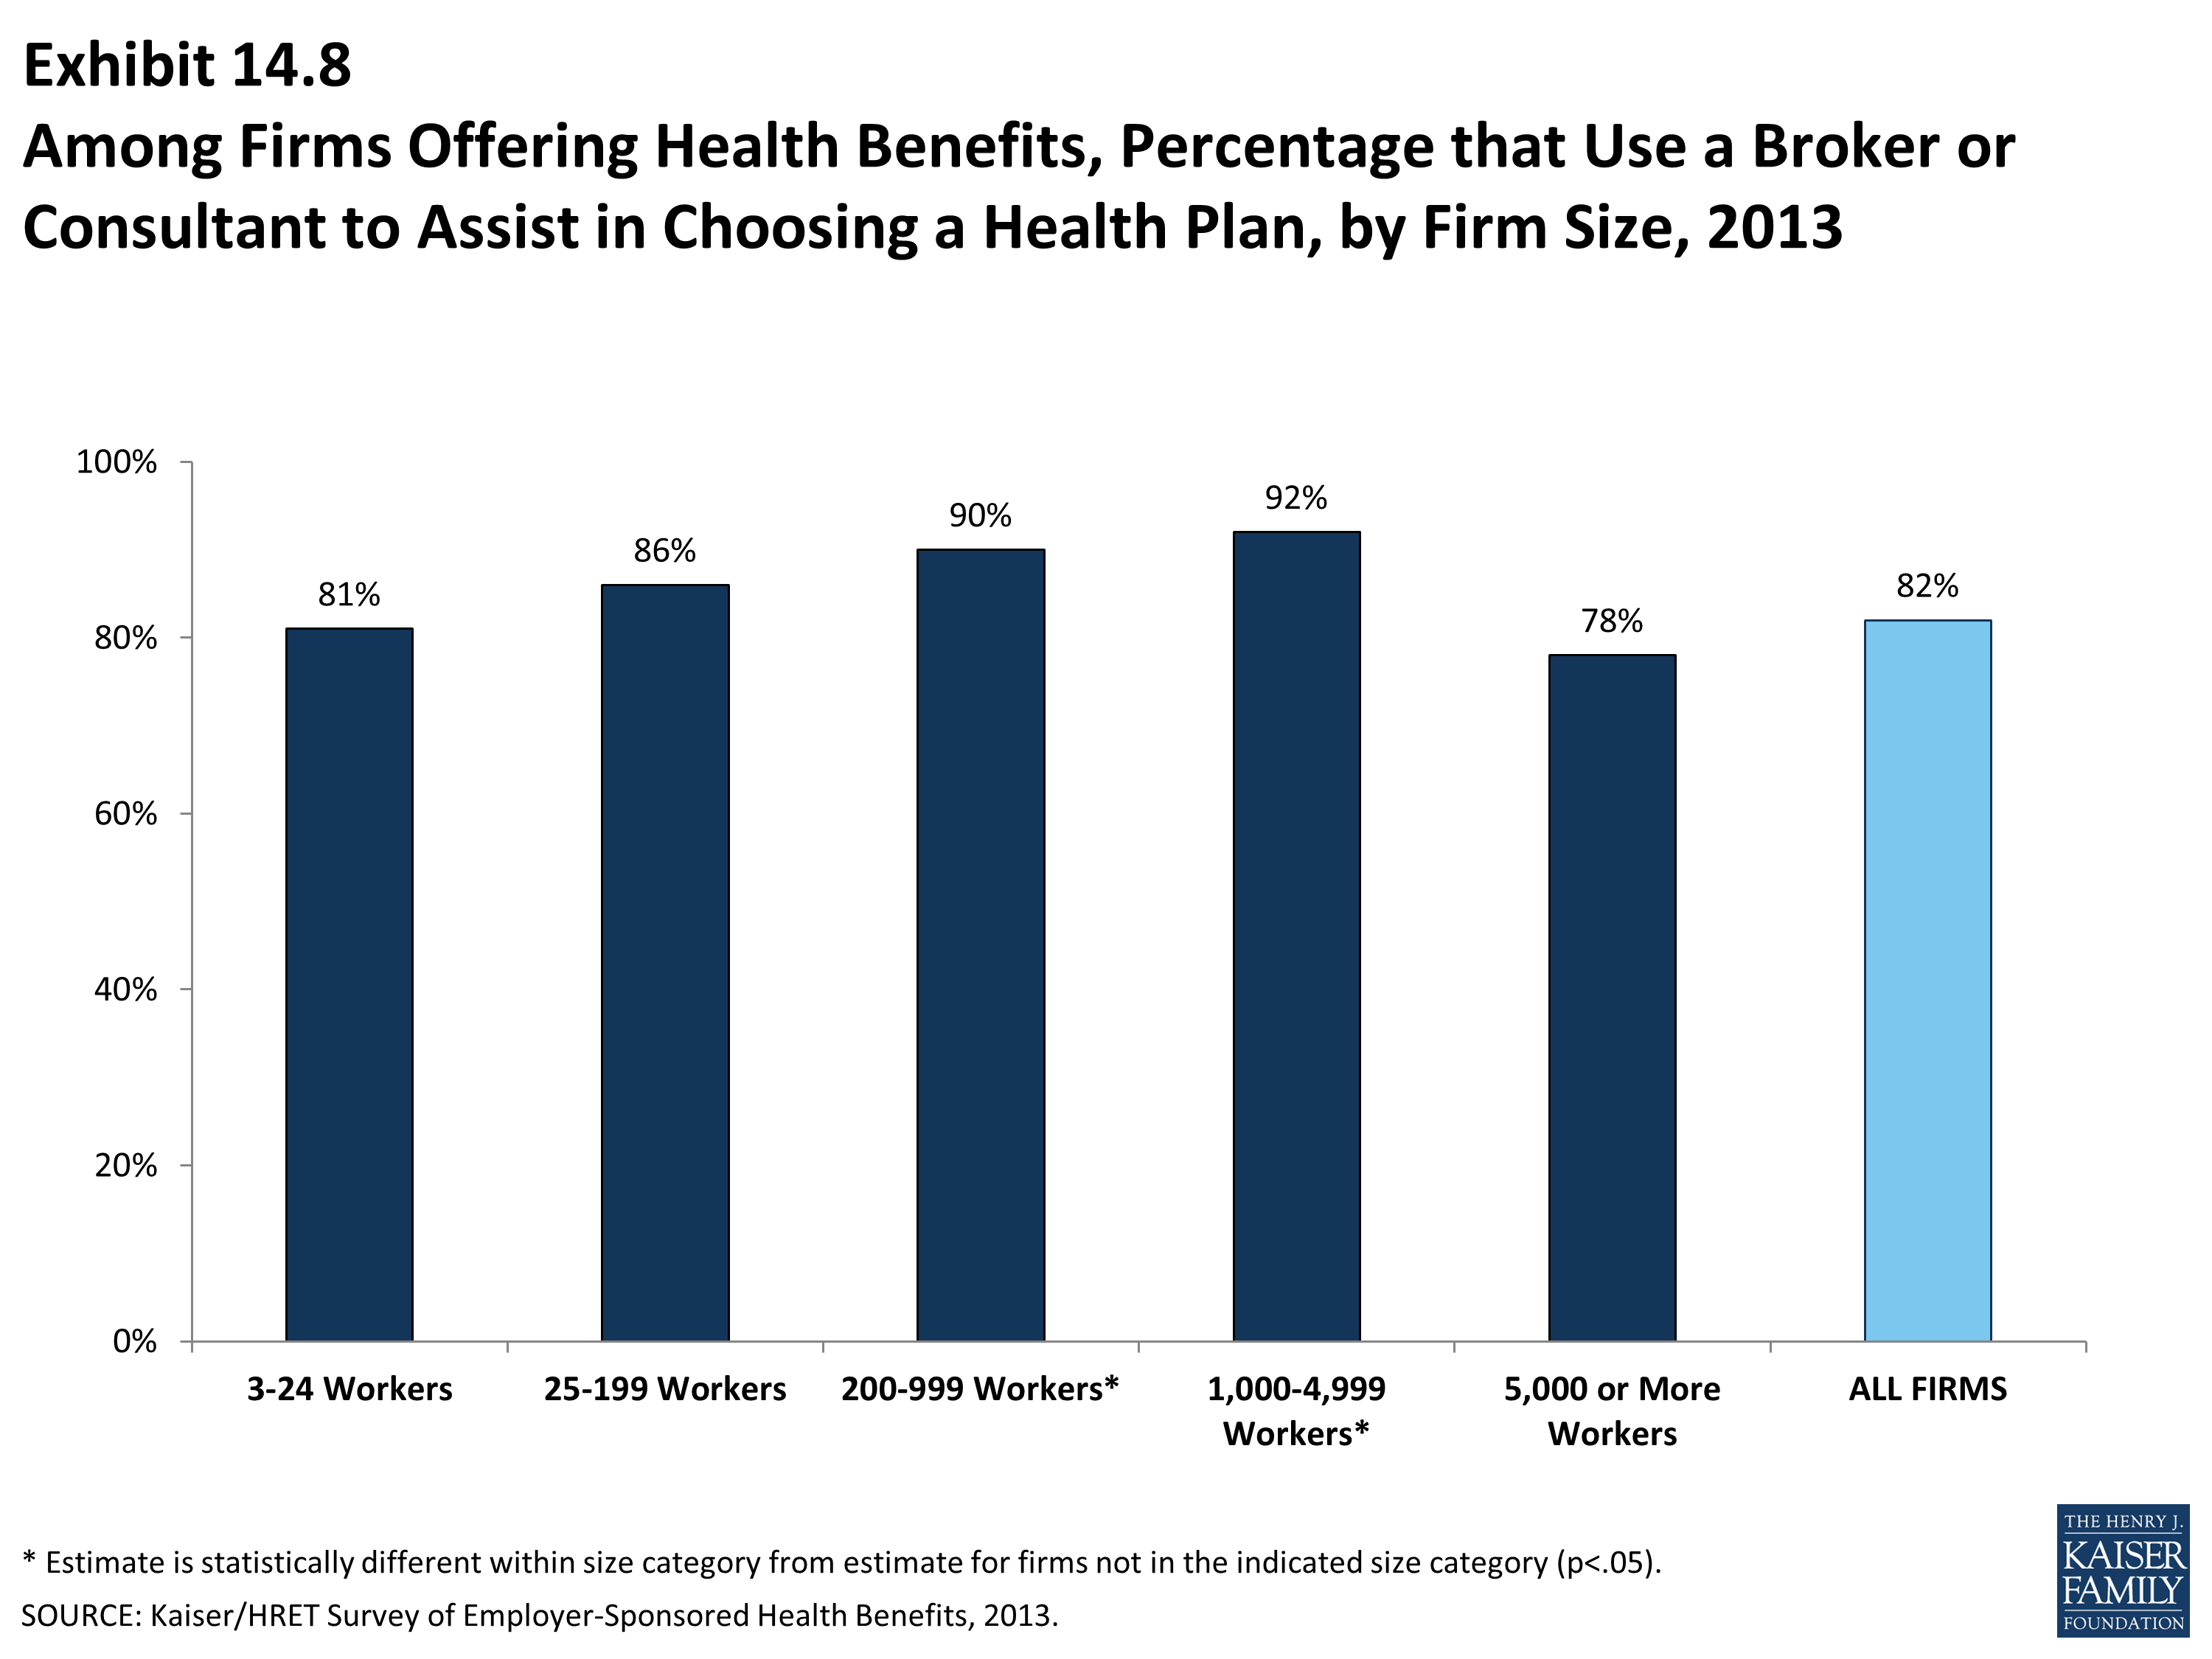
Among Firms Offering Health Benefits, Percentage that Use a Broker or Consultant to Assist in Choosing a Health Plan, by Firm Size, 2013
Methodology
Survey Design and Methods
The Kaiser Family Foundation and the Health Research & Educational Trust (Kaiser/HRET) conduct this annual survey of employer-sponsored health benefits. HRET, a nonprofit research organization, is an affiliate of the American Hospital Association. The Kaiser Family Foundation designs, analyzes, and conducts this survey in partnership with HRET, and also pays for the cost of the survey. KFF contracts with researchers at NORC at the University of Chicago (NORC) to work with Foundation and HRET researchers in conducting the study. Kaiser/HRET retained National Research, LLC (NR), a Washington, D.C.-based survey research firm, to conduct telephone interviews with human resource and benefits managers using the Kaiser/HRET survey instrument. From January to May 2013, NR completed full interviews with 2,067 firms.
Survey Topics
As in past years, Kaiser/HRET asked each participating firm as many as 400 questions about its largest health maintenance organization (HMO), preferred provider organization (PPO), point-of-service (POS) plan, and high-deductible health plan with a savings option (HDHP/SO).1 We treat EPOs and HMOs as one plan type and report the information under the banner of “HMO”; if an employer sponsors both an HMO and an EPO, they are asked about the attributes of the plan with the larger enrollment. Similarly, in 2013, plan information for conventional (or indemnity) plans was collected within the PPO battery following a similar approach. Less than one percent of firms which completed the PPO section had more enrollment in a conventional plan than a PPO plan.
As in past years, the survey includes questions on the cost of health insurance, health benefit offer rates, coverage, eligibility, enrollment patterns, premiums,2 employee cost sharing, prescription drug benefits, retiree health benefits, wellness benefits, and employer opinions.
Response Rate
After determining the required sample from U.S. Census Bureau data, Kaiser/HRET drew its sample from a Survey Sampling Incorporated list (based on an original Dun and Bradstreet list) of the nation’s private employers and from the Census Bureau’s Census of Governments list of public employers with three or more workers. To increase precision, Kaiser/HRET stratified the sample by ten industry categories and six size categories. Kaiser/HRET attempted to repeat interviews with prior years’ survey respondents (with at least ten employees) who participated in either the 2011 or the 2012 survey, or both. As a result, 1,622 of the 2,067 firms that completed the full survey also participated in either the 2011 or 2012 surveys, or both.3 The overall response rate is 49%.4
The vast majority of questions are asked only of firms that offer health benefits. A total of 1,865 of the 2,067 responding firms indicated that they offered health benefits. The response rate for firms that offer health benefits is 50%.
We asked one question of all firms in the study that we made phone contact with but the firm declined to participate. The question was, “Does your company offer a health insurance program as a benefit to any of your employees?” A total of 2,948 firms responded to this question (including 2,067 who responded to the full survey and 881 who responded to this one question). These responses are included in our estimates of the percentage of firms offering health benefits.5 The response rate for this question is 70%. In 2012 the calculation of the response rates was adjusted to be slightly more conservative than previous years.
Firm Size Categories and Key Definitions
Throughout the report, exhibits categorize data by size of firm, region, and industry. Firm size definitions are as follows: small firms: 3 to 199 workers; and large firms: 200 or more workers. Exhibit M.1 shows selected characteristics of the survey sample. A firm’s primary industry classification is determined from SSI’s designation on the sampling frame. A firm’s ownership category and other firm characteristics used in exhibits such as 3.2 and 6.19 are based on respondents’ answers.
Exhibit M.2 displays the distribution of the nation’s firms, workers, and covered workers (employees receiving coverage from their employer). Among the over three million firms nationally, approximately 60.8% are firms employing 3 to 9 workers; such firms employ 8.2% of workers, and 3.6% of workers covered by health insurance. In contrast, less than one percent of firms employ 1,000 or more workers; these firms employ 48% of workers and 53% of covered workers. Therefore, the smallest firms dominate any statistics weighted by the number of employers. For this reason, most statistics about firms are broken out by size categories. In contrast, firms with 1,000 or more workers are the most important employer group in calculating statistics regarding covered workers, since they employ the largest percentage of the nation’s workforce.
Throughout this report, we use the term “in-network” to refer to services received from a preferred provider. Family coverage is defined as health coverage for a family of four.
Each year, the survey asks firms for the percentage of their employees who earn less than a specified amount in order to identify the portion of a firm’s workforce that has relatively low wages. This year, the income threshold is $23,000 per year for low-wage workers and $56,000 for high-wage workers. These thresholds are based on the 25th and 75th percentile of workers’ earnings as reported by the Bureau of Labor Statistics using data from the Occupational Employment Statistics (OES) (2011).6 The cutoffs were inflation adjusted and rounded to the nearest thousand. In previous years wage cuts offs were calculated using the now eliminated National Compensation Survey.
Rounding and Imputation
Some exhibits in the report do not sum to totals due to rounding effects. In a few cases, numbers from distribution exhibits may not add to the numbers referenced in the text due to rounding. Although overall totals and totals for size and industry are statistically valid, some breakdowns may not be available due to limited sample sizes. Where the unweighted sample size is fewer than 30 observations, exhibits include the notation “NSD” (Not Sufficient Data).
To control for item nonresponse bias, Kaiser/HRET imputes values that are missing for most variables in the survey. On average, 3% of observations are imputed. All variables are imputed following a hotdeck approach. In 2013, there were 14 variables where the imputation rate exceeded 20%. For these cases, the unimputed variable is compared with the imputed variable. There are a few variables that Kaiser/HRET has decided not to impute; these are typically variables where “don’t know” is considered a valid response option (for example, firms’ opinions about effectiveness of various strategies to control health insurance costs). In addition, there are several variables in which missing data is calculated based on respondents’ answers to other questions (for example, when missing employer contributions to premiums are calculated from the respondent’s premium and the ratio of contributions to premiums).
In 2012 the method to calculate missing premiums and contributions was revised; if a firm provides a premium for single coverage or family coverage, or a worker contribution for single coverage or family coverage, that information was used in the imputation. For example, if a firm provided a worker contribution for family coverage but no premium information, a ratio between the family premium and family contribution was imputed and then the family premium was calculated. In addition, in cases where premiums or contributions for both family and single coverage were missing, the hotdeck procedure was revised to draw all four responses from a single firm. The change in the imputation method did not make a significant impact on the premium or contribution estimates.
Sample Design
We determined the sample requirements based on the universe of firms obtained from the U.S. Census. Prior to the 2010 survey, the sample requirements were based on the total counts provided by Survey Sampling Incorporated (SSI) (which obtains data from Dun and Bradstreet). Over the years, we found the Dun and Bradstreet frequency counts to be volatile due to duplicate listings of firms, or firms that are no longer in business. These inaccuracies vary by firm size and industry. In 2003, we began using the more consistent and accurate counts provided by the Census Bureau’s Statistics of U.S. Businesses and the Census of Governments as the basis for post-stratification, although the sample was still drawn from a Dun and Bradstreet list. In order to further address this concern at the time of sampling, starting in 2009 we use Census data as the basis for the sample.
Starting in 2010, we also defined Education as a separate sampling category, rather than as a subgroup of the Service category. In the past, Education firms were a disproportionately large share of Service firms. Education is controlled for during post-stratification, and adjusting the sampling frame to also control for Education allows for a more accurate representation of both the Education and Service industries.
In past years, both private and government firms were sampled from the Dun and Bradstreet database. Beginning in 2009, Government firms were sampled from the 2007 Census of Governments. This change was made to eliminate the overlap of state agencies that were frequently sampled from the Dun and Bradstreet database. The sample of private firms is screened for firms that are related to state/local governments, and if these firms are identified in the Census of Governments, they are reclassified as government firms and a private firm is randomly drawn to replace the reclassified firm. The federal government is not included in the sample frame.
Finally, the data used to determine the 2013 Employer Health Benefits sample frame include the U.S. Census’ 2009 Statistics of U.S. Businesses and the 2007 Census of Governments. At the time of the sample design (December 2012), these data represented the most current information on the number of public and private firms nationwide with three or more workers. As in the past, the post-stratification is based on the most up-to-date Census data available (the 2010 update to the Census of U.S. Businesses was purchased during the survey field period). The Census of Governments is conducted every five years; this is the fifth year the data from the 2007 Census of Governments has been available for use.
In 2012, the method for calculating the size of the sample was adjusted. Rather than using a combined response rate for panel and non-panel firms, separate response rates were used to calculate the number of firms to be selected in each strata. In addition, the Mining stratum was collapsed into the Agriculture and Construction industry grouping. In sum, changes to the sampling method required more firms to be included and may have reduced the response rate in order to provide more balanced power within each strata.
Weighting and Statistical Significance
Because Kaiser/HRET selects firms randomly, it is possible through the use of statistical weights to extrapolate the results to national (as well as firm size, geography, regional, and industry) averages. These weights allow Kaiser/HRET to present findings based on the number of workers covered by health plans, the number of total workers, and the number of firms. In general, findings in dollar amounts (such as premiums, worker contributions, and cost sharing) are weighted by covered workers. Other estimates, such as the offer rate, are weighted by firms. Specific weights were created to analyze the HDHP/SO plans that are offered with an HRA or that are HSA-qualified. These weights represent the proportion of employees enrolled in each of these arrangements.
Calculation of the weights follows a common approach. First, the basic weight is determined, followed by a nonresponse adjustment. As part of this nonresponse adjustment, Kaiser/HRET conducted a small follow-up survey of those firms with 3 to 49 workers that refused to participate in the full survey. Just as in years passed, Kaiser/HRET conducted a McNemar test to verify that the results of the follow-up survey are comparable to the results from the original survey. Next, we trimmed the weights in order to reduce the influence of weight outliers. First, we identified common groups of observations. Within each group, we identified the median and the interquartile range of the weights and calculated the trimming cut point as the median plus six times the interquartile range (M + [6 * IQR]). Weight values larger than this cut point are trimmed to the cut point. In all instances, less than one percent of the weight values were trimmed. Finally, we calibrated the weights to U.S. Census Bureau’s 2009 Statistics of U.S. Businesses for firms in the private sector, and the 2007 Census of Governments as the basis for calibration / post-stratification for public sector firms. Historic employer weighted statistics were updated in 2011.
Between 2006 and 2012 only limited information was collected on conventional plans. Starting in 2013, information on conventional plans was collected under the PPO section and therefore the covered worker weight was representative of all plan types.
The survey contains a few questions on employee cost sharing that are asked only of firms that indicate in a previous question that they have a certain cost-sharing provision. For example, the copayment amount for prescription drugs is asked only of those that report they have copayments for prescription drugs. Because the composite variables (using data from across all plan types) are reflective of only those plans with the provision, separate weights for the relevant variables were created in order to account for the fact that not all covered workers have such provisions.
To account for design effects, the statistical computing package R and the library package “survey” were used to calculate standard errors.7,8 All statistical tests are performed at the .05 confidence level, unless otherwise noted. For figures with multiple years, statistical tests are conducted for each year against the previous year shown, unless otherwise noted. No statistical tests are conducted for years prior to 1999. In 2012 the method to test the difference between distributions across years was changed to use a Wald test which accounts for the complex survey design. In general this method was more conservative than the approach used in prior years. Exhibits such as 7.9, 7.10, 7.16 etc. are affected by the change.
Statistical tests for a given subgroup (firms with 25-49 workers, for instance) are tested against all other firm sizes not included in that subgroup (all firm sizes NOT including firms with 25-49 workers, in this example). Tests are done similarly for region and industry; for example, Northeast is compared to all firms NOT in the Northeast (an aggregate of firms in the Midwest, South, and West). However, statistical tests for estimates compared across plan types (for example, average premiums in PPOs) are tested against the “All Plans” estimate. In some cases, we also test plan-specific estimates against similar estimates for other plan types (for example, single and family premiums for HDHP/SOs against single and family premiums for HMO, PPO, and POS plans); these are noted specifically in the text. The two types of statistical tests performed are the t-test and the Wald test.
The small number of observations for some variables resulted in large variability around the point estimates. These observations sometimes carry large weights, primarily for small firms. The reader should be cautioned that these influential weights may result in large movements in point estimates from year to year; however, often these movements are not statistically significant.
Additional Notes on the 2013 Survey
In 2012, average coinsurance rates for prescription drugs, primary care office visits, specialty office visits, and emergency room visits include firms that have a minimum and/or maximum attached to the rate. In years prior to 2012, we did not ask firms the structure of their coinsurance rate. For most prescription drug tiers, and most services, the average coinsurance rate is not statistically different depending on whether the plan has a minimum or maximum.
Historical Data
Data in this report focus primarily on findings from surveys jointly authored by the Kaiser Family Foundation and the Health Research & Educational Trust, which have been conducted since 1999. Prior to 1999, the survey was conducted by the Health Insurance Association of America (HIAA) and KPMG using a similar survey instrument, but data are not available for all the intervening years. Following the survey’s introduction in 1987, the HIAA conducted the survey through 1990, but some data are not available for analysis. KPMG conducted the survey from 1991-1998. However, in 1991, 1992, 1994, and 1997, only larger firms were sampled. In 1993, 1995, 1996, and 1998, KPMG interviewed both large and small firms. In 1998, KPMG divested itself of its Compensation and Benefits Practice, and part of that divestiture included donating the annual survey of health benefits to HRET.
This report uses historical data from the 1993, 1996, and 1998 KPMG Surveys of Employer-Sponsored Health Benefits and the 1999-2013 Kaiser/HRET Survey of Employer-Sponsored Health Benefits. For a longer-term perspective, we also use the 1988 survey of the nation’s employers conducted by the HIAA, on which the KPMG and Kaiser/HRET surveys are based. The survey designs for the three surveys are similar.
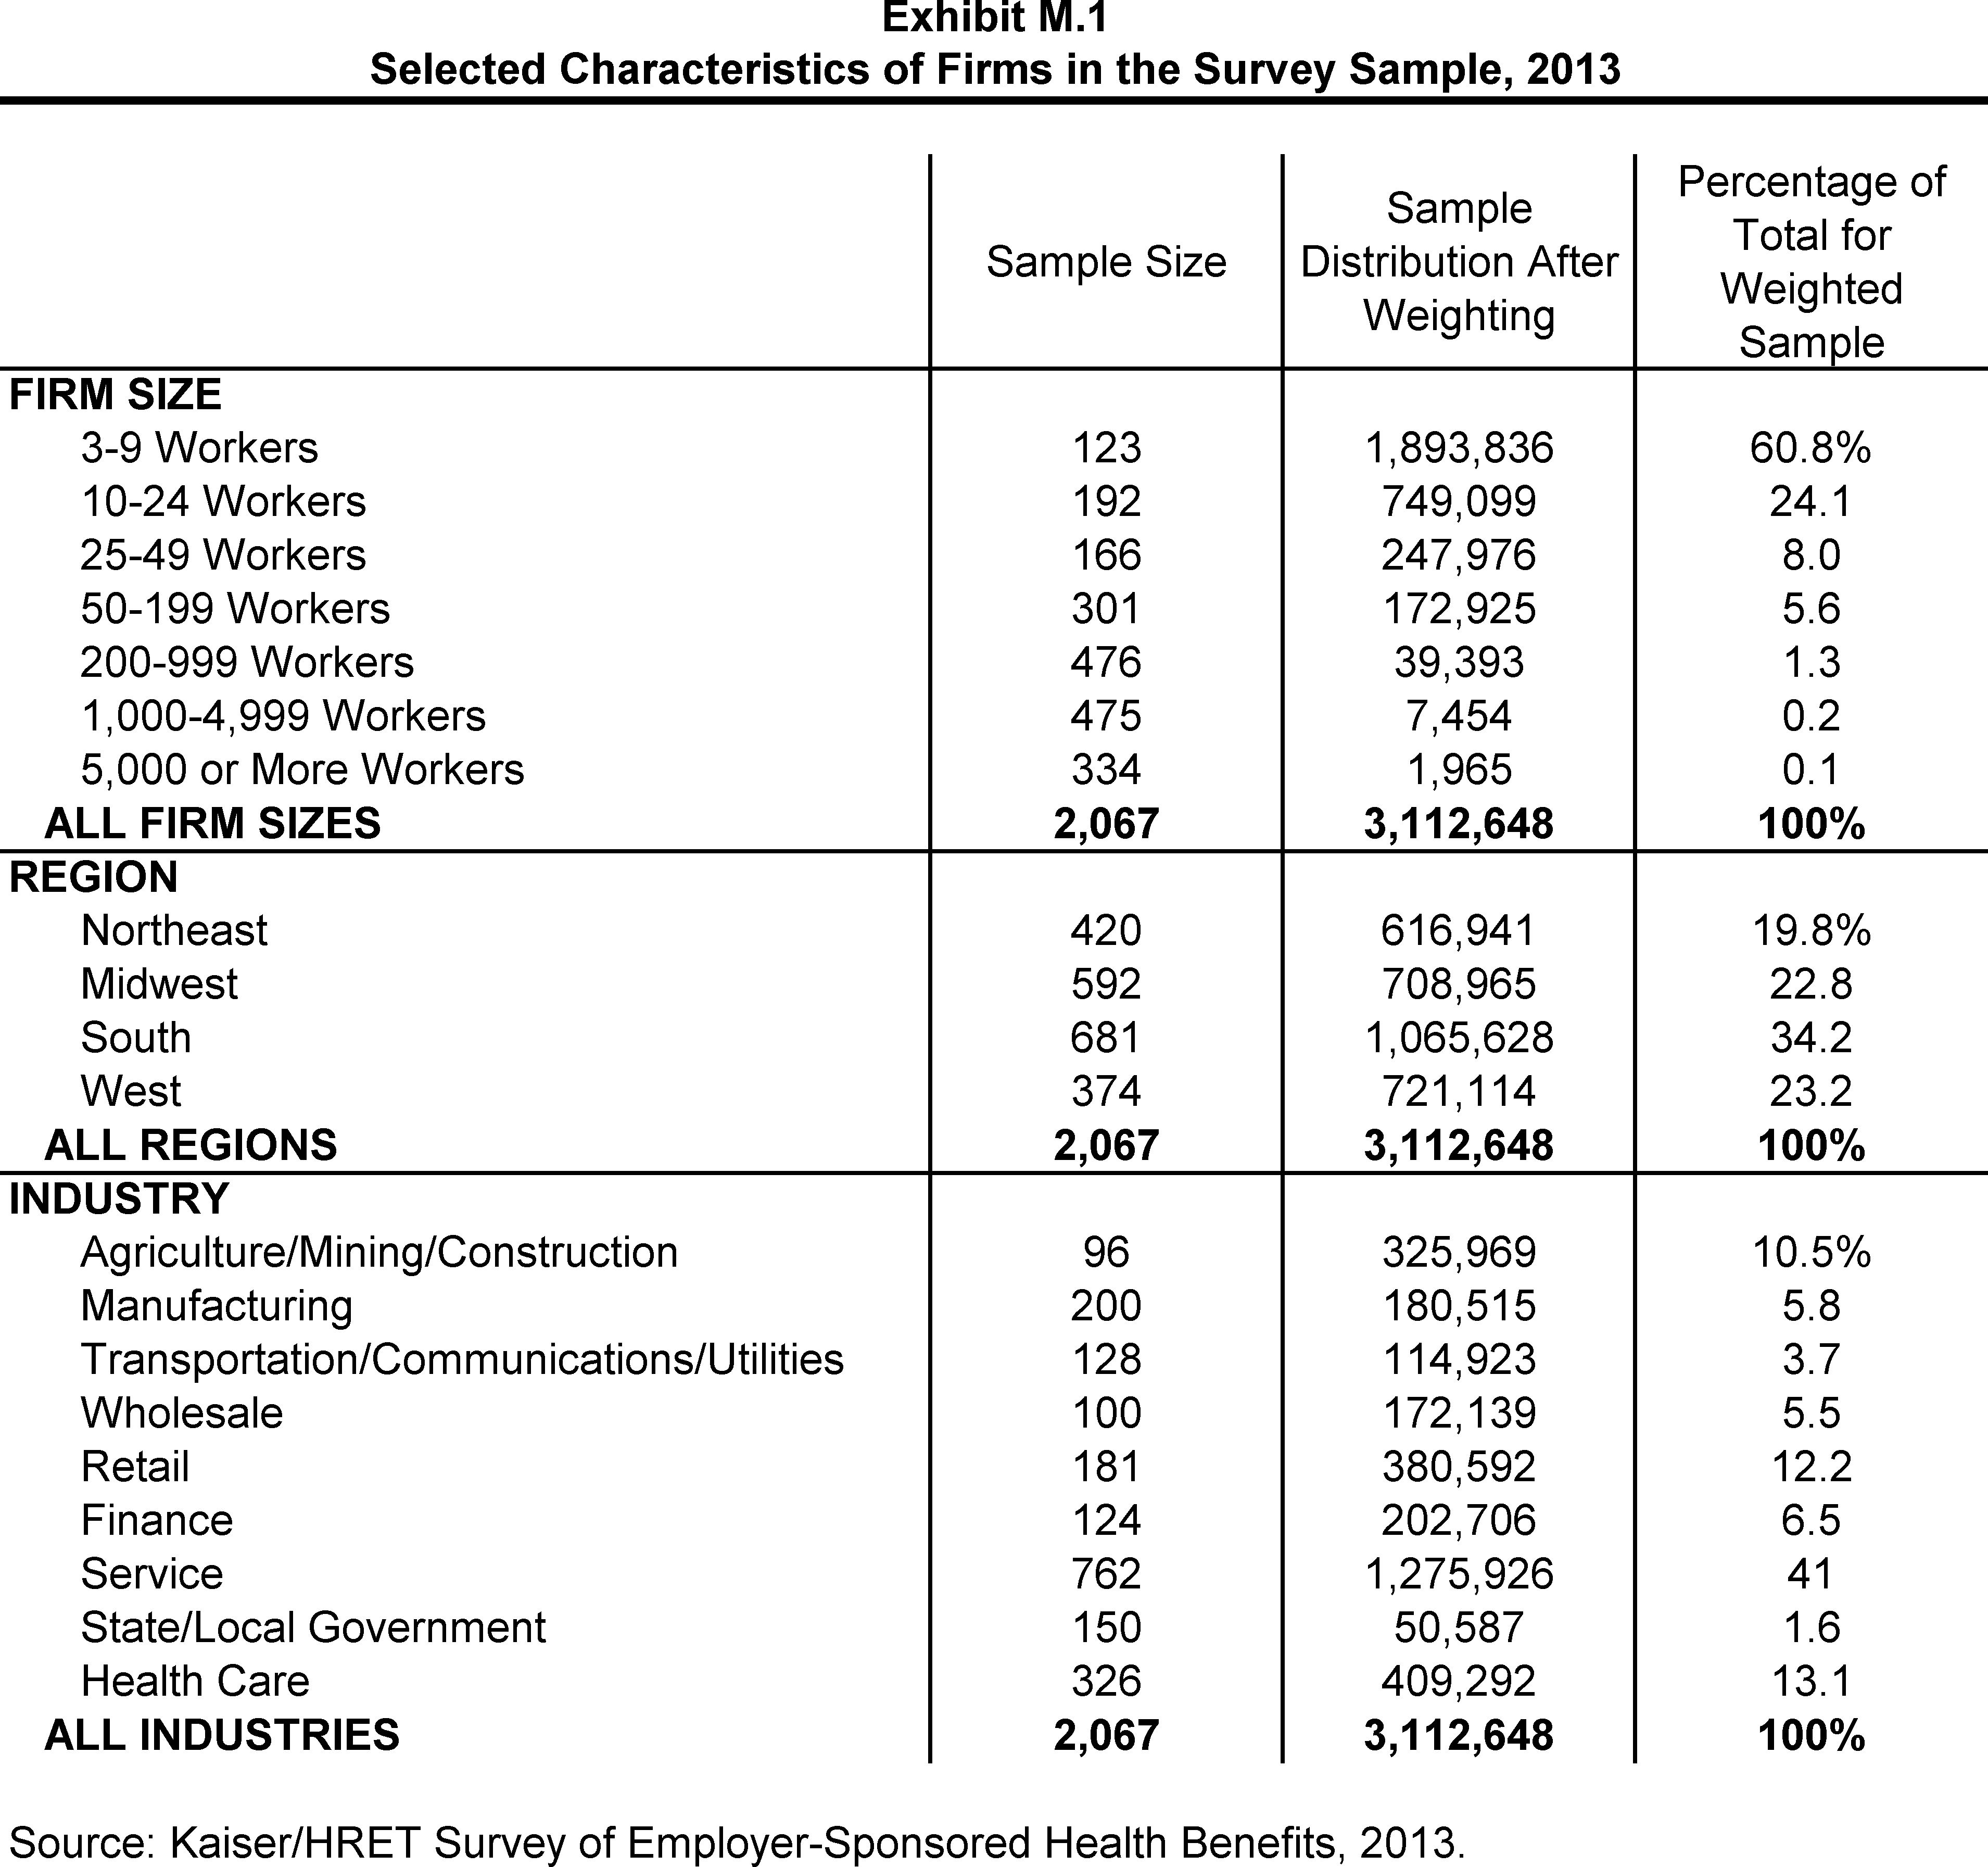
Selected Characteristics of Firms in the Survey Sample, 2013
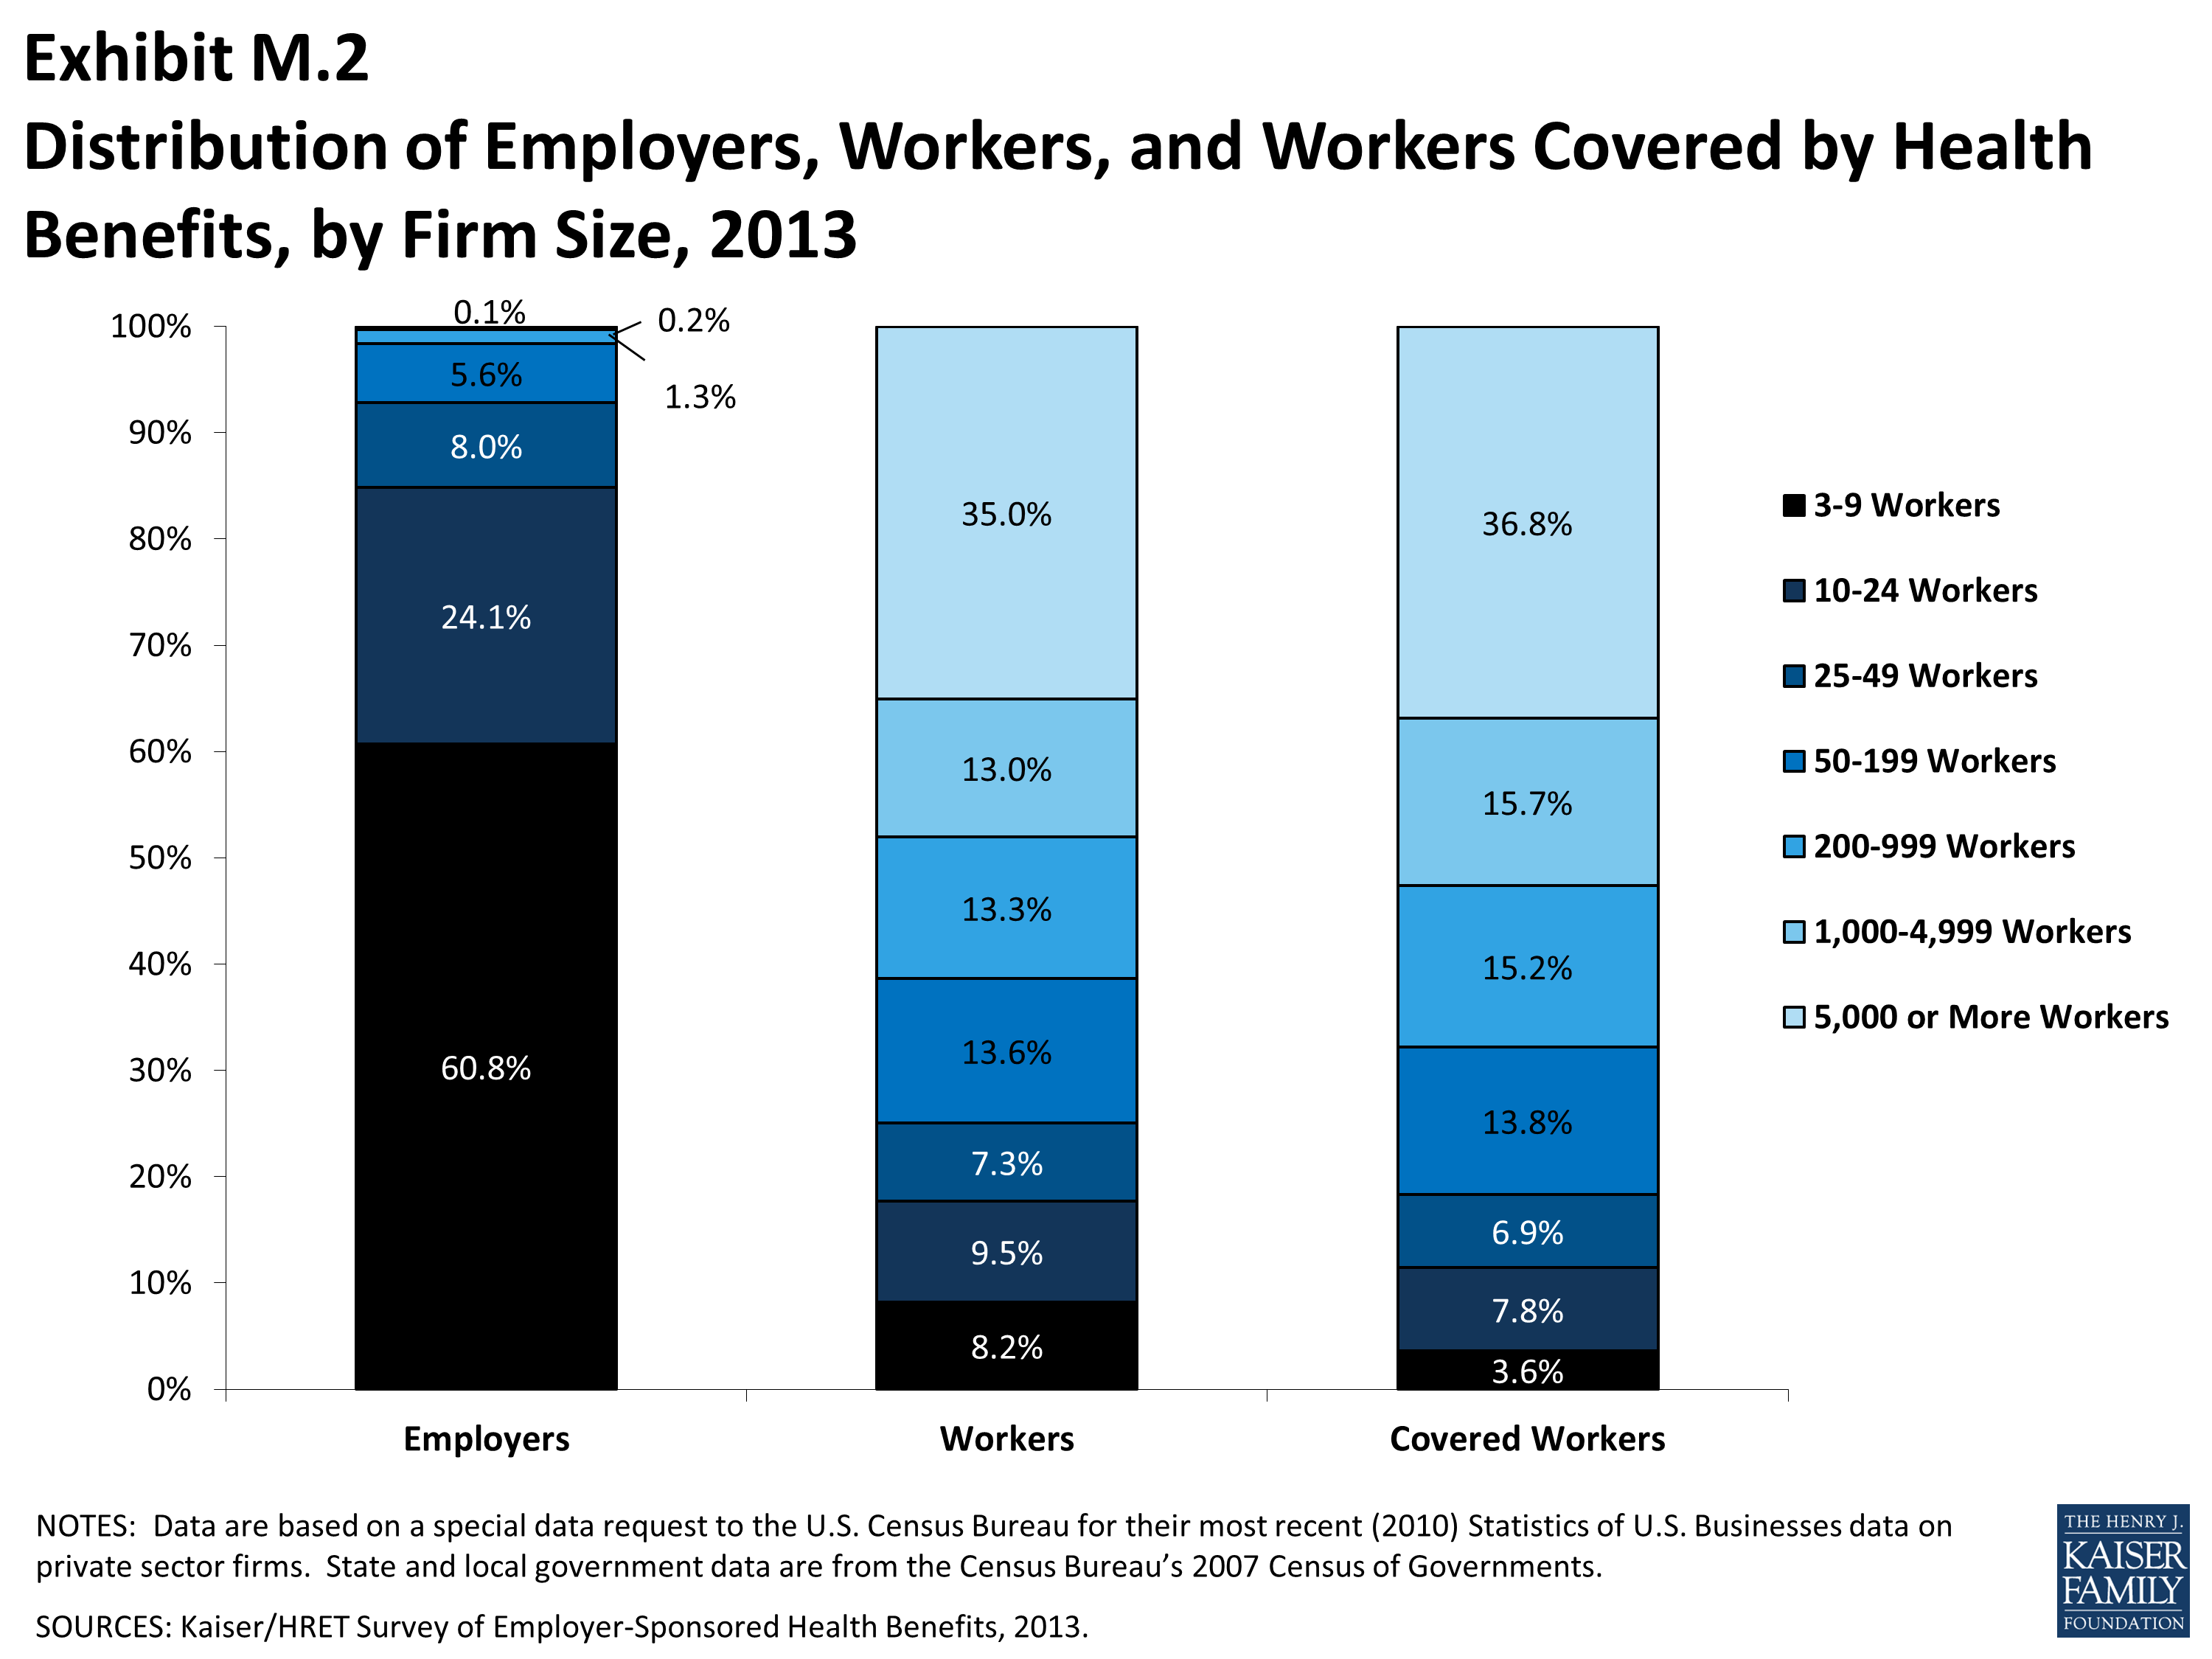
Distribution of Employers, Workers, and Workers Covered by Health Benefits, by Firm Size, 2013
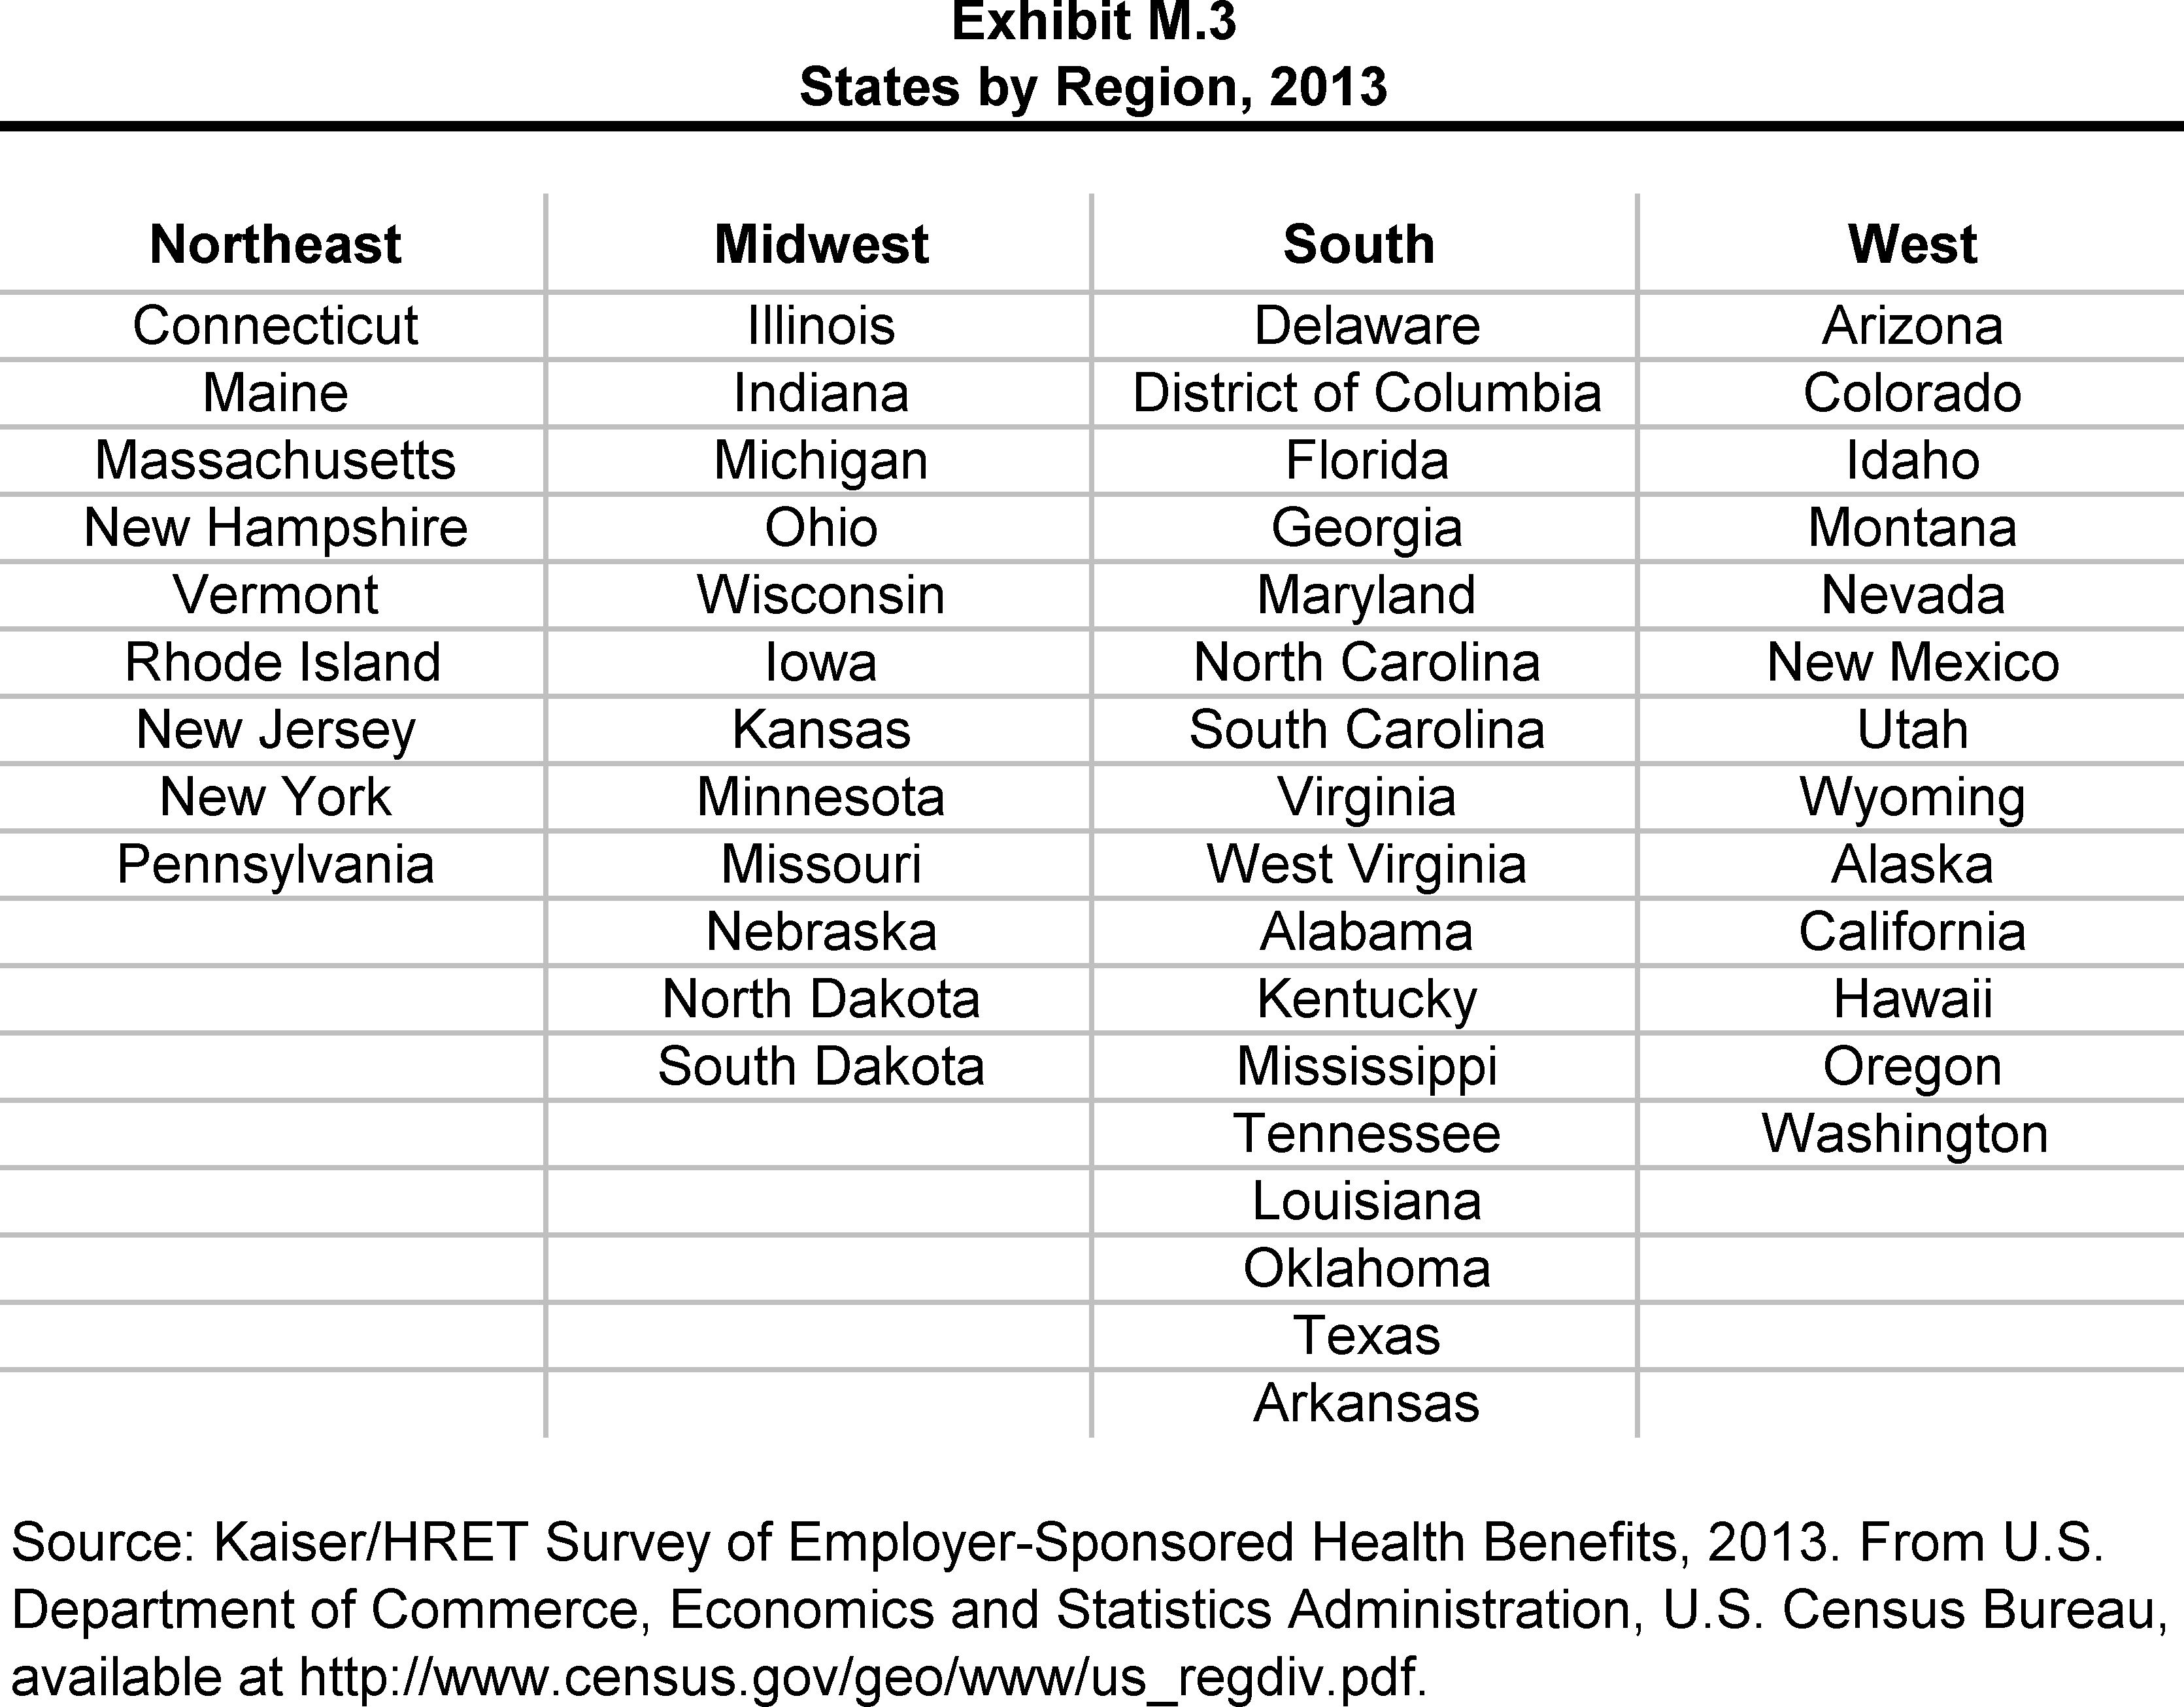
States by Region, 2013
Endnotes
Summary of Findings
2013 Summary of Findings
Kaiser Family Foundation, Kaiser Commission on Medicaid and the Uninsured, The Uninsured: A Primer: Key Facts About Americans Without Health Insurance, October 2012. http://www.kff.org/uninsured/issue-brief/the-uninsured-a-primer/. 56% of the non-elderly American population receives insurance coverage through an employer-sponsored plan.
Kaiser/HRET surveys use the April-to-April time period, as do the sources in this and the following note. The inflation numbers are not seasonally adjusted. Bureau of Labor Statistics. Consumer Price Index - All Urban Consumers [Internet]. Washington (DC): Department of Labor; 2012 [cited 2013 June 16]. Available from: http://data.bls.gov/timeseries/CUUR0000SA0?output_view=pct_1mth. Wage data are from the Bureau of Labor Statistics and based on the change in total average hourly earnings of production and nonsupervisory employees. Employment, hours, and earnings from the Current Employment Statistics survey [Internet]. Washington (DC): Department of Labor; 2013 [cited 201 June 16]. Available from: http://data.bls.gov/timeseries/CES0500000008.
Federal Register. Vol. 75, No 221, November 17, 2010, http://www.gpo.gov/fdsys/pkg/FR-2010-11-17/pdf/2010-28861.pdf.
Birhanzel R, Brown S, Tauber J. Are you ready? Private health insurance exchanges are looming. Washington, DC): Accenture; 2013 [cited 2013 Jul 19]. Available from: http://www.accenture.com/SiteCollectionDocuments/PDF/Accenture-Are-You-Ready-Private-Health-Insurance-Exchanges-Are-Looming.pdf.
Fronstin P. Private health insurance exchanges and defined contribution health plans: is it déjà vu all over again?. Washington (DC): Employee Benefit Research Institute; 2012 Jul [cited 2013 Jul 19]. (Issue Brief No. 373). Available from: http://www.ebri.org/pdf/briefspdf/EBRI_IB_07-2012_No373_Exchgs2.pdf.
Report
Section Three: Employee Coverage, Eligibility, and Participation
Kaiser Family Foundation, Kaiser Commission on Medicaid and the Uninsured, The Uninsured: A Primer: Key Facts About Americans Without Health Insurance, October 2012. http://www.kff.org/uninsured/issue-brief/the-uninsured-a-primer/. 56% of the non-elderly American population receives insurance coverage through an employer-sponsored plan.
In 2009, Kaiser/HRET began weighting the percentage of workers that take up coverage by the number of workers eligible for coverage. The historical take up estimates have also been updated. See the Survey Design and Methods section for more information.
Section Four: Types of Plans Offered
Starting in 2010 we included firms that said they offer a plan type even if there are no covered workers in that plan type.
Section Six: Worker and Employer Contributions for Premiums
Estimates for premiums, worker contributions to premiums, and employer contributions to premiums presented in Section 6 do not include contributions made by the employer to Health Savings Accounts (HSAs) or Health Reimbursement Arrangements (HRAs). See Section 8 for estimates of employer contributions to HSAs and HRAs.
For definitions of Self-Funded and Fully Insured plans, see the introduction to Section 10.
Section Seven: Employee Cost Sharing
Some workers with separate per-person deductibles or out-of-pocket maximums for family coverage do not have a specific number of family members that are required to meet the deductible amount and instead have another type of limit, such as a per-person amount with a total dollar amount limit. These responses are included in the averages and distributions for separate family deductibles and out-of-pocket maximums.
Starting in 2010, the survey asked about the prevalence and cost of physician office visits separately for primary care and specialty care. Prior to the 2010 survey if the respondent indicated the plan had a copayment for office visits, we assumed the plan had a copayment for both primary and specialty care visits. The survey did not allow for a respondent to report that a plan had a copayment for primary care visits and coinsurance for visits with a specialist physician. The changes made in 2010 allow for variations in the type of cost sharing for primary care and specialty care. This year the survey includes cost sharing for in-network services only. See the 2007 survey for information on out-of-network office visit cost sharing.
Section Eight: High-Deductible Health Plans with Savings Option
There is no legal requirement for the minimum deductible in a plan offered with an HRA. The survey defines a high-deductible HRA plan as a plan with a deductible of at least $1,000 for single coverage and $2,000 for family coverage. Federal law requires a deductible of at least $1,250 for single coverage and $2,500 for family coverage for HSA-qualified HDHPs in 2013. See the Text Box for more information on HDHP/HRAs and HSA-qualified HDHPs.
The definitions of HDHP/SOs do not include other consumer-driven plan options, such as arrangements that combine an HRA with a lower-deductible health plan or arrangements in which an insurer (rather than the employer as in the case of HRAs or the enrollee as in the case of HSAs) establishes an account for each enrollee. Other arrangements may be included in future surveys as the market evolves.
The average out-of-pocket maximum for HDHP/HRAs is calculated for plans with an out-of-pocket maximum. About 9% of covered workers in HDHP/HRAs with single coverage or family coverage are in plans that reported having no limit on out-of-pocket expenses.
In the survey, we ask, “Up to what dollar amount does your firm promise to contribute each year to an employee’s HRA or health reimbursement arrangement for single coverage?” We refer to the amount that the employer commits to make available to an HRA as a contribution for ease of discussion. As discussed, HRAs are notional accounts, and employers are not required to actually transfer funds until an employee incurs expenses. Thus, employers may not expend the entire amount that they commit to make available to their employees through an HRA.
Section Ten: Plan Funding
This includes stoploss insurance plans that limit a firm's per employee spending as well as plans that limit both a firm's overall spending and per employee spending.
Section Twelve: Wellness Programs and Health Risk Assessments
The survey asks firms offering at least one wellness program if most of the wellness benefits are provided by the health plan or by the firm.
Firms that offer only web-based resources or a wellness newsletter were not asked questions about any financial incentives provided.
In 2013, firms were asked if they offer each of the specified disease management programs. In previous years, firms were asked if they offered a disease management program and then were accordingly asked about specified programs. For this reasons, the estimate of the number of firms offering a disease management program in 2013 is not comparable to the estimates from 2010 and 2008.
Section Thirteen: Grandfathered Health Plans
Federal Register. Vol. 75, No. 116, June 17, 2010, http://www.gpo.gov/fdsys/pkg/FR-2010-06-17/pdf/2010-14614.pdf, and No. 221, Nov. 17, 2010, http://www.gpo.gov/fdsys/pkg/FR-2010-11-17/pdf/2010-28861.pdf.
United States. Congressional Research Service CRS. Open CRS. By Bernadette Fernandez. Grandfathered Health Plans Under the Patient Protection and Affordable Care Act (PPACA), Jan. 3, 2011. http://assets.opencrs.com/rpts/R41166_20110103.pdf.
Methodology
Survey Design and Methods
HDHP/SO includes high-deductible health plans offered with either a Health Reimbursement Arrangement (HRA) or a Health Savings Account (HSA). Although HRAs can be offered along with a health plan that is not an HDHP, the survey collected information only on HRAs that are offered along with HDHPs. For specific definitions of HDHPs, HRAs, and HSAs, see the introduction to Section 8.
HDHP/SO premium estimates do not include contributions made by the employer to Health Savings Accounts or Health Reimbursement Arrangements.
In total, 163 firms participated in 2011 and 2013, 359 firms participated in 2012 and 2013, and 1,100 firms participated in 2011, 2012, and 2013.
Response rate estimates are calculated by dividing the number of completes over the number of refusals and the fraction of the firms with unknown eligibility to participate estimated to be eligible. Firms determined to be ineligible to complete the survey are not included in the response rate calculation.
Estimates presented in Exhibits 2.1, 2.2 and 2.3 are based on the sample of both firms that completed the entire survey and those that answered just one question about whether they offer health benefits.
General information on the OES can be found at: http://www.bls.gov/oes/oes_emp.htm#scope. A comparison between the OES and the NCS is available at: http://www.bls.gov/oes/oes_ques.htm.
Analysis of the 2011 survey data using both R and SUDAAN (the statistical package used prior to 2012) produced the same estimates and standard errors. Research Triangle Institute (2008). SUDAAN Software for the Statistical Analysis of Correlated Data, Release 10.0, Research Triangle Park, NC: Research Triangle Institute.
A supplement with standard errors for select estimates can be found online at Technical Supplement: Standard Error Tables for Selected Estimates.