
The Ohio Health Care Landscape
On January 1, 2014, the Affordable Care Act (ACA) went into full effect, ushering in health insurance reforms and new health coverage options that are impacting Americans across the country. Ohio is experiencing changes to its health care delivery system as the state expands Medicaid, targets the uninsured with a federal health insurance marketplace, streamlines health and human services programs, and implements new health care delivery payment systems. This fact sheet provides an overview of the population health, health coverage, and the health care delivery system in Ohio in the era of health reform.
Demographics
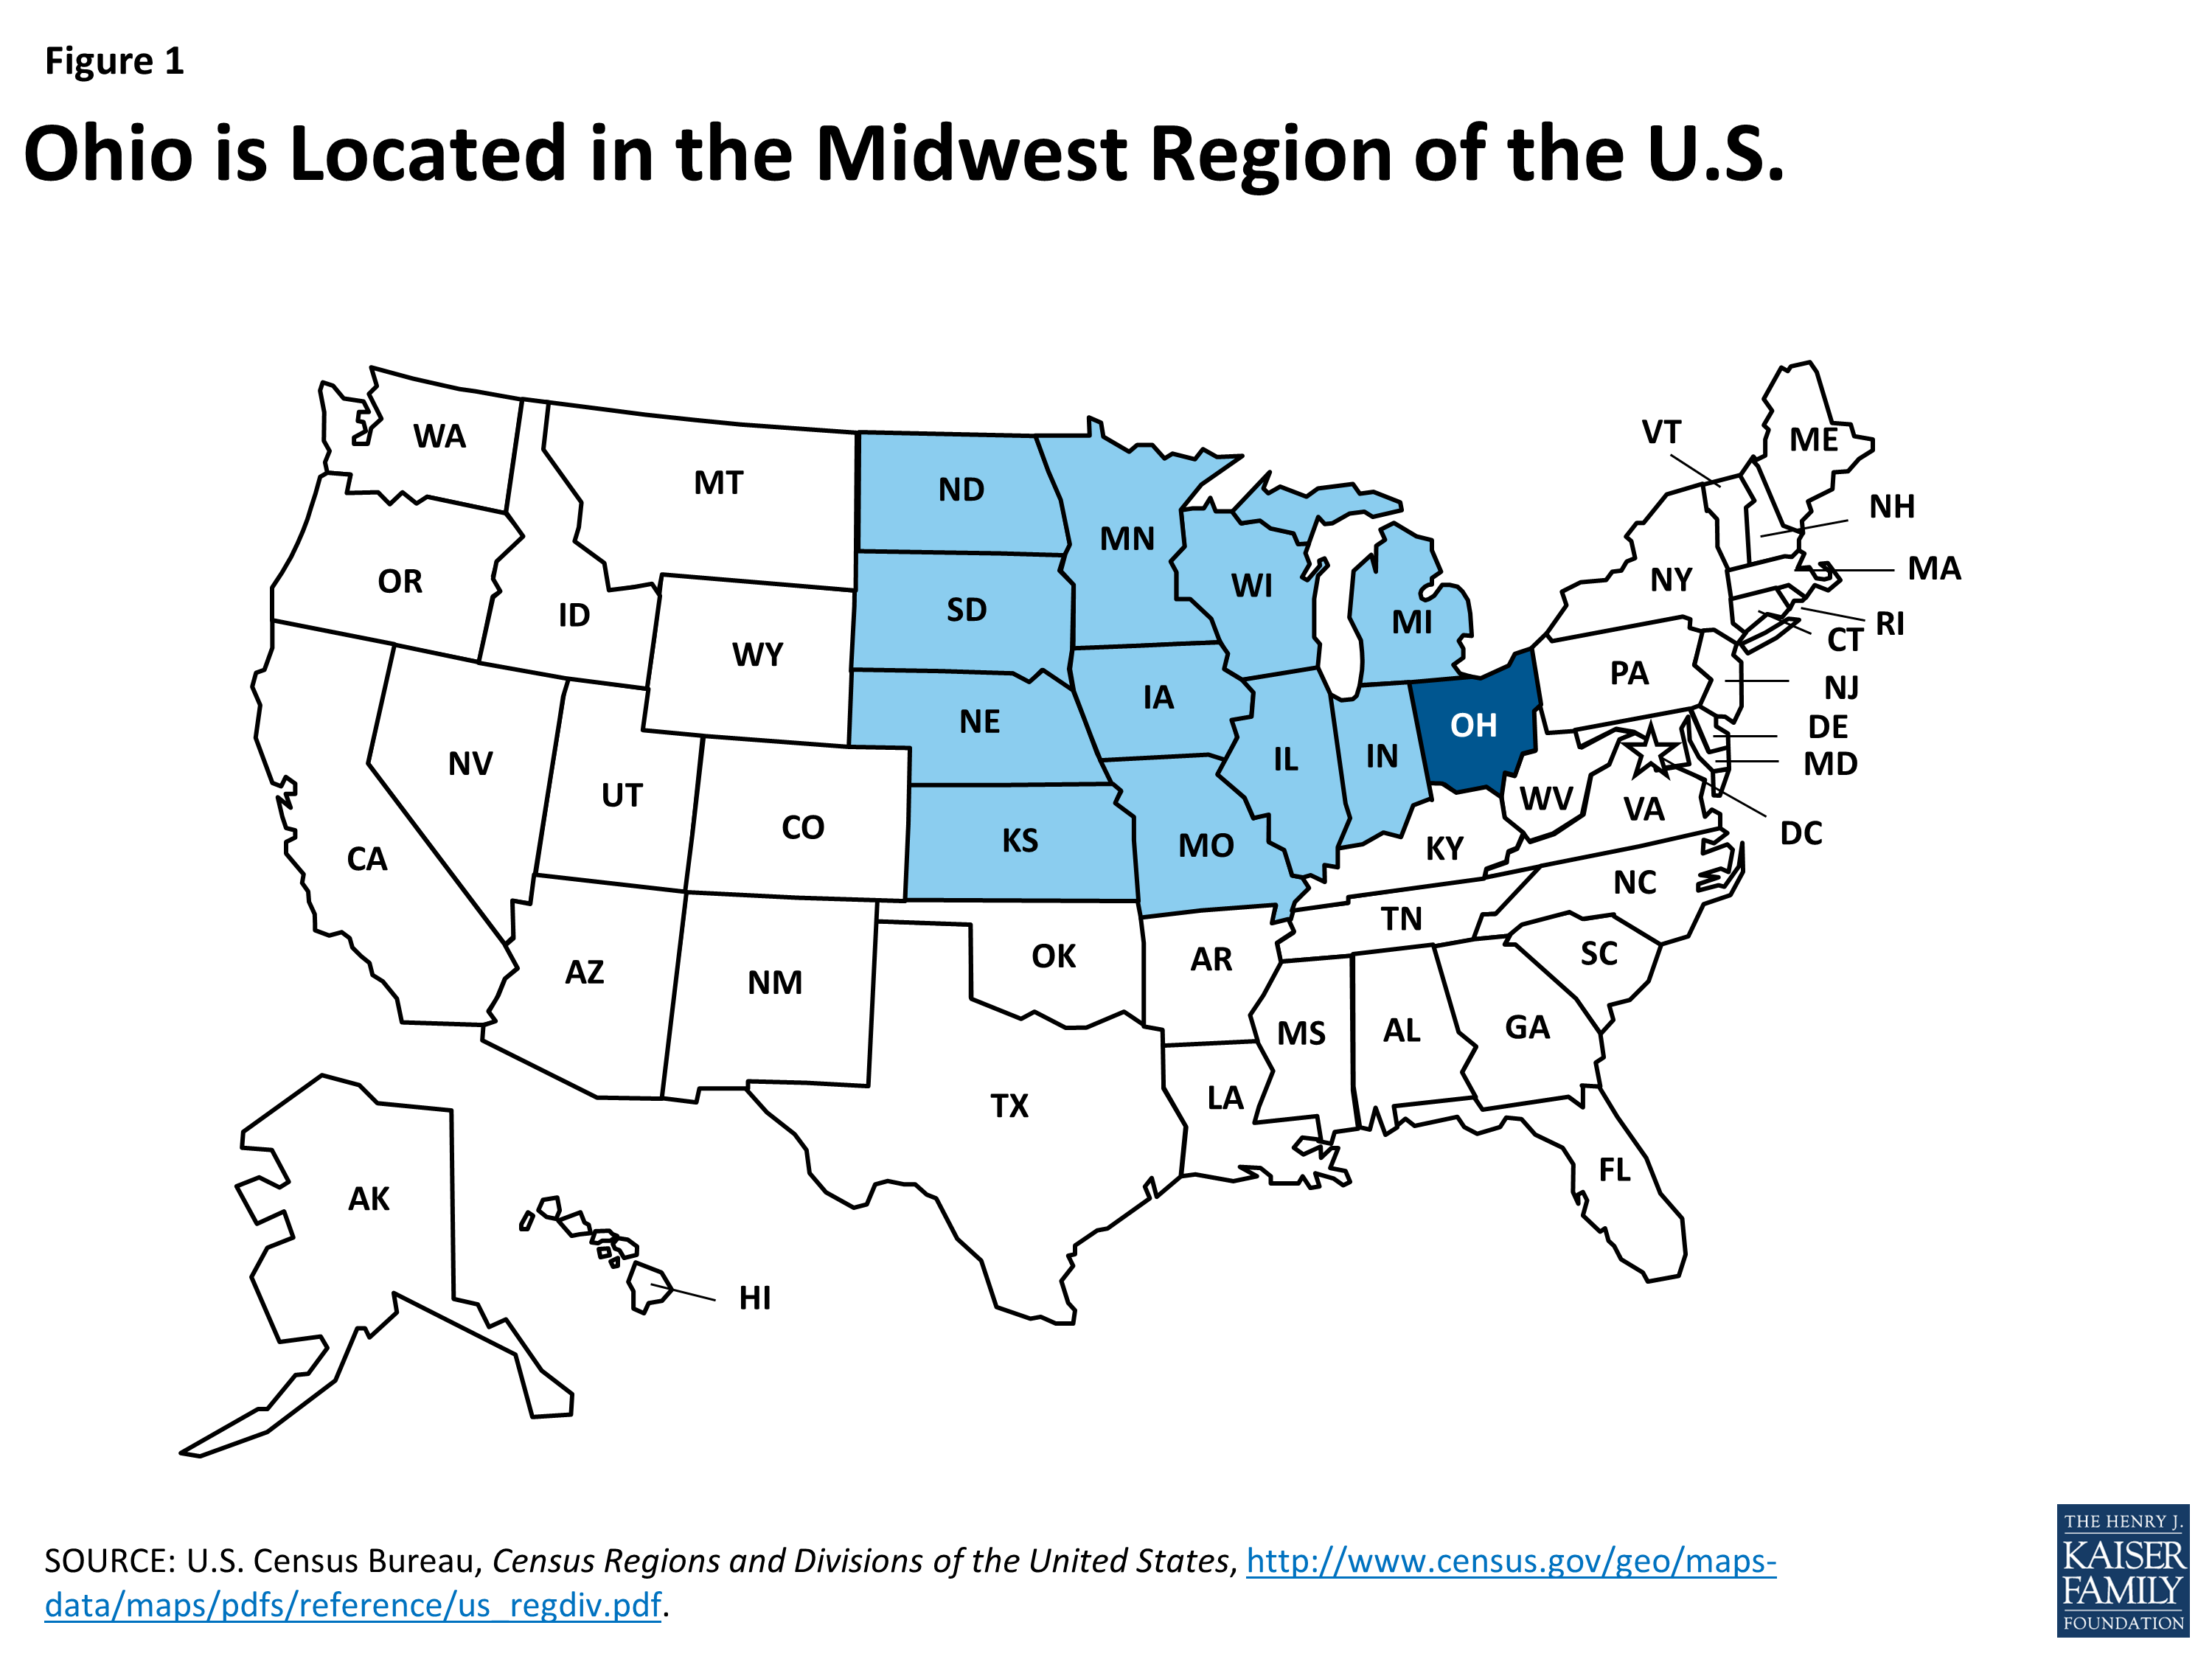
Figure 1: Ohio is Located in the Midwest Region of the U.S.
Home to over 11 million residents, Ohio is the 7th most populous state in the U.S.1 At nearly 41,000 square miles, Ohio is the 35th largest state, but ranks 9th in population density.2 Ohio is one of 12 states located in the country’s Midwest region (Figure 1).3 Ohio’s rolling hills and valleys of the Allegheny Plateau stretch across the far-south as well as the eastern-half of Ohio.4 With over 300 miles of Lake Erie shoreline and thousands of miles of rivers, Ohio is defined by these valuable and useful waterways. The most significant river is the Ohio, as it forms the entire southern border and much of Ohio’s eastern border. Thirty-two counties located in the southern and eastern areas of Ohio are in Appalachia.5
The majority of Ohioans live in urban areas. Among the state’s 88 counties, 5 had populations that exceeded 500,000 as of July 2013.6 Eighty percent of the state’s population lives in urban areas, including 28% who reside in the state’s three largest counties, which include the cities of Cleveland, Columbus, and Cincinnati. Over half (51%) of nonelderly Ohioans live in the state’s 10 most populous counties (See Figure 12, Appendix). With an unemployment rate of 5.5% in June 2014, Ohio’s rate is lower than the U.S. average of 6.1%.7 The unemployment rate in Ohio has been dropping steadily, decreasing 1.9 percentage points between June 2013 and June 2014.8
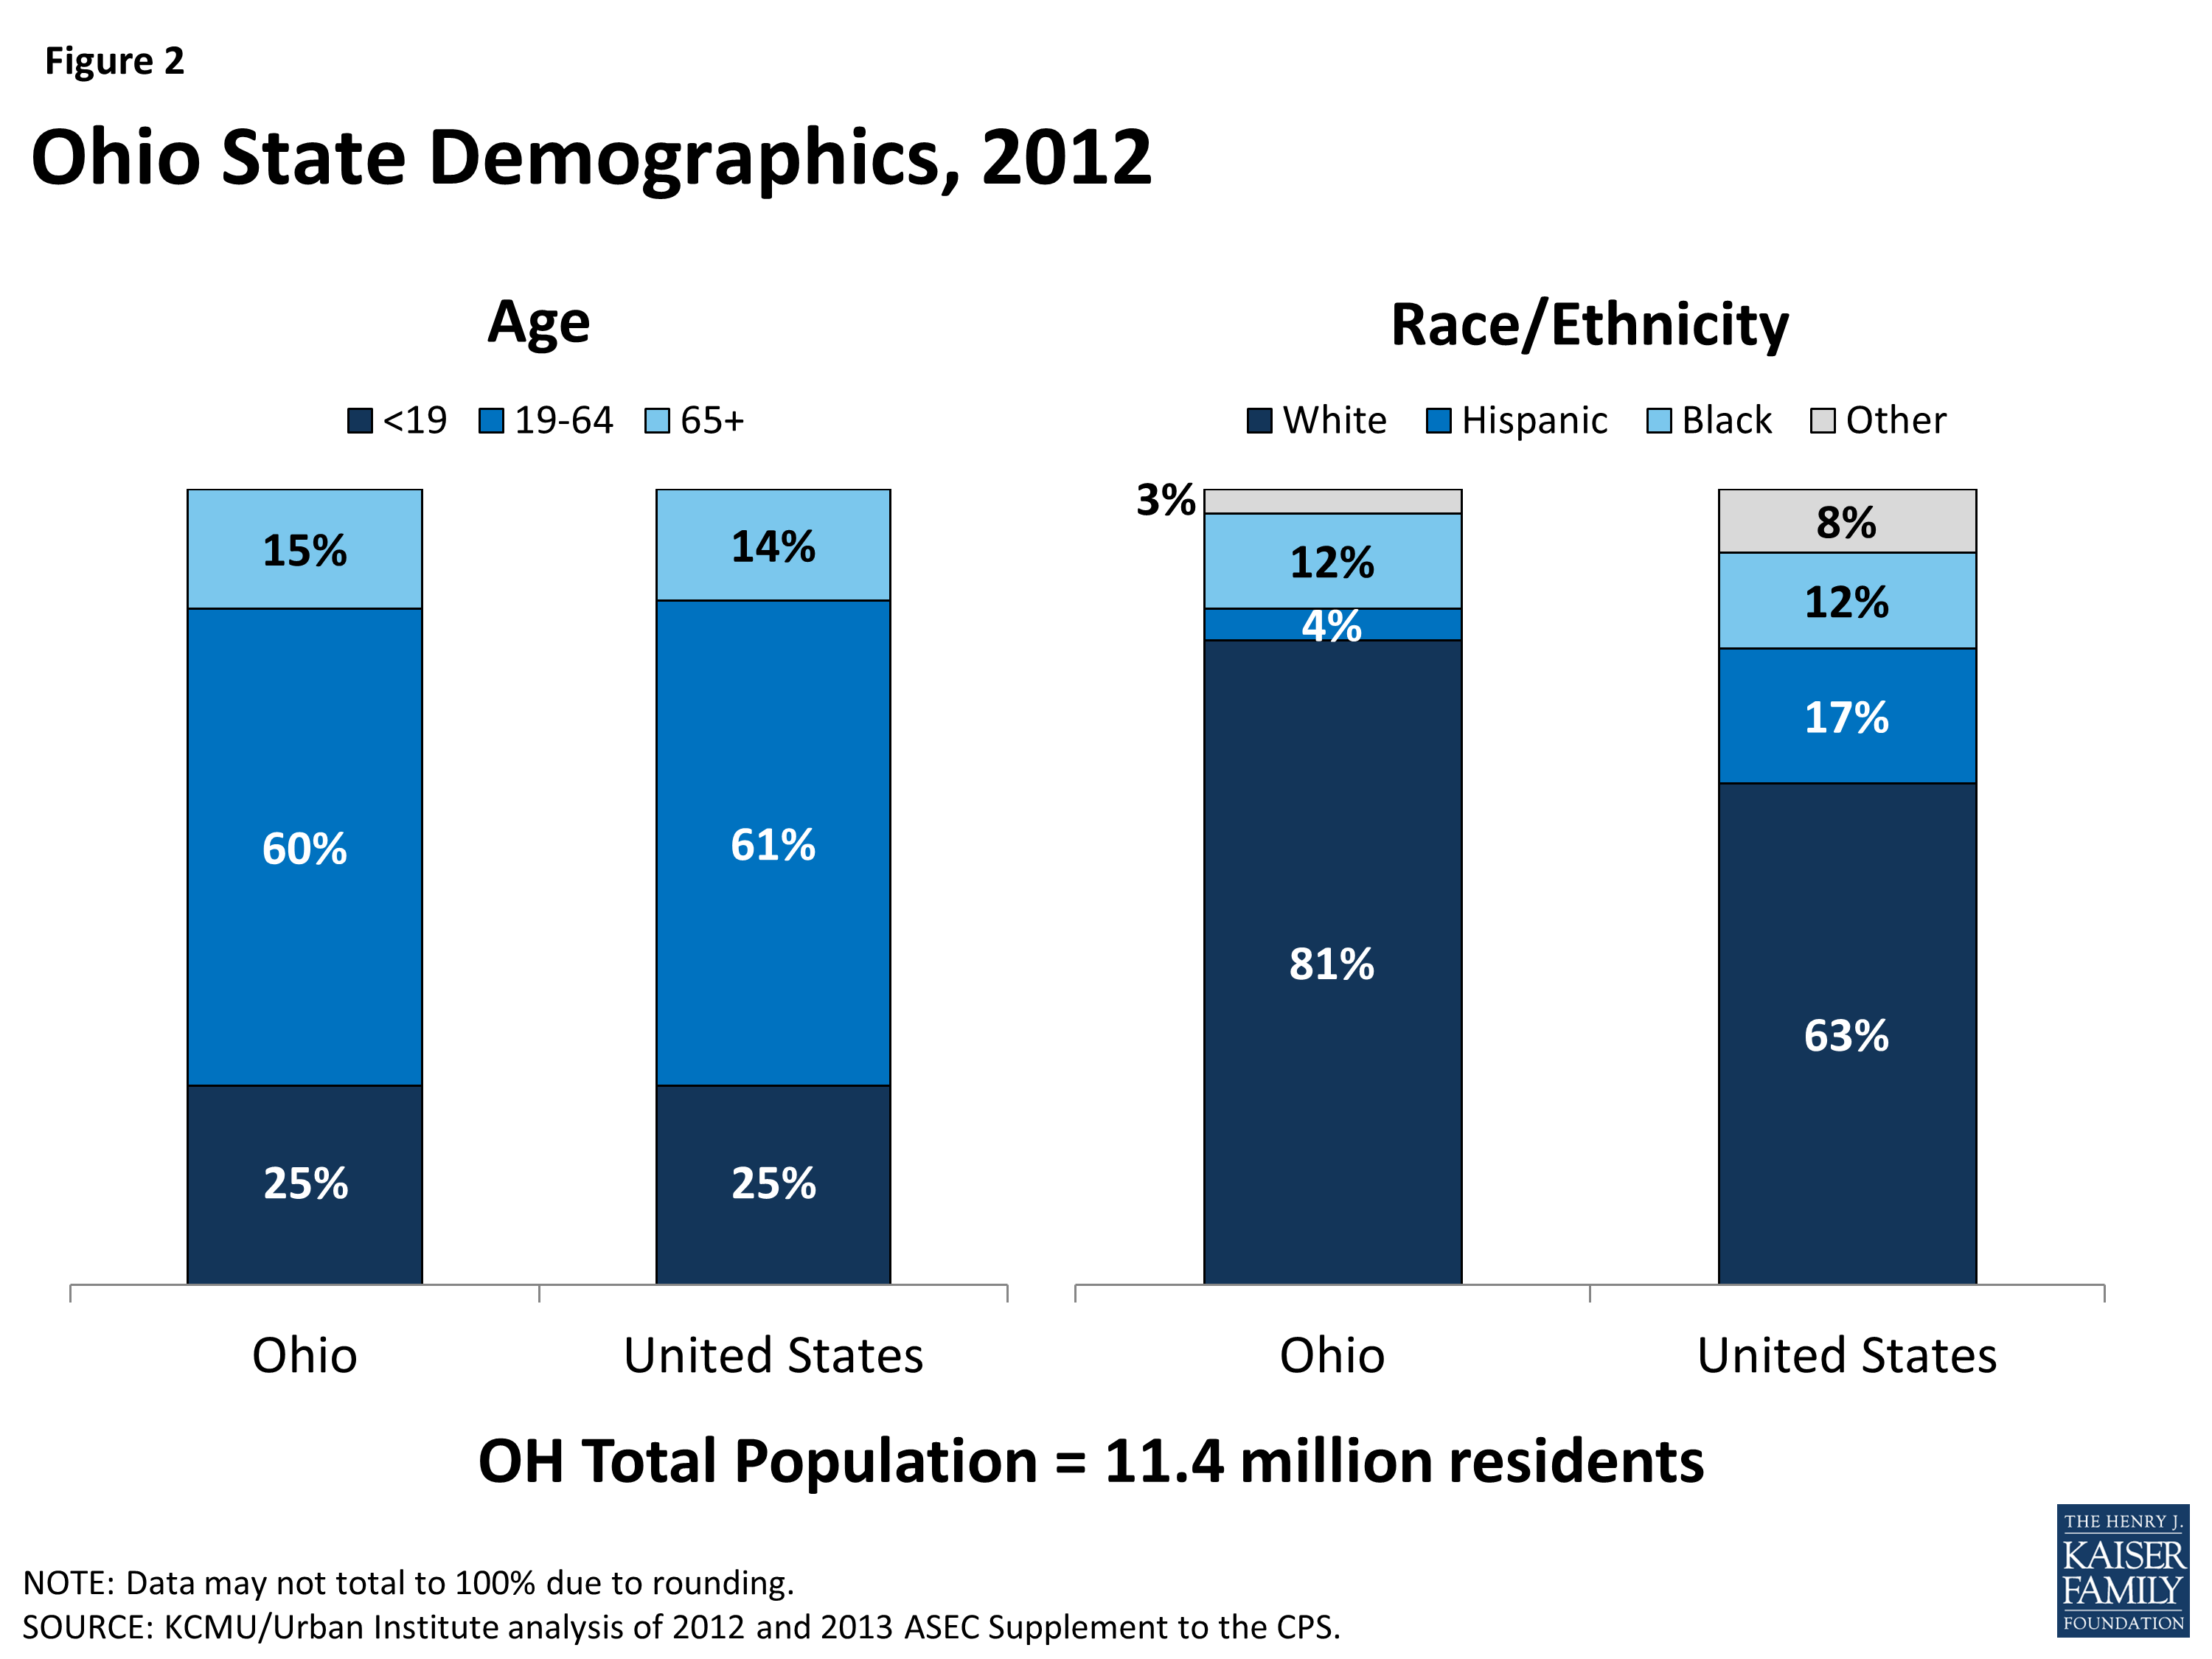
Figure 2: Ohio State Demographics, 2012
The age distribution of Ohio residents is similar to the U.S. overall, in comparison; people of color make up a smaller share of the state’s population. The age distribution of Ohio residents aligns with that of the U.S. overall (Figure 2). One-quarter of Ohioans are under age 19, while six in ten individuals fall between the ages of 19-64. The remaining 15% of the state population, or about 1.7 million residents, is age 65 and over. Ohio’s population is less racially diverse than the U.S. population overall. Eight out of ten (81%) Ohio residents identify as White, while 12% identify as Black and 4% identify as Hispanic.9 Nearly one in five (19%) Ohioans are living in poverty (have income below 100% of the federal poverty level (FPL) or $11,670 for an individual, $19,790 for a family of 3 in 2014) and seven in 10 have family income levels below 400% FPL (Figure 3).10
However, poverty rates vary by race/ethnicity and age. Fifteen percent of those who identified as White were living in poverty in 2012, compared to 42% of those who identified as Hispanic and 40% of those who identified as Black. In addition, 26% of children under 19 were living in poverty, while 19% of adults age 19-64 and 10% of adults age 65 and over were living in poverty.11
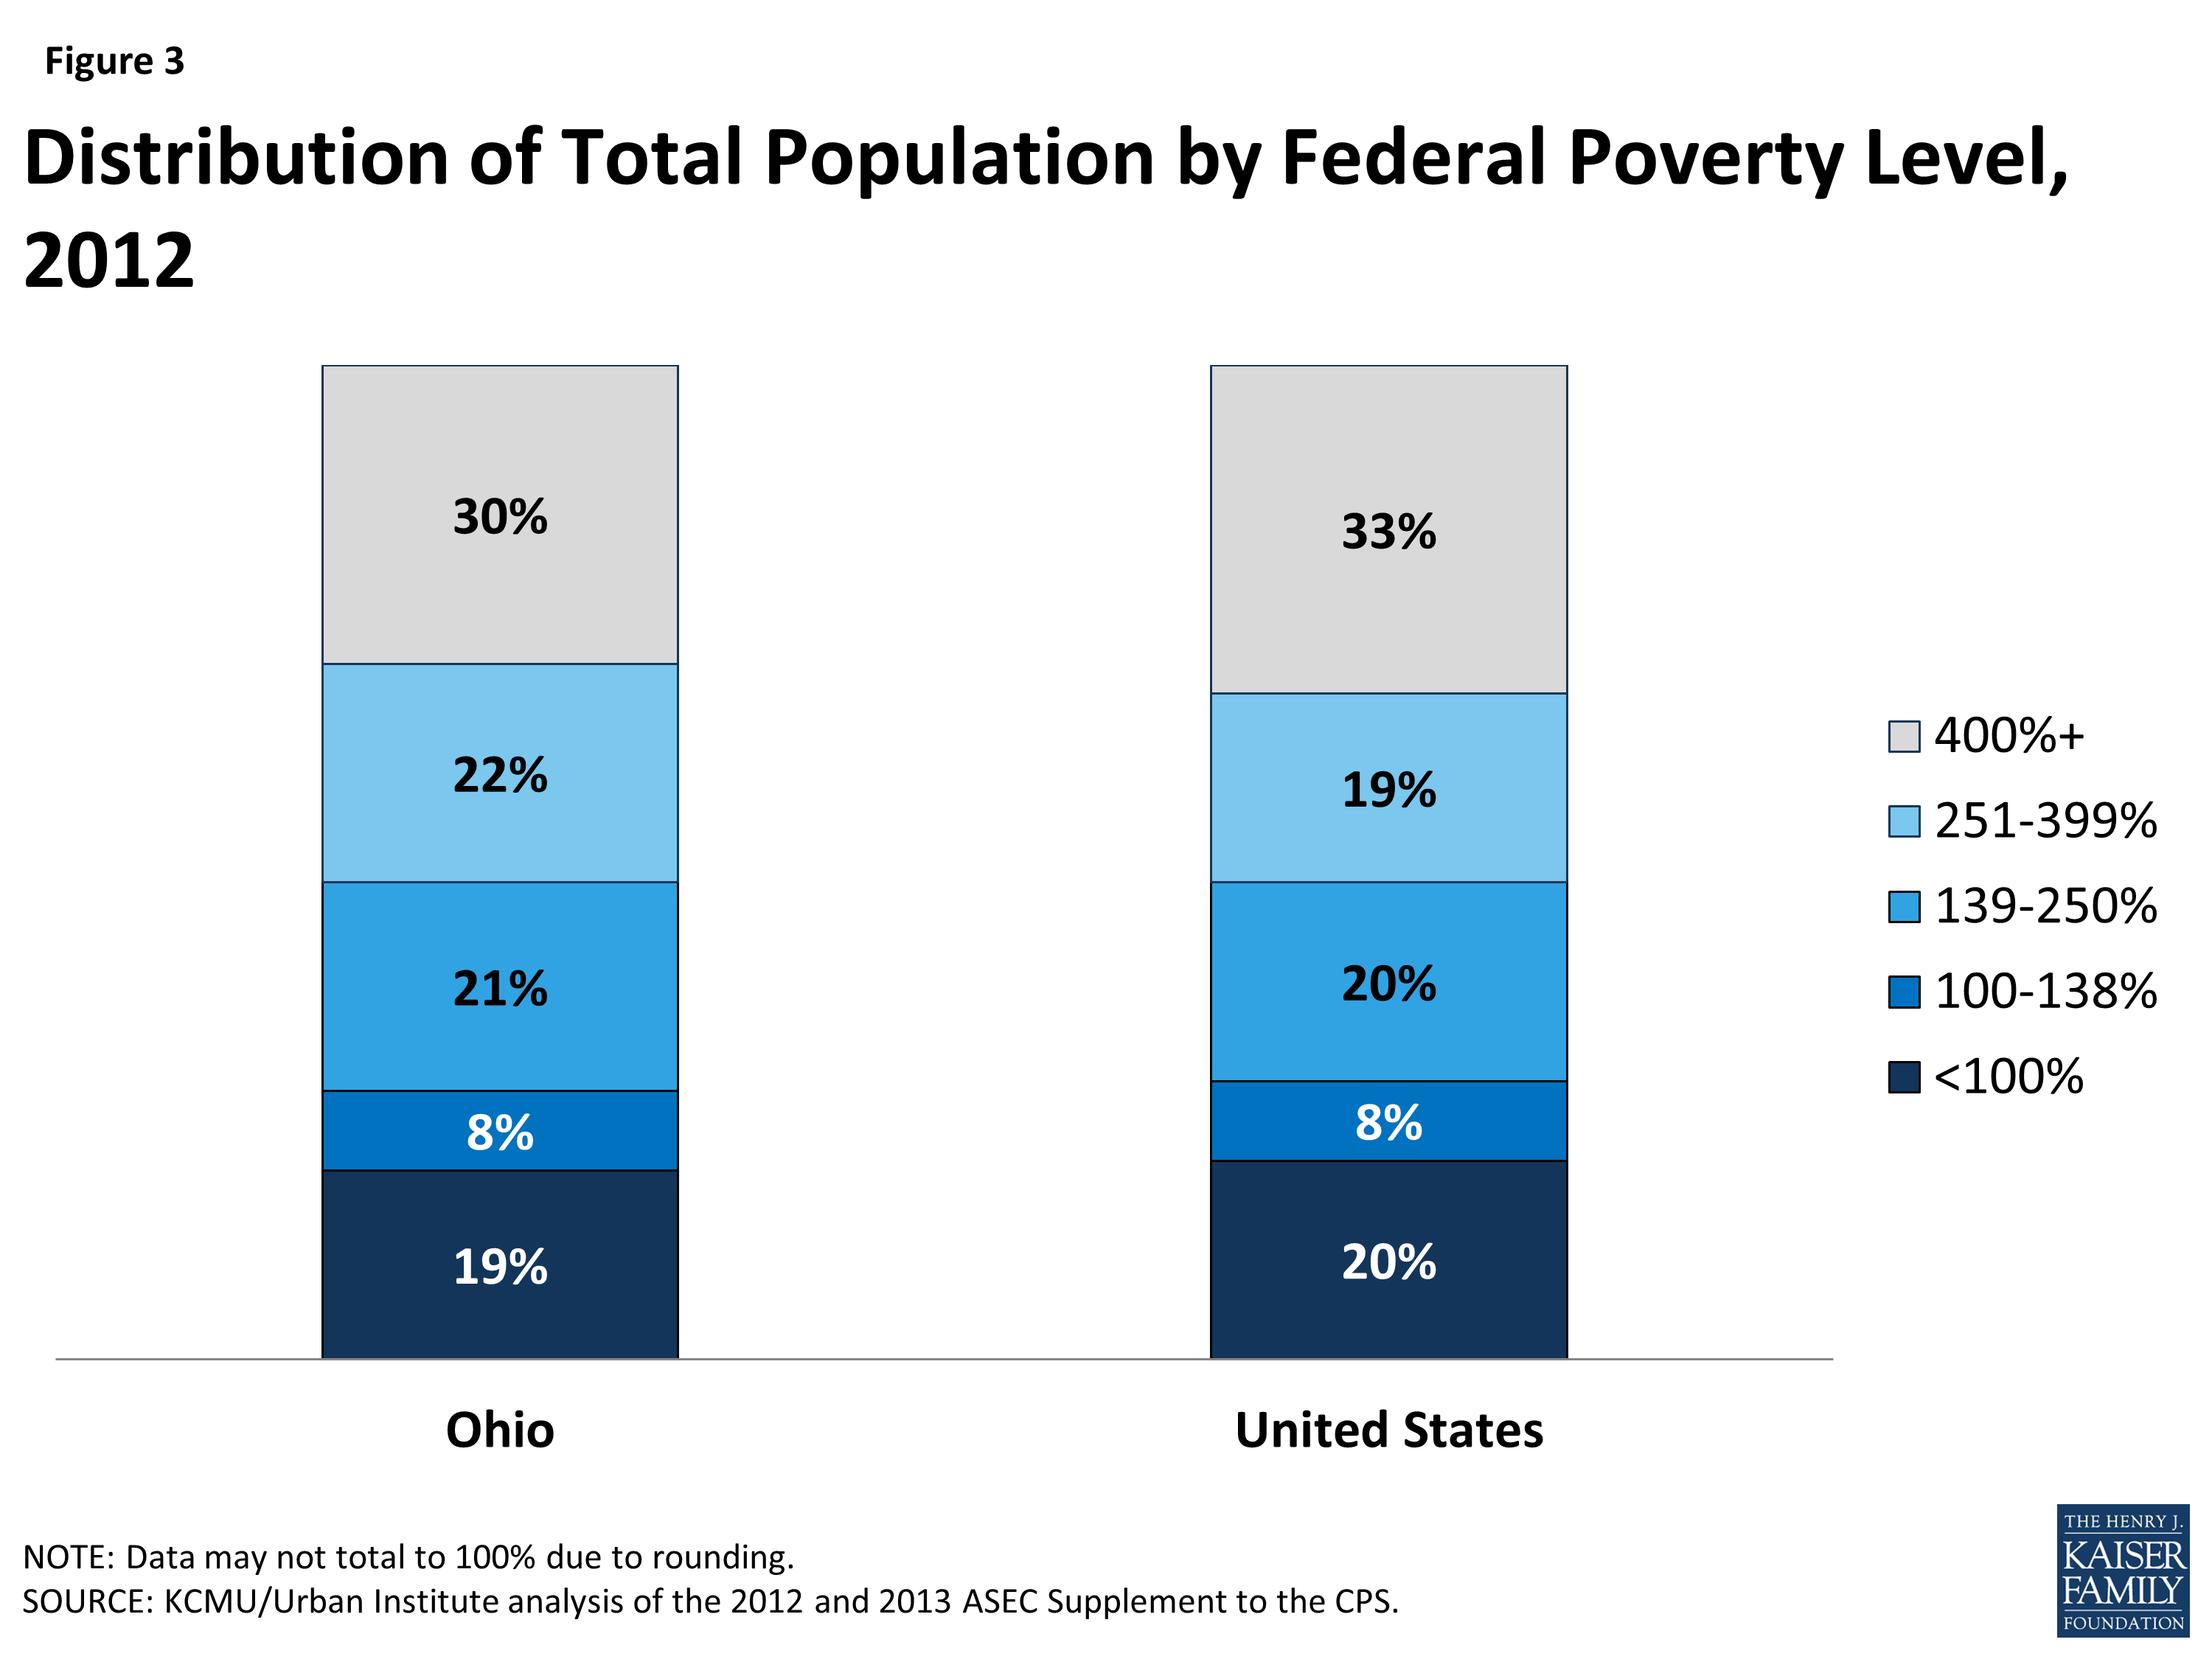
Figure 3: Distribution of Total Population by Federal Poverty Level, 2012
State Economy
Ohio’s economy is growing steadily after the recent economic downturn. Like other states across the country, Ohio experienced budgetary challenges during the recent economic downturn. The state faced an $8 billion shortfall over the 2011-2013 biennium and had just 89 cents in its rainy day fund.12 Today, however, the state’s economy continues to improve. Like many other states across the country, Ohio experienced an increase in its real Gross Domestic Product (GDP), growing 2.2% from 2011 to 2012, 1.8% from 2012 to 2013.13 The state ended Fiscal Year (FY) 2014 with a nearly $800 million surplus, and the rainy day fund has been rebuilt to $1.5 billion, the current legal maximum level.14 Manufacturing, finance and real estate, health care, and government are major industries in the state. In 2012, Ohio’s GDP was over $565 billion, which makes it the 7th largest economy in the U.S.15
Population Health
Overall population health in Ohio is ranked below the national average. Ohio ranked 40 among the 50 states for total population health in the United Health Care Foundation’s report, America’s Health Rankings 2013.16 In 20o9, the life expectancy of an Ohio resident was 77.8 years, below the national average of 78.9 years.17 The rates of diabetes, overweight and obesity, and smoking among adults in Ohio are higher than the national averages, as is the rate of infant mortality.18,19,20,21 In the past year, the prevalence of diabetes has increased from 10% to 11.7% of adults; more than 1 million adults in Ohio have diabetes.22 In contrast, the incidence of cancer in Ohio is lower than in the U.S. overall.23
Disparities in health and health care access exist in Ohio. Like other states across the country, measures of health status in Ohio vary by race/ethnicity and patterns across these measures in Ohio are similar to national averages. Eighty-seven percent of those who identify as Hispanic and 86% of those who identify as White report being in good or excellent health, compared to 77% of those who identify as Black.24 Sixty-five percent of those who identify as White are overweight or obese, compared to 74% of Blacks and 73% of Hispanics.25 Those who identify as Black are nearly twice as likely (13%) to have diabetes as those who identify as White (7%).26 In addition, those who identify as Black (47%) are more likely to report mental health issues, compared to those who identify as White (37%).27 In addition, while the overall infant mortality rate is high in Ohio, it is twice as high for Blacks as for Whites or Hispanics.28
Disparities in access to care also exist in Ohio. While 81% of those who identify as White report having a usual source of care, the rate is only 70% for Blacks and 60% for Hispanics. In contrast, 88% of Blacks and 86% of Hispanics report going to the doctor within the past two years, compared to only 77% of Whites, which may reflect greater health needs among these populations.29
In addition, disparities in health and health access exist across the geographic regions of the state, with nonelderly adults living in Ohio’s Appalachian counties more likely to have unmet health needs and to consider themselves in poor health, than those in more urban counties.30 A 2008 study found that nonelderly adults in the state’s Appalachian and rural counties were more likely to be obese, have high blood pressure, and smoke, than nonelderly adults in other areas of the state and that nonelderly adults in rural counties were more likely than their urban counterparts to have suffered from a significant health event, such as a heart attack.31
State and local efforts are underway to address health disparities in Ohio. Ohio’s Statewide Health Disparities Collaborative (OSHDC) has brought together individuals and organizations throughout the state to reduce health disparities and to work to achieve health equity.32 OSHDC has developed an Ohio-based action plan to address health disparities and meets periodically throughout the year. The Ohio Commission on Minority Health distributes annual grants to community-based organizations throughout the state that are working on health promotion and disease prevention for minorities.33 The Center for Reducing Health Disparities at Case Western Reserve University is working to address and reduce health disparities throughout Ohio through research and education, and by developing community partnerships.34 In addition, the March of Dimes has partnered with Ohio’s leading universities and hospitals to fund the Prematurity Research Center Ohio Collaborative to provide a multidisciplinary and cross-institutional approach to studying the causes of preterm birth.35
Coverage
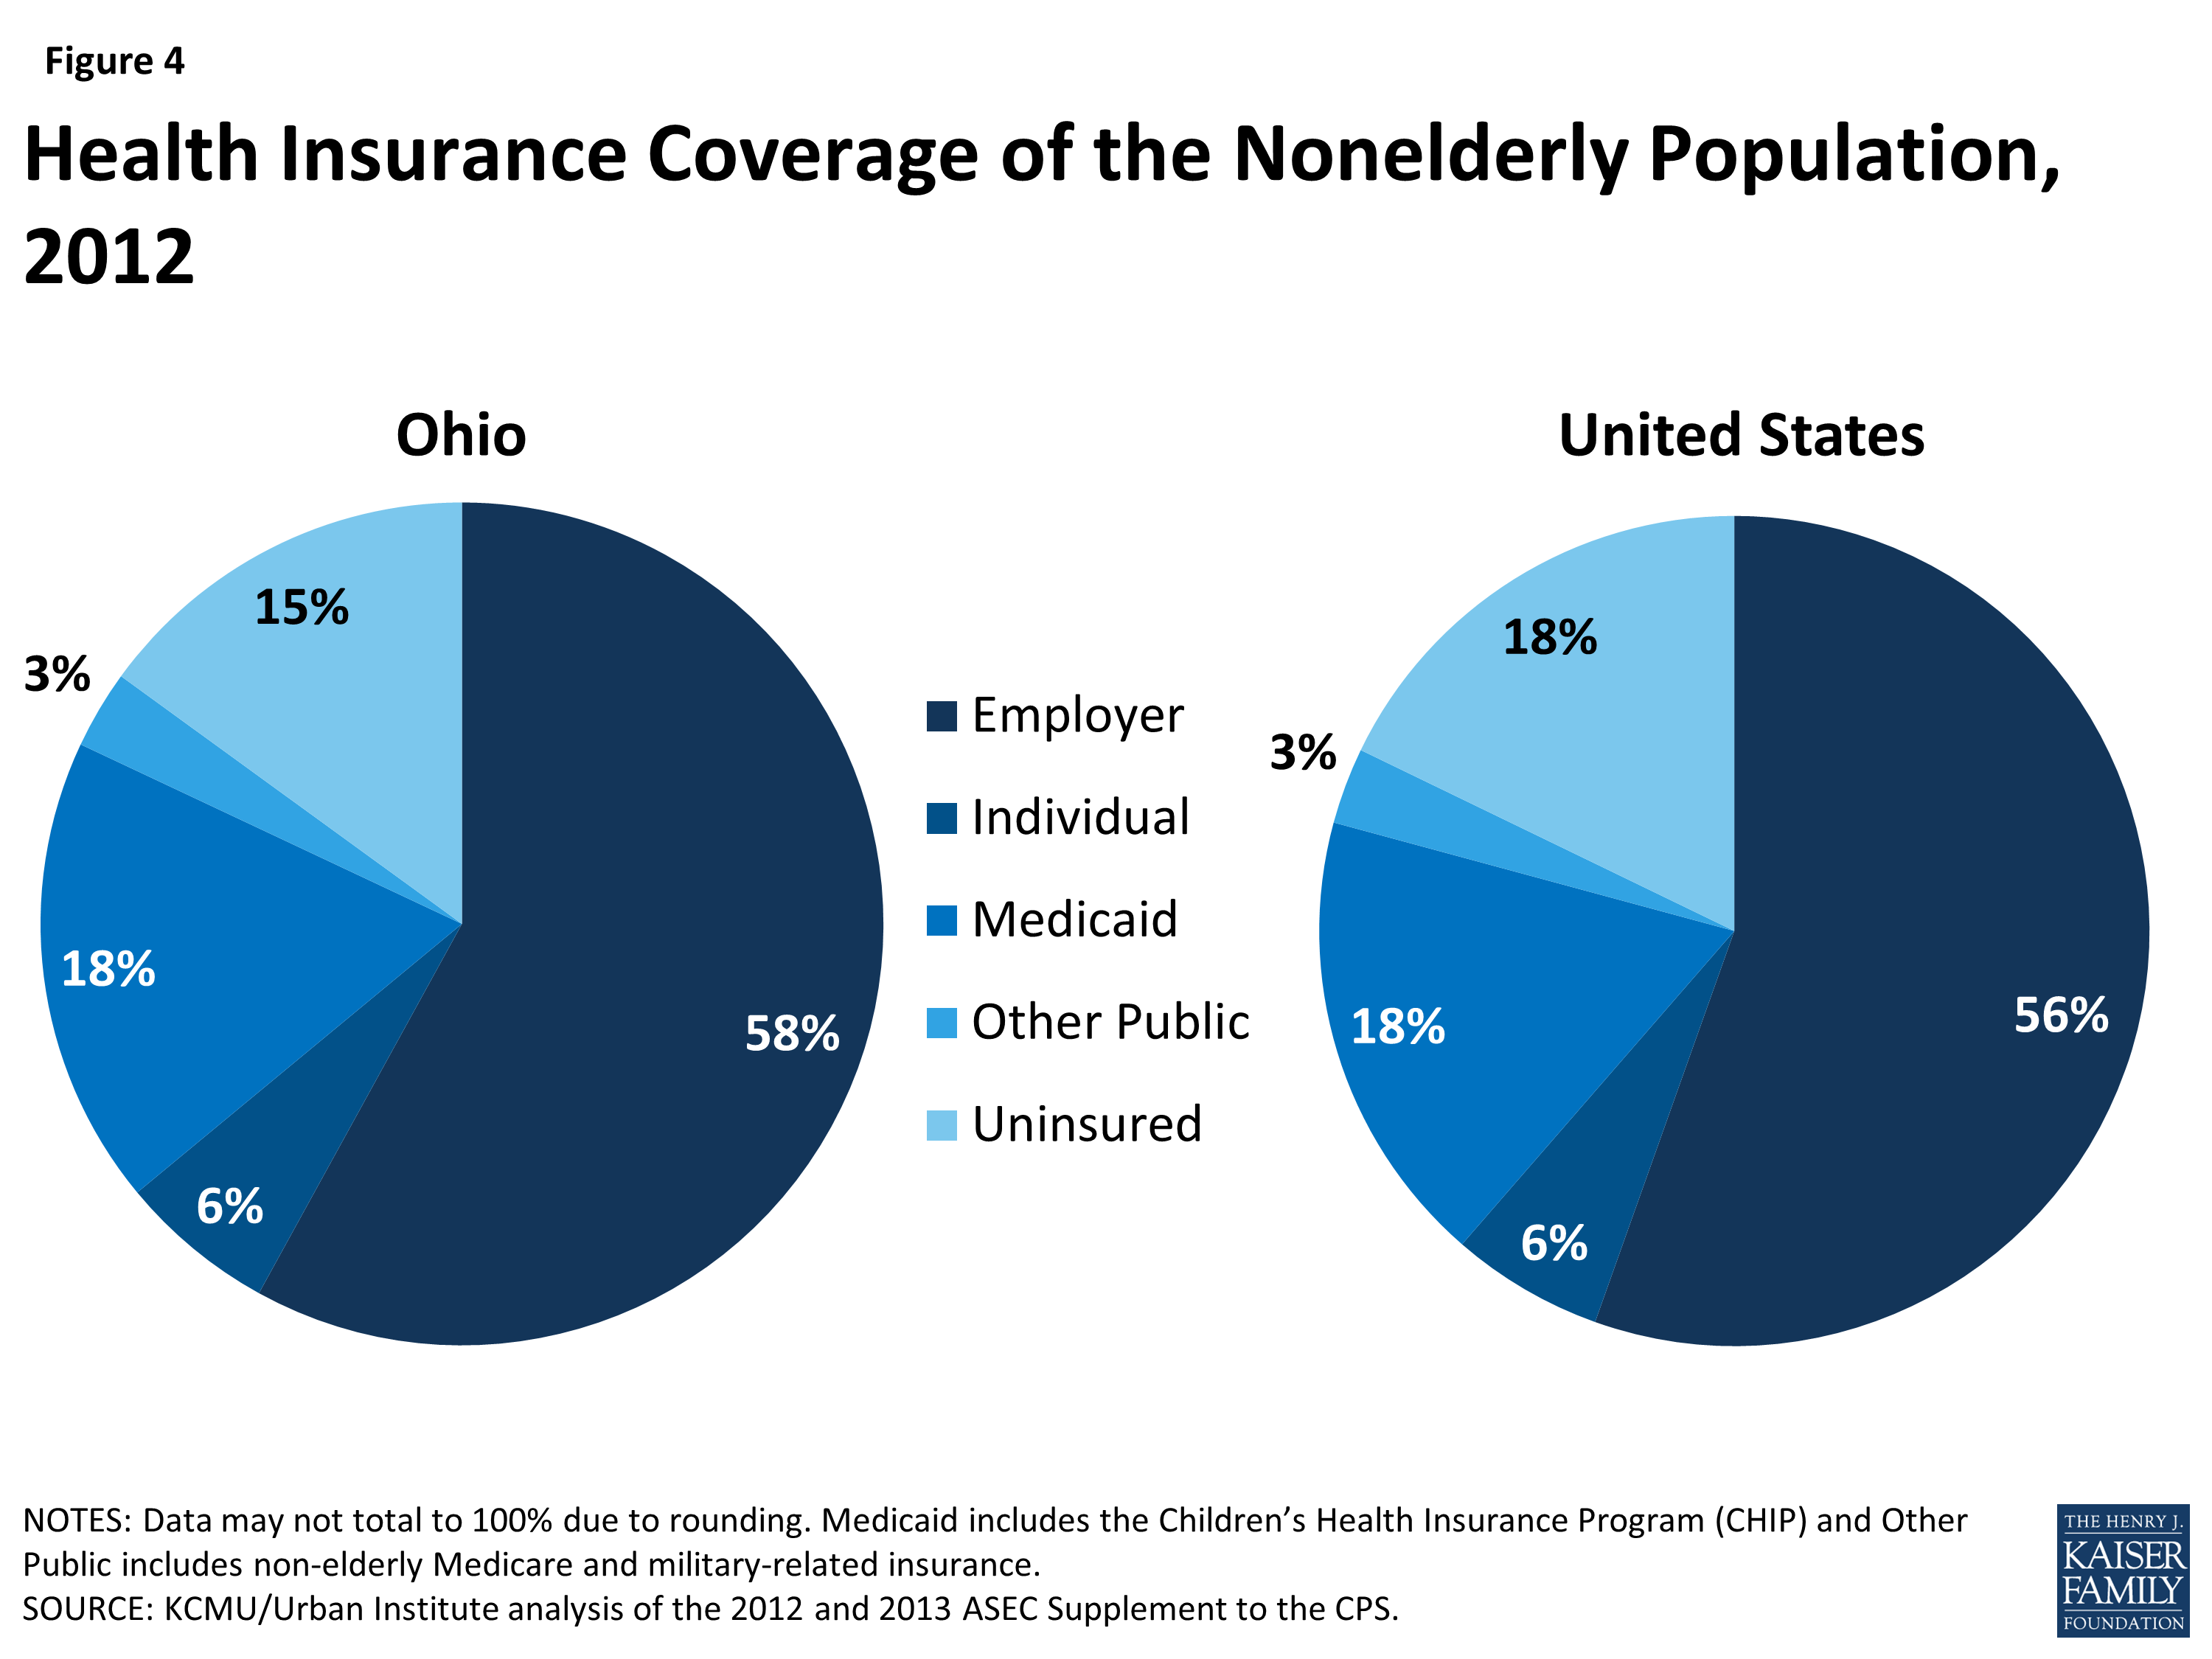
Figure 4: Health Insurance Coverage of the Nonelderly Population, 2012
Over 15% of Ohio’s nonelderly population (nearly 1.5 million) was uninsured in 2012. Among the 85% of Ohioans with health insurance, the largest share have employer-sponsored coverage (58%), followed by Medicaid (18%), other public (6%), and individual insurance (3%)(Figure 4).36 Ohio’s nonelderly uninsured rate ranks below the national average of 18%, which reflects the range of uninsured rates across the country from 4% in Massachusetts to 24% in Texas.37 As shown in Figure 13 (Appendix), the nonelderly uninsured in Ohio are not equally distributed across the state’s counties, with the central and southern counties having higher uninsured rates than other areas of the state. As in other states across the U.S., the majority of nonelderly uninsured in Ohio have at least one full-time worker in their households, have income below 400% of the FPL, and are under age 55 (Figure 5). 38
Medicaid
Similar to the national picture, the largest group of Medicaid enrollees in Ohio is children, but the elderly and individuals with disabilities account for the most spending on Medicaid. Based on data for FY 2010, 51% of Medicaid enrollees were children, who accounted for 14% of expenditures (Figure 6).39 One-quarter were elderly or people with disabilities, who accounted for nearly three-quarters (72%) of total program costs. Average spending per beneficiary was $6,272, more than the national average of $5,563 and a number of other states in the Midwest Region (Figure 7).40
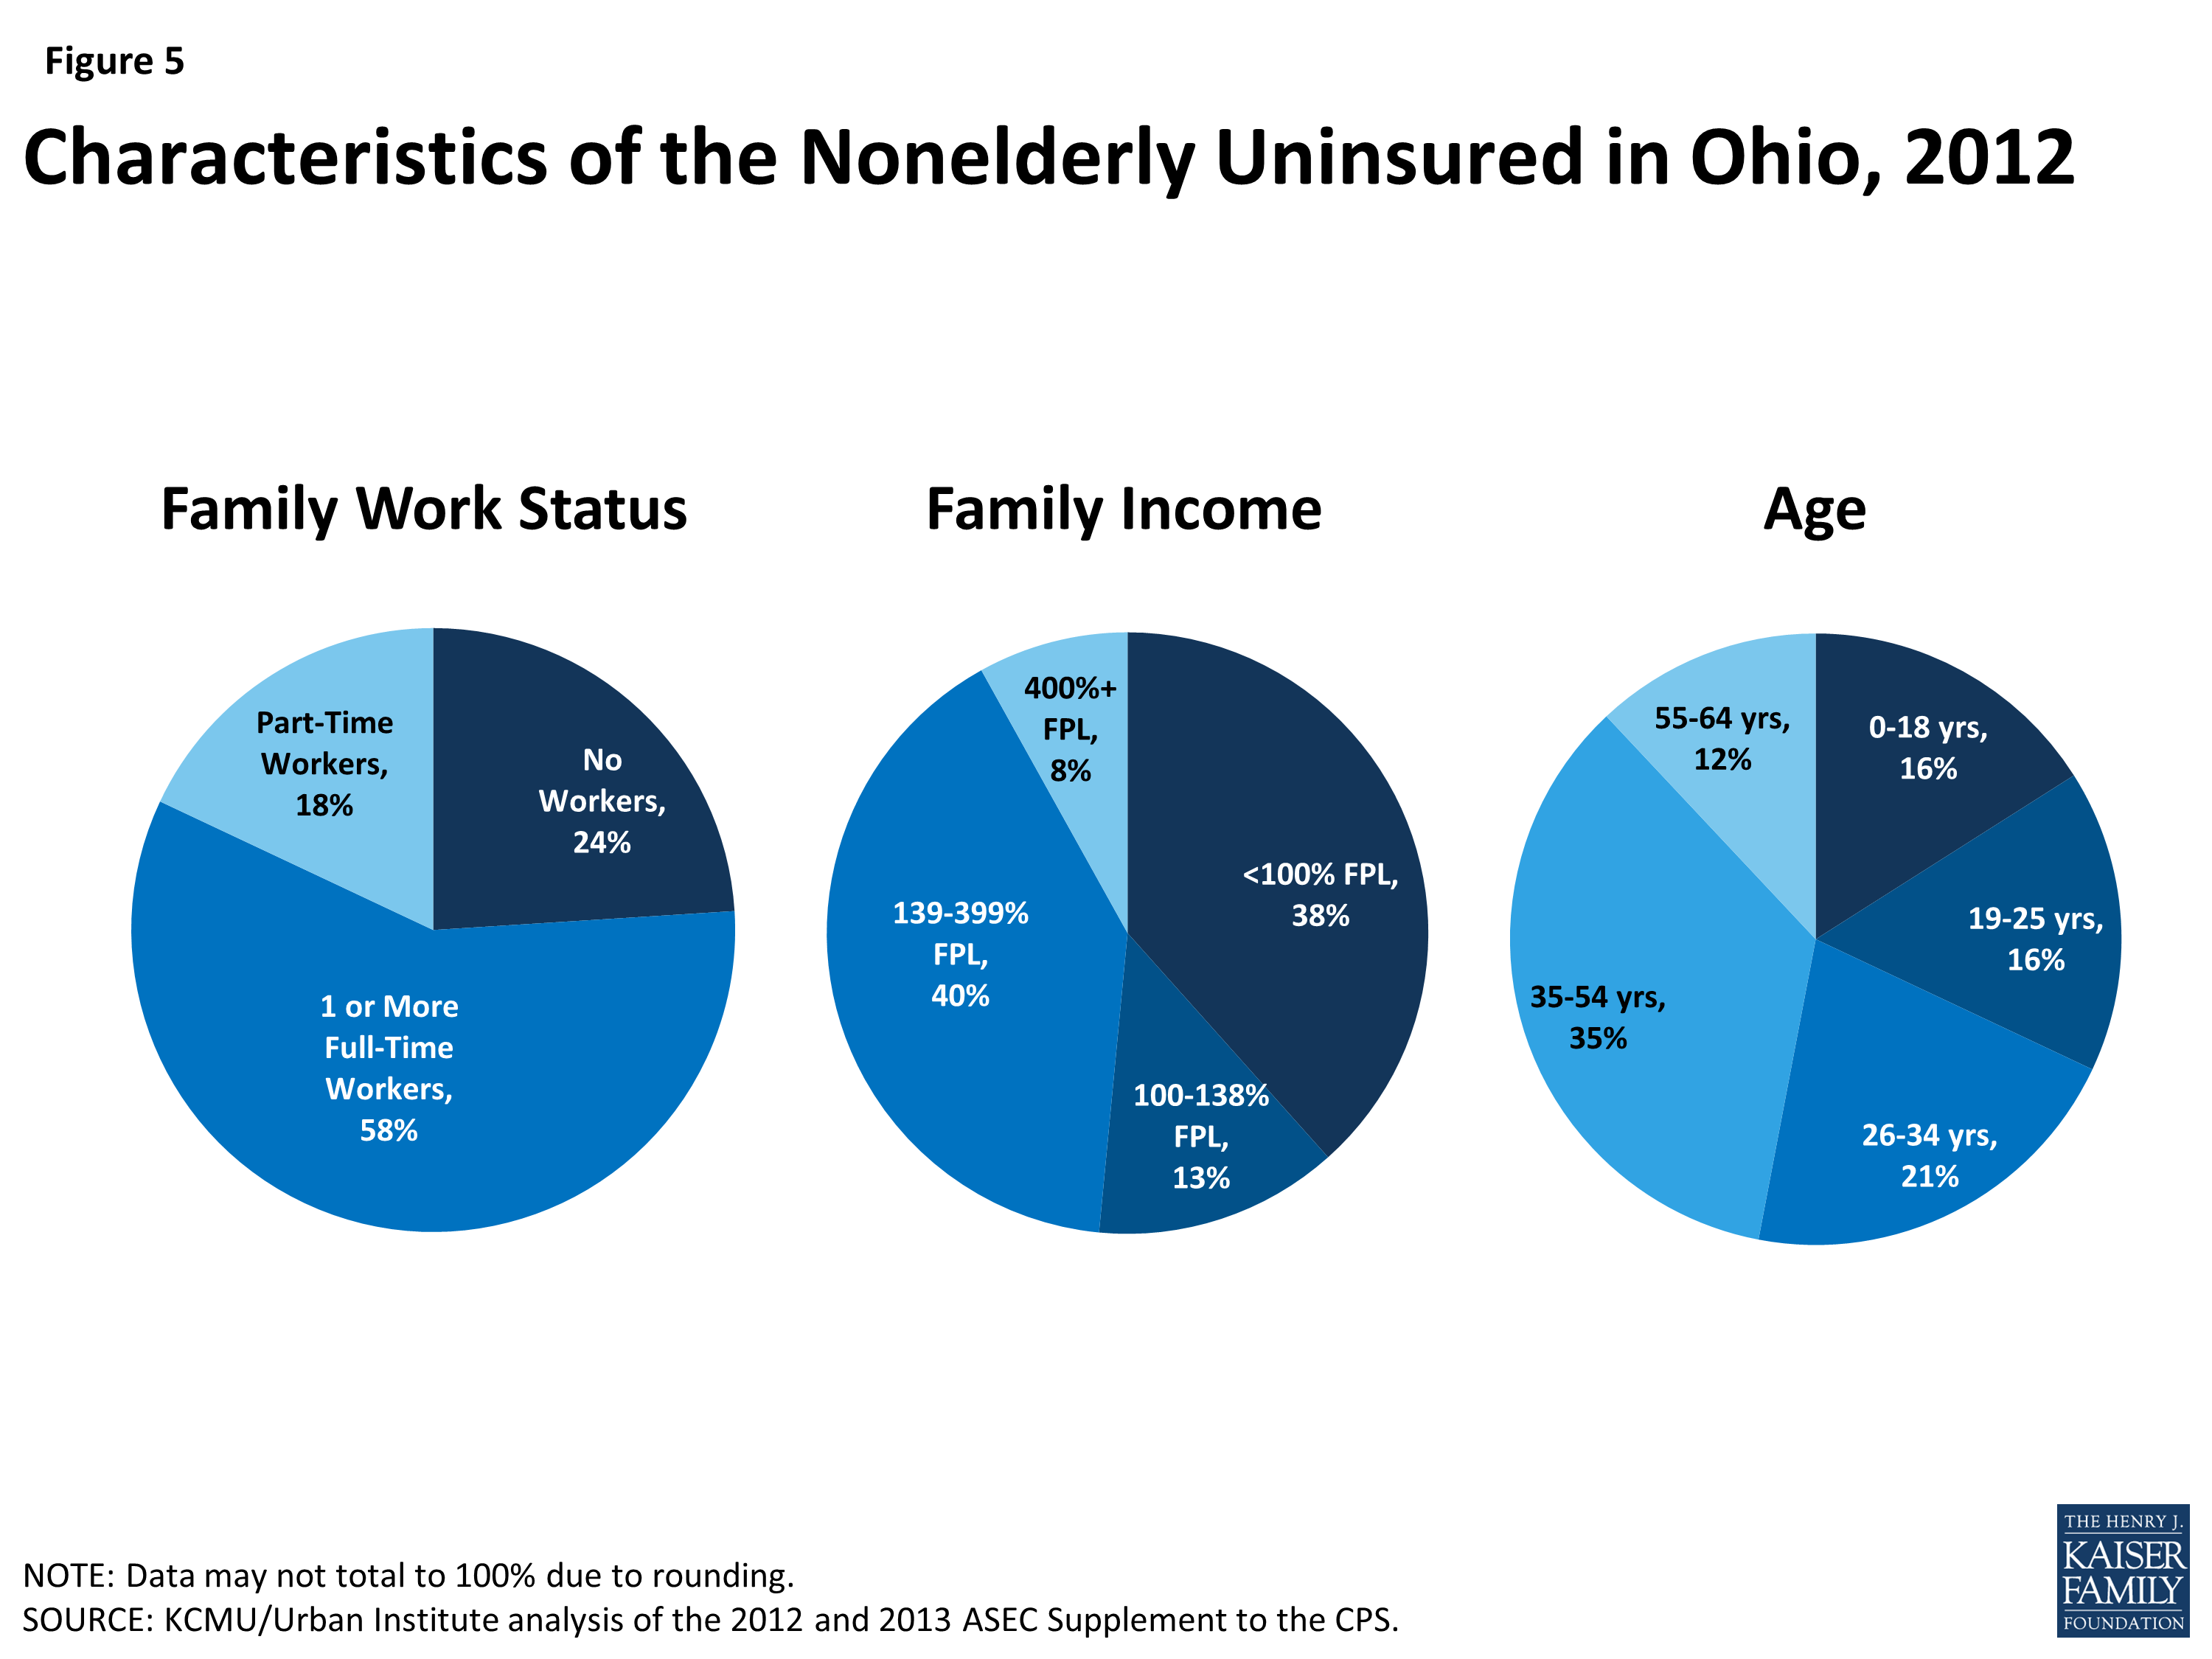
Figure 5: Characteristics of the Nonelderly Uninsured in Ohio, 2012
Medicaid costs are shared by the state and the federal government, with the federal government paying 62.6% of the cost of Ohio Medicaid; therefore for every $1.00 that Ohio spends on Medicaid, the federal government will send $1.68 to the state in matching funds.41 The combined federal and state spending on Medicaid in Ohio for FY 2012 was $16.4 billion.42 This accounted for 24% of total state spending, 21% of state general funds, and 46% of state spending of federal funds (Figure 8).43 Medicaid is the second largest source of state general fund spending behind elementary and secondary education, but the largest source of federal revenue flowing into the state.
Governor John Kasich created the Office of Health Transformation (OHT) in January 2011 to modernize Medicaid, streamline health and human services programs, and improve overall health system performance. The Kasich Administration has made slowing the growth of Medicaid a priority.44 In addition to expanding Medicaid to more low-income Ohioans and streamlining Medicaid eligibility determinations, Governor Kasich’s plan to modernize Medicaid included prioritizing home and community services, reforming nursing facility payment, integrating Medicaid and Medicare benefits, creating health homes for people with mental illness, and improving Medicaid managed care.45 In Ohio, 1.6 million Medicaid beneficiaries, or 75% of the total Medicaid population, are enrolled in a managed care delivery system.46 Additionally, the Jobs Budget 2.0 created Ohio’s first ever cabinet-level Medicaid agency, a stand-alone department effective July 2013, to help the Medicaid program become more effective and efficient.47
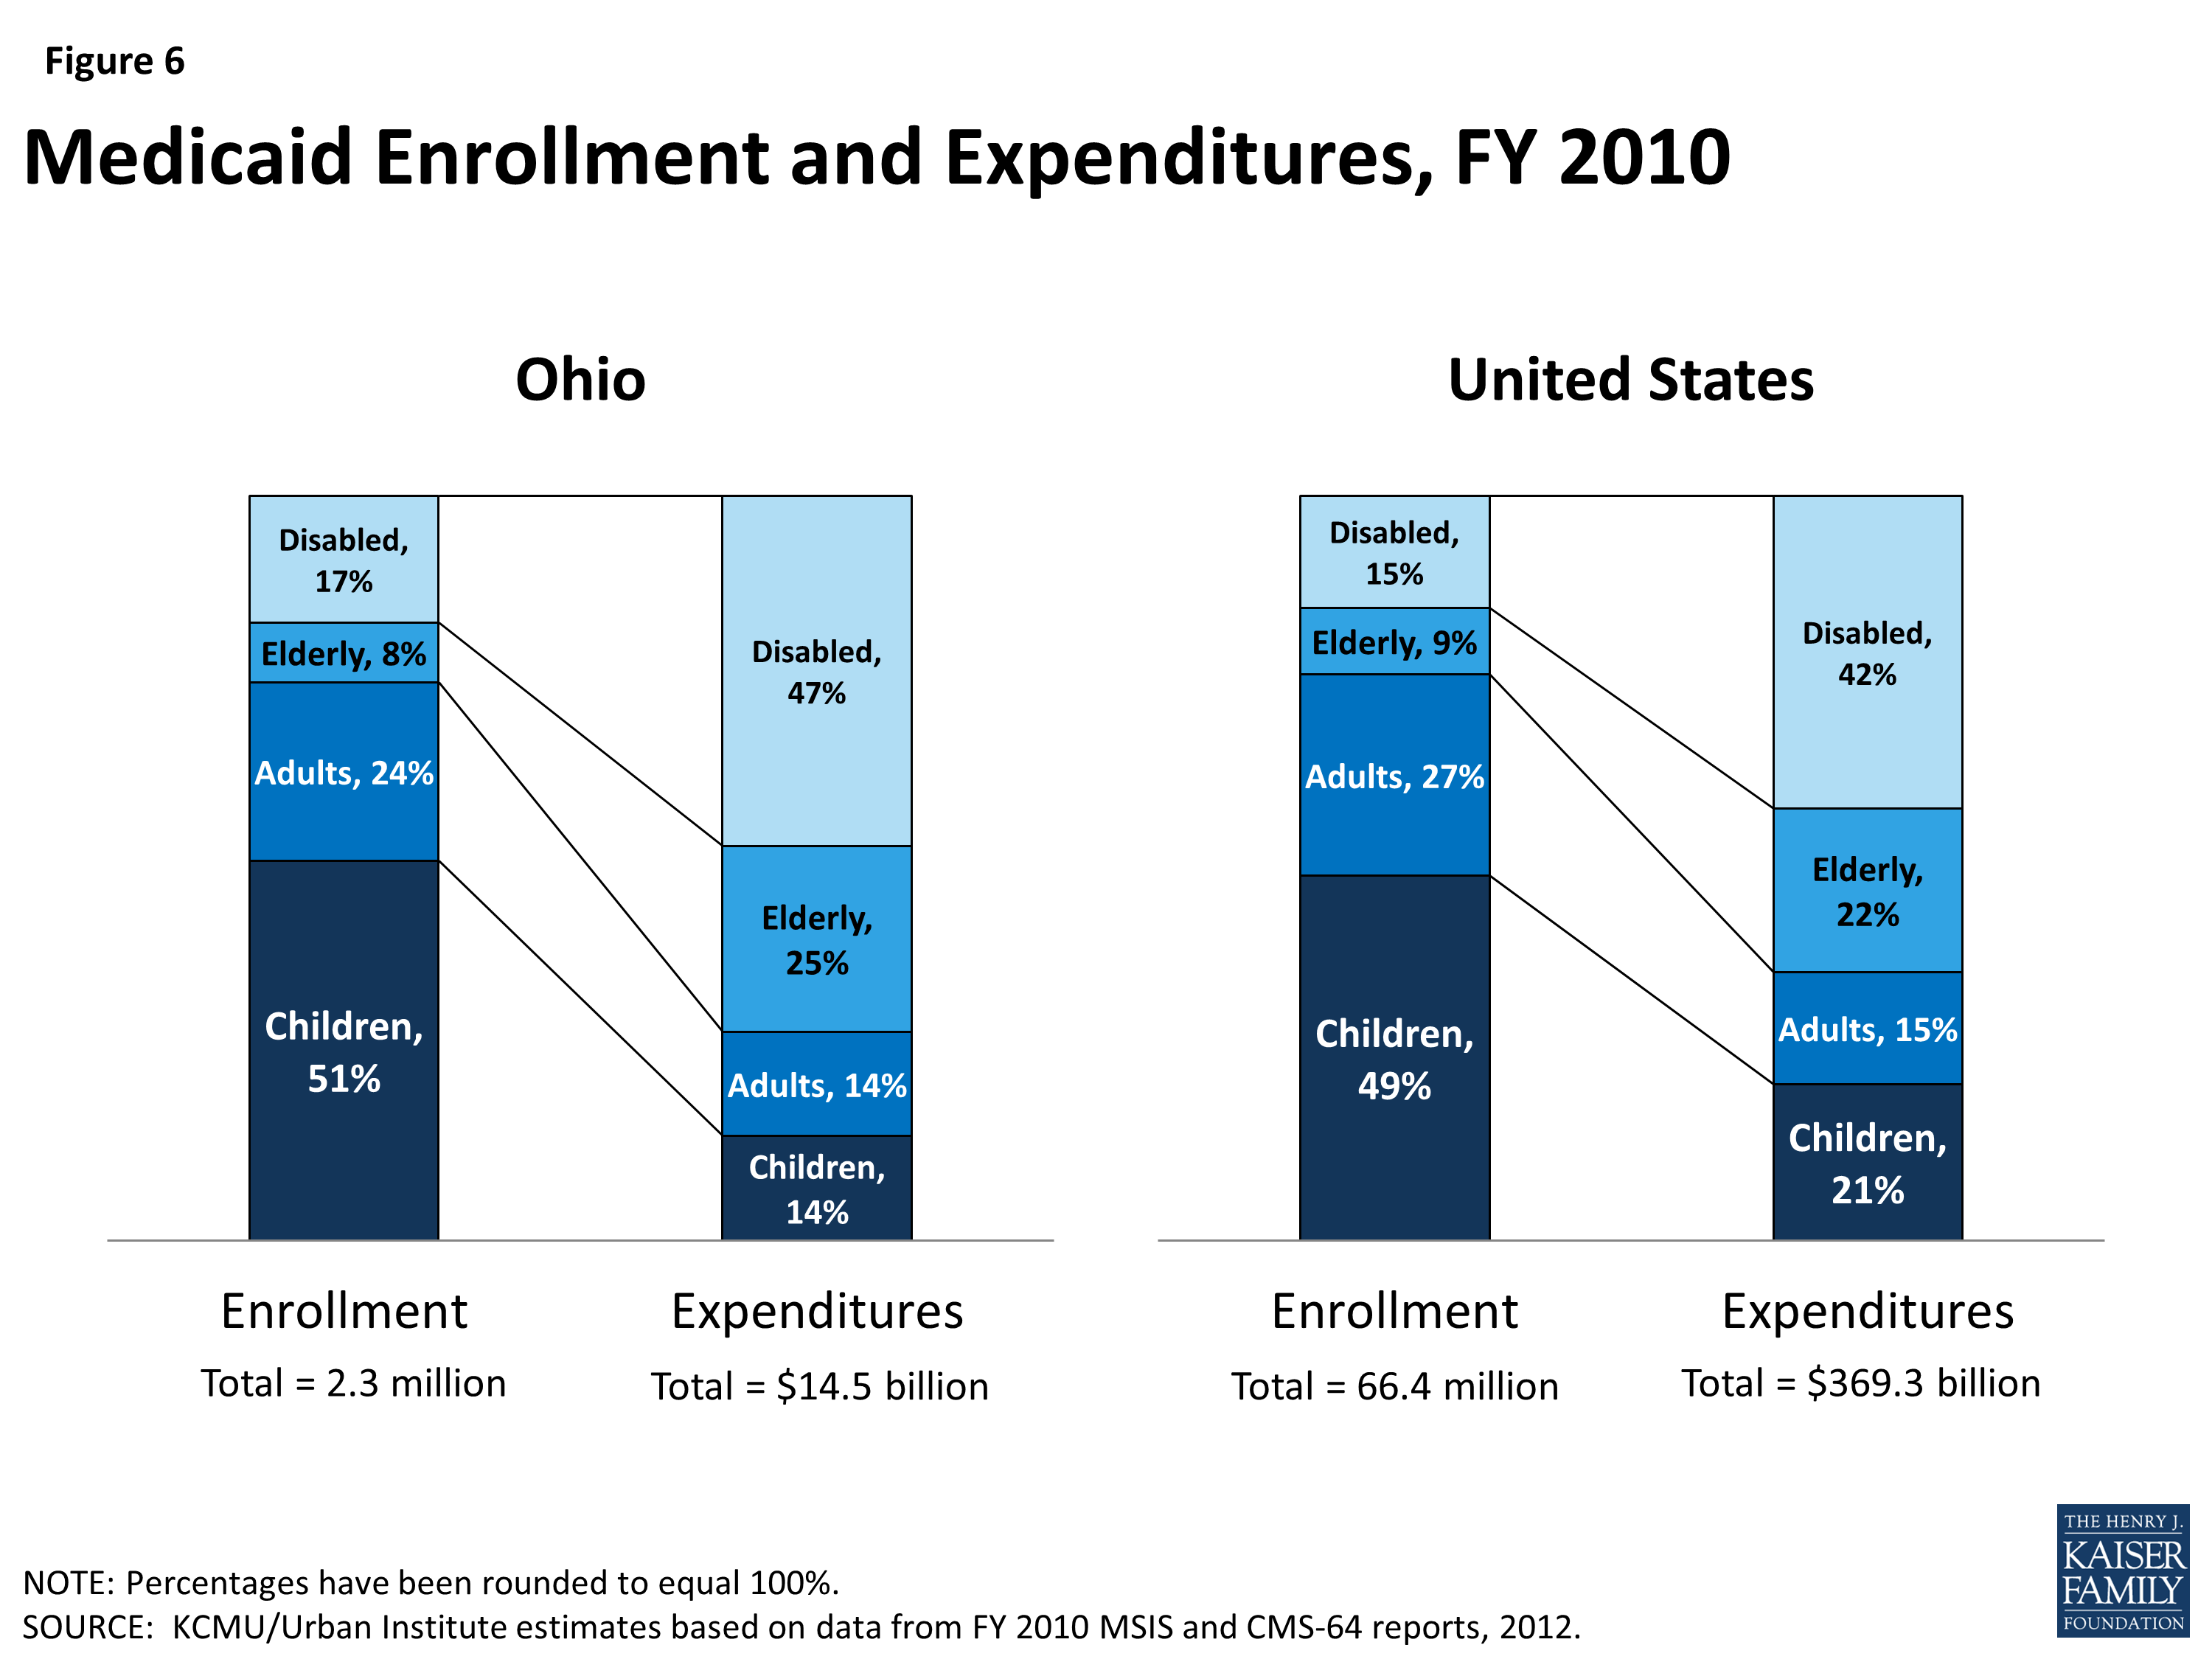
Figure 6: Medicaid Enrollment and Expenditures, FY 2010
Ohio is seeking to better coordinate care and control costs for dual eligible beneficiaries, who often have complex and costly health care needs. In 2010, Ohio had 326,249 dual eligible individuals, or those who are eligible for both Medicaid and Medicare. Dual eligible beneficiaries made up 14% of total Medicaid enrollment and accounted for 40% of total Medicaid costs.48 Average spending per dual eligible was $21,415 per year. The majority spending for duals goes toward long-term services and supports (78%) followed by acute care services (15%)(Figure 9). In an effort to better integrate care and align financing for these beneficiaries, CMS is using new authority afforded under the ACA to launch demonstration projects in selected states across the country that test new care coordination and delivery models. Ohio is one of 12 states approved thus far to participate in the duals demonstration projects.49
Ohio’s financial alignment demonstration, MyCare Ohio, targets an estimated 114,000 full benefit dual eligible beneficiaries over age 18 in 29 counties, grouped into 7 regions.50 Under a capitated managed care model, the state and CMS are contracting with Integrated Care Delivery System (ICDS) health plans, which receive a prospective, payment from CMS for Medicare services and from the state for Medicaid services to provide dual eligible beneficiaries with coordinated, person-centered care. Anticipated program savings are deducted prospectively from CMS and the state’s contributions to the Medicare and Medicaid baseline capitated rates, according to the state’s Memorandum of Understanding with CMS.
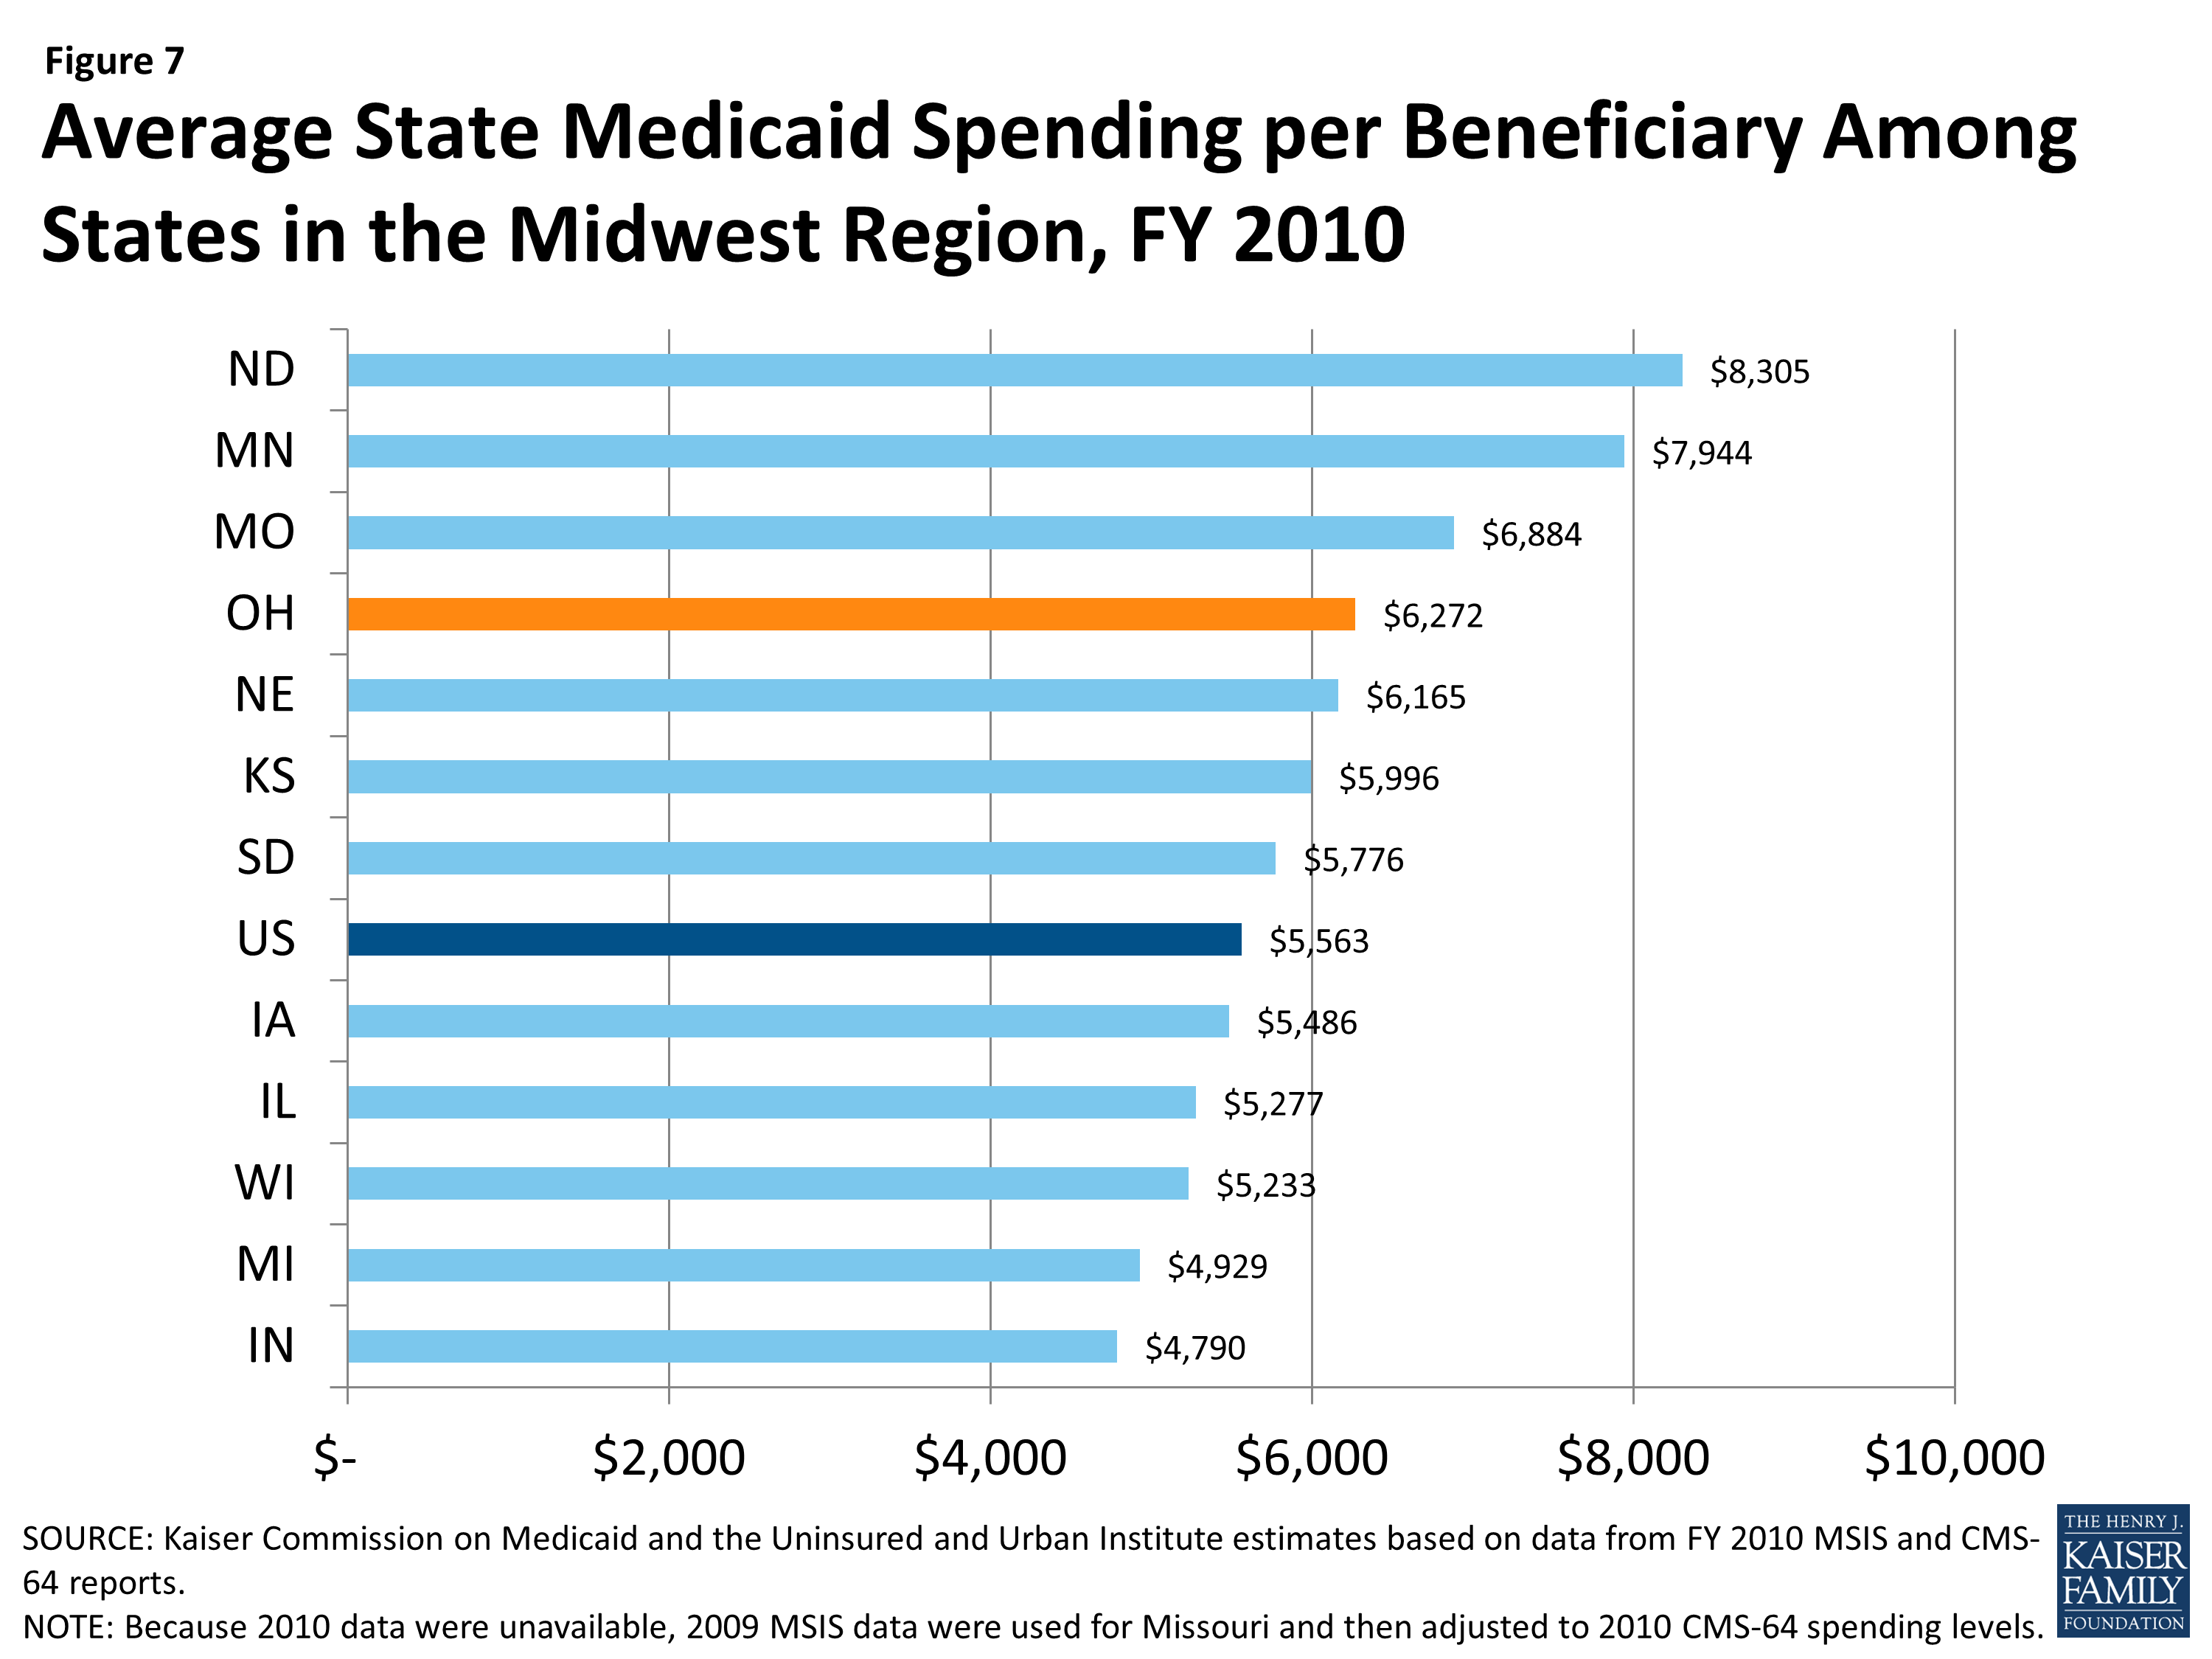
Figure 7: Average State Medicaid Spending per Beneficiary Among States in the Midwest Region, FY 2010
ICDS plans will offer care management services to coordinate medical, behavioral health, long-term services and supports (including home and community-based services), and social needs. Benefits include nearly all Medicare and Medicaid services, with the exception of Medicare hospice and Medicaid habilitation services, targeted case management, and home and community-based waiver services for beneficiaries with developmental disabilities. Plans have discretion to offer flexible benefits as appropriate to beneficiary needs. All individuals enrolled in ICDS plans will have an assigned, personal care manager who will seek input from the individual, family/caregiver, and providers to assess the needs of the individual.
Initially, Ohio is passively enrolling beneficiaries eligible for MyCare Ohio into ICDS managed care plans for their Medicaid benefits only. Medicaid managed care enrollment was phased in by region from May through July 2014, and is mandatory for affected beneficiaries. Between May and December 2014, these beneficiaries can choose to have the ICDS plans also manage their Medicare benefits.51 Those who do not opt into the demonstration for their Medicare benefits will be passively enrolled beginning in January 2015, so that the ICDS plan will then manage both their Medicare and Medicaid benefits. However, beneficiaries can choose to opt out of the demonstration for their Medicare benefits and instead continue to receive their Medicare benefits through traditional Medicare fee-for-service or through a Medicare Advantage plan.
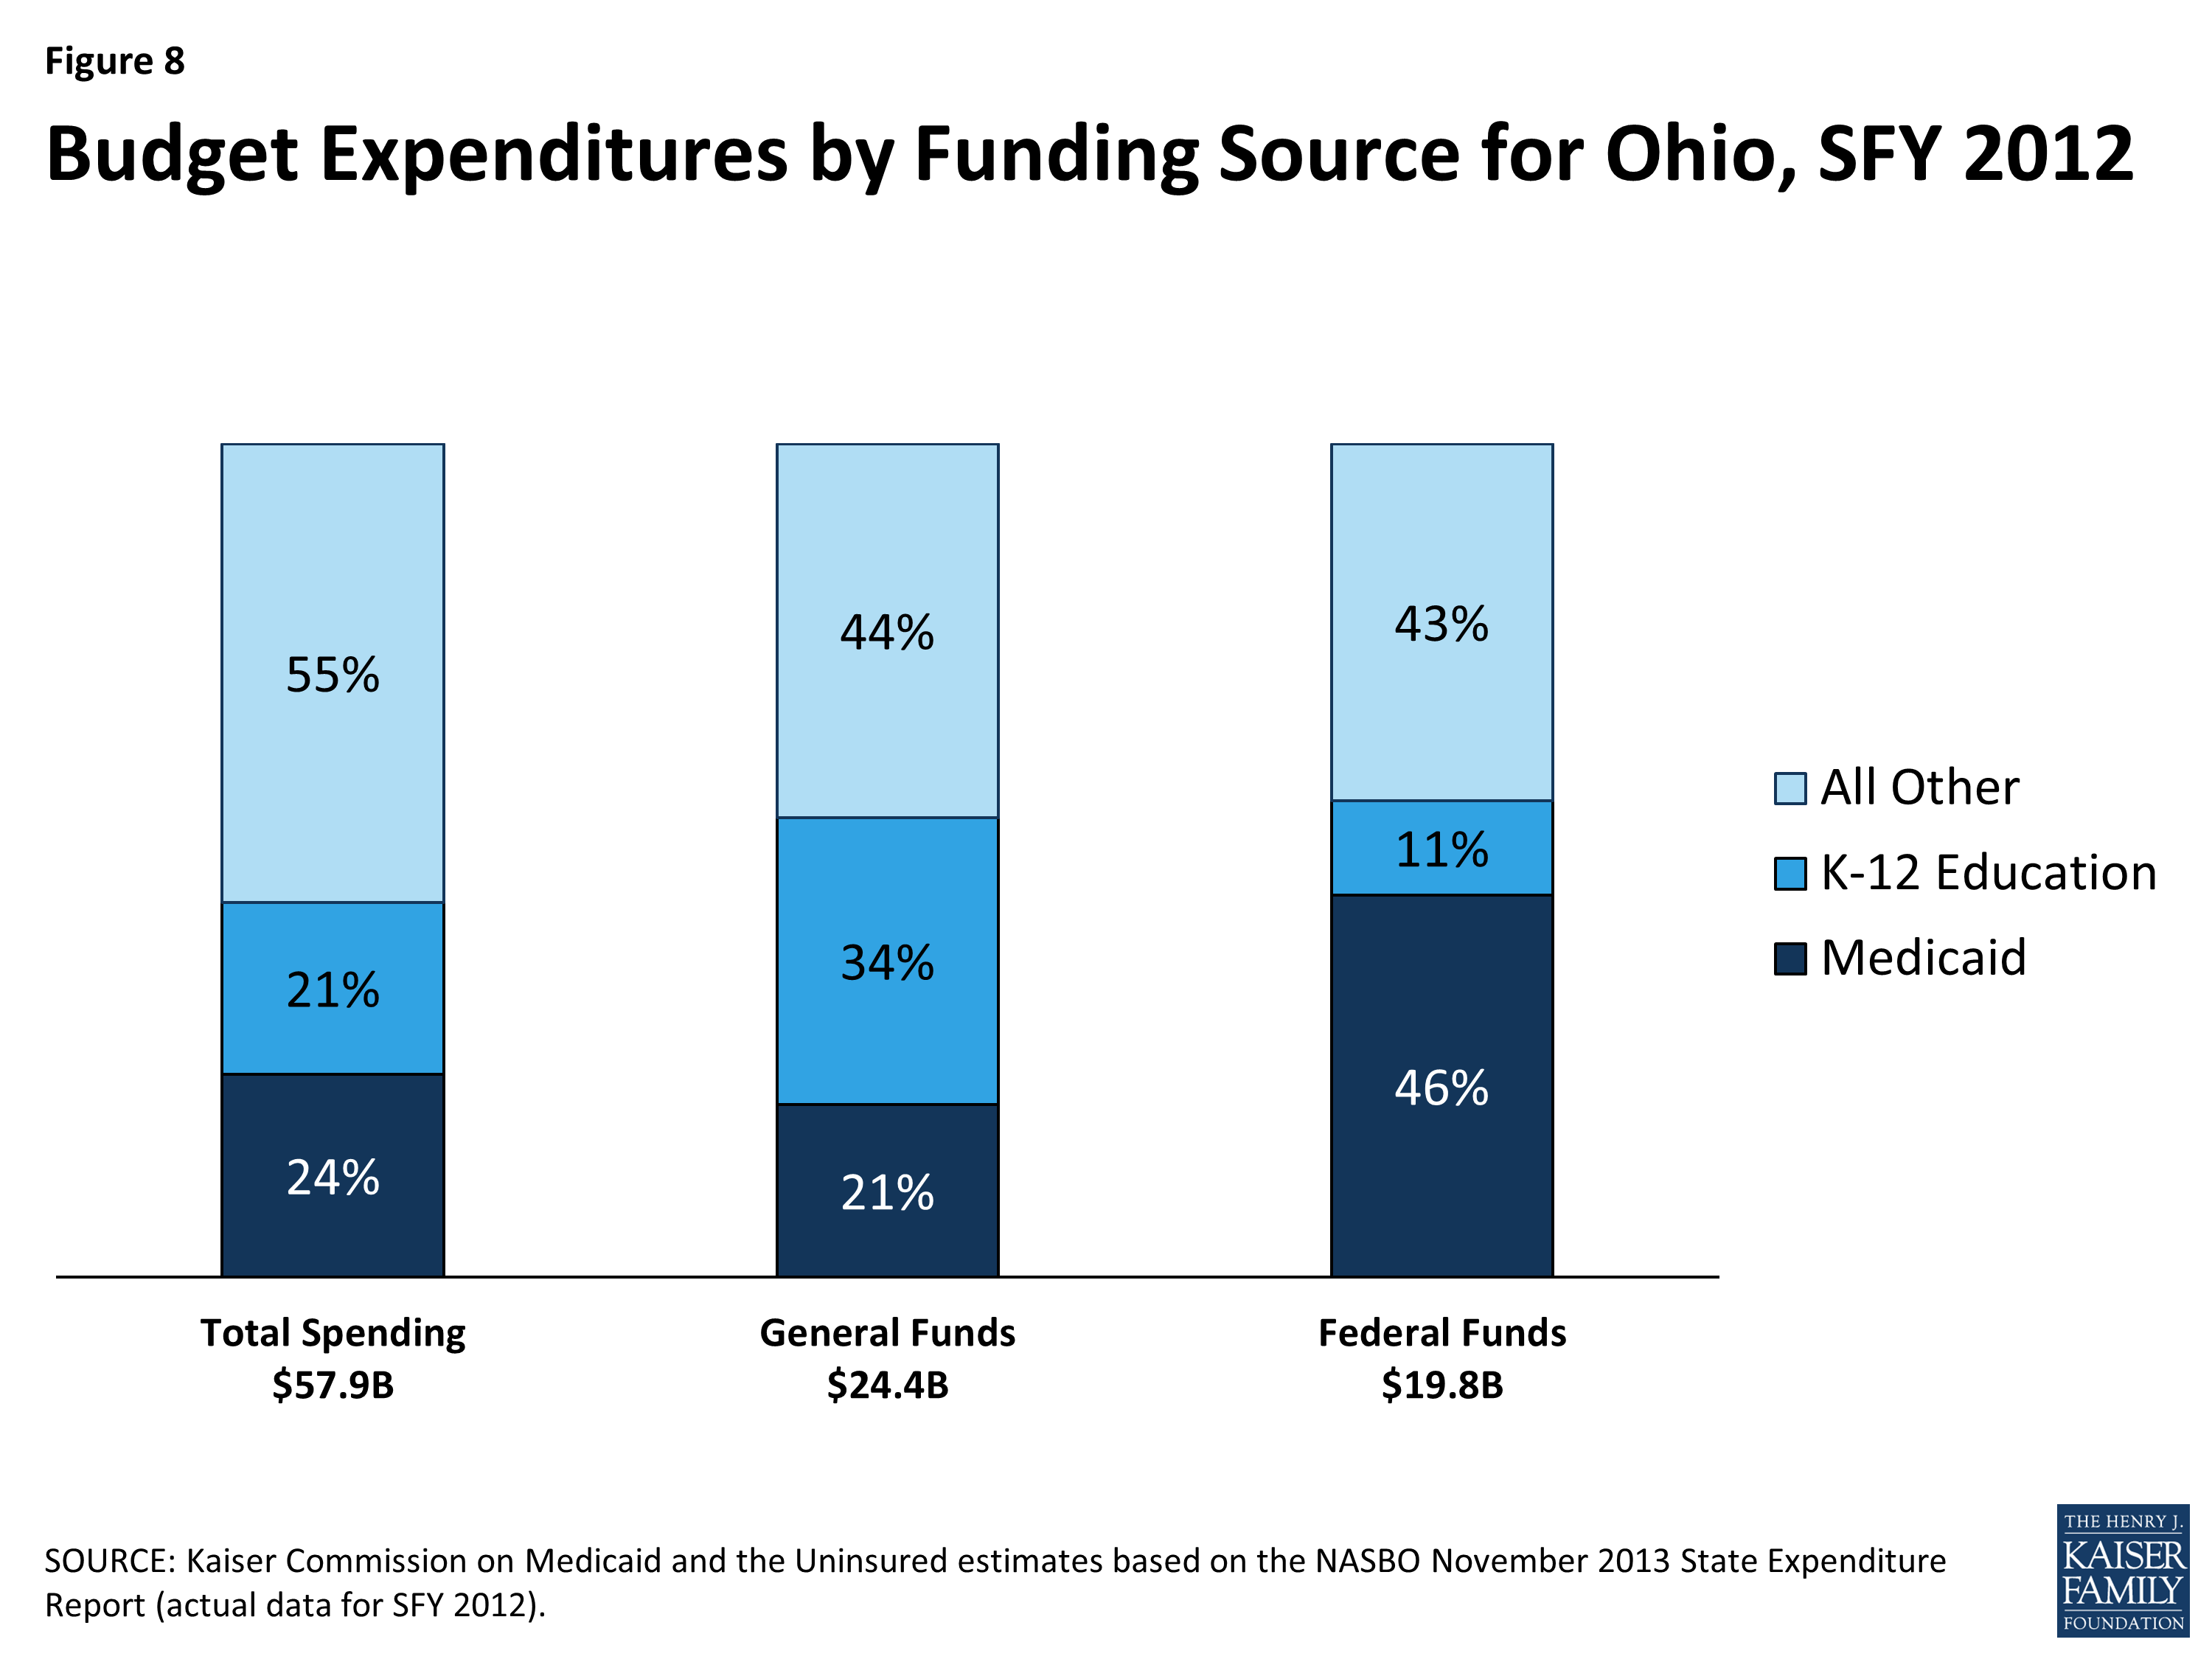
Figure 8: Budget Expenditures by Funding Source for Ohio, SFY 2012
Health Reform
The Affordable Care Act (ACA) could extend coverage to 1.5 million uninsured Ohioans. A main goal of the ACA is to extend health coverage to many of the 47 million nonelderly uninsured individuals across the country, including the 1.5 million uninsured Ohioans. The ACA accomplishes this through insurance reforms and by establishing new coverage pathways, including the expansion of Medicaid to cover nearly all nonelderly individuals up to 138% FPL ($16,105 for an individual, $27,310 for a family of 3 in 2014), and by providing premium subsidies to most individuals with incomes up to 400% FPL, who are not eligible for other coverage, to purchase coverage on the Health Insurance Marketplace (Figure 10). As a result of the Supreme Court decision on the ACA, the Medicaid expansion is now effectively a state option.52 Ohio is one of 26 states and DC presently implementing the ACA Medicaid expansion.53 Among previously uninsured nonelderly Ohioans, one-half are eligible for Medicaid or CHIP and one in four (26%) are eligible for premium subsidies under the ACA.54
Ohio received a Section 1115 Medicaid demonstration waiver to expand coverage prior to the ACA in Cuyahoga County. On February 5, 2013, Ohio received approval from CMS to extend coverage to up to 30,000 nonelderly adults residing in Cuyahoga County (the state’s most populous county that includes the city of Cleveland) with family income up to 133% FPL who were not otherwise eligible for Medicaid.55 The waiver, entitled “MetroHealth Care Plus”, enrolled individuals in a more limited Medicaid benefits package and ran through December 31, 2013, when many of these individuals became eligible for Medicaid under the ACA Medicaid expansion.56
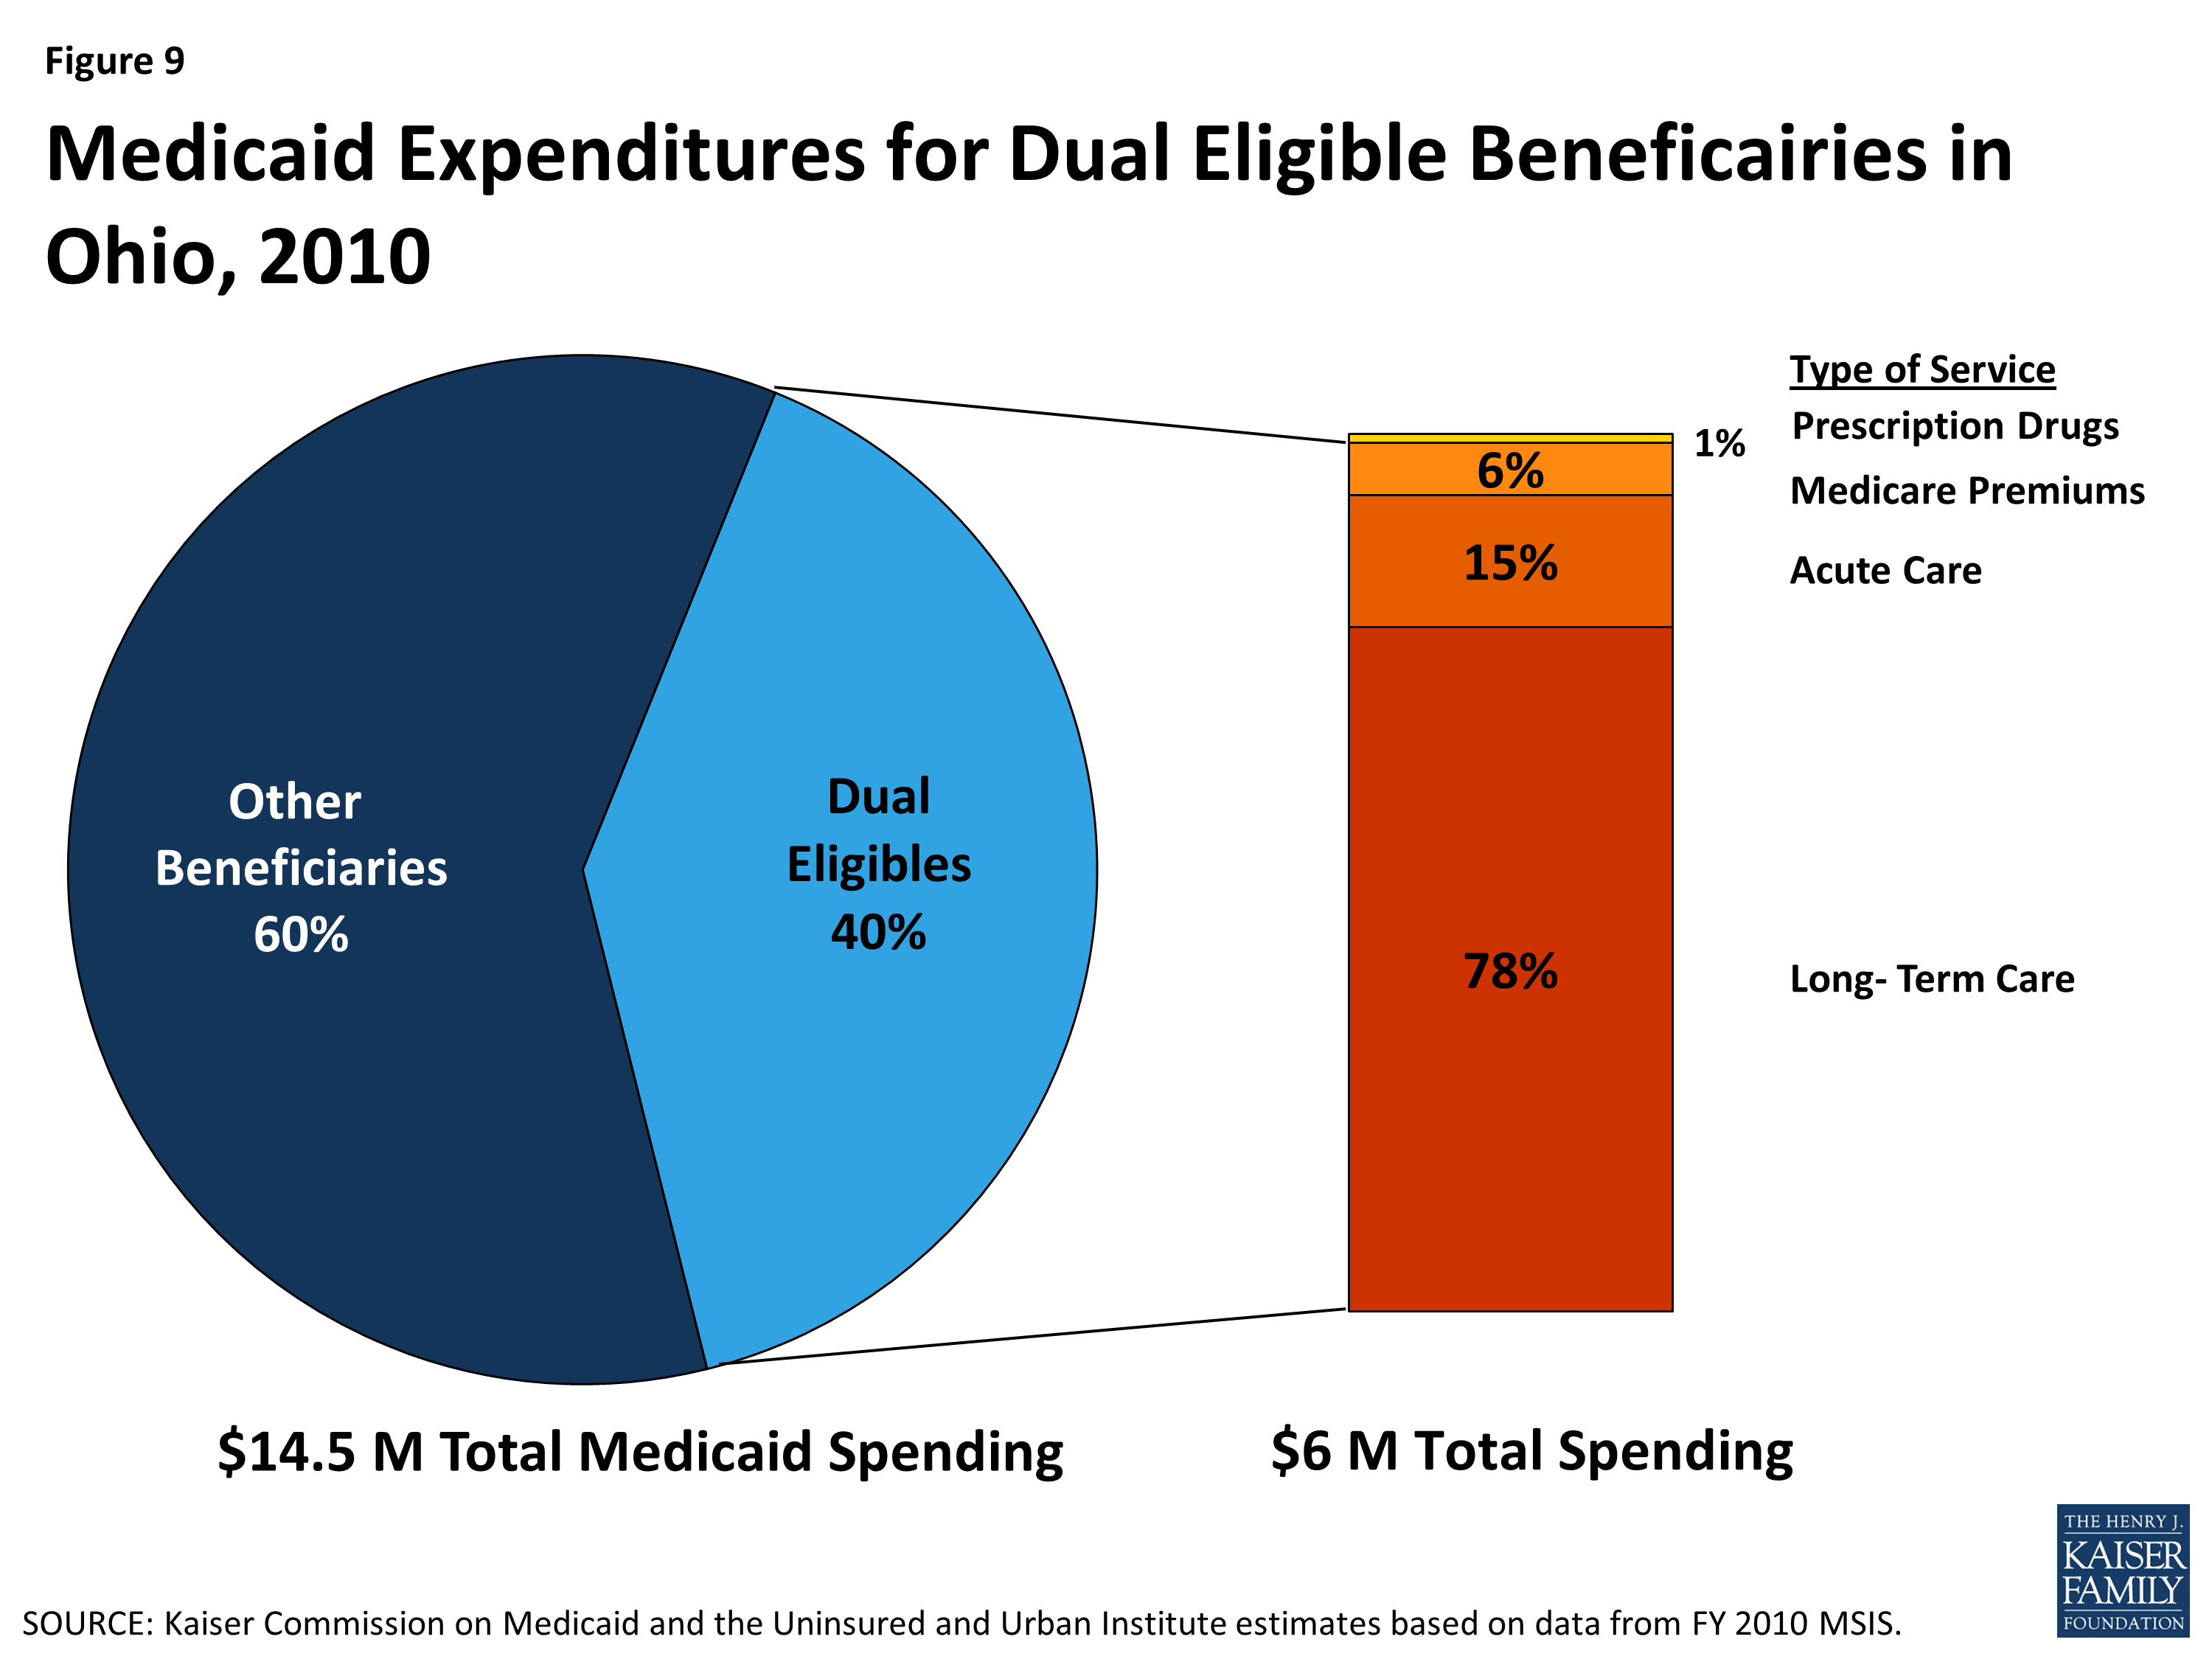
Figure 9: Medicaid Expenditures for Dual Eligible Beneficairies in Ohio, 2010
Medicaid Expansion
Ohio’s Controlling Board approved the state’s implementation of the Medicaid expansion. After the legislature failed to act on the Governor’s proposal to adopt the Medicaid expansion, Republican Governor John Kasich sought approval from the state’s bipartisan Controlling Board for the Medicaid expansion.57 Under the Medicaid expansion, the federal government pays 100% of the cost of coverage from 2014-2016, phasing down to 90% in 2020 and beyond. On October 22, 2013, with a vote of 5-2, the Board authorized the state to spend federal funds for the Medicaid expansion through July 2015. A lawsuit was filed by Republican House members and two Right to Life groups, but ultimately the Ohio Supreme Court upheld the state’s actions.58 A February 2013 analysis by the Health Policy Institute of Ohio, Ohio State University, the Urban Institute, and REMI show positive state fiscal and economic effects of expanding Medicaid in Ohio, estimating that the state would experience a net fiscal gain of at least $1.8 billion over the 2014–2022 period.59 The analysis also estimated that 27,000 new jobs would be created in Ohio as a result of the Medicaid expansion.

Figure 10: Eligibility for Financial Assistance in Gaining Coverage Among Currently Uninsured Ohioans, As of January 2014
Over 285,000 Ohioans have enrolled coverage as a result of the Medicaid expansion. Ohio’s actuaries estimate that 563,000 previously uninsured Ohioans are newly eligible for coverage under the Medicaid expansion.60 As of June 30, 2014, 285,553 newly eligible Ohioans have enrolled under the Medicaid expansion, including 26,000 individuals previously covered by MetroHealth Plus.61,62 As of April 1, 2014, Medicaid eligibility levels in Ohio are 211% FPL for children, 205% FPL for pregnant women, and 138% FPL for parents and other adults (Figure 11).
In addition to expanding eligibility for coverage, Ohio is streamlining and simplifying its enrollment process for health coverage under the ACA. Under the ACA, all states must implement simplified eligibility and enrollment processes. Individuals can apply for both Medicaid and Health Insurance Marketplace coverage through multiple pathways, including in person, over the phone, by mail, and online. Ohio developed a new website, www.benefits.ohio.gov, from which users can access a variety of services including Medicaid, food stamps and cash assistance, and Women, Infants and Children (WIC) nutritional assistance, among others.
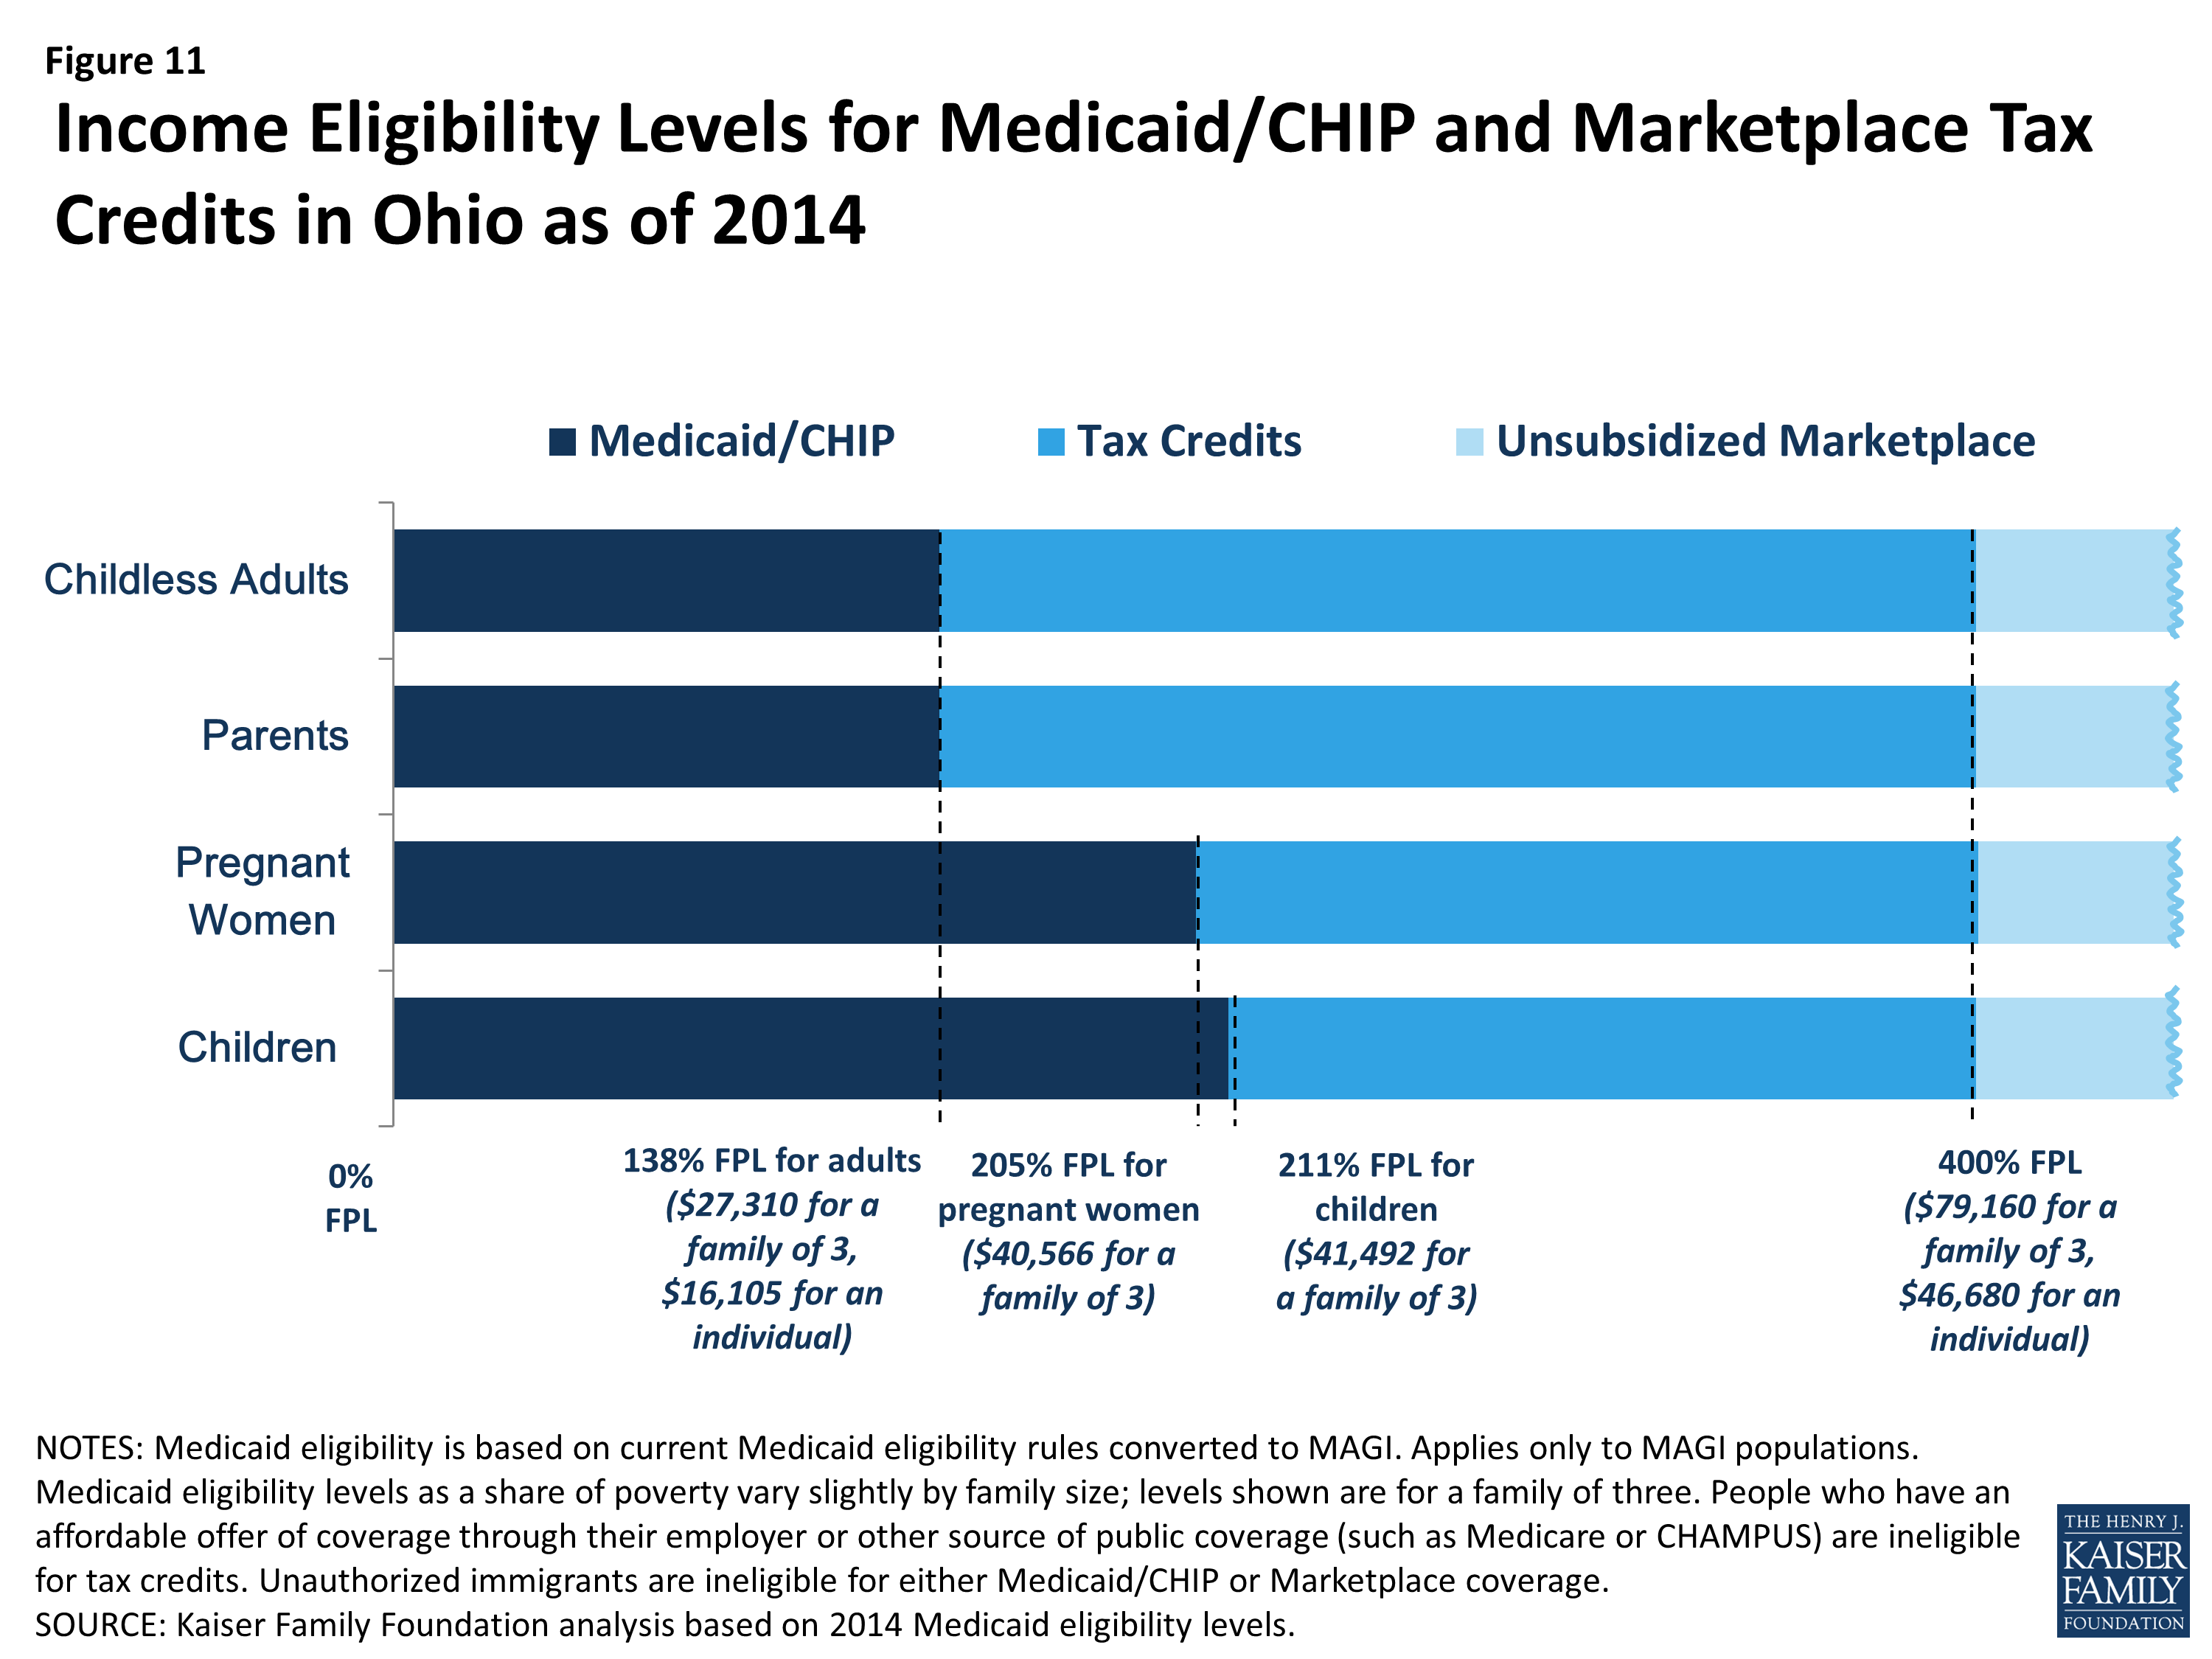
Figure 11: Income Eligibility Levels for Medicaid/CHIP and Marketplace Tax Credits in Ohio as of 2014
Health Insurance Marketplace
Ohio is one of 27 states in which the federal government has set up and is running their Health Insurance Marketplace.63 On November 16, 2012, Governor Kasich notified federal officials that Ohio would pursue a Federally-facilitated Marketplace; however, the state would maintain regulatory control over participating insurance providers.64 Ohio is one of seven states to receive approval from the Department of Health and Human Services (HHS) to conduct plan management activities to support certification of Qualified Health Plans (QHPs) in the Federally-facilitated Marketplace.65 The Ohio Department of Insurance (ODI) has the legal authority to oversee certification of QHPs using the System for Electronic Rate and Form Filing (SERFF) to collect, review, and approve plan rate and benefit information. ODI is also ensuring continued plan compliance, manage consumer complaints, and oversee decertification of issuers.66
In Ohio, 12 insurance providers are offering QHPs in Ohio’s marketplace.67 At $249 per month, Cleveland has the nineteenth lowest monthly premium for a Benchmark QHP among major cities across the country, before premium tax credits.68 Of the anticipated 812,000 Ohioans who might enroll in Marketplace coverage, 544,000 (67%) are estimated to be eligible for premium subsidies to help pay for their coverage.69 Ongoing litigation may potentially impact the availability of premium subsidies in states with Federally-facilitated Marketplaces, such as Ohio; however, these effects remain to be seen.70 Of As of April 19, 2014, 154,668 individuals in Ohio had selected a Marketplace plan, 131,515 of whom are receiving premium subsidies.71
The Affordable Care Act also provided for the establishment of Consumer Operated and Oriented Plans (CO-OPs). CO-OPs are a new type of non-profit, member-governed health insurance. They may operate locally, state-wide, or in multiple states and must be licensed as issuers in each state in which they operate. They are intended to offer more affordable, consumer friendly, and high quality health insurance options to compete with existing health insurers. CO-OPs may offer insurance both in and outside the state Marketplaces. Ohio is one of 23 states currently offering CO-OPs. The state’s CO-OP, InHealth Mutual, received a $129.3 million loan from HHS in October 2012, but did not receive its license to conduct business from the Ohio Department of Insurance until September 2013, which was too late to receive certification to offer a QHP through the Marketplace in 2014.72,73 Consequently, InHealth is only offering products outside the Marketplace in 2014, with the intention of offering individual and small group products through the Marketplace in 2015.
Delivery System Reform
Ohio is in the process of reforming its delivery system to include a statewide patient-centered medical home (PCMH) model and an episode-based payment model. In February 2013, the Ohio Governor’s Office of Health Transformation was awarded a $3 million State Innovation Model (SIM) grant by CMS to design payment models that increase access to patient-centered medical homes and support episode-based payments for acute medical events.74 The PCMH model has the potential to improve quality, outcomes and cost of care by holding a single entity, the medical home, accountable for the coordination of care for patients across the health care delivery system. The episode-based payment model establishes accountability for both outcomes and cost of care, rewarding providers for delivering high quality, guideline concordant care.75 The state will use existing data and health information technology to regularly assess the progress of these models, with the goal of having 80-90% of Ohio’s population in some value-based payment model (combination of episodes and population-based payment) within five years. Initiatives are also underway to provide better-integrated and coordinated care through programs, such as MyCare Ohio, the Balancing Incentive Program,76 and plans to implement Health Homes for individuals with severe and persistent mental illness.
Ohio’s safety net delivery system will continue to play an important role in delivering health care to the state’s vulnerable population. Ohio’s community health centers and hospitals provide access to needed primary, preventive, and acute care services for low-income and underserved residents. Ohio is home to 36 federally qualified health centers (FQHCs) and look-alike health centers, together operating 183 clinic sites throughout the state.77 In 2011, the state’s FQHCs saw over 484,631 patients and had over 1.6 million patient visits.78 Forty-one percent of patients had Medicaid, while 34% were uninsured.79 Nearly three quarters (71%) were below 100% FPL.80,81 HHS awarded Ohio’s 36 FQHCs $5.9 million for Fiscal Years 2013 and 2014 to assist with outreach and enrollment under the ACA.82
Additionally, Ohio’s version of the federally required Disproportionate Share Hospital (DSH) program, called the Hospital Care Assurance Program (HCAP), compensates hospitals that treat the uninsured and underinsured.83 These hospitals will receive an estimated of $433 million in federal funds in fiscal year 2014, the eighth highest amount among all states.84
Looking Ahead
Home to more than 11 million residents, including nearly 1.5 million who are uninsured, Ohio stands to help many currently uninsured individuals gain health coverage by providing coverage options across the income spectrum for low and moderate-income people. While the majority of residents will continue to receive their health coverage through employer-sponsored coverage, almost all the uninsured in Ohio are eligible for some type of coverage under the ACA. The state’s decision to expand Medicaid has the potential to cover an additional 500,000 Ohioans, and an additional 800,000 individuals are expected to enroll in the state’s Federally Facilitated Marketplace. Still, the impact of the ACA will depend on take-up of coverage among the eligible uninsured. Outreach, enrollment, and education efforts at the state and local level are and will continue to be important to engaging individuals and helping them appropriately access and utilize care.
As the seventh most populous state, Ohio is a diverse testing ground for health care reform. Ohio is home to four major metropolitan areas, while over 20 percent of its population resides in the state’s rural areas. Looking ahead, the Office of Health Transformation will lead activities to reform Ohio’s health care system with ongoing efforts to modernize Medicaid, streamline operations, and implement payment reforms. These and other changes under the ACA will likely impact the health, health care access, and health utilization of Ohioans now and in the future.
Appendix
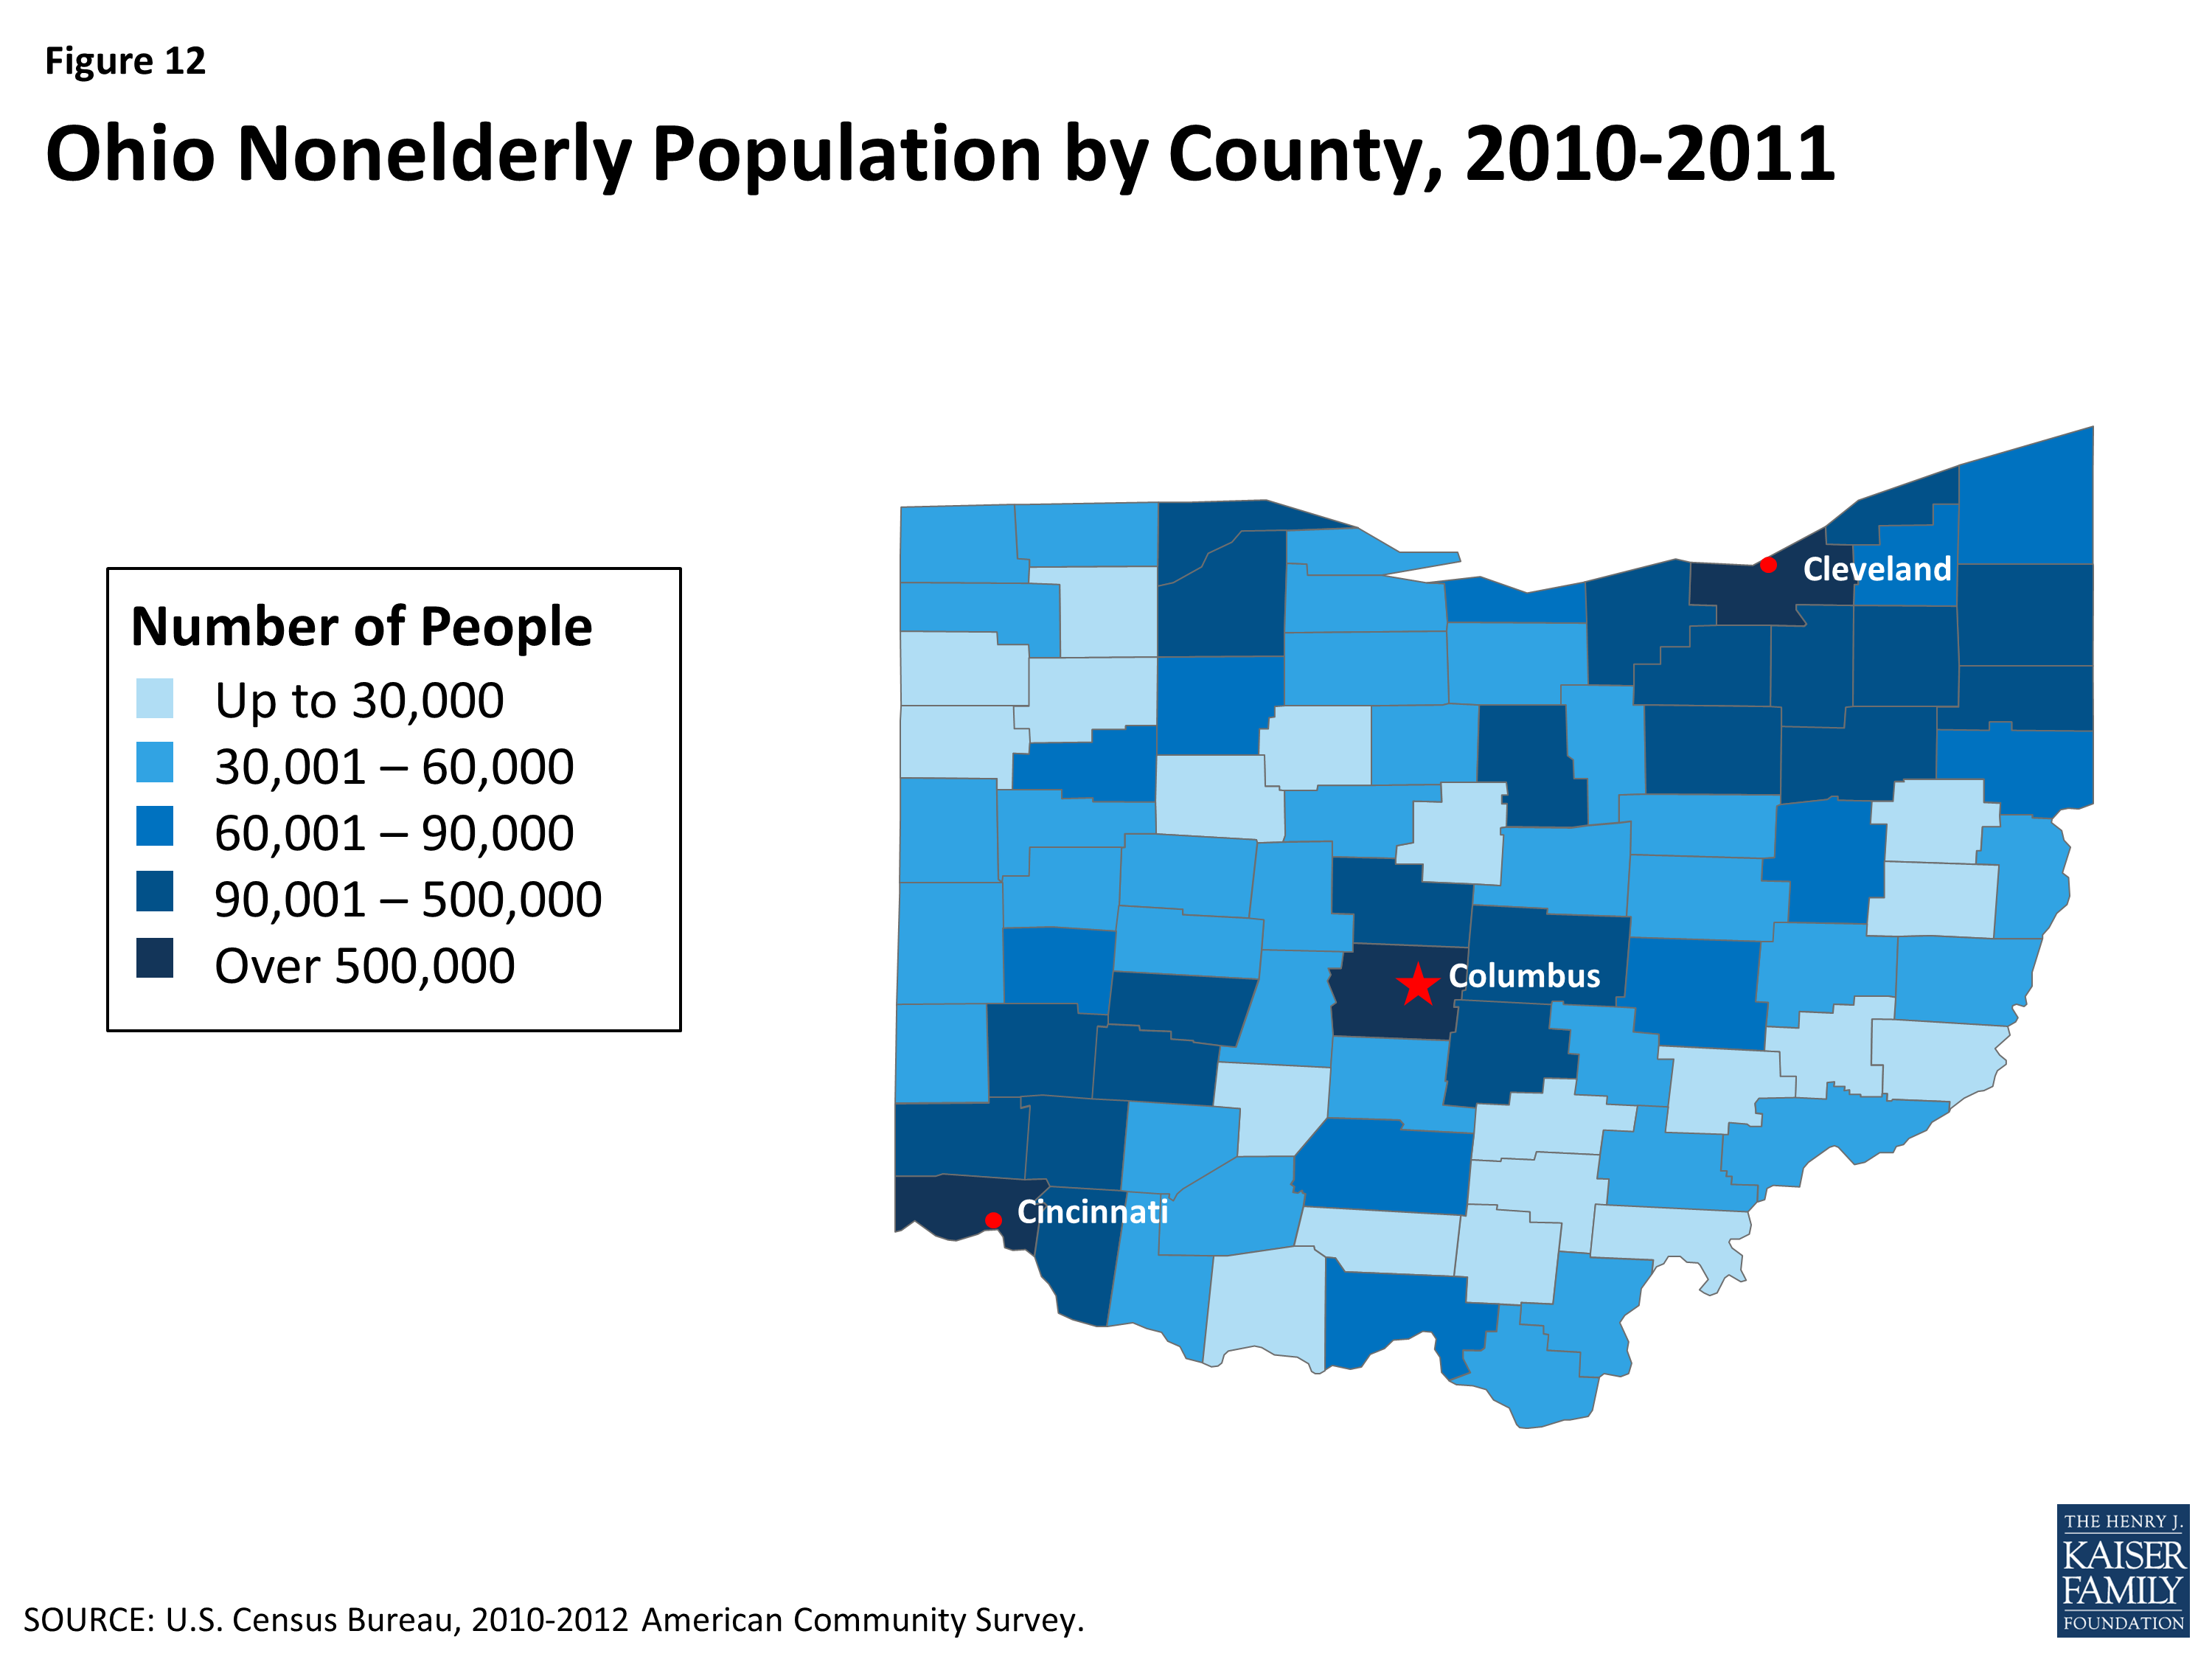
Figure 12: Ohio Nonelderly Population by County, 2010-2011
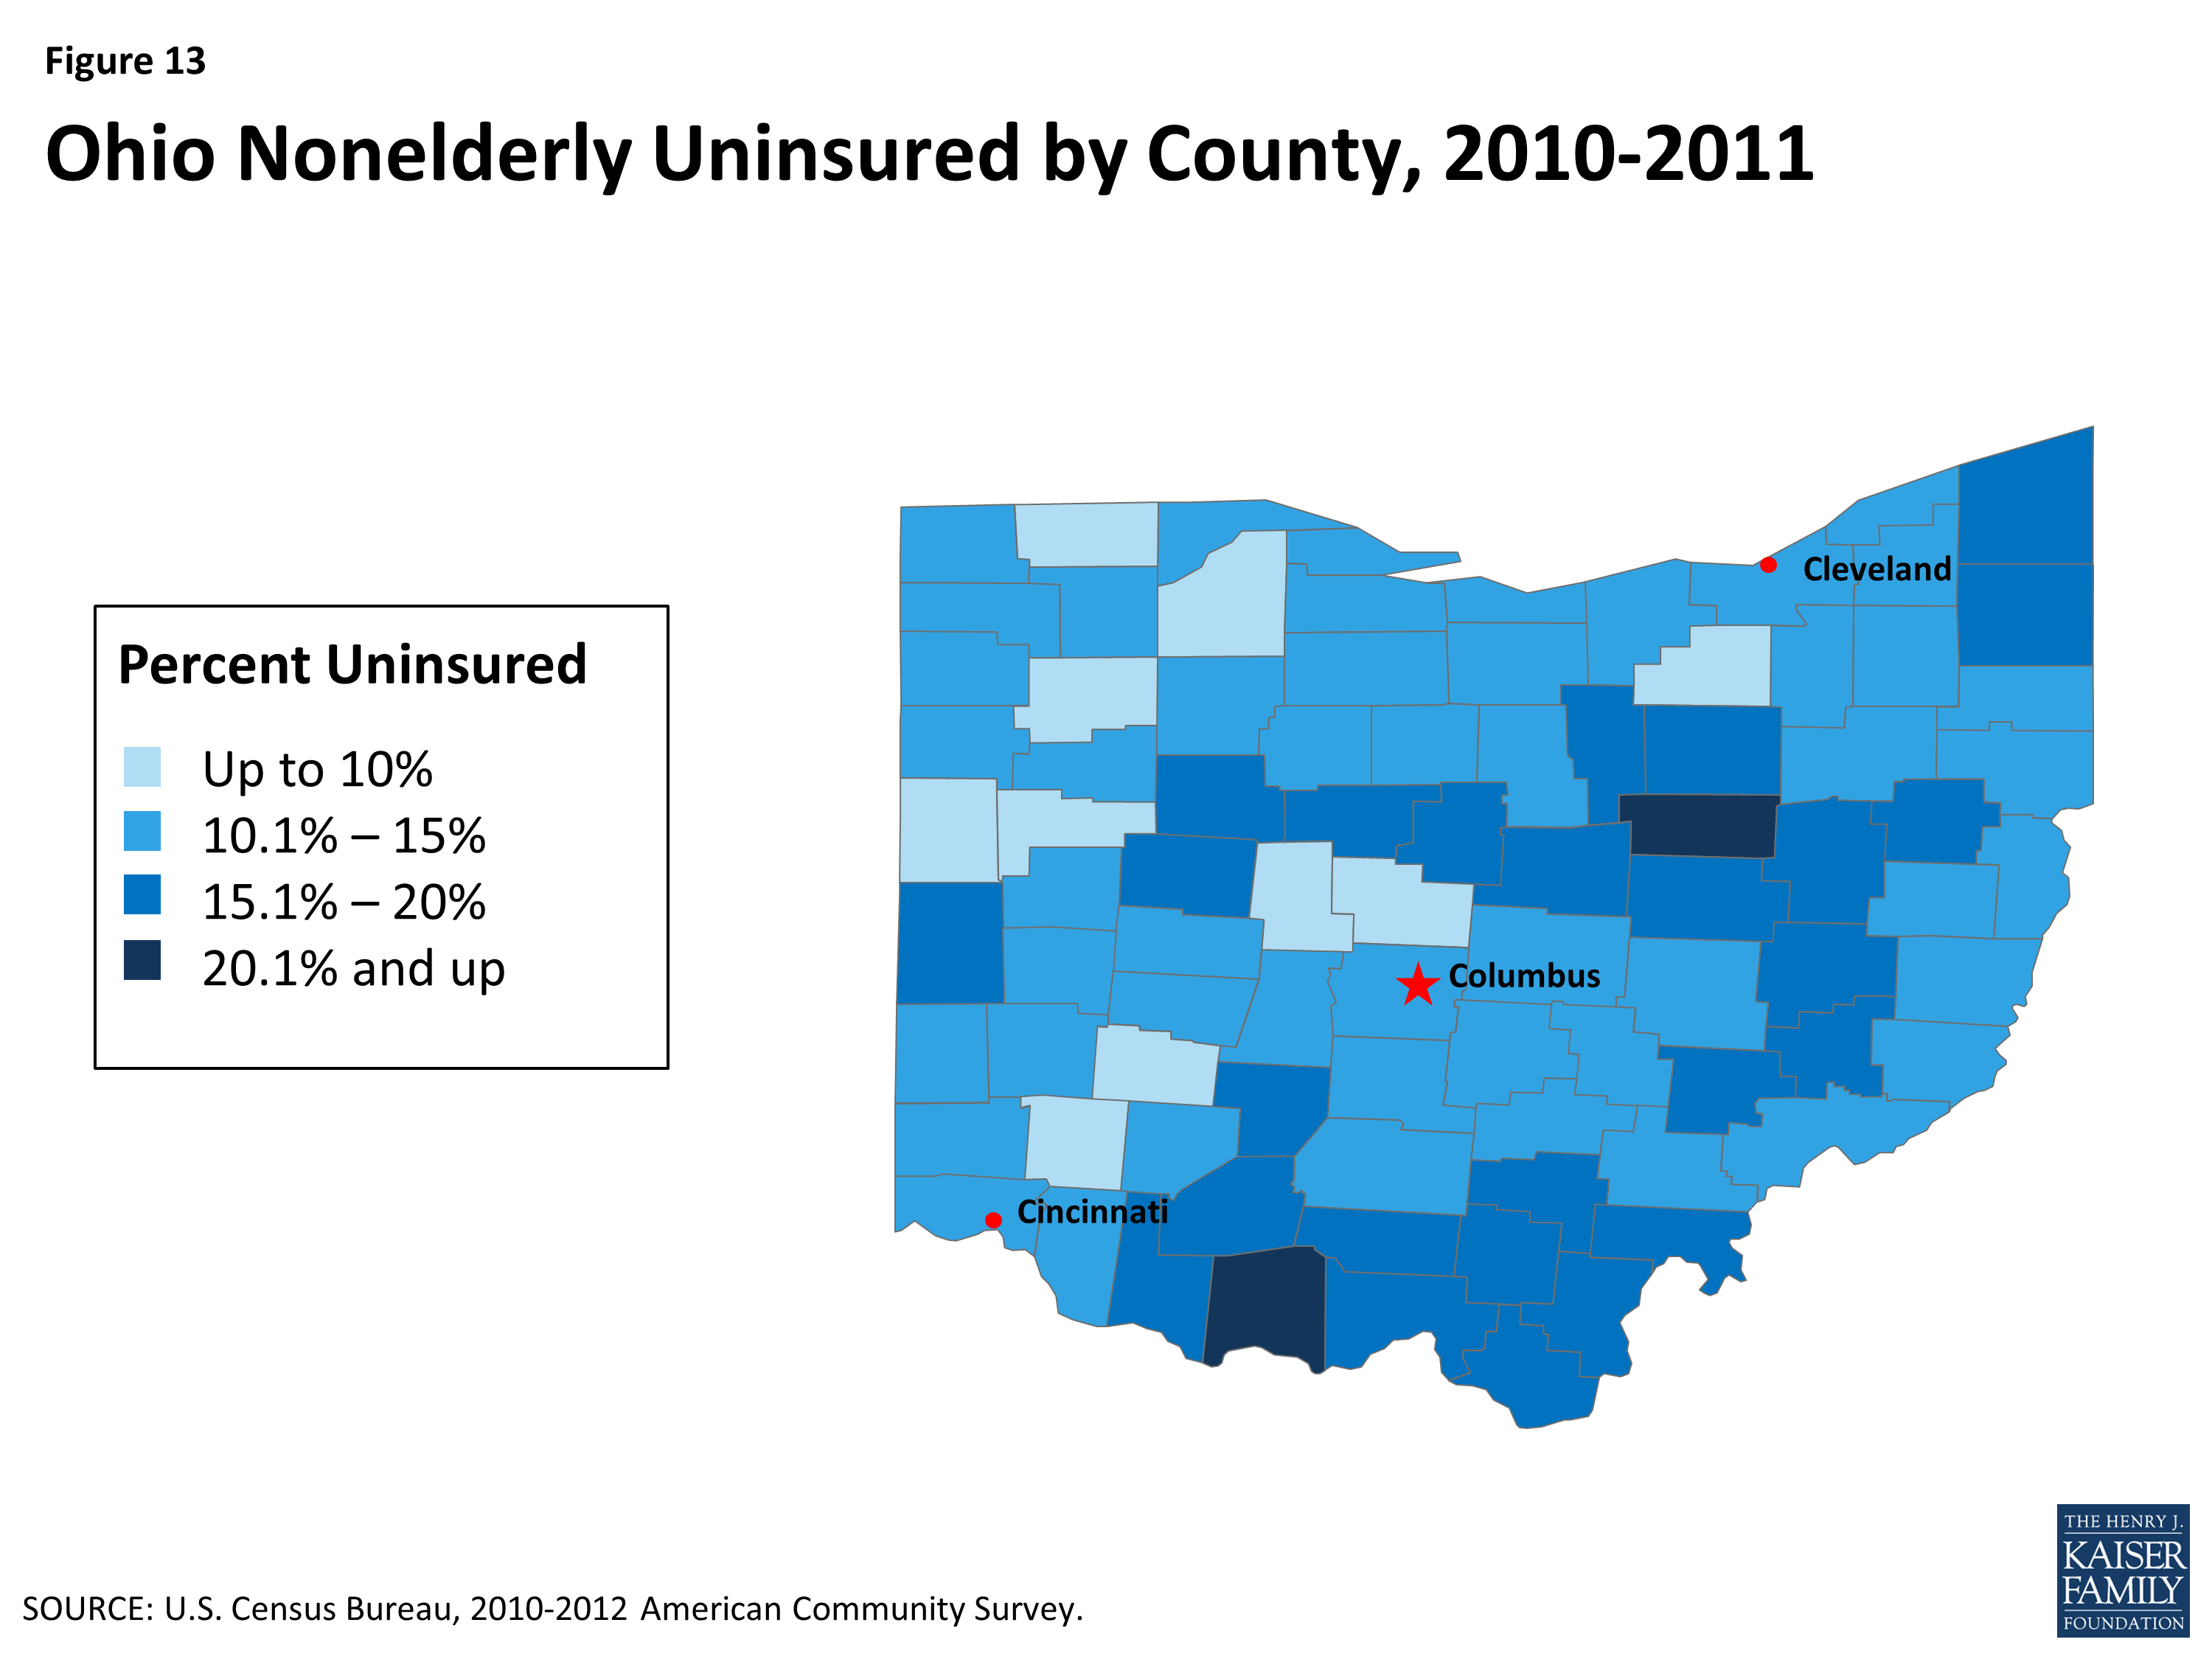
Figure 13: Ohio Nonelderly Uninsured by County, 2010-2011
Endnotes
Urban Institute and Kaiser Commission on Medicaid and the Uninsured estimates based on the Census Bureau's March 2012 and 2013 Current Population Survey (CPS: Annual Social and Economic Supplements).
World Atlas, United States, http://www.worldatlas.com/aatlas/infopage/usabysiz.htm.
U.S. Department of Commerce, Economics, and Statistics Administration, Census Regions and Divisions of the United States (U.S. Census Bureau), http://www.census.gov/geo/maps-data/maps/pdfs/reference/us_regdiv.pdf.
World Atlas, Ohio: Geography, http://www.worldatlas.com/webimage/countrys/namerica/usstates/ohland.htm.
Appalachian Regional Commission, Counties in Appalachia, http://www.arc.gov/counties.
USDA Economic Research Service, State Fact Sheets: Ohio, 2013 Population (June 4, 2014), http://www.ers.usda.gov/data-products/state-fact-sheets/state-data.aspx?StateFIPS=49&StateName=Ohio#Pf669f4c9093d4b0a843889df2cf5c5a1_2_39iT0 and US Census Bureau, 2013 County Total Population Estimates.
Bureau of Labor Statistics, Civilian Labor Force and Unemployment by State and Selected Area, Seasonally Adjusted (July 18, 2014), http://www.bls.gov/news.release/laus.t03.htm and http://data.bls.gov/cgi-bin/surveymost?BLS.
U.S. Department of Labor, Regional and State Employment and Unemployment (July 18, 2014) http://www.bls.gov/news.release/laus.toc.htm.
Urban Institute and Kaiser Commission on Medicaid and the Uninsured estimates based on the Census Bureau's March 2012 and 2013 Current Population Survey (CPS: Annual Social and Economic Supplements).
Urban Institute and Kaiser Commission on Medicaid and the Uninsured estimates based on the Census Bureau's March 2012 and 2013 Current Population Survey (CPS: Annual Social and Economic Supplements).
Urban Institute and Kaiser Commission on Medicaid and the Uninsured estimates based on the Census Bureau's March 2012 and 2013 Current Population Survey (CPS: Annual Social and Economic Supplements).
Office of Budget and Management, News Release, July 2, 2014, available at: http://obm.ohio.gov/Memos/doc/2014-07-02_FY14_Year-end-Close_News-Release.pdf.
Bureau of Economic Analysis, Widespread Economic Growth in 2012 (June 6, 2013), http://www.bea.gov/newsreleases/regional/gdp_state/gsp_newsrelease.htm and Bureau of Economic Analysis, Widespread But Slower Growth in 2013 (June 11, 2014), http://www.bea.gov/newsreleases/regional/gdp_state/gsp_newsrelease.htm.
Ibid.
Bureau of Economic Analysis, Gross Domestic Product by State 2012 (June 11, 2014).
United Health Care Foundation. America’s Health Rankings: State Ranking Overview (2013), http://americashealthrankings.com/OH/2013.
Centers for Disease Control and Prevention, National Center for Health Statistics. Mortality – All County Micro-Data File, as compiled from data provided by the 57 vital statistics jurisdictions through the Vital Statistics Cooperative Program. Population counts are from the CDC WONDER Database, , http://www.measureofamerica.org/maps/.
In Ohio, 11.7% of adults have been diagnosed with diabetes in 2012, compared to a national average of 10.2% (KCMU analysis of the Center for Disease Control and Prevention (CDC)'s Behavioral Risk Factor Surveillance System (BRFSS) 2012 Survey Results).
In 2012, 65.3% of Ohio adults were overweight or obese, compared to 63.4% of adults nationally (KCMU analysis of the Center for Disease Control and Prevention (CDC)'s Behavioral Risk Factor Surveillance System (BRFSS) 2012 Survey Results).
In 2012, 23.3% of adults in Ohio smoked, compared to a national average of 18.8% (KCMU analysis of the Center for Disease Control and Prevention (CDC)'s Behavioral Risk Factor Surveillance System (BRFSS) 2012 Survey Results).
Ohio’s infant mortality rate for 2007-2009 was 7.7 deaths per 1,000 live births, compared to the national average of 6.6 deaths per 1,000 live births (Matthews, TJ, M.S., et. al. Infant Mortality Statistics from the 2009 Period Linked Birth/Infant Death Data Set. Division of Vital Statistics. National Vital Statistics Report, Vol 61, No. 8, January 24, 2013).
United Health Care Foundation. America’s Health Rankings: State Ranking Overview (2013), http://americashealthrankings.com/OH/2013.
The 2009 incidence of invasive cancer in Ohio was 448 per 100,000 individuals, compared to the U.S. average of 459 per 100,000 individuals (U.S. Cancer Statistics Working Group. United States Cancer Statistics: 1999-2009 Incidence and Mortality Web-based Report. Atlanta (GA): Department of Health and Human Services, Centers for Disease Control and Prevention, and National Cancer Institute; 2013).
2010 Behavioral Risk Factor Surveillance System (BRFSS).
Ibid.
Ibid.
Ibid.
The infant mortality rate for Blacks from 2007-2009 was 14.5 deaths per 1,000 live births, compared to 6.3 deaths per 1,000 live births for Whites and 7.3 deaths per 1,000 live births for Hispanics (Matthews, TJ, M.S., et. al. Infant Mortality Statistics from the 2009 Period Linked Birth/Infant Death Data Set. Division of Vital Statistics. National Vital Statistics Report, Vol 61, No. 8, January 24, 2013).
2010 Behavioral Risk Factor Surveillance System (BRFSS).
Health Policy Institute of Ohio, Unhealthy Differences: Regional Health Disparities in Ohio (October 2009), http://a5e8c023c8899218225edfa4b02e4d9734e01a28.gripelements.com/pdf/policybrief_disparitiesregional.pdf.
Health Policy Institute of Ohio, Unhealthy Differences: Regional Health Disparities in Ohio (October 2009), http://a5e8c023c8899218225edfa4b02e4d9734e01a28.gripelements.com/pdf/policybrief_disparitiesregional.pdf.
Ohio Statewide Health Disparities Collaborative, http://www.ohiohealthdisparitiescollaborative.org/.
The Ohio Commission on Minority Health, http://mih.ohio.gov/.
Case Western Reserve University, Center for Reducing Health Disparities, http://www.case.edu/med/ccrhd/.
March of Dimes Prematurity Research Center Ohio Collaborative, http://prematurityresearch.org/ohiocollaborative/.
UI and KCMU estimates based on Census Bureau's March 2011 and 2012 Annual Social and Economic Supplements to the CPS.
UI and Kaiser Commission on Medicaid and the Uninsured estimates based on the Census Bureau's March 2012 and 2013 Current Population Survey (CPS: Annual Social and Economic Supplements), available at: https://www.kff.org/other/state-indicator/total-population/.
UI and KCMU estimates based on Census Bureau's March 2011 and 2012 Annual Social and Economic Supplements to the CPS, available at: https://www.kff.org/state-category/health-coverage-uninsured/.
KCMU/Urban Institute estimates based on data from FY 2010 MSIS and CMS-64 reports, 2012.
KCMU/Urban Institute estimates based on data from FY 2010 MSIS and CMS-64 reports, 2012.
Federal Register, January 21, 2014 (Vol 79, No. 13), pp 3385-3388, http://www.gpo.gov/fdsys/pkg/FR-2014-01-21/pdf/2014-00931.pdf.
Urban Institute estimates based on data from CMS (Form 64) (September 16, 2013).
Kaiser Commission on Medicaid and the Uninsured estimates based on the NASBO November 2013 State Expenditure Report (actual data for SFY 2012).
Ohio Department of Medicaid, http://healthtransformation.ohio.gov/LinkClick.aspx?fileticket=dj6U-u4YCRE%3d&tabid=136.
Ohio Governor’s Office of Health Transformation, Transforming Ohio for Jobs + Growth: Fiscal Years 2014-2015 State Budget, http://www.healthtransformation.ohio.gov/LinkClick.aspx?fileticket=fq-wVCfLXak%3d&tabid=136
Medicaid Managed Care Enrollment Report, Centers for Medicare and Medicaid Services, U.S. Department of Health and Human Services, November 2012. Available at: http://www.medicaid.gov/Medicaid-CHIP-Program-Information/By-Topics/Data-and-Systems/Downloads/2011-Medicaid-MC-Enrollment-Report.pdf.
Governor’s Office of Health Transformation, Ohio Department of Medicaid, http://www.healthtransformation.ohio.gov/LinkClick.aspx?fileticket=pLbDpxRNQl4%3d&tabid=145 and http://www.healthtransformation.ohio.gov/LinkClick.aspx?fileticket=Aa0y9c6zC68%3d&tabid=84
Kaiser Commission on Medicaid and the Uninsured and Urban Institute estimates based on data from FY 2010 MSIS, 2013, https://www.kff.org/medicaid/issue-brief/medicaids-role-for-dual-eligible-beneficiaries/.
Kaiser Commission on Medicaid and the Uninsured, State Demonstration Proposals to Integrate Care and Align Financing and/or Administration for Dual Eligible Beneficiaries (Kaiser Family Foundation, July 2014), https://www.kff.org/medicaid/fact-sheet/state-demonstration-proposals-to-integrate-care-and-align-financing-for-dual-eligible-beneficiaries/. For more information, see: MaryBeth Musumeci, Financial and Administrative Alignment Demonstrations for Dual Eligible Beneficiaries Compared: States with Memoranda of Understanding Approved by CMS (Kaiser Family Foundation, July 2014), https://www.kff.org/medicaid/issue-brief/financial-alignment-demonstrations-for-dual-eligible-beneficiaries-compared/.
Ohio Department of Medicaid, “MyCare Ohio: Annual Report on Integrated Care Delivery System Evaluation,” July 1, 2014, available at: http://medicaid.ohio.gov/Portals/0/For%20Ohioans/Programs/MyCareOhio/AnnualReport/MyCare-OhioAnnualReport-SFY2014.pdf.
Ibid.
MaryBeth Musumeci, A Guide to the Supreme Court’s Affordable Care Act Decision (Kaiser Family Foundation, June 2012), https://www.kff.org/health-reform/issue-brief/a-guide-to-the-supreme-courts-affordable/.
State Health Facts, Status of State Action on the Medicaid Expansion Decision, 2014 (March 26, 2014), https://www.kff.org/health-reform/state-indicator/state-activity-around-expanding-medicaid-under-the-affordable-care-act/.
KCMU analysis based on 2014 Medicaid eligibility levels and 2012-2013 CPS.
CMS, Ohio “MetroHealth Care Plus” Approval Letter (February 5, 2013), http://www.medicaid.gov/Medicaid-CHIP-Program-Information/By-Topics/Waivers/1115/downloads/oh/oh-metrohealth-care-plus-ca.pdf.
Although originally scheduled to end December 31, 2013, MetroHealth Care Plus was extended through April 30, 2014 to smooth the transition of many former beneficiaries to Medicaid.
The Ohio Controlling Board is a seven-member panel with authority to adjust spending appropriations and to authorize the spending of federal funds for the ACA Medicaid expansion, once the state’s Medicaid agency had received approval from CMS of its state plan amendment to cover new eligibility groups.
State ex rel. Cleveland Right to Life v. State of Ohio Controlling Bd., 138 Ohio St. 3d 57, 2013-Ohio-5632 (Dec. 20, 2013), available at http://www.supremecourt.ohio.gov/rod/docs/pdf/0/2013/2013-Ohio-5632.pdf.
Amy Rohling et al., “Expanding Medicaid in Ohio, Analysis of Likely Affects,” The Urban Institute, February 2013, available at: http://www.urban.org/uploadedpdf/412772-Expanding-Medicaid-in-Ohio-Report.pdf
Mercer, Fiscal impact of the affordable Care Act on Medicaid Enrollment and Program Cost (State of Ohio, Office of Medical Assistance, February 13, 2013), pages 58 and 60, http://www.healthtransformation.ohio.gov/LinkClick.aspx?fileticket=WFcA5IZ-hak%3d&tabid=136.
Ohio Department of Medicaid, Caseload Report: June 2014 (July 10, 2014), http://medicaid.ohio.gov/Portals/0/Resources/Reports/Caseload/2014/06-Caseload.pdf.
Governor’s Office of Health Transformation, “Medicaid Applications in Ohio Benefits,” updated June 30, 2014, http://www.healthtransformation.ohio.gov/LinkClick.aspx?fileticket=jrKOicOZiIg%3D&tabid=117.
State Health Facts, “State Decisions for Creating Health Insurance Marketplaces, 2014” (May 28, 2013), https://www.kff.org/health-reform/state-indicator/health-insurance-exchanges/.
John Kasich. “Ohio Says No to an Obamacare Health Exchange.” November 16, 2012, http://governor.ohio.gov/exchange.aspx.
State Health Facts, “State Decisions for Creating Health Insurance Marketplaces” (Kaiser Family Foundation, May 28, 2013), https://www.kff.org/health-reform/state-indicator/health-insurance-exchanges/#note-2.
Letter from Lieutenant Governor Taylor to Gary Cohen (February 14, 2013), http://www.cms.gov/cciio/index.html.
For a listing of participating health insurance companies, see: U.S. News & World Report, “Ohio Exchange Health Insurance Plans” (January 2, 2014), http://health.usnews.com/health-insurance/ohio/marketplace-plans.
This is the monthly premium for a single, 40-year-old at 250% FPL. With premium tax credits, the monthly premium drops to $193. To see how Ohio compares to other states, see: State Health Facts, “ 2014 Monthly Premiums for a Single 40-Year-Old at 250 Percent of Poverty in a Major City in Each State” (Kaiser Family Foundation), https://www.kff.org/other/state-indicator/2014-monthly-premiums-for-a-single-40-year-old-at-250-percent-of-poverty-in-a-major-city-in-each-state/.
State Health Facts, State-by-State Estimates of the Number of People Eligible for Premium Tax Credits Under the Affordable Care Act (Kaiser Family Foundation, November 2013), https://www.kff.org/report-section/state-by-state-estimates-of-the-number-of-people-eligible-for-premium-tax-credits-under-the-affordable-care-act-table-1/.
Larry Levitt and Gary Claxton, The Potential Side Effects of Halbig (Kaiser Family Foundation, July 31, 2014), https://www.kff.org/health-reform/perspective/the-potential-side-effects-of-halbig/.
Office of the Assistant Secretary for Planning and Evaluation (ASPE), Profiles of Affordable Care Act Coverage Expansion Enrollment For Medicaid/CHIP and the Health Insurance Marketplace, 10-1-13 to 3-31-14 (Department of Health and Human Services (HHS), May 1, 2014), http://aspe.hhs.gov/health/reports/2014/MarketPlaceEnrollment/Apr2014/Marketplace_StateSum.cfm.
The Center for Consumer Information & Insurance Oversight, New Loan Program Helps Create Customer-Driven Non-Profit Insurers (CMS, January 1, 2014), http://www.cms.gov/CCIIO/Resources/Grants/new-loan-program.html.
Carrie Ghose, “InHealth Mutual gets Ohio license to sell policies” (Columbus Business First, September 27, 2013), http://www.bizjournals.com/columbus/news/2013/09/27/obamacare-backed-inhealth-mutual-gets.html.
Governor’s Office of Health Transformation, “Ohio Receives Federal Grant to Advance Health Care Payment Innovation” (February 21, 2013), http://www.healthtransformation.ohio.gov/LinkClick.aspx?fileticket=r2b-iXyOqCA=.
Governor’s Office of Health Transformation, “Transforming Payment for a Healthier Ohio,” Ohio’s State Health Care Innovation Plan, (October 30, 2013), http://www.healthtransformation.ohio.gov/LinkClick.aspx?fileticket=WsSlPFly5GI%3d&tabid=138.
The Affordable Care Act created the Balancing Incentive Program (BIP), which provides financial incentives to states that implement certain structural reforms to increase access to community-based LTSS as an alternative to institutional care. Ohio is one of 20 states participating in the Balancing Incentive Program (State Health Facts, Balancing Incentive Program (Kaiser Family Foundation, June 2014), https://www.kff.org/medicaid/state-indicator/balancing-incentive-program/). For additional information on the Balancing Incentive Program, see: http://www.balancingincentiveprogram.org/.
HRSA, Ohio: Health Center Outreach and Enrollment Assistance, http://www.hrsa.gov/about/news/2013tables/outreachandenrollment/oh.html and HRSA, Health Center and Look-alike Sites Facility Directory (April 1, 2014), http://findahealthcenter.hrsa.gov/Search_HCC.aspx?byCounty=1.
National Association of Community Health Centers, Incorporated (NACHC) analysis of the 2011 Uniform Data System, Bureau of Primary Health Care, Health Resources and Services Administration, Department of Health and Human Services, Special Data Request, (March 2013), http://www.nachc.com/client//2012%20Key%20data.pdf.
NACHC analysis of the 2011 Uniform Data System.
National Association of Community Health Centers, Ohio Health Center Fact Sheet, http://www.nachc.com/client/documents/research/OH12.pdf.
For additional information about FQHCs in Ohio compared to the rest of the U.S., see: Peter Shin, Jessica Sharac, and Sara Rosenbaum, The Potential Impact of the Affordable Care Act on Uninsured Community Health Center Patients: A Nationwide and State-by-State Analysis (George Washington University School of Public Health and Health Services, October 16, 2013), http://sphhs.gwu.edu/sites/default/files/GG%20uninsured%20impact%20brief.pdf.
HRSA, Ohio: Health Center Outreach and Enrollment Assistance, http://www.hrsa.gov/about/news/2013tables/outreachandenrollment/oh.html.
Ohio Department of Medicaid, Hospital Care Assurance Program, http://medicaid.ohio.gov/PROVIDERS/ProviderTypes/HospitalProviderInformation/HospitalCareAssuranceProgram.aspx.
Federal Register, February 28, 2014 (Vol. 79 No. 40), pp. 11436, http://www.gpo.gov/fdsys/pkg/FR-2014-02-28/pdf/2014-04032.pdf.
