
Are Uninsured Adults Who Could Gain Medicaid Coverage Working?
Under the Affordable Care Act (ACA), Medicaid was intended to play a key role in efforts to reduce the number of uninsured by expanding eligibility to nearly all low income adults with incomes at or below 138% FPL ($16,242 per year for an individual in 2015), but the Supreme Court ruling on the ACA’s constitutionality effectively made the expansion a state option. As of February 2015, 29 states including DC have adopted the expansion and in upcoming months, a number of other states will be debating whether to implement the expansion as governors release budgets for state fiscal year 2016 and state legislatures convene. An estimated 14 million uninsured adults would meet the Medicaid eligibility requirements (based on income, immigration status, and age) if all states had implemented the Medicaid expansion. The estimated 14 million includes adults who were eligible but not enrolled under pre-ACA rules in all states, those made newly eligible in expansion states, and in non-expansion states those in the coverage gap and those with incomes between 100-138% FPL who may now have access to tax credits in the marketplace.One aspect of the uninsured population that could gain Medicaid coverage that is poorly understood is their attachment to the workforce. As additional states consider whether to implement the expansion, some have raised pursuing waiver authority to tie Medicaid eligibility for adults under the expansion to work requirements. This fact sheet profiles uninsured adults who could gain Medicaid coverage under the ACA by their relationship to the workforce and job-based coverage.
Most uninsured adults who could gain Medicaid coverage are already working or in a family with a worker. Nearly three out of four (72%) of the uninsured adults who could gain Medicaid coverage live in a family with at least one full-time or a part time worker and more than half (57%) are working full or part-time themselves. (Figure 1) Among the 14 million uninsured adults who could gain Medicaid coverage men and women are evenly split and older adults (ages 46-64) account for nearly one-third (32%). About half live in states that adopted the expansion and half in states not implementing the expansion. (Table 1)
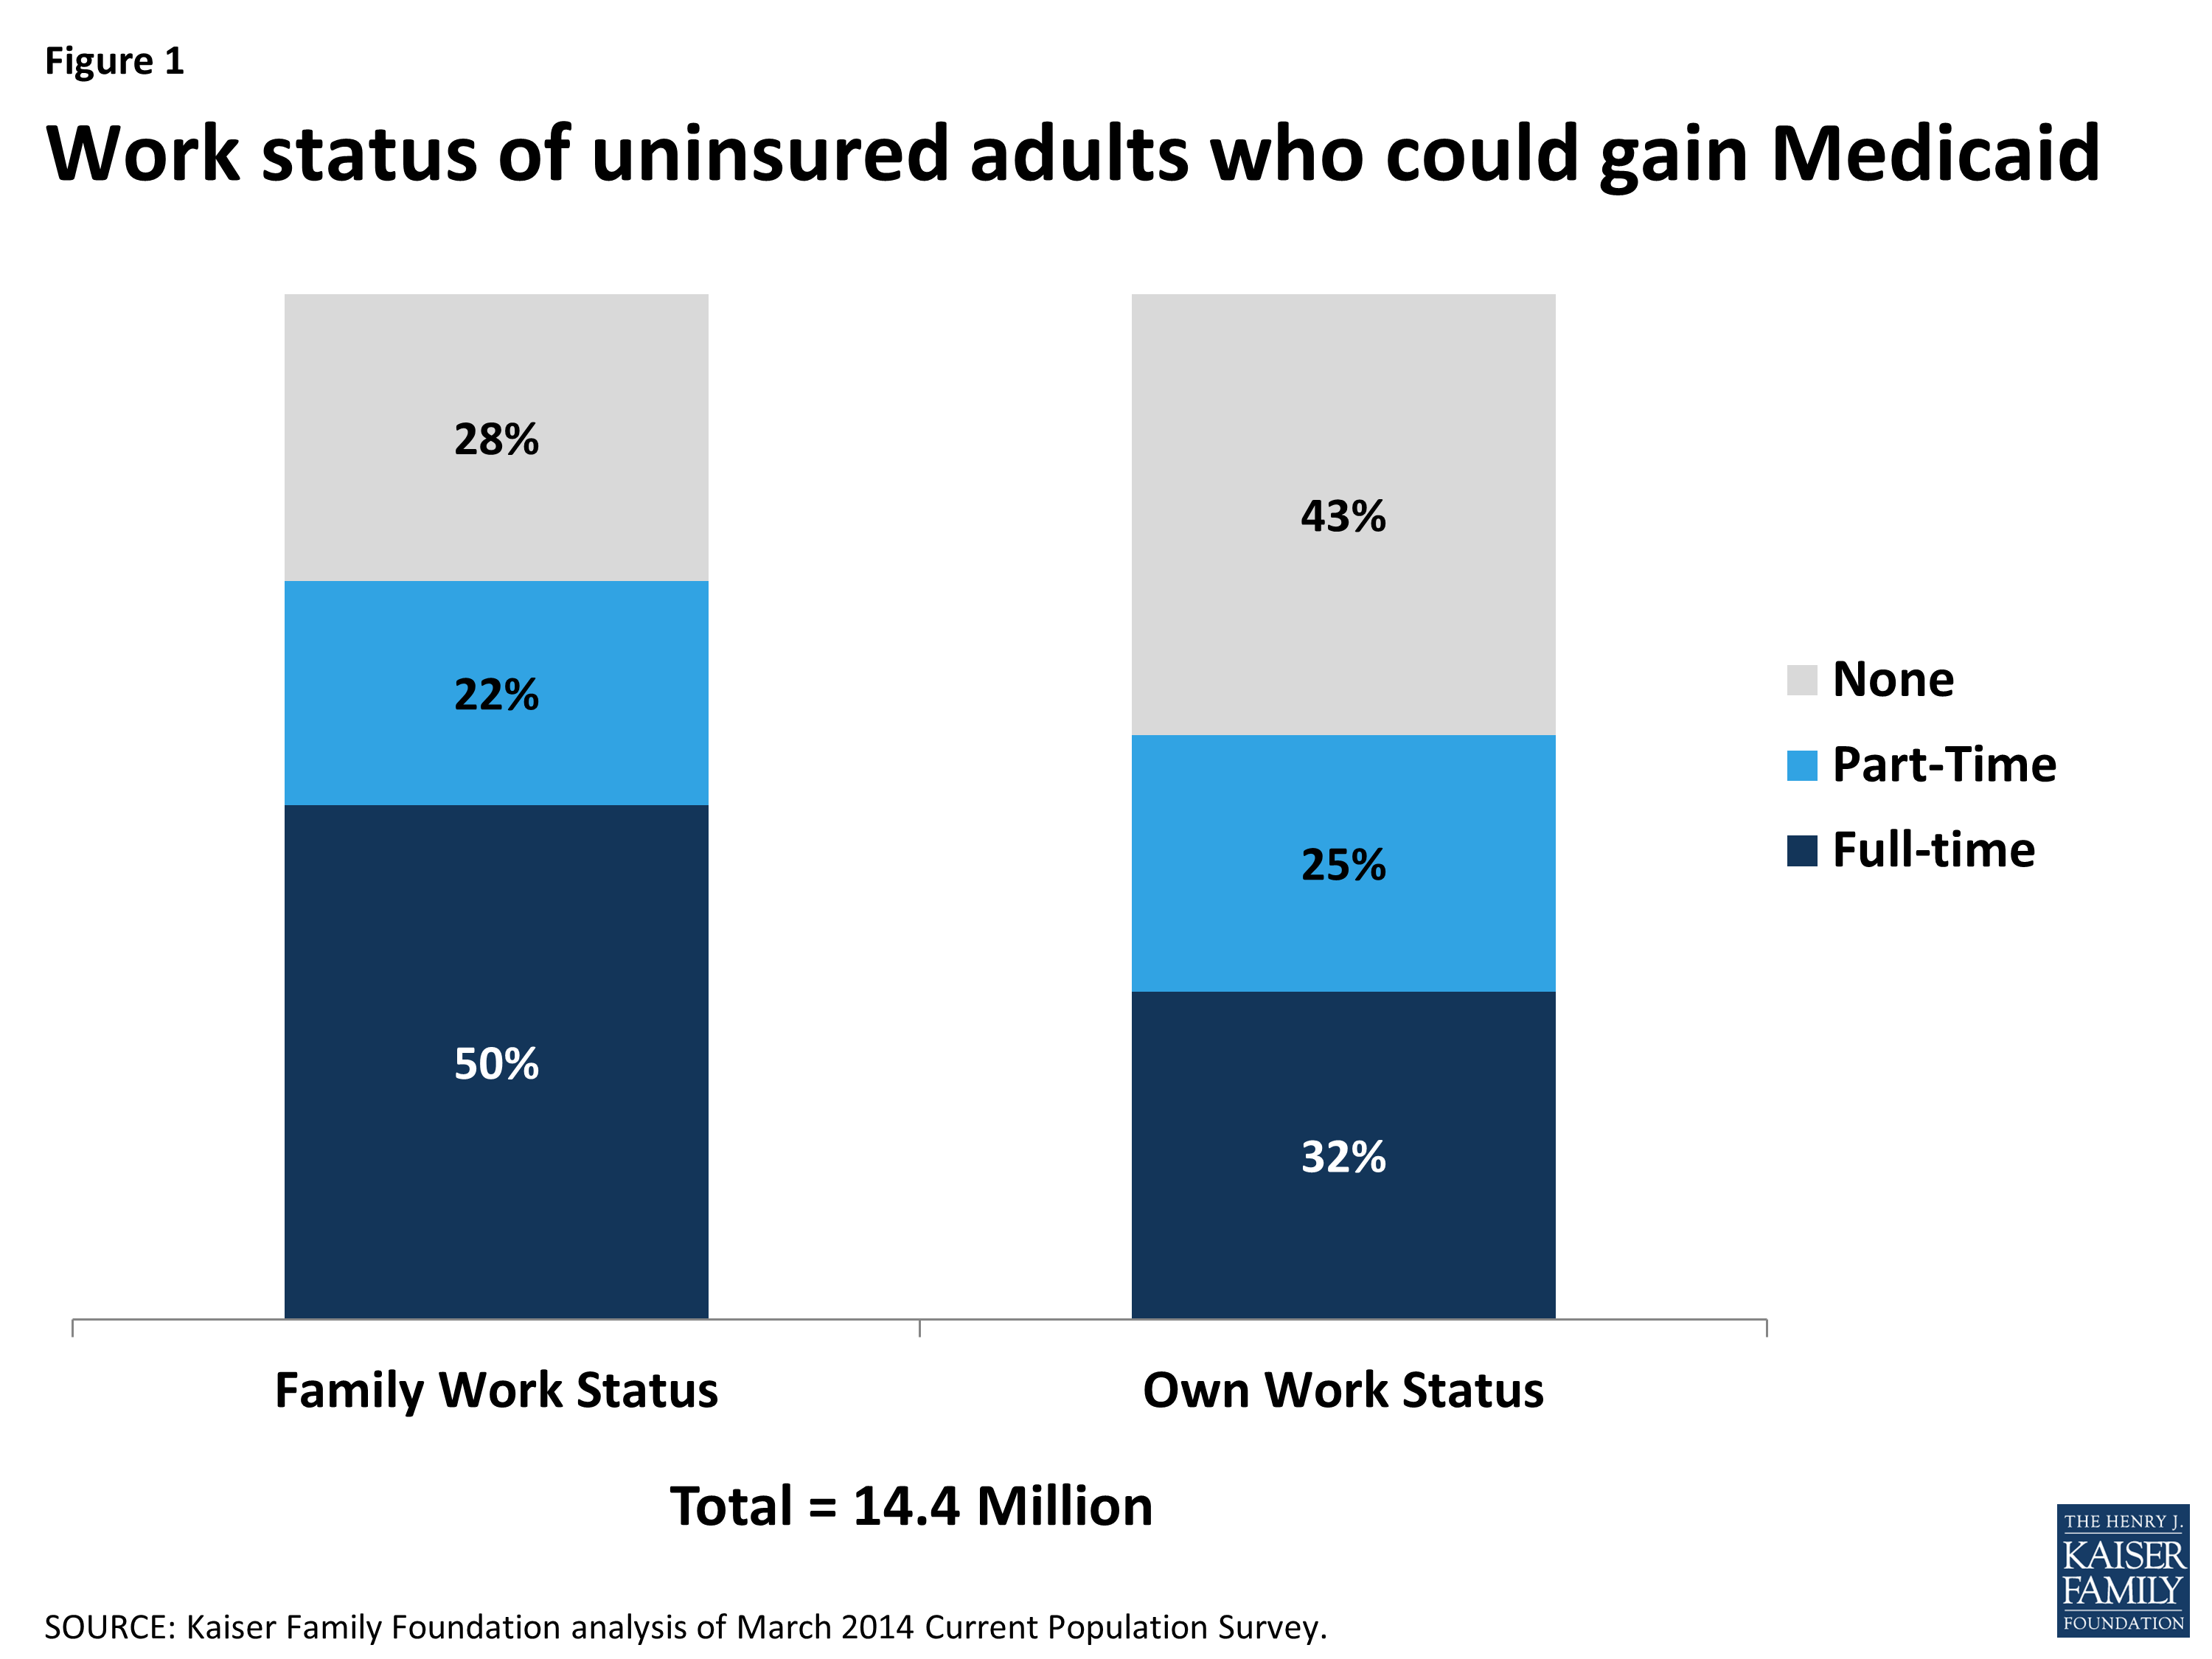
Figure 1: Work status of uninsured adults who could gain Medicaid
Most working uninsured adults who would be eligible for Medicaid are employed by small firms or in industries with low ESI offer rates. Most uninsured adults who would be eligible for the Medicaid expansion work in firms and industries that often have limited employer-based coverage options. The majority of workers in this group (52%) work for small firms with less than 50 employees that will not be subject to ACA penalties for not offering coverage (Figure 2). Further, many firms do not offer coverage to part-time workers. A majority of workers targeted for the Medicaid expansion also work in industries with historically low insurance rates, such as the agriculture and service industries. Since the Medicaid expansion was designed to reach low-income adults left out of the employer-based system, it is not surprising that among those who work, most are unlikely to have access to health coverage through a job.
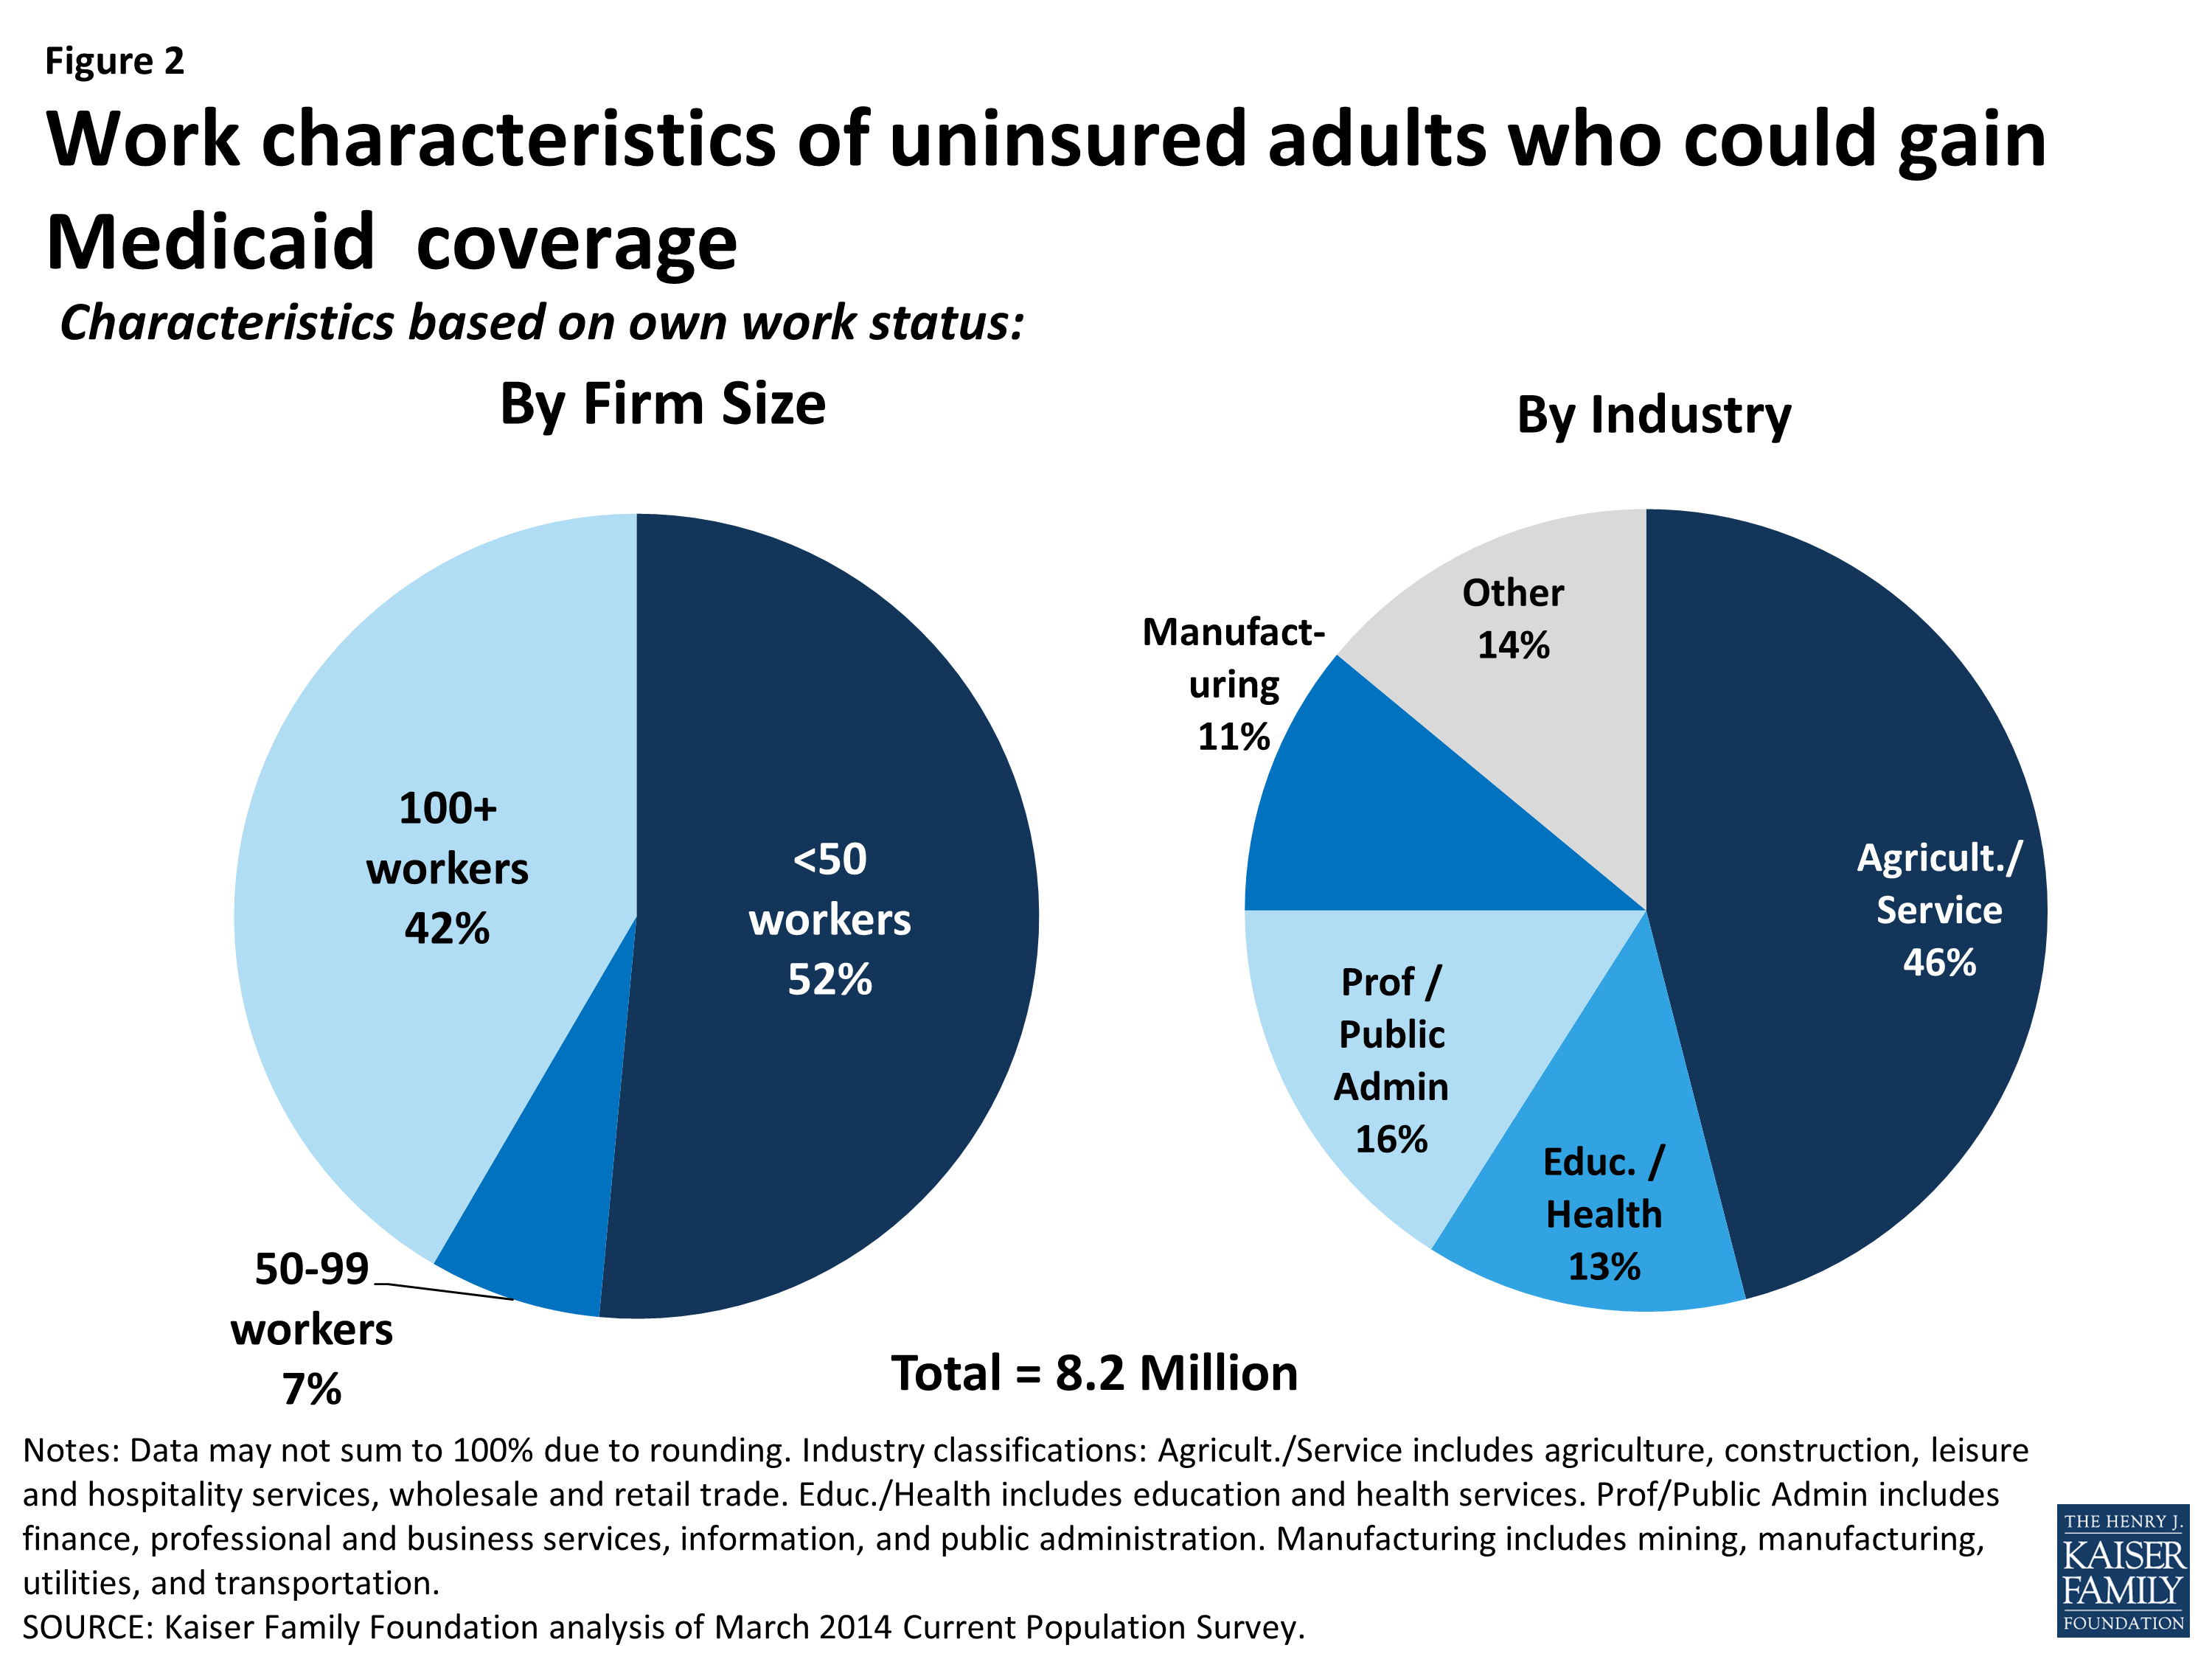
Figure 2: Work characteristics of uninsured adults who could gain Medicaid coverage
Of the uninsured who could gain Medicaid coverage who were not working, most report major impediments in their ability to work. Nearly one in three (29%) reported that they were taking care of home or family; 20% reported they were looking for work; 18% were in school; 17% were ill or disabled; 10% were retired, and 6% had another reason. This is consistent with data that show that fewer women compared to men (53% compared to 60%) and fewer of those in the 46-64 age range compared to younger adults (47% compared to 62% ages 26-45 and 60% ages 19-25) are working. Women are more likely than men to care for family and older adults are more likely to have health reasons that would make it difficult to work. (Figure 3)

Figure 3: Main reasons for not working among uninsured adults who could gain Medicaid coverage
In negotiations over the Medicaid expansion, a few states have been interested in using waiver authority to tie Medicaid eligibility to programs. Federal law does not allow for work requirements in Medicaid, and HHS has stated that waivers that condition Medicaid eligibility on work would not be approved because they do not further the purposes of the program, which are to provide health coverage. However, proposals that include a referral to work programs (without a condition of Medicaid eligibility) could be approved. New Hampshire has proposed a work referral program and other states like Indiana and Utah are considering state-run work search and training programs that are separate from the Medicaid expansion. Data show that most uninsured who could gain coverage are working or in a family with a worker. Medicaid offers a source of coverage to fill in the gaps faced by low-income workers in low-wage jobs where affordable coverage in the workplace is out of reach and for many who face impediments to work.
| Table 1: Uninsured Nonelderly Adults Who Could Gain Medicaid Coverage | |||||||
| All | Exapansion States | Non-Expansion States | |||||
| Overall weighted N | 14,442,754 | 7,194,309 | 7,248,446 | ||||
| Family Work Status | |||||||
| Multiple full-time workers in family | 1,640,583 | 11% | 33,142 | 12% | 807,441 | 11% | |
| One full-time worker in family | 5,607,318 | 39% | 2,671,425 | 37% | 2,935,893 | 41% | |
| Only part-time workers in family | 3,152,435 | 22% | 1,697,283 | 24% | 1,455,152 | 20% | |
| No workers in family | 4,042,418 | 28% | 1,992,458 | 28% | 2,049,960 | 28% | |
| Gender | |||||||
| Male | 7,255,044 | 50% | 3,743,080 | 52% | 3,511,964 | 48% | |
| Female | 7,187,710 | 50% | 3,451,228 | 48% | 3,736,482 | 52% | |
| Age | |||||||
| 19-25 | 3,509,957 | 24% | 1,664,956 | 23% | 1,845,001 | 25% | |
| 26-45 | 6,256,073 | 43% | 3,140,116 | 44% | 3,115,957 | 43% | |
| 46-64 | 4,676,724 | 32% | 2,389,237 | 33% | 2,287,488 | 32% | |
| Own Work Status – Not Working All Last Year | 6,266,796 | 43% | 3,148,695 | 44% | 3,118,101 | 43% | |
| Gender | |||||||
| Male | 2,894,012 | 46% | 1,523,602 | 48% | 1,370,410 | 44% | |
| Female | 3,372,784 | 54% | 1,625,093 | 52% | 1,747,691 | 56% | |
| Age | |||||||
| 19-25 | 1,404,817 | 22% | 631,705 | 20% | 773,113 | 25% | |
| 26-45 | 2,394,229 | 38% | 1,229,340 | 39% | 1,164,889 | 37% | |
| 46-64 | 2,467,749 | 39% | 1,287,650 | 41% | 1,180,100 | 38% | |
| Main reason you did not work last year? | |||||||
| Ill or disabled | 1,047,296 | 17% | 470,778 | 15% | 576,518 | 18% | |
| Retired | 648,434 | 10% | 357,884 | 11% | 290,550 | 9% | |
| Taking care of home or family | 1,838,079 | 29% | 877,212 | 28% | 960,867 | 31% | |
| Going to school | 1,123,197 | 18% | 556,228 | 18% | 566,970 | 18% | |
| Could not find work | 1,249,918 | 20% | 693,972 | 22% | 555,946 | 18% | |
| Other | 359,872 | 6% | 192,622 | 6% | 167,250 | 5% | |
| Own Work Status – Working Anytime Last Year | 8,175,958 | 57% | 4,045,614 | 56% | 4,130,345 | 57% | |
| Full-Time or Part-Time Status | |||||||
| Full-time | 4,615,103 | 56% | 2,149,396 | 53% | 2,465,708 | 60% | |
| Part-time | 3,560,855 | 44% | 1,896,218 | 47% | 1,664,637 | 40% | |
| Firm size | |||||||
| <50 workers | 4,219,835 | 52% | 2,075,003 | 51% | 2,144,832 | 52% | |
| 50-99 workers | 545,877 | 7% | 279,391 | 7% | 266,486 | 6% | |
| 100+ workers | 3,410,246 | 42% | 1,691,219 | 42% | 1,719,027 | 42% | |
| Gender | |||||||
| Male | 4,361,032 | 53% | 2,219,478 | 55% | 2,141,554 | 52% | |
| Female | 3,814,926 | 47% | 1,826,136 | 45% | 1,988,790 | 48% | |
| Age | |||||||
| 19-25 | 2,105,140 | 26% | 1,033,251 | 26% | 1,071,889 | 26% | |
| 26-45 | 3,861,843 | 47% | 1,910,776 | 47% | 1,951,068 | 47% | |
| 46-64 | 2,208,975 | 27% | 1,101,587 | 27% | 1,107,388 | 27% | |
| Industry | |||||||
| Agriculture / Service | 3,778,333 | 46% | 1,749,997 | 43% | 2,028,336 | 49% | |
| Professional / Public Administration | 1,329,765 | 16% | 679,514 | 17% | 650,251 | 16% | |
| Education / Health Services | 1,053,044 | 13% | 557,305 | 14% | 495,740 | 12% | |
| Manufacturing | 869,977 | 11% | 448,386 | 11% | 421,591 | 10% | |
| Other | 1,144,838 | 14% | 610,412 | 15% | 534,426 | 13% | |
| NOTE: Industry classifications: Agriculture/Service includes agriculture, construction, leisure and hospitality services, wholesale and retail trade. Education/Health Services includes education and health services. Professional/Public Administration includes finance, professional and business services, information, and public administration. Manufacturing includes mining, manufacturing, utilities, and transportation. SOURCE: Kaiser Family Foundation analysis of March 2014 Current Population Survey |
|||||||
